
Abstract
During mammalian embryogenesis, hematopoietic stem and progenitor cells (HSPCs) originate from mesoderm-derived endothelial cells in the aorta-gonad-mesonephros (AGM) region and placenta (PL). Later, HSPCs expand in fetal liver (FL) and migrate to bone marrow (BM) shortly before birth. Understanding global transcriptional regulation governing HSPC emergence from embryonic stem/induced pluripotent stem cells is necessary to devise clinical applications, such as novel transplantation approaches. In this study, to assess transcriptional dynamics during development, we performed cap analysis of gene expression on 10 developmental murine HSPC populations isolated from the AGM region, PL, FL, and BM and identified 15,681 transcripts across HSPC ontogeny. We performed microarray analysis of AGM-derived HSPCs at 9.5 and 10.5 days postcoitum (dpc) and identified 40 differentially expressed genes, 23 confirmed as significantly changed by real-time polymerase chain reaction. We conclude that a transcriptional switch point occurs in HSPC ontogeny between 9.5 and 10.5 dpc in the AGM region.
Introduction
H
In combination with sensitive well-defined assays based on microarray technology, RNA sequencing, and serial analysis of gene expression, researchers previously defined transcriptional control mechanisms regulating transient hematopoietic stem and progenitor cell (HSPC) populations [6,7]. However, difficulty in obtaining sufficient amounts of nucleic acid material for subsequent analysis has limited research progress. In addition, researchers found it challenging to compare lists of differentially regulated genes due to use of different cell populations or HSC classification criteria.
Cap analysis of gene expression (CAGE) sequencing is a method used to identify the 5′ ends of capped RNAs based on cap trapping and hence provides a means to detect likely promoter regions [8]. In this study, as part of the FANTOM5 project [9 –11], we utilized CAGE sequencing to examine primary murine HSPCs derived from 10 spatially or temporally critical locations during HSPC development, including the para-aortic-splanchnopleural (p-Sp) region at 8.5 days postcoitum (dpc); AGM region at 9.5, 10.5, and 11.5 dpc; PL at 11.5 dpc; FL at 12.5, 14.5, and 19.5 dpc; and BM at 2- to 3-month old and at 2-year old.
Genome-wide expression profiles of HSPC samples generated from single-molecule CAGE sequencing [12] revealed 15,681 transcription start sites (TSSs). The 10 groups were clustered as pre-HSPCs, definitive HSPCs, fetal HSPCs, and adult HSPCs, allowing further generation of signature gene lists for each stage. The 15,681 TSSs mapped to 10,385 genes, highlighting an abundance of alternate transcripts and indicating that major changes in the transcriptome occur in the AGM region from 9.5 to 10.5 dpc. Due to the requirement for a large number of embryos for CAGE sequencing, we performed microarray and real-time polymerase chain reaction (PCR) analysis to confirm the CAGE sequencing data. Consistent with the CAGE sequencing, microarray and real-time PCR confirmed that a transcriptional switch point exists in HSPC ontogeny from 9.5 to 10.5 dpc at the AGM region. This work is part of the FANTOM5 project [9
–11]. Data download, genomic tools, and copublished articles are summarized at
Materials and Methods
Animals
ICR and C57BL/6J mice were purchased from Nihon SLC (Hamamatsu, Japan) and Kyudo (Tosu, Japan), respectively. Noon of the day of the plug was defined as 0.5 dpc. Embryos at various developmental stages were dissected in phosphate-buffered saline (PBS) under a stereomicroscope and the number of somite pairs (SP) counted [13,14]. Animals were handled according to Guidelines for Laboratory Animals of Kyushu University. This study was approved by the Animal Care and Use Committee, Kyushu University (Approval ID: A21-068-0).
Cell preparation
The caudal portion of embryos containing the p-Sp/AGM region was used to obtain a single cell suspension. ICR embryos were used at 8.5 dpc, whereas C57BL/6J embryos were used at 9.5, 10.5, and 11.5 dpc. Single cells were prepared from p-Sp/AGM at 8.5 dpc and the AGM region at 9.5, 10.5, and 11.5 dpc by collagenase treatment (Supplementary Data; Supplementary Data are available online at
To obtain FL HSPCs, FL cells from 12.5, 14.5, and 19.5 dpc C57BL/6J embryos were filtered through 40-μm nylon mesh (BD Biosciences) and washed once with PBS. Mononuclear cells were isolated as stated above. Mature blood cells were removed by cell sorting after staining with biotin-conjugated antilineage markers (Supplementary Data).
To obtain adult BM HSPCs, femurs, tibias, and humeri of 2- to 3-month-old and 2-year-old C57BL/6J mice were dissected out. BM cells were harvested by flushing with PBS and passed through 40-μm nylon cell strainers (BD Biosciences). Mononuclear cells were isolated and mature blood cells removed by magnetic-activated cell sorting. Cells were incubated with biotin-conjugated antibody as described above. Cells were then incubated with anti-Biotin MicroBeads (Miltenyi Biotec, Bergisch Gladbach, Germany) and passed through MACS® Separation Columns (Miltenyi Biotec).
Flow cytometry and cell sorting
Antibodies used for cell sorting are shown in Supplementary Data. After gating for propidium iodide–negative (living) cells, mesodermal cells, pre-HSPCs, and HSPCs were isolated from hematopoietic organs using the following protocol. For the 8.5 dpc p-Sp sample, among E-cadherin-negative nonendodermal cells, mesodermal cells expressing Flk-1 (VEGF receptor 2) and c-Kit (stem cell factor receptor) were sorted out. For the 9.5 dpc AGM region sample, cells double positive for CD31 (PECAM-1) and CD34 (mucin-like glycoprotein), which include both HSPCs and vascular endothelial cells, were selected. Among CD31+/CD34+ cells, hematopoietic cells expressing c-Kit were sorted out as pre-HSPCs. For the 10.5 dpc AGM region, cells double positive for CD31 and CD34, which include both HSPCs and vascular endothelial cells, were selected. Among CD31+/CD34+ cells, c-Kit+ hematopoietic cells were sorted.
To remove macrophages among hematopoietic cells, we used glycoprotein F4/80. In addition to the AGM region, PL reportedly generates adult repopulating HSCs. Thus, we collected a sample from PL expressing c-Kit, CD31, and CD34 at 11.5 dpc [15]. For 12.5 dpc FL [16], we sorted HSPCs expressing Sca1 (stem cell antigen 1), c-Kit, and CD45. The common leukocyte marker, CD45, was used as an HSC maturation marker. To remove differentiated cells in 14.5 dpc FL [16], we used Ter119 (erythroid cells), CD45 (leukocytes), CD19 (B-lymphocytes), CD4, CD8 (T-lymphocytes), Gr-1 (granulocytes), and F4/80 (macrophages) markers for cell sorting, and all negative cells were classified as lineage negative (Lin−). Among Lin−/Sca1+ cells, c-Kit+/CD45+ cells were sorted as HSPCs. To examine the effect of aging, BM HSPCs from 2- to 3-month-old or 2-year-old mice were collected by selecting CD34−/Sca1+/c-Kit+ cell populations. Among Lin−/Sca1+ cells in 2- to 3-month-old BM, c-Kit+ cells were sorted out, regardless of CD34 expression.
RNA extraction and CAGE analysis
Total RNA was isolated and treated with DNase I using an RNeasy® Plus Micro Kit (Qiagen, Hilden, Germany) according to the manufacturer's instruction. CAGE analysis was carried out as part of the Functional Annotation of the Mammalian Genome 5 (FANTOM5) project at the RIKEN Omics Science Center in Yokohama, Japan.
For real-time PCR, total RNA was isolated and treated with DNase I using an RNAqueous®-4PCR Kit (Ambion, Inc., Austin, TX), according to manufacturer's instruction. DNase I-treated RNA was quantitated by NanoDrop 2000/2000c (Thermo Scientific, DE). cDNA was prepared using a High Capacity RNA-to-cDNA Kit (Life Technologies, Carlsbad, CA) according to the manufacturer's instruction. Briefly, the cDNA synthesis reaction included random octamers, dNTPs, an RNase inhibitor, MuLV reverse transcriptase, and DNase I-treated RNA. cDNA was synthesized at 37°C for 60 min followed by denaturation at 95°C for 5 min and holding at 4°C until use.
CAGE bioinformatics analysis
TSSs were assigned to known genes by the FANTOM5 consortium. If the CAGE peak was within 500 bases of the 5′ end of a known transcript, it was annotated with the gene name from which that transcript was derived. Enrichment of differentially expressed genes with respect to transcription factor ChIP-seq datasets was calculated using the GSCA tool [17], while functional and pathway enrichment was calculated using Database for Annotation, Visualization and Integrated Discovery (DAVID) [18,19]. ChIP-sequencing data for multiple transcription factors in HSCs and HPLCs were collected from gene expression omnibus [10,20 –22]. Enrichment for known sequence motifs was performed using HOMER [23].
Genome-wide chromatin modifications in murine HSC samples were downloaded from Mouse ENCODE [19], and methylation data were downloaded from Hogart et al. [24]. The seqMINER tool was used to cluster epigenetic marks [18]. P values were calculated using a hypergeometric test. Data analysis was done using a combination of R, Perl, and shell scripts. To provide a snapshot of global transcription (the transcriptome) in HSCs across different times and locations, GEDI (Gene expression dynamics inspector) plots (maps) were generated using GEDI23 software (
Microarray analysis
Microarray analysis of three independent samples each of AGM-derived HSPCs at 9.5 and 10.5 dpc was performed and compared. Total RNA was isolated from sorted hematopoietic cells using an RNAqueous® Total RNA Isolation Kit (Thermo Fisher Scientific, Inc., MA). Total RNA was linearly amplified in two rounds of T7 in vitro transcription to generate antisense amplified RNA (aRNA) using a MessageAmp™ II aRNA Amplification Kit (Thermo Fisher Scientific, Inc., MA) and an Illumina® TotalPrep RNA Amplification Kit (Thermo Fisher Scientific, Inc., MA) according to the manufacturer's instructions. During the second round of amplification, aRNA was labelled with Biotin-16-UTP. aRNA was purified and verified by spectrophotometry. Subsequently, the Illumina Gene Expression system (Illumina, Inc., CA) was used for direct hybridization of labelled aRNA to gene-specific 50-mer oligonucleotide probes attached to microbeads according to the manufacturer's instruction. After hybridization and washing, BeadChips were immobilized with Cy3-streptavidin (GE Healthcare, Buckinghamshire, UK) and scanned using an Illumina BeadArray Reader.
To analyze microarray data and filter criteria, raw signal intensities of six samples were normalized using the quantile algorithm with “lumi” [25] and the “preprocessCore” library package [26] on Bioconductor software [27]. Probes called by the “Detection P value <0.05” flag in at least one sample were selected. Then, Linear Models for Microarray Analysis (limma) package [28] of Bioconductor software were applied. Differentially expressed genes were shown on a heat map generated by MeV software [29]. Hierarchical clustering (HCL) analysis was used to sort genes. Color coding indicated distance from the median of each row. DAVID was used to investigate gene ontology categories enriched for function of differentially expressed genes. Gene encoding factors functioning in transcription, either upregulated or downregulated, were selected and validated by real-time PCR. Primer sets used are shown in Supplementary Table S1.
Real-time PCR analysis
Gene expression levels were measured by real-time PCR using Fast SYBR® Green Master Mix (Life Technologies, Carlsbad, CA) and StepOnePlus™ real-time PCR (Life Technologies, Carlsbad, CA). Forward and reverse primers were designed using Primer Express® version 3 (Applied Biosystems) and are listed in Supplementary Table S1. Primer specificity was assessed in silico using BLAST (Supplementary Table S1). Primer efficiency was calculated from the slope of the calibration curve using fivefold serial dilution of cDNA prepared from whole embryos or whole fetal organ-derived cDNA in real-time PCR. Amplification conditions were an initial denaturation at 95°C for 20 s, followed by 40 cycles of denaturation at 95°C for 3 s, and annealing and extension at 60°C for 30 s.
To ensure specific amplification, melting curve analysis was evaluated in all analyses and in a negative control lacking cDNA template. Melting curve analysis consisted of denaturation at 95°C for 15 s and annealing at 60°C for 1 min/cycle, and annealing temperature was increased 0.3°C/cycle until 95°C. All analyses were performed in triplicate wells; mRNA levels were normalized to Actb mRNA, and the relative quantity of expression was calculated by delta delta Ct method and compared with a reference sample. Differences were statistically evaluated using Student's t-test. P values less than 0.05 indicated a statistically significant difference.
Results
Collection of HSPC samples from murine tissues at different developmental stages
To characterize changes in the HSPC transcriptome during hematopoietic development, we collected 10 samples from diverse murine organs at selected developmental time points (Fig. 1A). Relevant to marker analysis, E-cadherin− Flk-1+ cells represent mesodermal cells [30], and c-Kit marks intra-aortic clusters of the AGM region [13,31]. Hematopoietic multipotent progenitors in the p-Sp region at 8.0 dpc [32] and Flk-1+ c-Kit+ cells have been observed at p-Sp/AGM region at 9.5 dpc [33]. Therefore, we collected E-cadherin−/Flk-1+/c-Kit+ mesodermal cells, the ancestors of hematopoietic cells, from the caudal region (p-Sp) of 8.5 dpc embryos. Cells capable of reconstituting neonatal recipients, known as “pre-HSPCs,” have been detected in the p-Sp/AGM region at 9.5 dpc [34,35], while cells present at 10.5–11.5 dpc acquire the capacity to reconstitute adult recipients and are known as “long term-repopulating HSCs” [36 –38]. We obtained both pre-HSPC and HSPC samples from the AGM region by selecting cells expressing the HSPC marker c-Kit and the endothelial markers CD31 and CD34 [39,40].
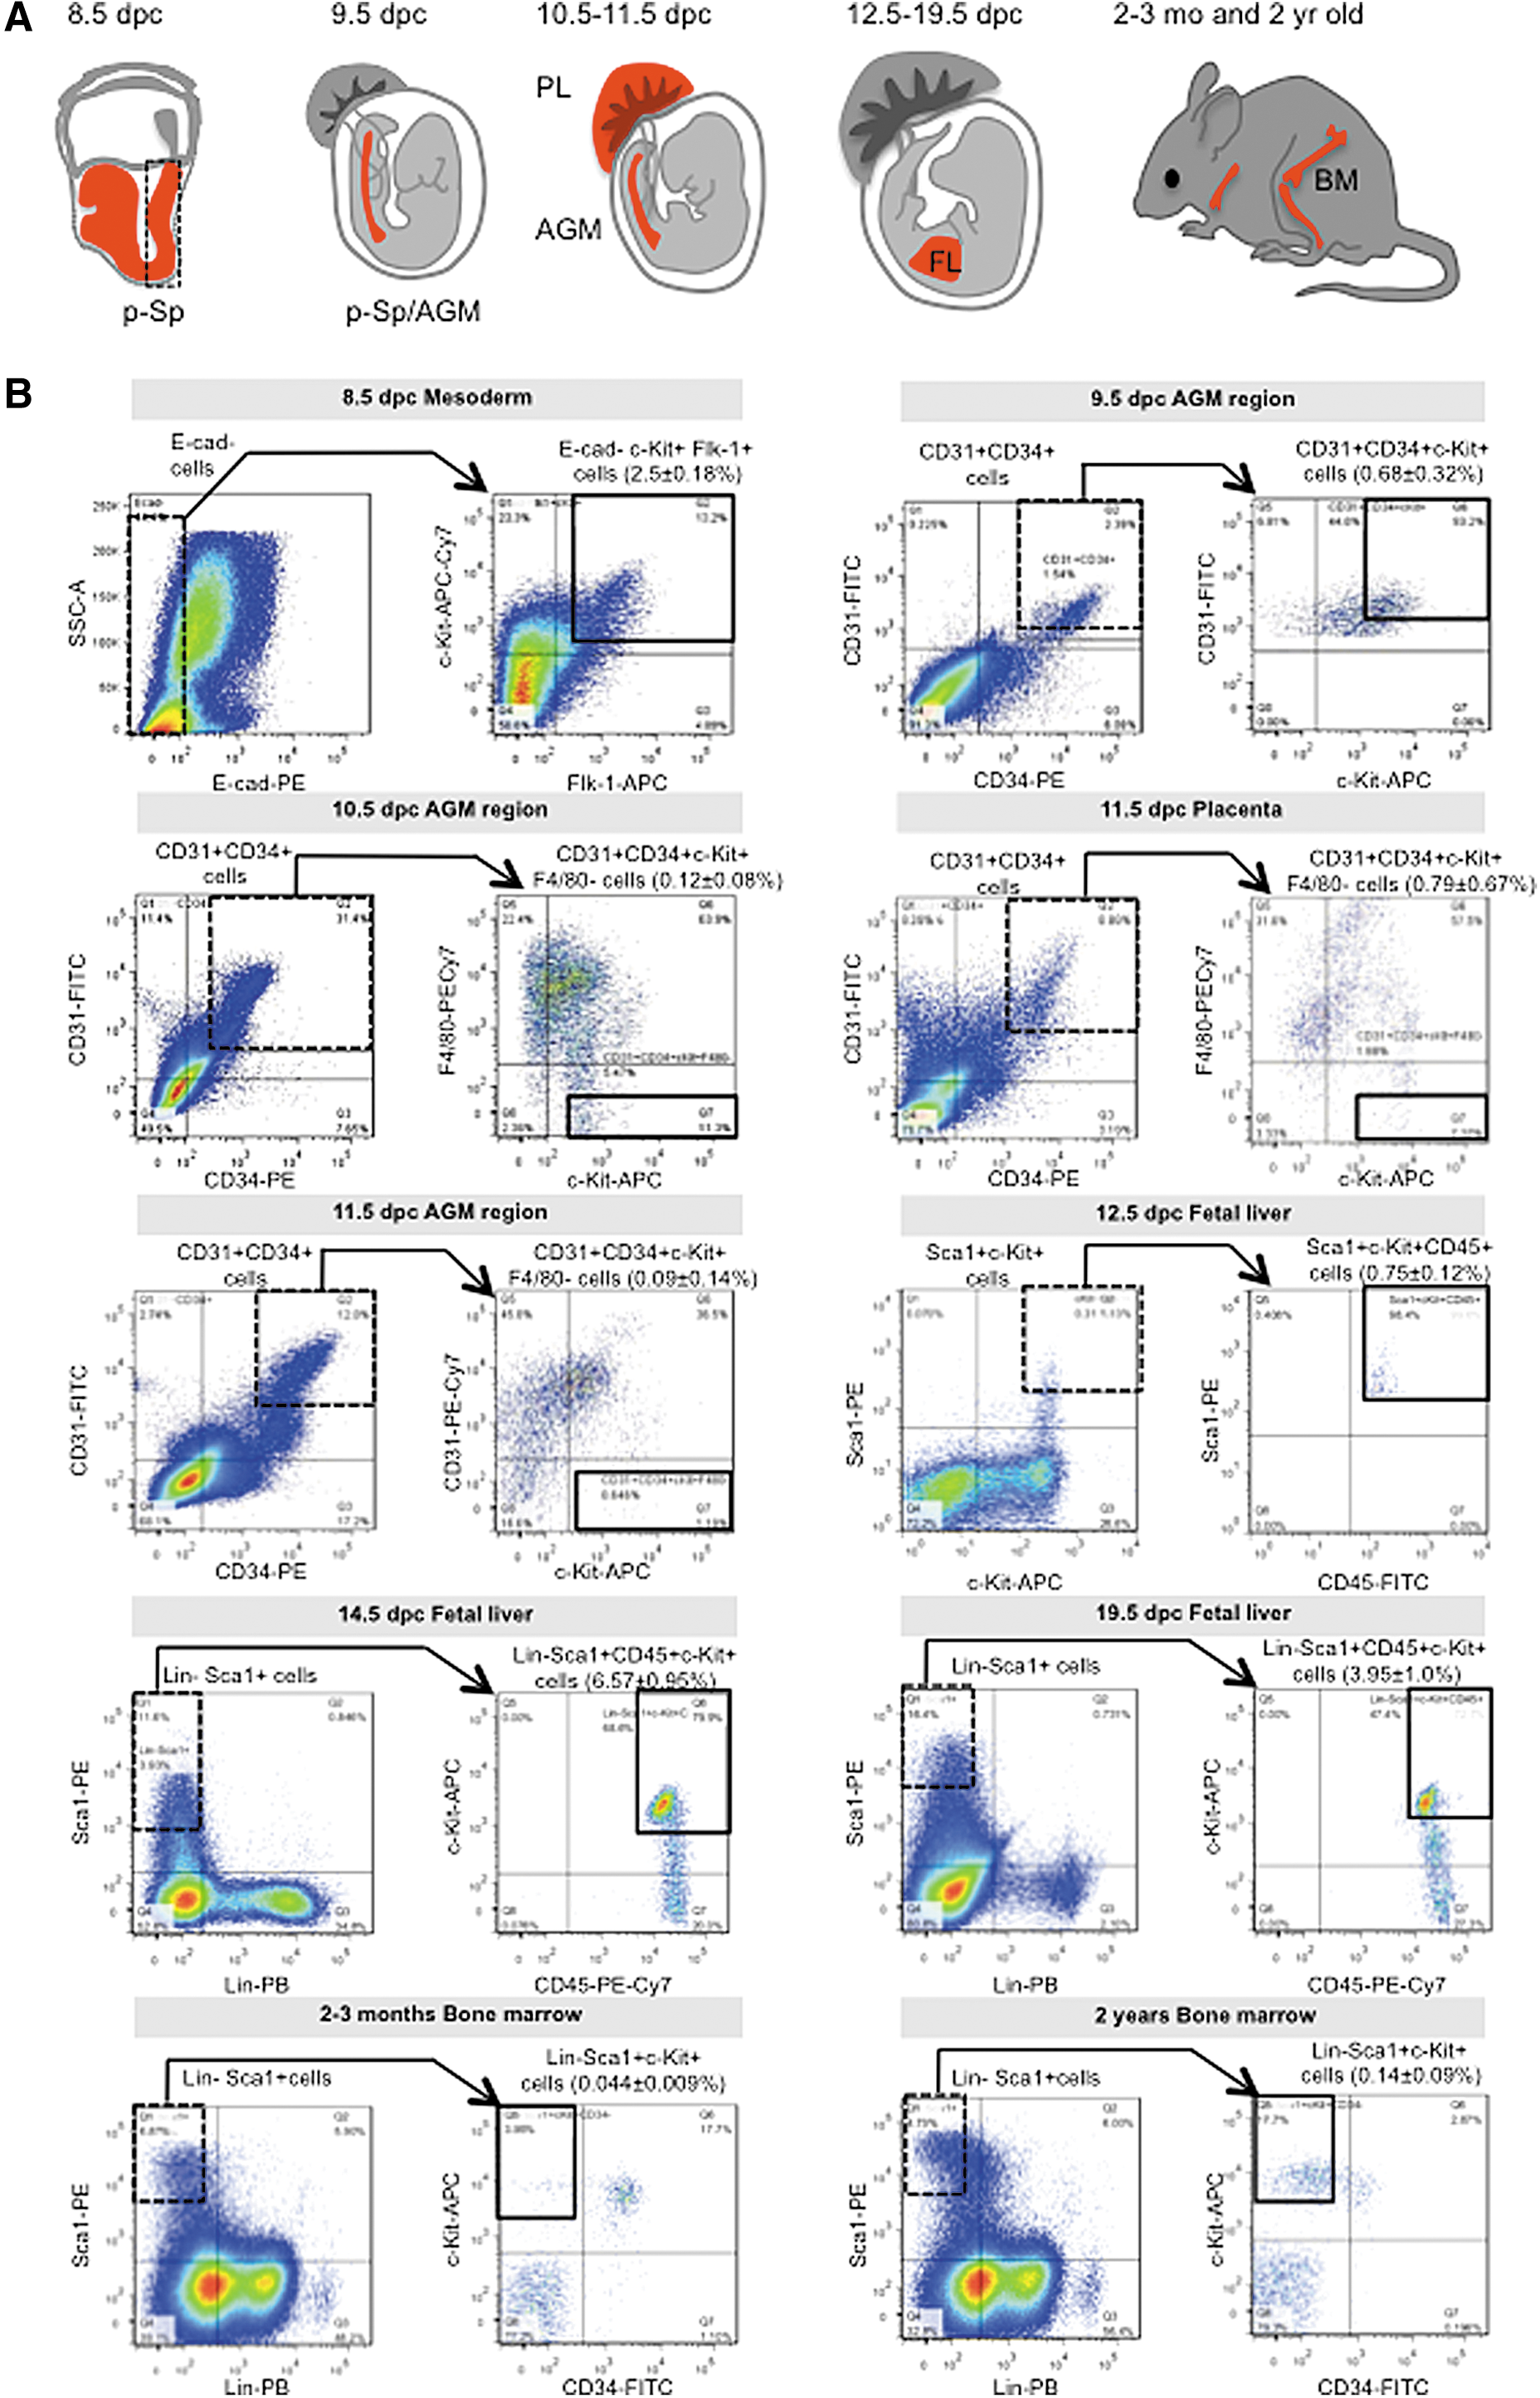
Isolation of HSPCs from mouse embryos and adults.
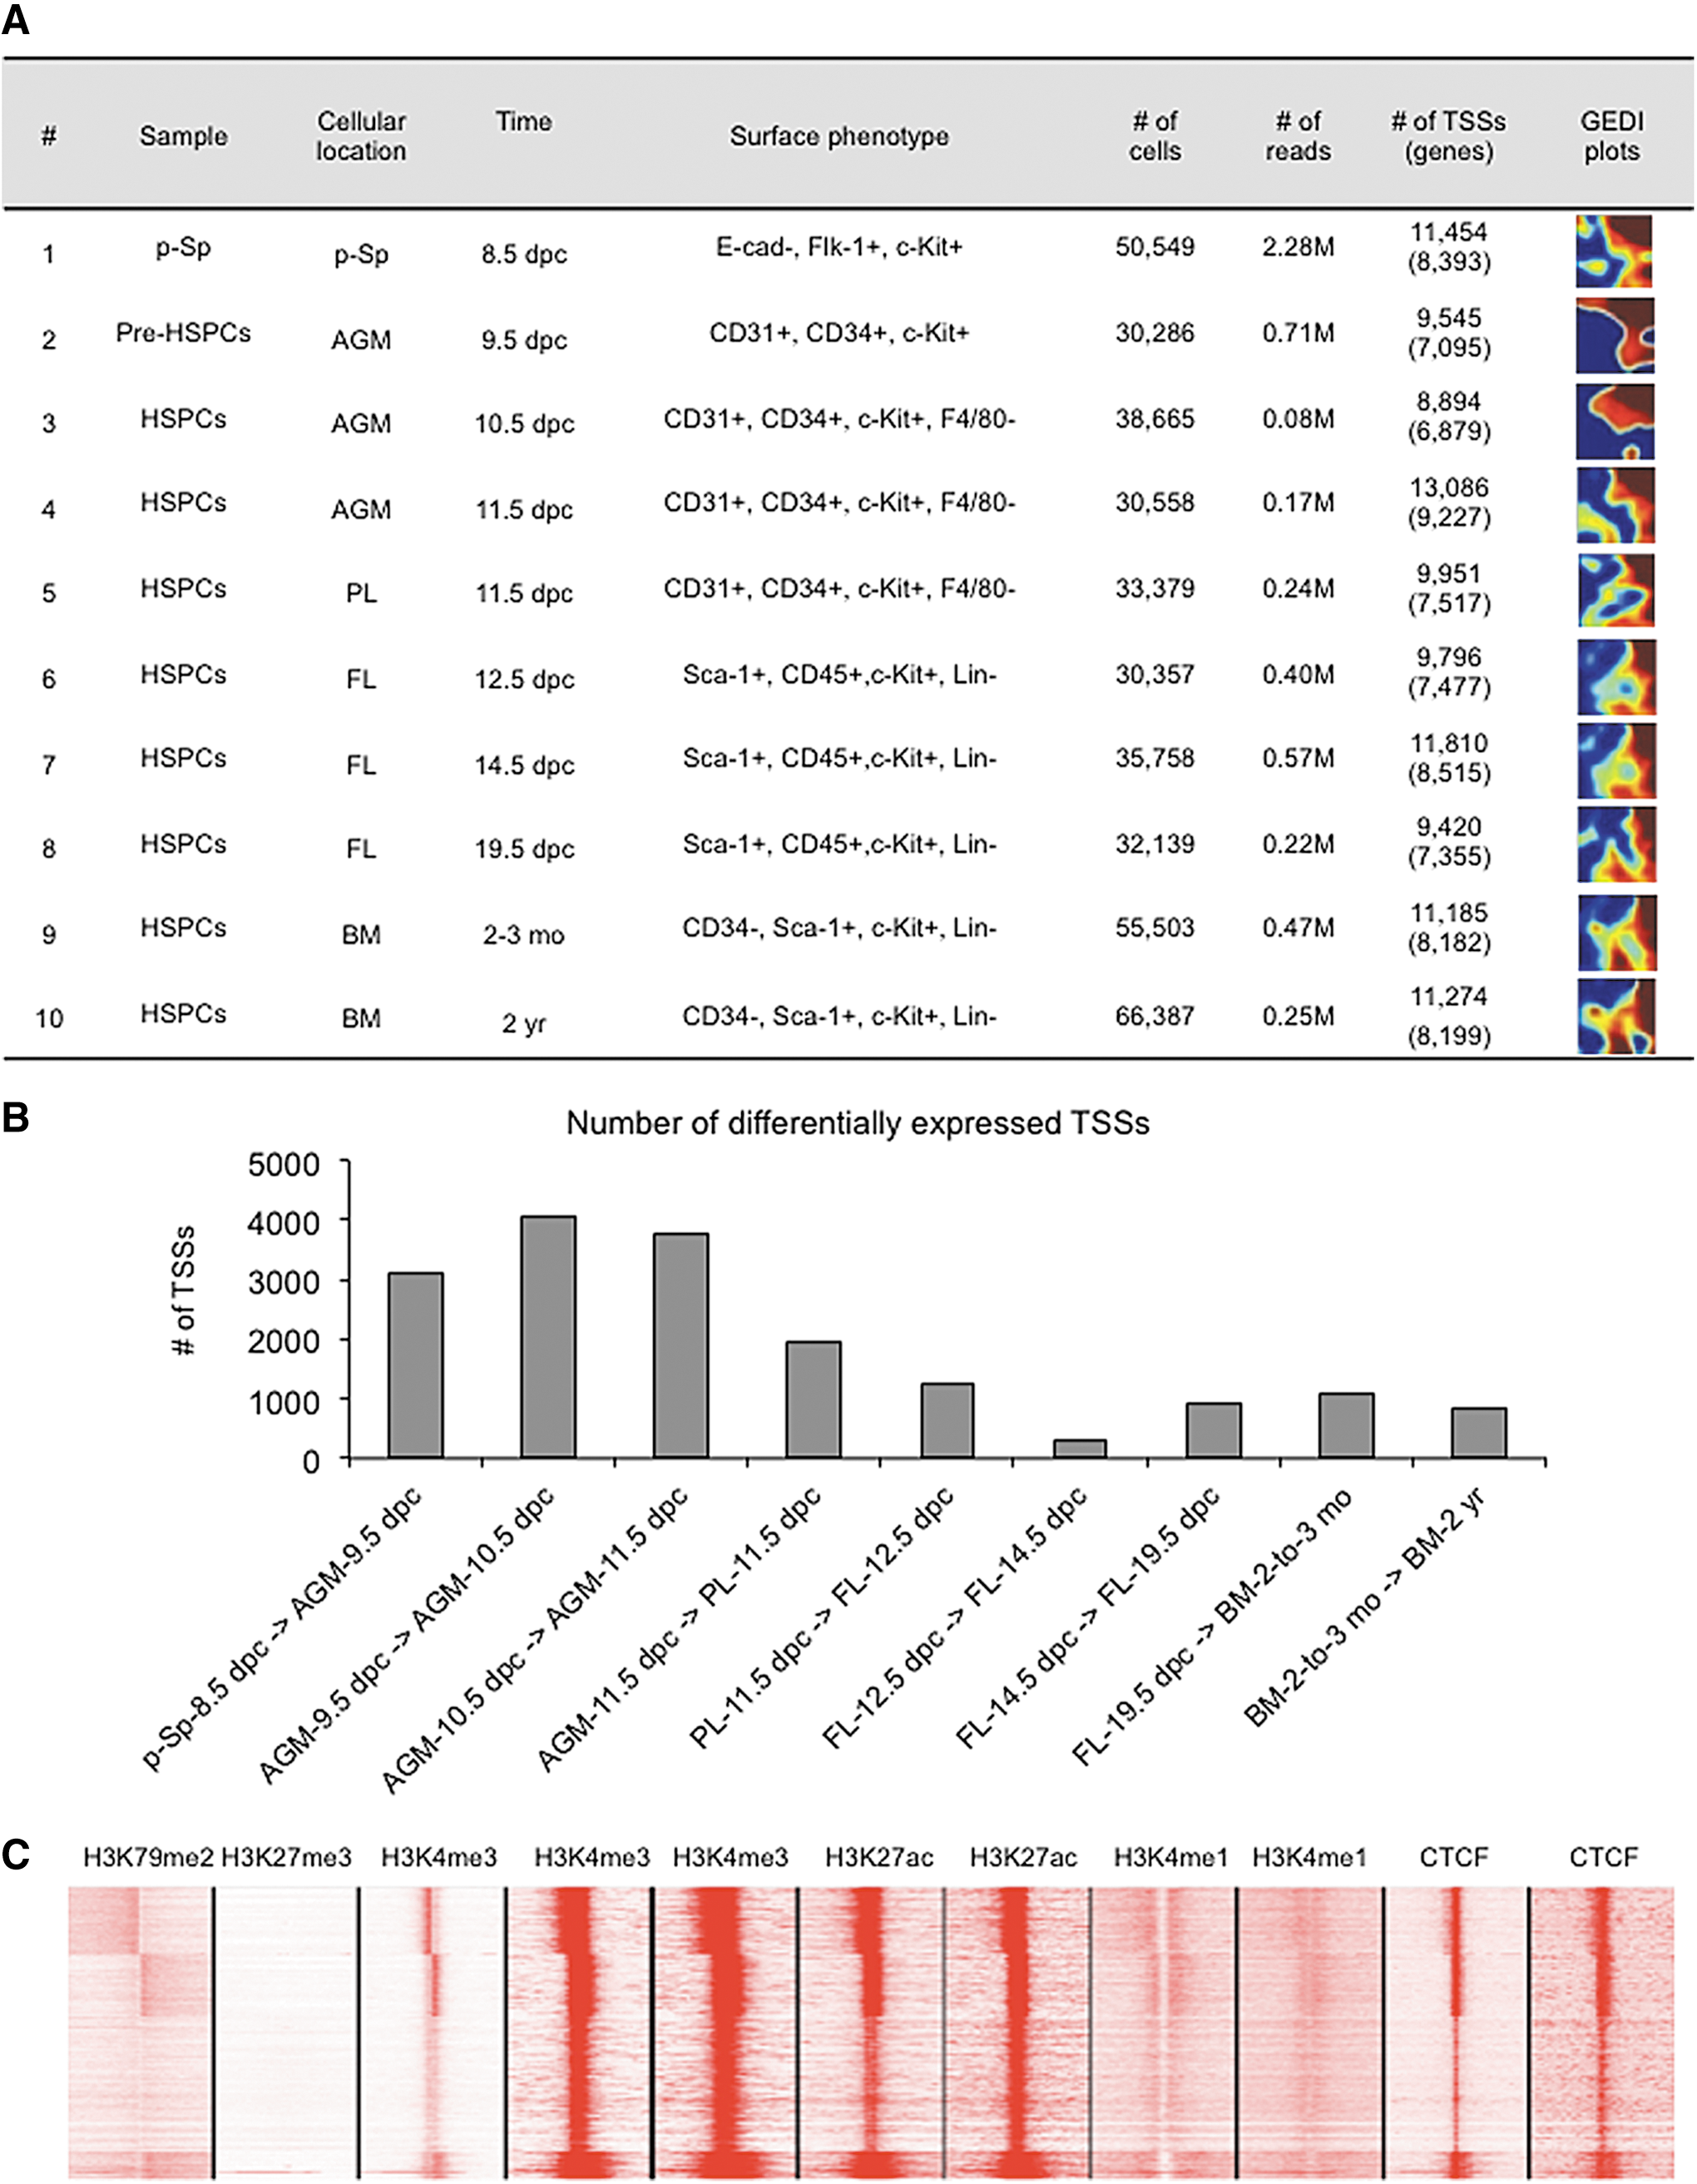
Among the 10 HSPC populations identified, we observed that HSPCs form a very small proportion of cells from a given niche (Fig. 1B). For the 8.5 dpc p-Sp sample, E-cadherin−/Flk-1+/c-Kit+ cells represented 2.5% ± 0.18% of the population; for the 9.5 dpc AGM region, CD31+/CD34+/c-Kit+ cells represented 0.68% ± 0.32%; and for 10.5 and 11.5 dpc AGM samples, CD31+/CD34+/c-Kit+/F4/80− cells represented 0.12% ± 0.08% and 0.09% ± 0.14%, respectively. For 11.5 dpc PL, CD31+/CD34+/c-Kit+/F4/80− cells represented 0.79% ± 0.67%; for 12.5 dpc FL, Sca-1+/c-Kit+/CD45+ cells represented 0.75% ± 0.12%; and for 14.5 and 19.5 dpc FL, Lin−/Sca-1+/c-Kit+/CD45+ cells represented 6.57% ± 0.95% and 3.95% ± 1.0%, respectively. Finally, for 2- to 3-month-old and 2-year-old BM, Lin−/Sca-1+/c-Kit+ cells represented 0.044% ± 0.009% and 0.14% ± 0.09%, respectively. Surface markers used to sort each sample are shown in Fig. 2A.
CAGE analysis over HSPC development.
CAGE profiling of murine HSPCs identifies stage-specific transcripts
To study genome-wide transcriptional dynamics during HSPC development, we performed single molecule CAGE [12] sequencing of the 10 samples identified. The rarity of HSPCs during early development represents a challenge requiring collection of large numbers of mouse embryos. Thus, we opted not to generate replicates for each population. By generating ∼250,000 reads per sample, we identified a total of 15,681 distinct TSSs, which were detected (≥10 tags per million) in at least one of 10 samples, with an average of 8,037 TSSs per sample. We then used GEDI plots [41] to provide a global gene expression overview of each sample. GEDI plot analysis revealed a distinct transcriptome signature in each of the 10 samples (Fig. 2A). More than 3,000 TSSs showed at least a twofold difference in expression among p-Sp-8.5 dpc-derived mesoderm, AGM-9.5 dpc-derived pre-HSPCs, and AGM-10.5 dpc-derived HSPC samples, whereas ∼1,000 TSSs were differentially expressed in HSPCs derived from AGM-11.5 dpc, PL-11.5 dpc, FL-12.5 dpc, FL-14.5 dpc, FL-19.5 dpc, 2- to 3-month-old BM, and 2-year-old BM (Fig. 2B). These observations suggest that major transcriptional changes likely occur in the AGM region between 9.5 and 10.5 dpc.
Of TSSs, 15,681 were within 500 bases of a known transcript and were thus annotated with the corresponding gene symbol (representing 10,385 separate genes). The remaining 1,681 TSSs were unannotated and may represent novel HSPC-specific transcripts. The ratio of TSSs to genes was greater for transcription factors (TFs), with 1,518 TSSs mapping to 880 TFs (ratio 1.7 compared to 1.5 for all genes), suggesting that alternate transcription of TFs contributes to the regulatory complexity of the mammalian genome [42].
To validate this data using an independent source, we collected ChIP sequencing data for five chromatin modifications (H3K27me3, H3K4me3, H3K4me1, H3K79me2, and H3K27Ac) and for CTCF (CCCTC-binding factor) binding in murine HSCs derived from BM [43]. Over the 15,681 TSSs flanking known transcripts, H3K4me3 and H3K79me2 (predictors of transcription initiation) were enriched near CAGE peaks, while H3K4me1, an enhancer signature, and H3K27me3, a signature of inactive promoters, were depleted, supporting the idea that our analysis detects active transcription initiation events (Fig. 2C). All TSSs also overlapped with binding of CTCF binding, which reportedly preferentially binds near promoters [44].
Finally, to confirm the identity of each sample, we checked expression profiles of genes encoding HSPC surface markers (Flk-1, c-Kit, CD31, CD34, and Sca-1) and lineage markers (E-cadherin, F4/80, Gr-1, CD4, CD8, Ter119, and CD19) used for cell sorting (Supplementary Fig. S1A). As expected, we detected high Cd34 levels in all samples. Kdr (also known as Flk-1) was detected only in AGM samples and was downregulated in PL, FL, and BM-derived populations. Similarly, Pecam1 (also known as Cd31) was expressed at low levels in non-AGM samples. Conversely, c-Kit, Ly6a (also known as Sca-1), and Ptprc (also known as CD45) were more highly expressed in PL, FL, and BM-derived populations relative to AGM. We also detected low levels of Prom1 (also known as CD133), a marker of some early HSPC populations [45], in mesodermal and pre-HSPC samples.
A transcriptional switch point in HSPC ontogeny occurs in AGM between 9.5 and 10.5 dpc
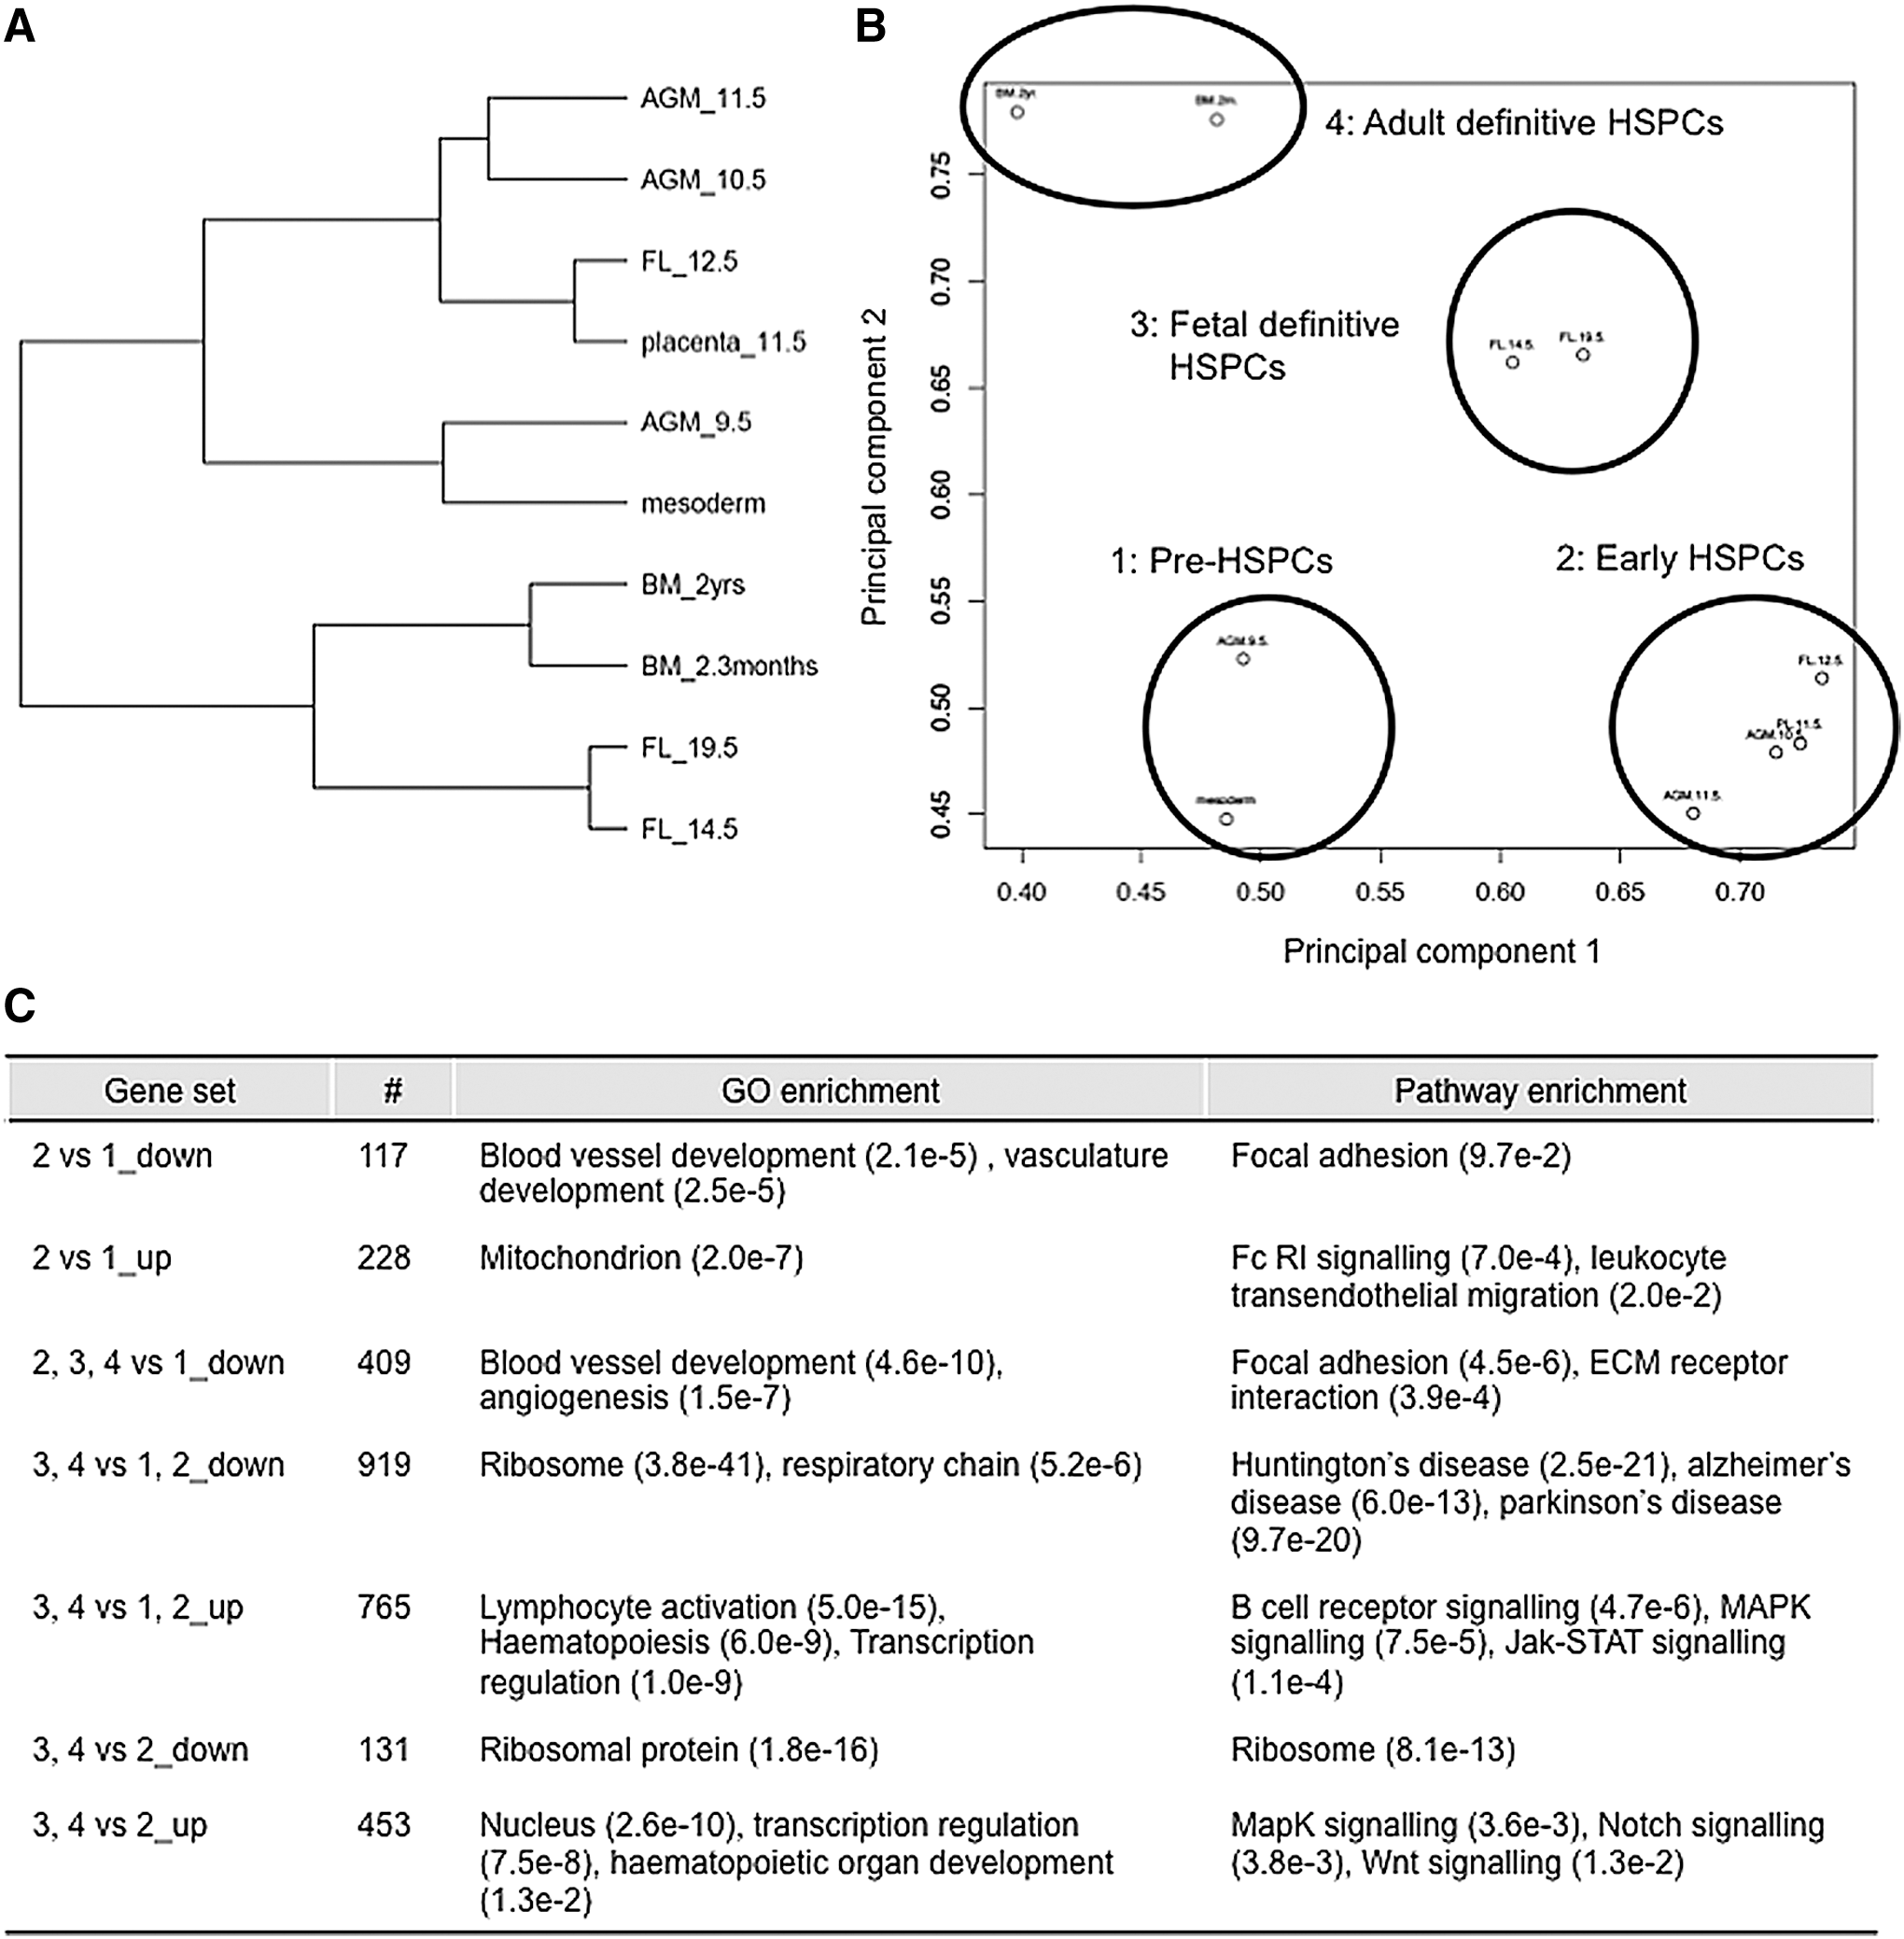
HCL of the 10 HSPC populations assigned them to four clusters: (1) pre-HSPCs (p-Sp/8.5 dpc and AGM/9.5 dpc), (2) early HSPCs (AGM/10.5 dpc, AGM/11.5 dpc, PL/11.5 dpc, and FL/12.5 dpc), (3) fetal definitive HSPCs (FL/14.5 dpc and FL/19.5 dpc), and (4) adult definitive HSPCs (BM in 2- to 3-month-old mice and BM in 2-year-old mice) (Fig. 3A). Principal component analysis of the 10 samples was in agreement with partitioning of populations into four corresponding groups (Fig. 3B). In short, this analysis suggests that HSPCs are committed in group 1; become mature and prepared to move to FL in group 2; proliferate, differentiate into mature hematopoietic cells, and prepare to move to BM in group 3, and settle in BM and become quiescent in group 4.
Identification of gene signatures indicative of HSPC development.
To understand differences between groups, we identified sets of differentially expressed genes and annotated them using functional and pathway enrichment analysis (Fig. 3C). Although 9.5 and 10.5 dpc HSPCs exhibit similar surface markers, they were clustered into pre-HSPCs and early HSPCs, respectively, based on global gene expression patterns. Consistent with this clustering, the transition from endothelial to HSPC phenotype occurs after 9.5 dpc [13]. Therefore, genes related to vascular development are more highly expressed in group 1 (pre-HSPCs) than in group 2 (early HSPCs) (Fig. 3C). In addition, intra-aortic clusters containing embryonic HSPCs in the AGM region at 9.0–10.5 dpc are likely released into circulation to home to FL at 10.5–11.5 dpc based on β1-integrin expression [46,47].
We observed upregulation of gene functioning in transendothelial migration in early rather than pre-HSPCs (Fig. 3C; see“2 versus 1_up”), implying that early HSPCs are prepared to home. Hematopoietic genes were upregulated in HSPCs in groups 2–4, suggesting that group 1 pre-HSPCs are not yet committed to an adult HSPC program. Accordingly, Pecam1 and Cdh5 (also known as VE-cadherin) were downregulated in groups 2, 3, and 4 relative to group 1, whereas Itga2b (also known as CD41) was upregulated in those groups, as expected. Two key regulators, Ccnd1 (cyclin D1) and Twist1, were downregulated in groups 2–4 relative to group 1. Twist1 downregulation suggests that it may act as a master regulator of HSPC generation, while Ccnd1 downregulation suggests that proliferative status of group 1 pre-HSPCs changes as development proceeds (Supplementary Fig. S1B).
Identification of TFs regulating HSPC ontogeny
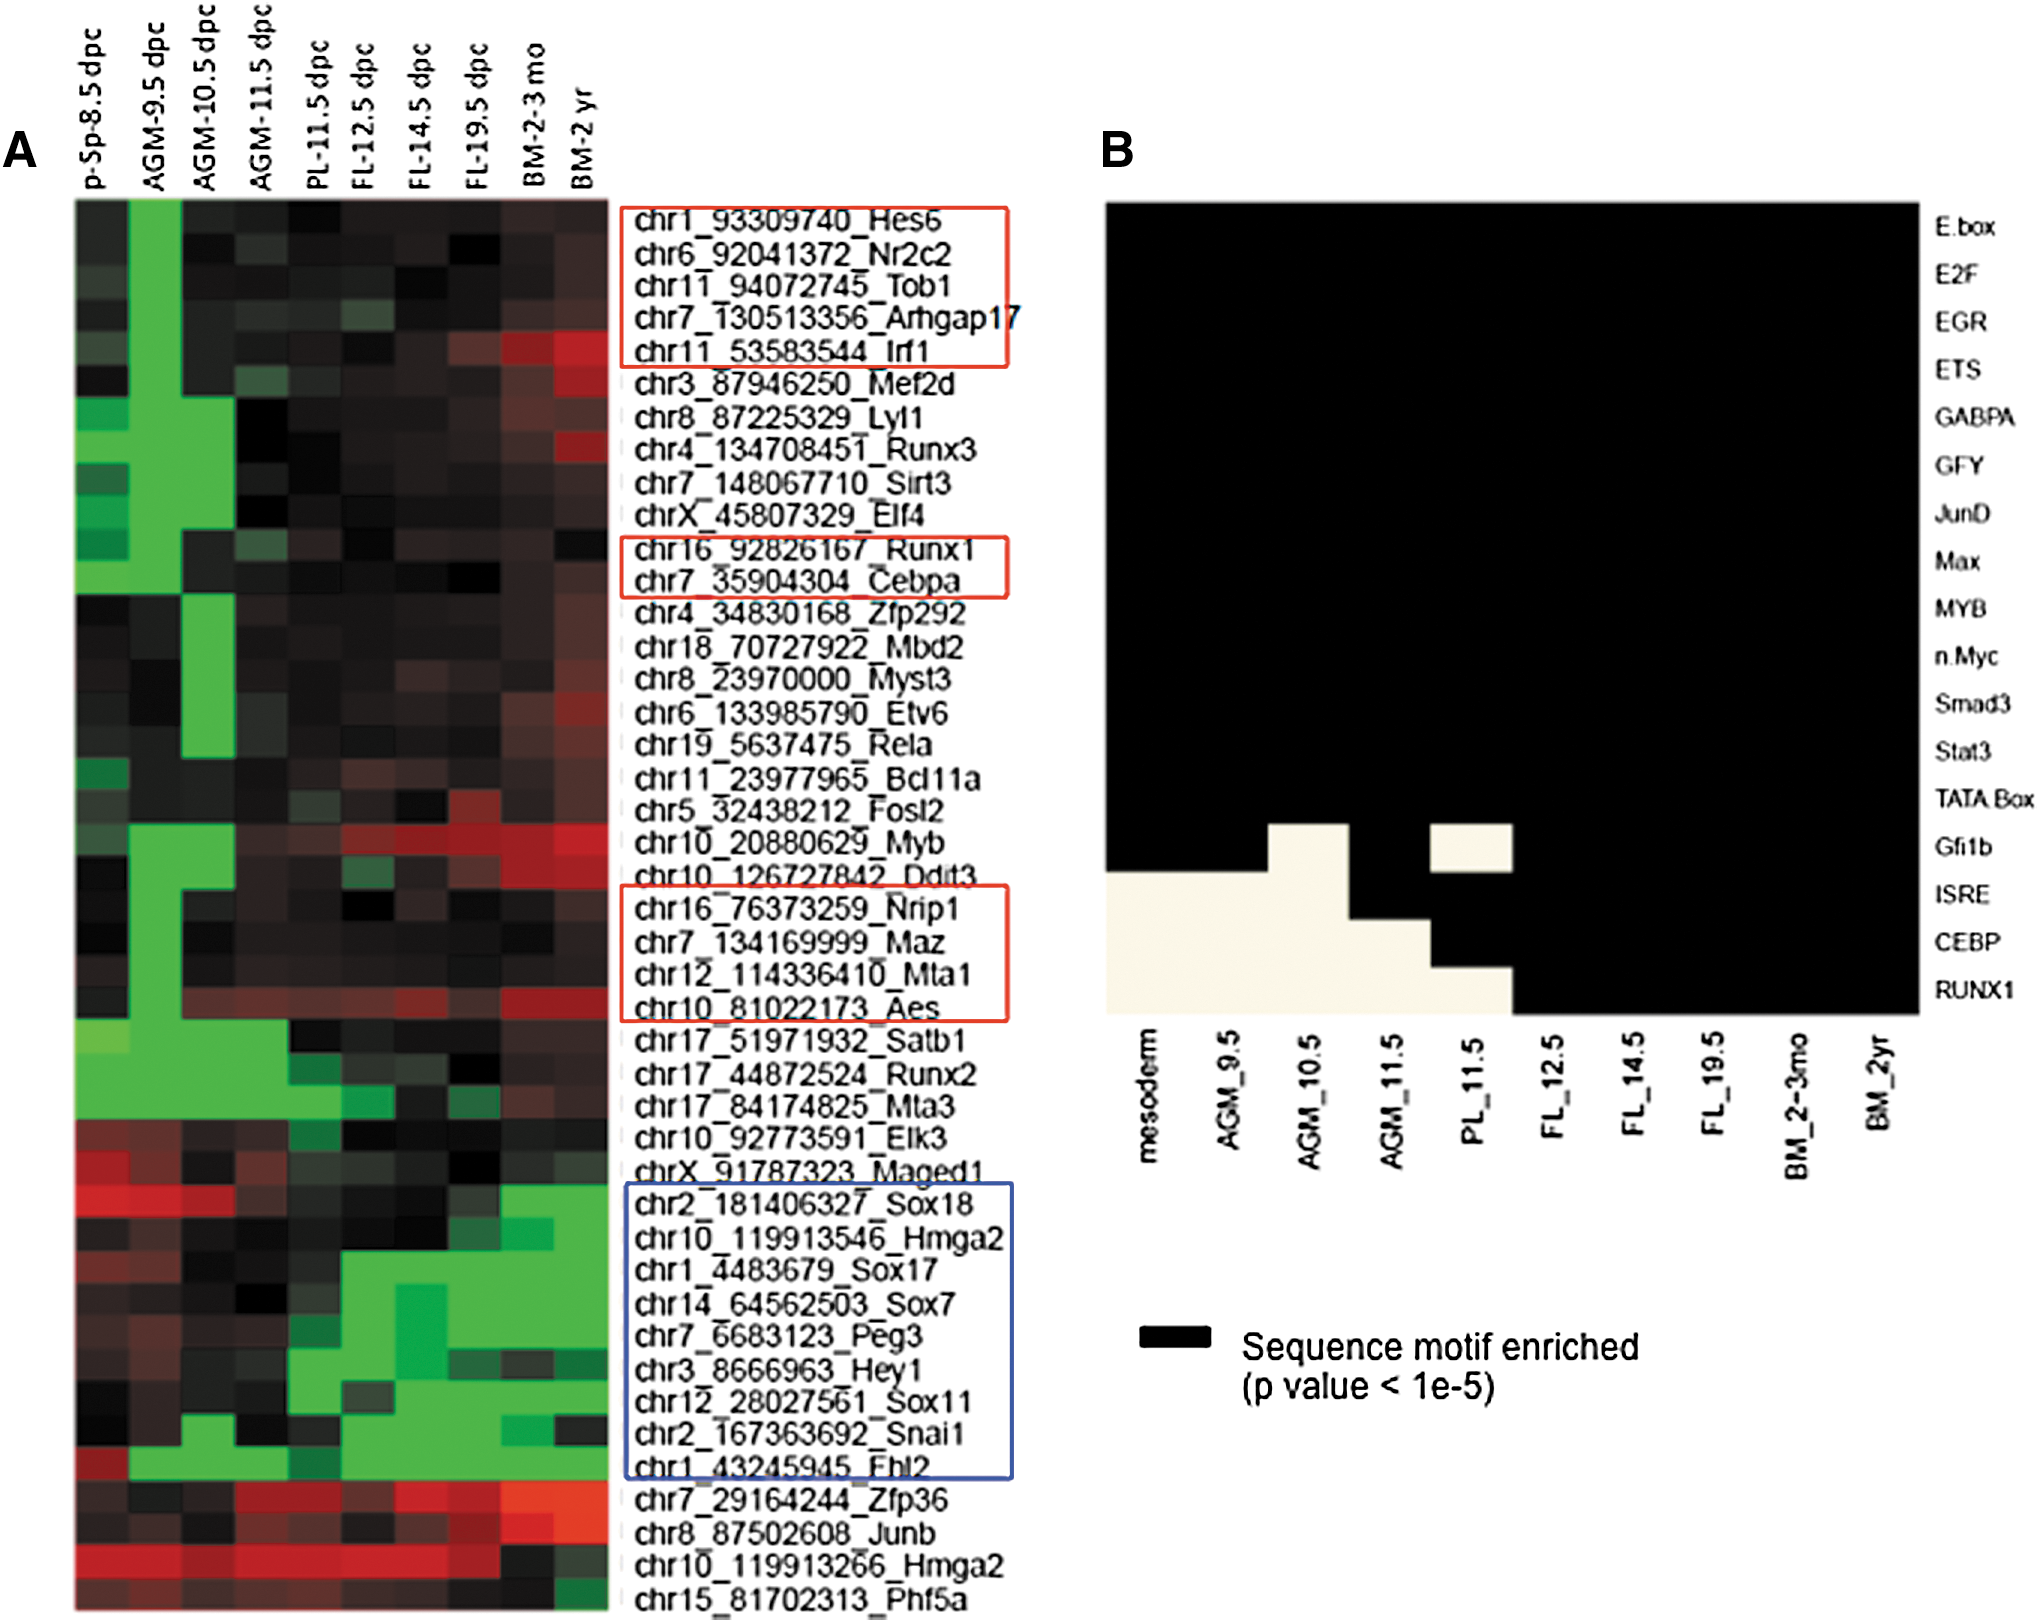
To identify stage-specific TFs governing HSPC development and maturation, we randomly selected 43 TFs differentially expressed (based on at least a twofold expression change) among the 10 samples (Fig. 4A). Of these, 9 (Sox18, Hmga2, Sox17, Sox7, Peg3, Hey1, Sox11, Snai1, and Fhl2) were downregulated during HSPC maturation (Fig. 4A, blue box). Expression of Sox17, Sox18, and Sox7 in AGM/9.5 dpc-derived pre-HSPCs suggests that these cells represent either endothelial/hematopoietic cell progenitors or cells in a transition state [13,48]. About a third (11 of 43) of the TFs (Hes6, Nr2c2, Tob1, Arhgap17, Irf1, Runx1, Cebpa, Nrip1, Maz, Mta1, and Aes) (Fig. 4A, red boxes) was differentially expressed between AGM-9.5 dpc and AGM-10.5 dpc.
Changes in global transcription over the course of HSPC ontogeny.
We reasoned that dynamically expressed gene loci should be enriched for cis-regulatory motifs recognized by these TFs. Most enriched cis-regulatory motifs for known factors obtained using HOMER software [23] (Fig. 4B) were overrepresented relative to random background sequences with the same GC content across all samples. They included motifs recognized by key HSPC TFs, including E twenty-six (ETS), bHLH proteins, JUN, MYB, PU.1, and STAT proteins. The Gfi1b motif was enriched in 11.5 dpc PL, but with P value <1e-3, which was lower than the strict cutoff (P = 1e-5). Three motifs, the ISRE (IFN-stimulated response element) [49] and sequences recognized by Cebp and Runx1, showed progressively greater enrichment during HSPC ontogeny (Fig. 4B). The ISRE motif is found in promoters of genes induced by interferon, which activates dormant HSCs [50]. Moreover, Ifnar2, a target of INF alpha, was upregulated in both FL and BM samples (Supplementary Fig. S1B).
Microarray analysis and gene selection and validation
To identify TFs that are differentially expressed in AGM-derived HSPCs at 9.5 and 10.5 dpc tissues, we selected a total of 370 differentially expressed genes after statistical analysis with limma (Supplementary Table S2). A heat map of these genes is shown (Fig. 5A). We then conducted enrichment analysis of gene function (Enrichment score >1.3) of 370 genes. Among them (Supplementary Table S2), 257 genes matched with gene identifier of the DAVID, and seven annotation clusters were enriched (Fig. 5B). We selected 40 genes for real-time PCR analysis and those genes are shown in Table 1. These 40 genes were normalized intensities based on three independent samples and consisted of 20 up- and 20 downregulated genes whose sequence information was obtained through the NCBI website and for which primer sets could be designed for real-time PCR. Then real-time PCR analysis was conducted to analyze gene expression in AGM-derived HSPC at 9.5 and 10.5 dpc. Among 20 upregulated genes, 11 were significantly upregulated (P < 0.05) at 10.5 dpc relative to 9.5 dpc (Fig. 5C). Among 20 downregulated genes, 12 were significantly downregulated (P < 0.05) at 10.5 dpc relative to 9.5 dpc (Fig. 5D).
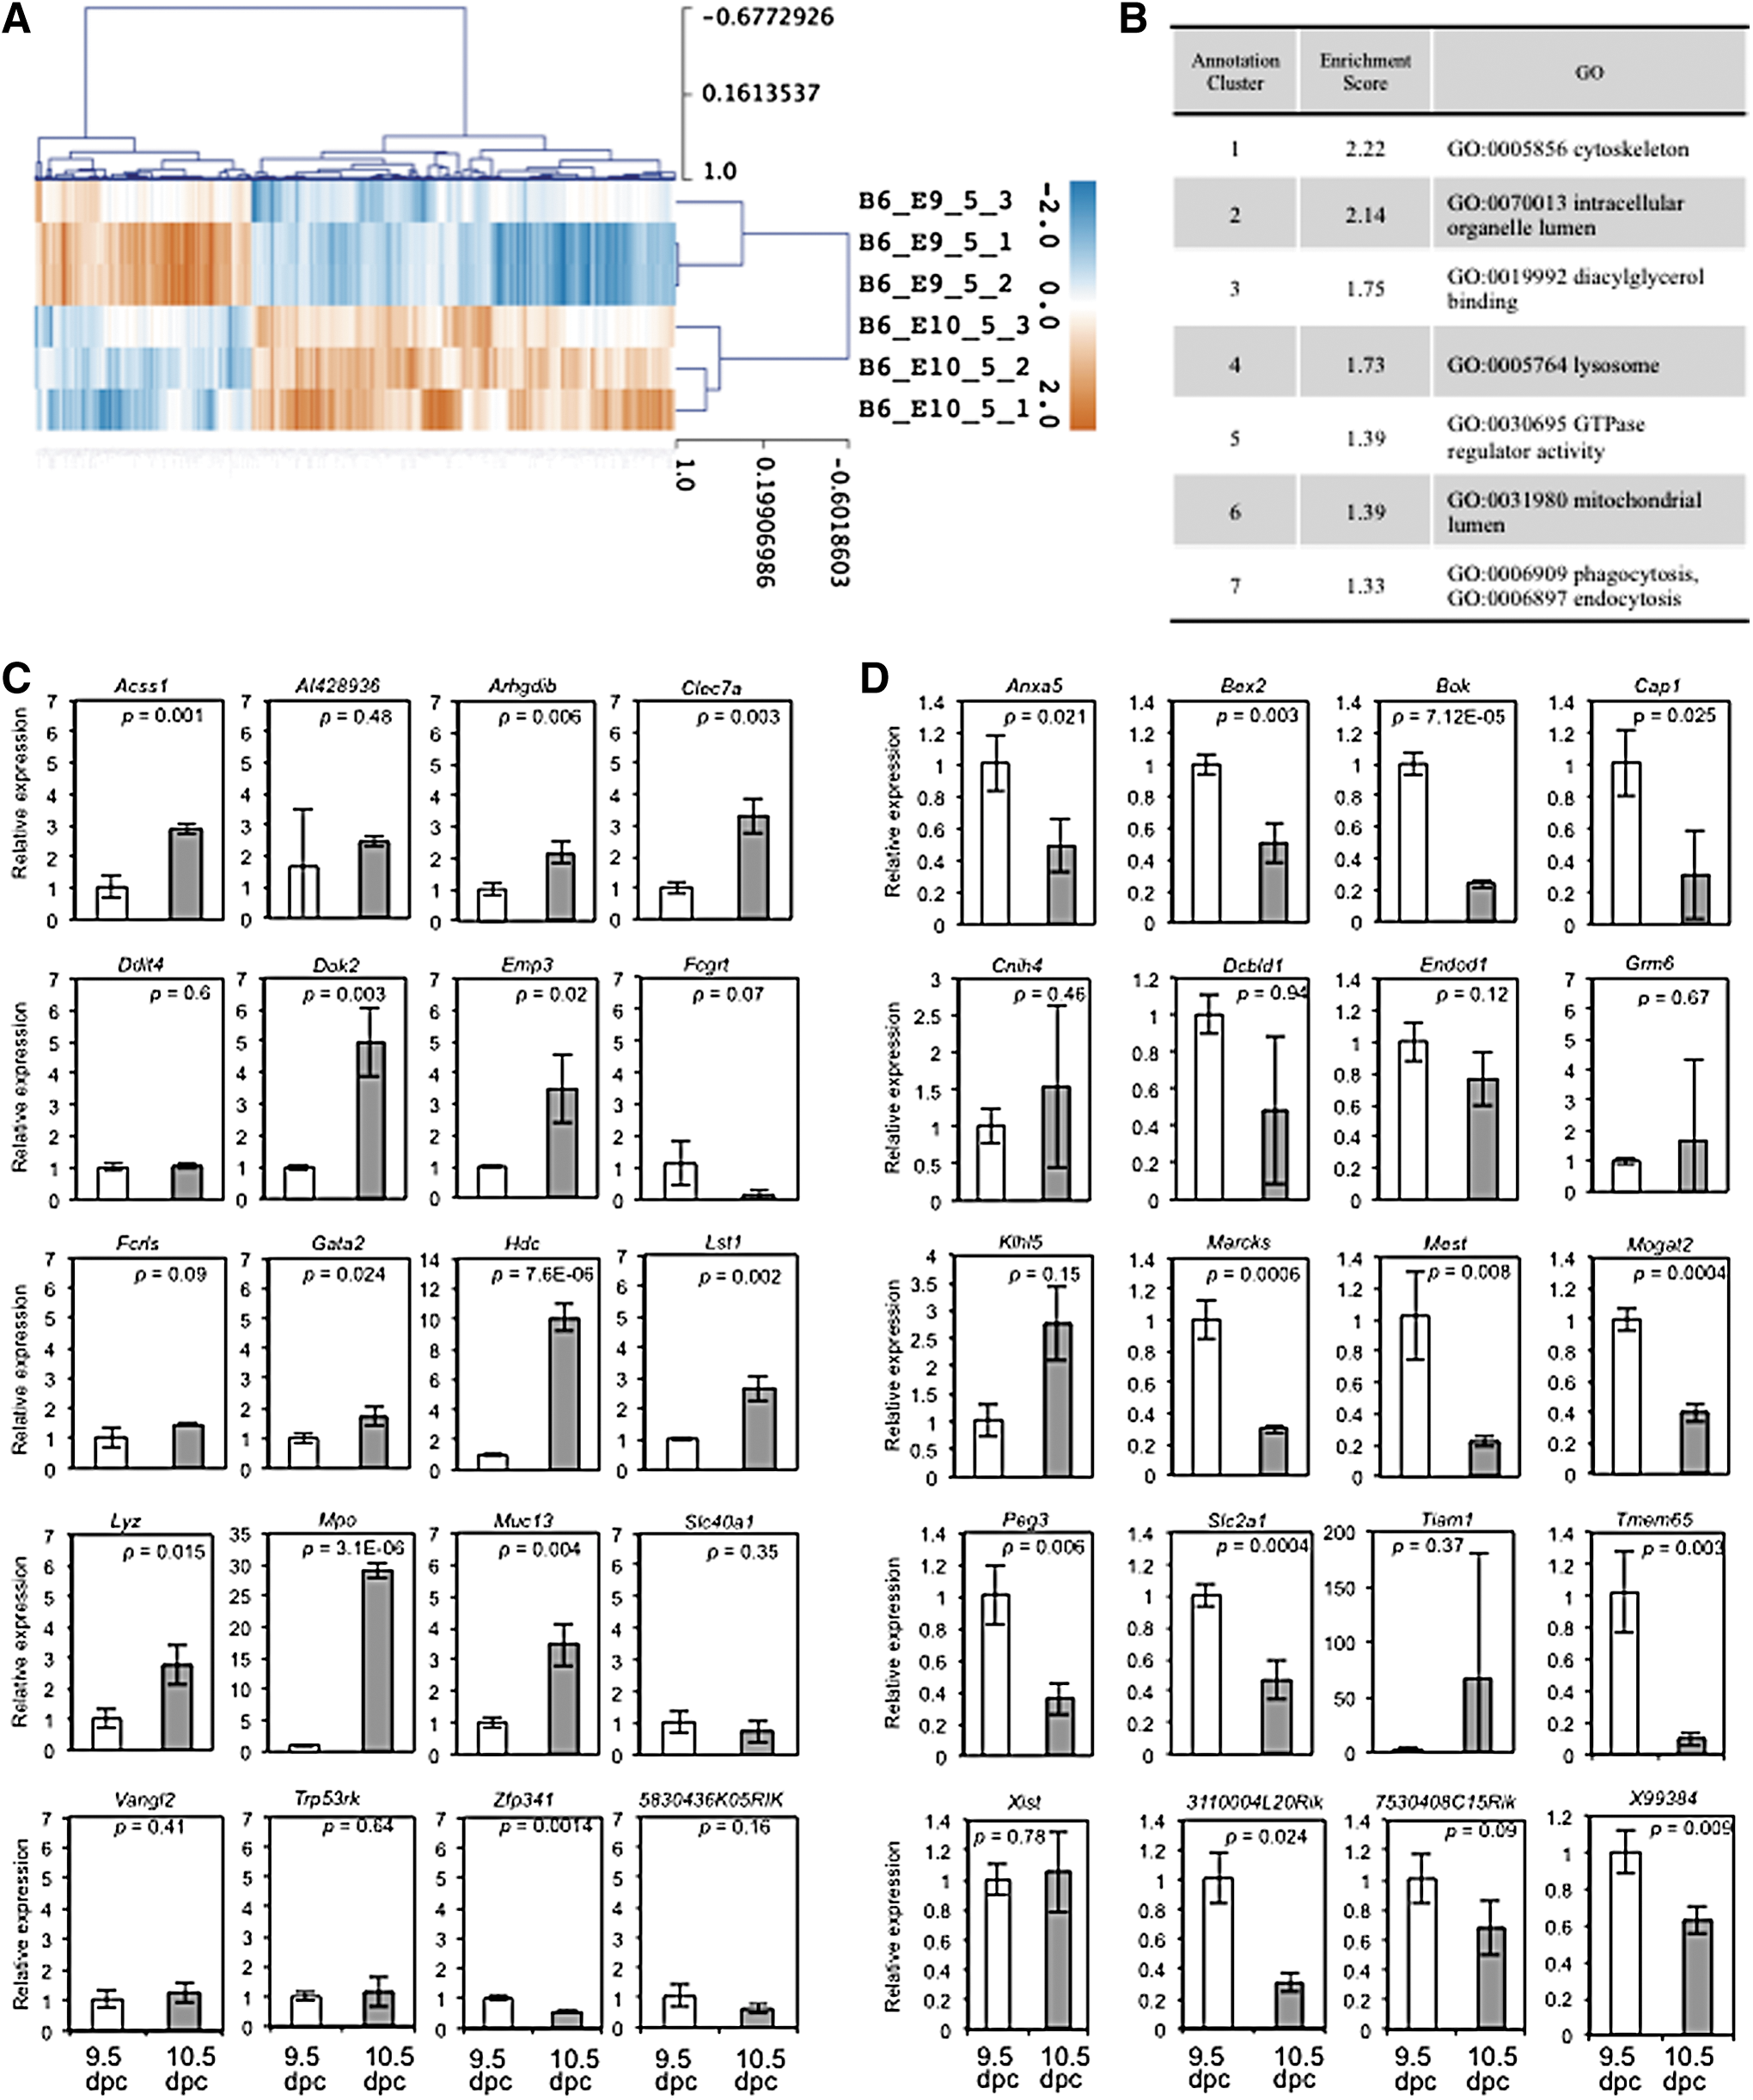
Microarray analysis of AGM-derived HSPCs at 9.5 and 10.5 dpc. Three independent samples of the AGM-derived HSPCs at 9.5 and 10.5 dpc were compared.
Forty genes were selected for microarray validation. Shown are normalized intensities in both 9.5 and 10.5 dpc AGM-derived HSCs (n = 3), ratios (non-log fold-change), P values, and adjusted P values. Up- and downregulated genes (20 each) sorted by ratio are shown. Mpo and Mest genes, each ranked by three probes, were counted as one gene.
AGM, aorta-gonad-mesonephros; dpc, days postcoitum; HSC, hematopoietic stem cell.
Discussion
Genome-wide datasets have been generated to address how transcriptional networks govern numerous biological processes. Although microarray-based expression profiling is widely used for this purpose, the standard array does not provide information relevant to transcript levels. We therefore used CAGE to construct a global picture of the transcriptional landscape regulating HSPC development, including transcript levels. The CAGE shows that a transcriptional switch point occurs between 9.5 and 10.5 dpc in the AGM region.
Due to the rarity of HSPC samples, we could not generate replicates in CAGE. Based on this outcome, in analyzing rare samples, CAGE sequencing could be used for screening purposes to predict stage-specific transcripts, while microarray analysis could be useful for statistical evaluation regardless of TSSs.
Others have reported bias in the nonspecific guanine at the 5′ end of the CAGE tag [51]. However, such bias is unlikely to underlie the large number of novel unannotated TSSs in HSPCs. First, FANTOM5 CAGE tags are longer, which can multimap and form more stringent mapping procedure. In addition, the HeliScope CAGE protocol does not use PCR, so tags are not amplified. In FANTOM5, the HeliScope CAGE protocol generates a much longer CAGE tag (∼32 bases or longer) rather than 18–21 bases in FANTOM3, allowing unequivocal unique mapping of most tags. In addition, in FANTOM5, a more advanced probabilistic aligner known as Delve is used and only reports uniquely mapping tags.
We collected 10 developmental murine HSPC populations isolated from the AGM region, PL, FL, and BM. Principal component analysis of TSSs defined 4 HSPC groups among 10 samples (Fig. 3). Previously, Daley's group reported microarray analysis of gene expression during HSC ontogeny [52]. They collected embryonic and adult HSC samples from different stages and sites, in addition to embryonic stem (ES) cell-derived HSCs. Both of our studies demonstrate that HSPC specification occurs from 10.5 to 12.5 dpc, regardless of cellular location. Their study used CD150 as an HSC marker in FL and BM; thus clustering differences between our groups are likely due to cell surface phenotypes used for cell collection. In addition, they evaluated a 9.5 dpc yolk sac sample, whereas we assessed both 8.5 dpc mesoderm and 9.5 dpc AGM samples. Both of our studies suggest that dynamic gene expression changes occur in HSPCs from 9.5 to 10.5 or 11.5 dpc, as the transition from endothelial to hematopoietic HSPC phenotypes occurs [13,37], implying that HSPC commitment is programmed by this time point. Based on this data, it is likely that a major transcriptional switch occurs from 9.5 to 10.5 dpc.
To confirm this transcriptional switch, we performed microarray analysis using triplicate samples. Clustering analysis identifying changes in cytoskeletal genes suggests a transition from endothelial to hematopoietic HSPCs, an outcome consistent with prediction of CAGE sequencing and phenotypic changes observed in HSPCs [13]. Based on ratios, P values, and adjusted P values, we chose 40 differentially expressed genes to validate by real-time PCR. Among them, 23 were significantly altered (either upregulated or downregulated), demonstrating the utility of the dataset. The function of some of these genes remains unclear in hematopoiesis.
Overall, the dataset presented in this study should foster identification of novel genes involved in HSPC development and further our understanding of HSPC biology. Our work could also suggest novel approaches to culture and manipulate HSPCs in vitro or ex vivo in future studies.
Footnotes
Acknowledgments
The authors thank Miss. Yuka Tanaka and Yuka Horio for technical support, Dr. Elise Lamar for critical reading of the article, and the Ministry of Education, Culture, Sports, Science and Technology, the Ministry of Health, Labor and Welfare, and the Japan Society for the Promotion of Science for funding. K.S.T. is a recipient of a scholarship from the Tokyo Biochemical Research Foundation, Japan, and a MyPhD scholarship from the Ministry of Higher Education (MOHE), Malaysia. A.J. is a Chancellors Fellow at the University of Edinburgh. Dr. A.J.'s laboratory is supported by strategic funding from the Biotechnology and Biological Sciences Research Council. FANTOM5 analysis was made possible by a Research Grant to the RIKEN Omics Science Center from MEXT to Y.H. Y.H. is also a recipient of a grant for Innovative Cell Biology by Innovative Technology (Cell Innovation Program) from MEXT, Japan. The authors thank all members of the FANTOM consortium for contributing to sample generation and dataset analysis. The authors also thank GeNAS for data production.
Author Disclosure Statement
No competing financial interests exist.
References
Supplementary Material
Please find the following supplemental material available below.
For Open Access articles published under a Creative Commons License, all supplemental material carries the same license as the article it is associated with.
For non-Open Access articles published, all supplemental material carries a non-exclusive license, and permission requests for re-use of supplemental material or any part of supplemental material shall be sent directly to the copyright owner as specified in the copyright notice associated with the article.