
Abstract
Mesenchymal stem cells (MSC) are promising cells for medical therapy. In in vitro expansion, MSC can give rise to progeny with genomic and epigenomic alterations, resulting in senescence, loss of terminal differentiation, and transformation to cancer. However, MSC genome protects its genetic instability by a guardian function of the P53 tumor suppressor gene and epigenetic balance system during MSC culture. Mutations of P53 and epigenetic alterations have been reported to disrupt the quality and quantity of MSC and initiate tumorigenesis. We monitor P53 and epigenetic changes in MSC derived from amniotic fluid (AF-MSC), amnion membrane (AM-MSC), endometrium (EM-MSC), and Wharton's jelly (WJ-MSC) by the missense mutation analysis of the P53 gene and the expression levels of P53, and epigenetic insulin-like growth factor 2 (IGF2) and H19-imprinted genes. Our work demonstrates a variation of P53 expression among different MSC types. AF-MSC has a high P53 expression level with retaining a stability of P53 expression throughout a long culture period, whereas EM-MSC and WJ-MSC showed variation of P53 gene expression during culture. Epigenetic analysis showed a stable H19 expression pattern in AF-MSC, AM-MSC, and EM-MSC culture, whereas H19 expression fluctuated in WJ-MSC culture. We conclude that gene instability can be found during in vitro MSC expansion. With awareness to MSC quality and safety in MSC transformation risk, P53 mutation and IGF2 and H19-imprinted gene analysis should be applied to monitor in therapeutic-grade MSC. We also demonstrated that AF-MSC is one of the most interesting MSC for medical therapy because of its high genomic stability and epigenetic fidelity.
Introduction
M
P53, a well-recognized tumor suppressor gene, has as its major function to maintain genome stability by cellular response to program cell death and limit the propagation of a cell with corrupted genome. P53 has been known as “guardian of the genome.” Generally, P53 has had a major role in interpreting the cellular stress signals in response to cell cycle arrest, apoptosis, DNA repair, and senescence [7,8]. For stem cells, P53 retains a crucial role in genome stability as well as the regulation of varied specific functions depending on stem cell type and manner. In the embryonic stem cell (ESC), P53 has a major role to contribute to embryonic development by promoting cell differentiation and prohibiting cell proliferation [9 –13]. P53 has the role of contributing to the complete reprogramming in induced pluripotent stem cells [9].
For MSC, P53 not only contributes to genome instability as a genome guarding function by halting cell progeny with genomic lesion during cell propagation but also has a direct role in MSC self-renewal, differentiation, and plasticity of MSC, and is the barrier to the transformation of MSC to cancer stem cells [9,14]. Altogether, P53 has an essential role in MSC proliferation, maintaining MSC quantity along with assuring their quality by preventing MSC transformation. The P53 acts in suppressing a tumor, whereas P53 mutation and its loss function have been found to be a main cause of transforming MSC to a tumor-initiating cell, leading to de novo tumor formation [9,15]. Mutations of P53 are highly recurrent and lead to loss of P53 tumor-suppressive function. Over 50% of all human tumors have been found to be related to P53 mutation [16 –18].
In an in vitro culture system, it has been found that MSC with genome fidelity can be maintained in the culture for several passages without rigorous property change and cell cycle arrest, whereas MSC with P53 mutation promote a higher growth rate, resistance to apoptosis, and accumulation of aged MSC [19,20]. For cell differentiation, MSC maintain a multipotency cell by coordinating with P53. The absence of the P53 function can disrupt the terminal cell differentiation, leading to alteration of a specific differentiation pathway and resulting in the accumulation of early and intermediate cell progenitors. The accumulation of progenitors with faulty DNA containing mutation promotes tumor formation and cancer risk [21].
Epigenetics is a key system that regulates gene activities without the concern of changing the nucleotide sequence of DNA. It comprises many mechanisms and regulates gene expression and cellular phenotype. One of the major regulatory mechanisms implicated in the maintenance of stem cell-specific characteristics is DNA methylation. DNA methylation controls cellular activity and development by the addition of a methyl group on a silent gene. One submechanism of DNA methylation, which is normally found in pregnancy organs, is gene imprinting [22 –24]. Gene imprinting is adding methyl groups to contribute the bias of parental allele expression. The methyl groups are added on the imprinting control region (ICR) of the silent parental (maternal or paternal) allele, which results in a monoallelic expression. Aberrant gene imprinting is involved in many disorders, including cancer [25 –28].
Insulin-like growth factor 2 (IGF2, a maternally imprinted gene) and H19 (a paternally imprinted gene) are the most characterized imprinted genes that relate to cell development and proliferation. IGF2 and H19 are located in the same cluster at 11p15. The methylation in the ICR of H19 results in IGF2 promoter activation, whereas H19 noncoding RNA acts on the binding site of the CTCF insulator protein, resulting in the silencing of IGF2 [29]. Overexpression of IGF2-imprinted gene has been reported in various cancers, whereas H19 protects and inhibits IGF2 overexpression [29].
To monitor genetic fidelity and epigenetic balance and evaluate the risk of using MSC in medical therapy in MSC transformation, we examine the expression level of the P53 tumor suppressor gene and IGF2- and H19-imprinted genes in four different types of MSC, including amniotic fluid (AF-MSC), amniotic membrane (AM-MSC), endometrium (EM-MSC), and Wharton's Jelly (WJ-MSC) at the short-term (passage 4) and long-term in vitro culture (passage 10–14). The missense mutation on the P53 gene at codon 248, 249, and 282, which has been reported as high frequency of mutation in various cancers, was investigated using reverse transcriptase–polymerase chain reaction and restriction fragment length polymorphism (RT-PCR-RFLP).
Materials and Methods
Human materials
Amniotic fluid, amniotic membrane, biopsied endometrial tissue, and umbilical cord were collected from the Department of Obstetrics and Gynecology, Faculty of Medicine Siriraj Hospital, after donors consented, according to the regulations of the Institutional Ethics Committee Board of Siriraj Hospital, Mahidol University (Bangkok, Thailand). The Institutional Review Board approved the use of tissues.
Establishment and expansion of MSC lines
Samples of each stem cell type were provided from ten donors. For AM-MSC, amnion membrane on the placenta was mechanically peeled off using a sterile technique. For EM-MSC, biopsied endometrial tissues were obtained from reproductive-aged donors, who participated in assisted reproductive treatment and were treated with an ovum pickup process. Two to three tissues samples were collected from each donor by endometrial aspiration and then put in cold Dulbecco's modified Eagle's medium (DMEM; Gibco, Invitrogen) containing 100 IU/mL penicillin G sodium and 100 μg/mL streptomycin sulfate (Gibco). The isolation process was started within 60 min after tissue collection.
For WJ-MSC, 10 cm of umbilical cord was obtained after full-term delivery and immediately washed in sterile normal saline for 30 min before tissue processing. The cords were cut into 1 cm segments and transferred to phosphate-buffered saline (PBS). Arteries were removed from the cord sections. All tissues from amnion membrane, endometrium, and Wharton's jelly were removed of excessive blood and cellular debris by rinsing with sterile normal saline solution (0.9% w/v sodium chloride) and PBS (pH 7.4). The tissues were minced into small pieces (∼1 × 1 mm2) and placed in a 60 mm tissue culture dish (Corning).
For the AF-MSC, human amniotic fluid samples were obtained from genetic amniocentesis performed for routine fetal genetic determination at 16–20 weeks of gestation. Three milliliters of each amniotic fluid sample was centrifuged, and the pellet was used for clonal cell line establishment.
The AM-MSC and WJ-MSC were cultured under a medium containing alpha minimum essential medium (α-MEM; Gibco), 2 mM
In the primary culture of AM-MSC, EM-MSC, and WJ-MSC, the medium was changed after 5 days. The tissue was discarded when cells outgrowing the tissue were observed. The cells were harvested and subcultured to the next passage, when colony outgrowth reached 80%–90% confluence. The medium was replaced twice a week. The cells were subcultured to the next passage at a dilution of 1:4 when confluence reached 80%–90%. For AF-MSC, an individual MSC line was derived as a clonal cell line technique using the starter cell method [30]. All MSC lines from four MSC sources were repeatedly subcultured until passage 14.
MSC proliferation analysis
The proliferation capacity of AF-MSC, AM-MSC, EM-MSC, and WJ-MSC was displayed by population doubling time (PDT) at each subculture passage. The PDT was determined by the following equation: [log(2)T/log(Y) − log(X)], where T is the number of days for cell expansion at each passage, X is the seeded cell number, and Y is the number of harvested cells.
Characteristics analysis
For phenotypic analysis, each stem cell line of AF-MSC, AM-MSC, EM-MSC, and WJ-MSC from early (P4) and late (P14) culture at 70% confluence was detached and washed with PBS. The cells were stained with fluorescein isothiocyanate- and phycoerythrin-conjugated monoclonal antibodies against CD29, CD90, CD105 (eBioscience), CD34, CD45, and CD73 (Becton Dickinson) for 15 min in the dark. After PBS washing, the MSC were fixed with 1% paraformaldehyde (Merck, Darmstadt, Germany) at room temperature. MSC phenotypic analysis was performed using a Becton Dickinson flow cytometer (Becton Dickinson).
For in vitro cell differentiation analysis, MSC (passage 4–6) were cultured in an appropriate induction medium under conditions of 5% CO2 at 37°C. MSC were induced and differentiated into adipogenic lineage using the induction medium containing α-MEM supplemented with 10% ES-FBS (Gibco, Invitrogen), 1 μM dexamethasone (Sigma), 5 μg/mL insulin (Sigma), 0.5 mM 3-isobutyl-1-methylxanthine (Sigma), and 60 μM indomethacin (Sigma). Oil red O staining was performed after 14 days in the induction medium. For induction into osteogenic lineage, MSC were cultured under a medium containing α-MEM supplemented with 10% ES-FBS, 0.1 μM dexamethasone (Sigma), 10 mM glycerol-2-phosphate (Sigma), and 50 μM ascorbic acid (Sigma). The medium was changed twice a week. Alkaline phosphatase staining was performed at day 21 in the induction medium. For induction into chondrogenic lineage, MSC were cultured under DMEM high glucose (Gibco) supplemented with 0.34 mM
Chromosome analysis
MSC at passage 4 were treated with colchicine and incubated at 37°C for 3 h. The MSC were harvested using 0.25% trypsin-EDTA and transferred to a centrifuged tube containing MSC culture medium. Samples were centrifuged at 1,800 rpm for 5 min and incubated with 0.075 M KCl at 37°C for 20 min. Chromosomes were fixed with precooled mixture of methanol and acetic acid at a proportion of 3:1. Fixed cells were delocalized and spread onto glass slides. The slides were stained using GTG banding (GTG: G-bands by trypsin using Giemsa staining) for investigation of stained bands on chromosome.
Assessment of telomere length
All MSC lines were harvested at passage 10. The telomerase enzyme activity was examined by PCR using a TRAPeze Telomerase Detection Kit (Millipore) following the instructions of the kit's manufacturer.
RNA extraction and real-time RT-PCR for expression level analysis
Each MSC line at the early (P4) and late (P10–P14) culture was extracted for total cellular RNA using Trizol (Invitrogen, Carlsbad, CA) according to the manufacturer's instructions. The purity and quantity of the isolated RNA were evaluated using Nanophotometer version 2.0 (Implen, Inc.). Individual RNA samples were synthesized into complementary DNA (cDNA) using a RevertAid First-Strand cDNA Synthesis Kit (Fermentas, EU). The cDNA was applied for gene expression experiment.
Analysis of P53 gene expression level
To evaluate stability of P53 expression in each type of MSC during in vitro culture, cDNA of all MSC lines at early (P4) and late (P10–P14) culture was used to examine P53 gene expression levels using real-time RT-PCR. The P53 primer, which was validated for the amplification efficiency, was used in analysis, and beta-Actin was used as the endogenous reference gene. The real-time PCR was performed using selective primers: beta-Actin (107 bp) forward primers, 5′-ATGTGGCCGAGGACTTTGATT-3′, and reverse primer, 5′-AGTGGGGTGGCTTTTAGGATG-3′; and P53 (82 bp) forward primers, 5′-GCCCATCCTCACCATCATCACA-3′, and reverse primer, 5′-GGCACAAACACGCACCTCA-3′.
For SYBR green real-time PCR reaction, the total volume of 25 μL reaction mixture contained 5 ng cDNA in 5 μL, 10 pmol of forward and reverse primers, and 2.5 μL of SYBR green mastermix (Brilliant III Ultra-Fast SYBR Green QPCR Master Mix; Agilent Technologies, Santa Clara, CA). To compare the relative levels of P53 expression in MSC at early and late culture, samples were amplified and detected on a LightCycler 480 Real-time PCR system (Roche Applied Science). The comparative threshold cycle method, also known as the cycle threshold (CT; 2−ΔΔCT) method, was applied.
Western blot analysis
Cells at the 80%–90% confluence were washed in ice-cold PBS and lysed in 60 μL radioimmunoprecipitation assay buffer (Cell Signaling, Beverly, MA) containing 1% phenylmethylsulfonyl fluoride (PMSF). Protein content of lysate was determined using the Bradford protein assay (Bio-Rad, Hercules, CA). Lysate was diluted to 20 μg per loading with ddH2O, preceded to 10% sodium dodecyl sulfate–polyacrylamide gel electrophoresis, and transferred to 0.45 μm PVDF membrane. Membrane was incubated in 3% bovine serum albumin (BSA) blocking solution and probed with primary antibodies anti-P53 (dilution 1:1,000, No. 2524; Cell Signaling) or anti-beta-Actin (dilution 1:10,000, ab8226; Abcam, Cambridge, UK). The secondary antibody was rabbit anti-mouse conjugated to horseradish peroxidase (HRP, ab97046, Abcam) at a dilution of 1:50,000. The HRP-chemiluminescent substrate (ECL; GE healthcare, Little Chalfont, UK) was detected using ImageQuant LAS 4010 imagine system. Quantification of band intensities was performed using ImageJ software (version 1.51j8, Wayne Rasband; U.S. National Institutes of Health, Bethesda, MD).
Analysis of P53 mutation
For P53 mutation analysis, the missense mutations on the P53 tumor suppressor gene were investigated on specific single nucleotide in codon 248, 249, and 282 on exon 7–8 of P53 gene, where each codon was reported for a high frequency of mutation in various cancers as referenced in IARC TP53 Database [31]. The single-nucleotide mutation in codon 248, 249 and 282 was analyzed using RT-PCR to amplify cDNA of individual MSC line at late culture (P10–P14) using a pair of the specific primers: P53 for SNP (198 bp) forward primers, 5′-TGGCTCTGACTGTACCACCA-3′, and reverse primer, 5′-TTGCGGAGATTCTCTTCCTC-3′.
cDNA amplification was performed using the following PCR conditions: initial denaturation at 94°C for 5 min and 35 cycles of DNA denaturing at 94°C for 45 s, annealing at 56°C for 1 min, and an extension at 70°C for 1 min, after which the reaction was extended with 70°C for 10 min. To identify mutation on a specific codon, the PCR products were enzymatic digested using the RFLP technique. The specific digesting enzymes used for analysis of codon 248 (CGG-to-TGG/CAG), codon 249 (AGG-to-AGT), and codon 282 (CGG-to-TGG/GGG) were BsaWI, Sau96I, and BsrFI, respectively. Indigestible PCR product on 10% polyacrylamide gel electrophoresis indicated the mutation at the codon.
Genomic imprinting analysis
To determine the epigenetic stability in four types of in vitro cultured MSC, the epigenetic investigation was performed by genomic imprinting analysis. Expression of H19- and IGF2-imprinted genes was quantitatively analyzed in all MSC lines at early and late culture using real-time RT-PCR. cDNA was amplified to a defined level of gene expression using the following primers: beta-Actin (107 bp) forward primers, 5′-ATGTGGCCGAGGACTTTGATT-3′, and reverse primer, 5′-AGTGGGGTGGCTTTTAGGATG-3′; H19 (215 bp) forward primers, 5′-GGGACACAAAACCCTCTAGCTTGGAAA-3′, and reverse primer, 5′-GTCGGAGCTTCCAGACTAGG-3′; and IGF2 (151 bp) forward primers, 5′-CACGCCAAACACTGAATGTC-3′, and reverse primer, 5′-ATTGGGATTGCAAGCGTTAC-3′.
The primers were examined for amplification efficiency before use in the experiment. The relative expression level of each gene in different MSC types at early and late culture was determined relative to the quantity of beta-Actin using the comparative cycle threshold (2−ΔΔCT) method.
Statistical analysis
Results were presented as mean and standard error of the mean (mean ± SEM). The student's t-test using GraphPad Prism 5 software (GraphPad, San Diego, CA) was used to evaluate the difference in population doubling rates, indicating the proliferation capacity and the difference in the relative expression levels of P53, IGF2, and H19 within each MSC type at early and late culture and among four different MSC sources. A value of P < 0.05 was considered statistically significant.
Results
MSC derivation and characteristics
For AM-MSC, EM-MSC, and WJ-MSC line derivation, cellular outgrowth from minced tissues can be found within 3–8 days of primary tissue culture. The outgrowing cells initiated to form colonies and were subcultured to expand to passage 14. The colonies showed morphologically heterogeneous with fibroblast-like cells and epithelial-like cells at passage one and two of culture. Homogeneous population was found after passage two. The morphological appearances of three MSC types were of fibroblastoid-type cell morphology. For derivation of AF-MSC lines, primary amniocentesis was cultured to provide a single cell as a starter cell to generate each clonal AF-MSC line. Morphologic appearance of AF-MSC was found in fibroblastic cell type. The cells can be subcultured and expanded through long-term culture of at least 20 subculture passages. The morphology of each MSC type has been shown in Fig. 1A.
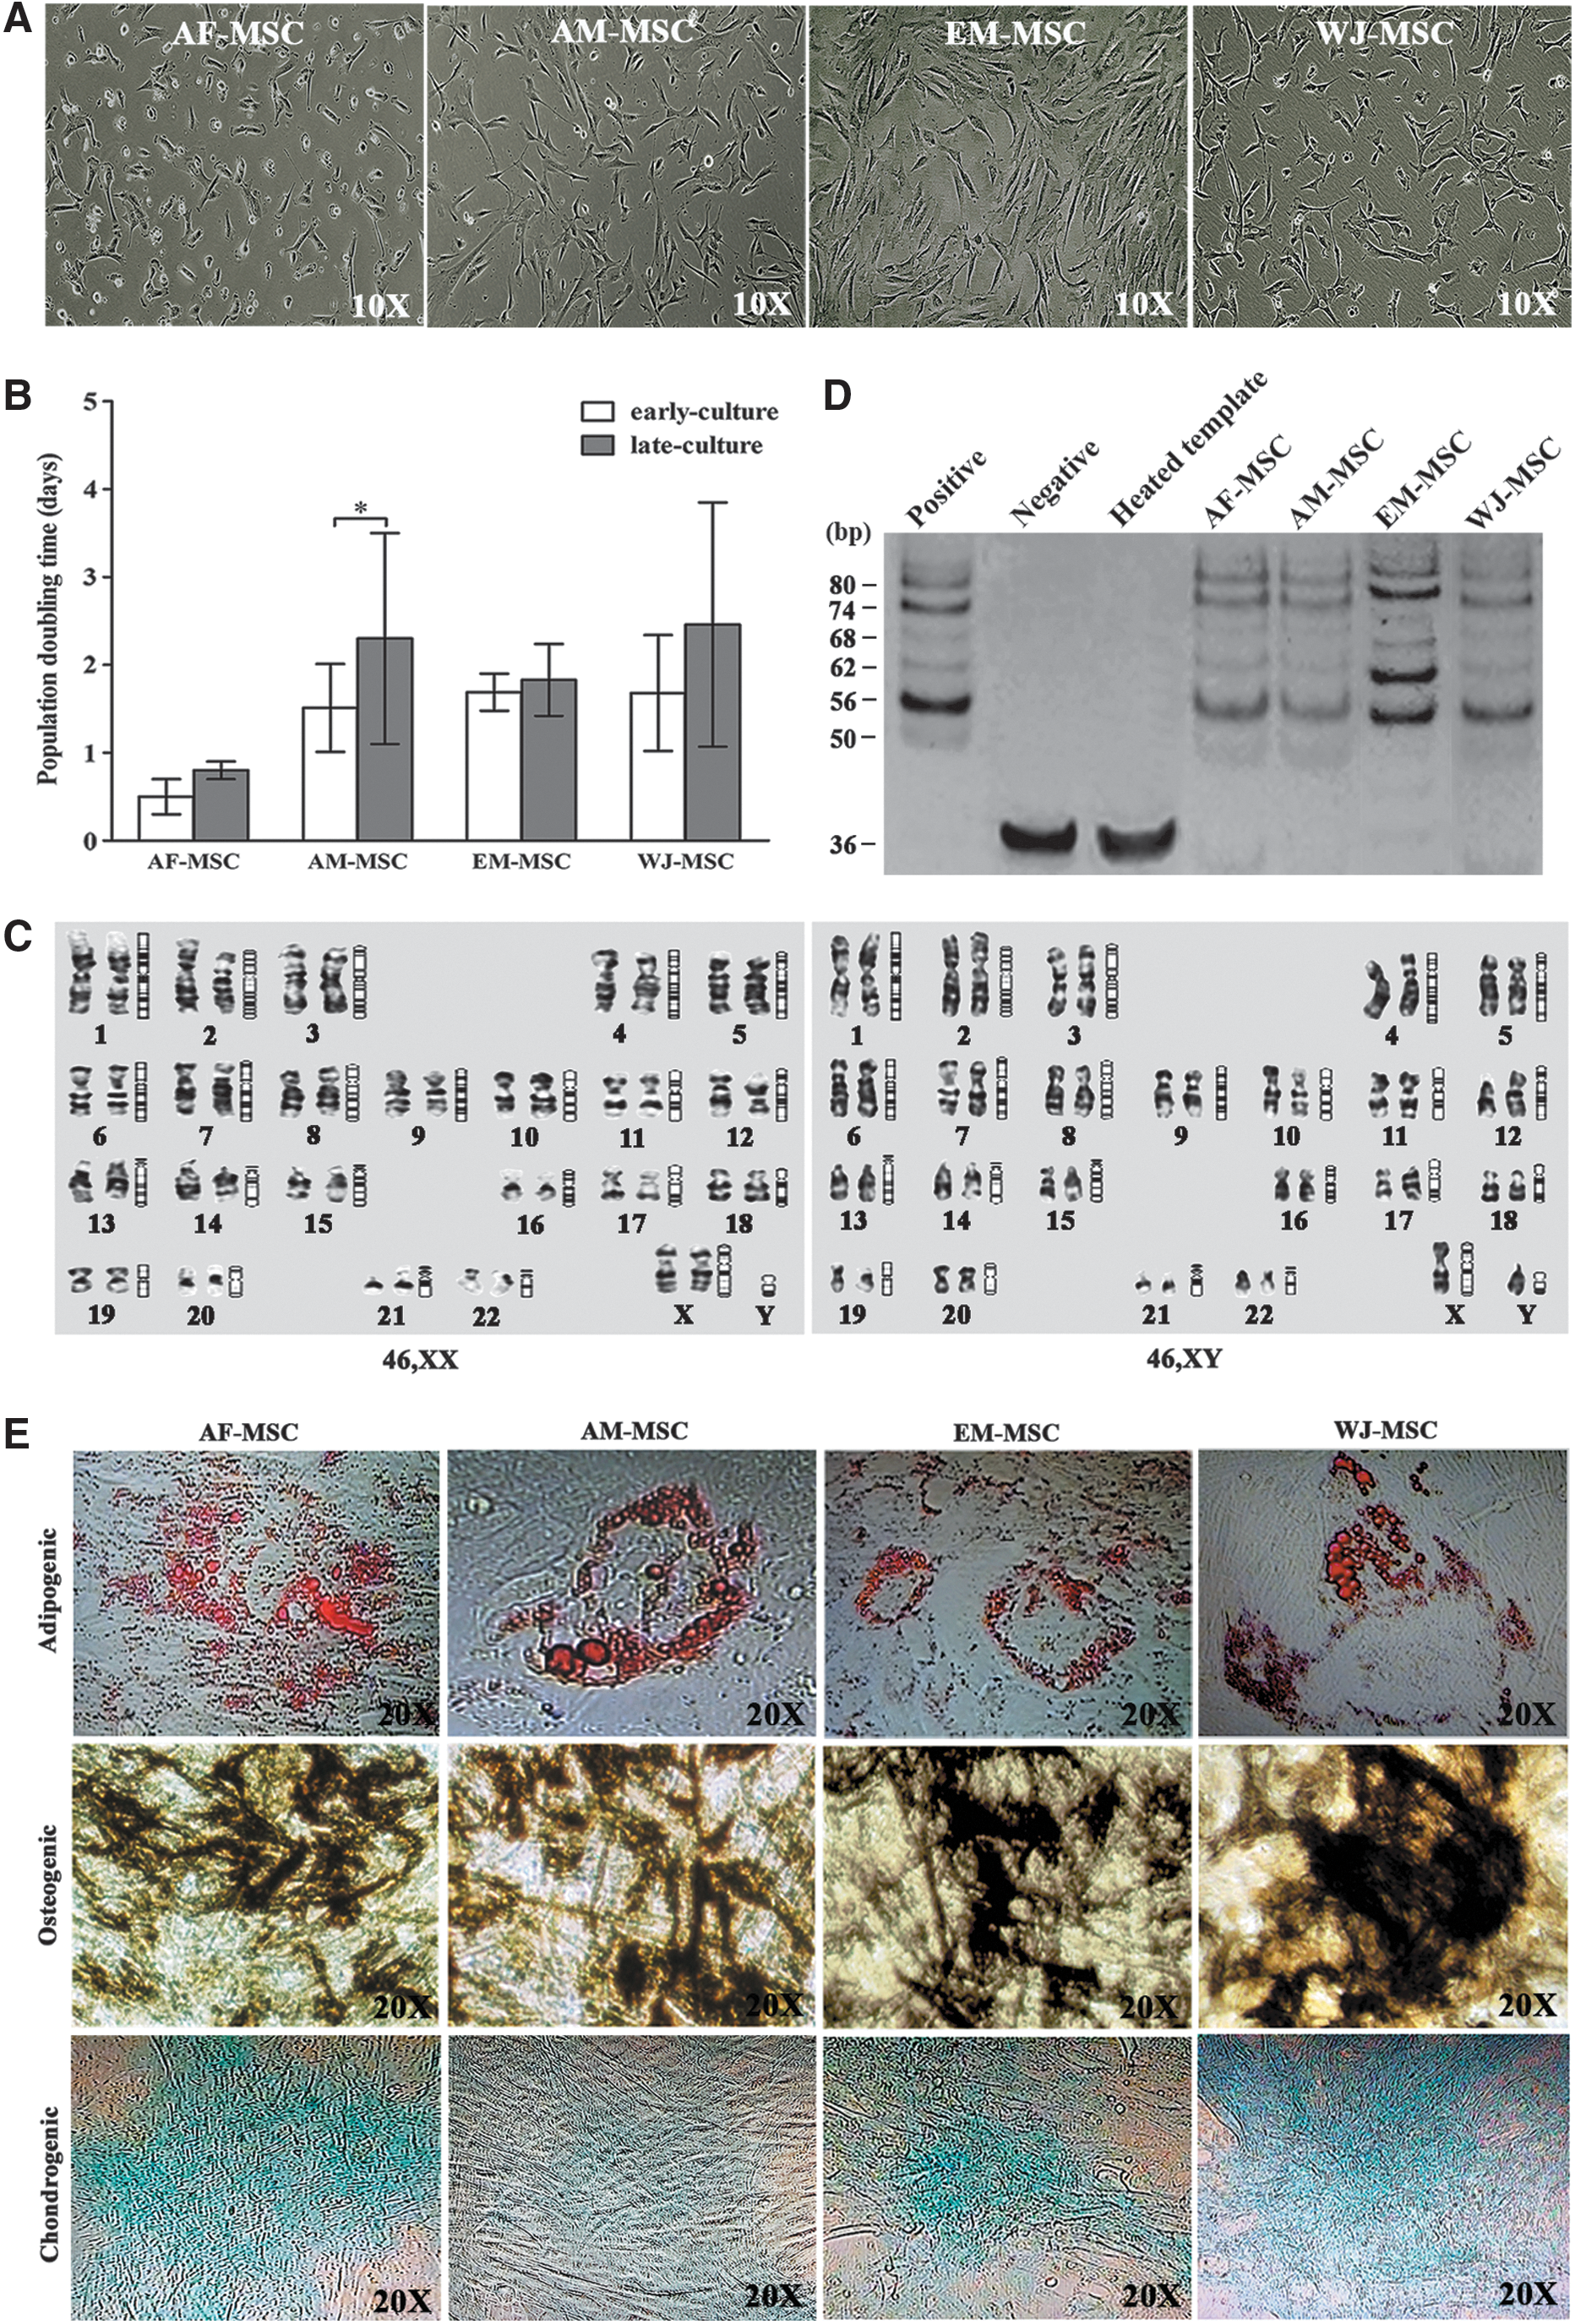
Morphologic appearances, properties, and characteristics of AF-MSC, AM-MSC, EM-MSC, and WJ-MSC.
For the proliferation ability of MSC, the calculation of PDT was used to evaluate MSC proliferation capacity and reported as mean ± SD. The proliferation rate of AF-MSC lines (n = 10) at the early culture showed average PDT of ∼0.5 ± 0.2 with a range of 0.4–0.7 days and late culture showed 0.8 ± 0.1 days with a range of 0.7–1.0 days. The PDT average of AM-MSC (n = 10) at the early culture was 1.5 ± 0.2 days with a range of 1.1–1.9 days, and at the late culture was at 2.3 ± 0.9 days with a range of 0.9–3.4 days. The PDT of WJ-MSC (n = 10) at early culture passage was 1.7 ± 0.7 days with a range of 0.9–3.0 days, and at the late passage was an average of 2.5 ± 1.4 days with a range of 1.4–6.5 days. The PDT of EM-MSC (n = 10) at early culture passage (P4) was 1.7 ± 0.2 days with a range of 1.4–1.9 days, and at the passage 10 was an average of 1.8 ± 0.4 days with a range of 1.2–2.4 days. The comparison of PDTs among AF-MSC, AM-MSC, EM-MSC, and WJ-MSC is shown in Fig. 1B.
For antigenic phenotypic appearance, the cell surface cluster of differentiation (CD) markers was analyzed in MSC lines from four tissue sources at passage 7–10 by flow cytometry. The phenotypic expressions on cell surface MSC lines were highly positive for MSC markers CD29, CD73, and CD105 at 90%–100%. The hematopoietic markers CD34 and CD45 were not detected in any MSC line. The CD markers are displayed in mean ± SEM and showed in Table 1.
AF-MSC, amniotic fluid mesenchymal stem cell; AM-MSC, amniotic membrane mesenchymal stem cell; EM-MSC, endometrial mesenchymal stem cell; MSC, mesenchymal stem cell; SEM, standard error of the mean; WJ-MSC, Wharton's Jelly mesenchymal stem cell.
For investigation of genetic stability in MSC, cytogenetic analysis, which is a reliable indicator for genetic stability and widely used in MSC study, has been examined by conventional G-banded karyotyping. Karyotypic analysis was performed in all MSC lines studied and showed that all MSC lines had normal diploid karyotype of 46XX or 46XY based on chromosomal investigation at subculture passage 4 (Fig. 1C). No clonal numerical or structural cytogenetic alteration was observed. With respect to cell senescence, all MSC were measured for telomere length, implying telomerase activity. All AF-MSC, AM-MSC, EM-MSC, and WJ-MSC lines at passage 10 exhibited the ability to synthesize telomeric repeats at the 3′ ends of their DNA strands using PCR (Fig. 1D).
For evaluation of the differentiation properties of MSC lines from four different tissue sources, all MSC lines were investigated for differentiation capacity by induction into adipogenic, osteogenic, and chondrogenic lineages. We found that all the studied MSC lines showed positive results of cell differentiation. Endogenous lipid droplets were detected in all MSC lines after adipogenic induction and showed positive staining of Oil red O, indicating differentiation into the adipogenic lineage. Alkaline phosphatase activity was detected in MSC after osteogenic induction by light microscopy, indicating differentiation into the osteogenic lineage. Cartilage-specific proteoglycan formation was found in MSC lines after chondrogenic induction and showed positive staining of alcian blue, indicating differentiation into the chondrogenic lineage (Fig. 1E).
From these data, AF-MSC, AM-MSC, EM-MSC, and WJ-MSC lines can maintain typical MSC characteristics in cell proliferation, phenotypic appearance, normal karyotype, and typical telomere length. AF-MSC showed a superior efficiency for cell proliferation to other MSC types. The MSC lines exhibited a declined proliferation rate by repeated subculture.
P53 expression and mutation
For investigation of P53 tumor suppressor gene expression levels, quantitative real-time RT-PCR was used to quantify the RNA expression level in MSC lines from four different sources. We compared the expression levels of P53 gene among four different MSC types and found that AF-MSC showed the highest level of P53 gene expression, whereas EM-MSC and WJ-MSC showed the lowest levels. The P53 expression level in AF-MSC was significantly higher than the expression in EM-MSC (P < 0.01) and in WJ-MSC (P < 0.05). The P53 gene expression levels of AF-MSC, AM-MSC, EM-MSC, and WJ-MSC from four tissue sources are shown in Fig. 2A. On the contrary, study of P53 protein expression level in MSC lines from four different sources using western blot analysis showed no significant difference among MSC types (Fig. 2B). P53 protein expression level was calculated by band intensities of P53 protein and beta-Actin on blotting membrane in a relative fold change. The pattern of protein expression on blotting membrane has been shown in Fig. 2C.
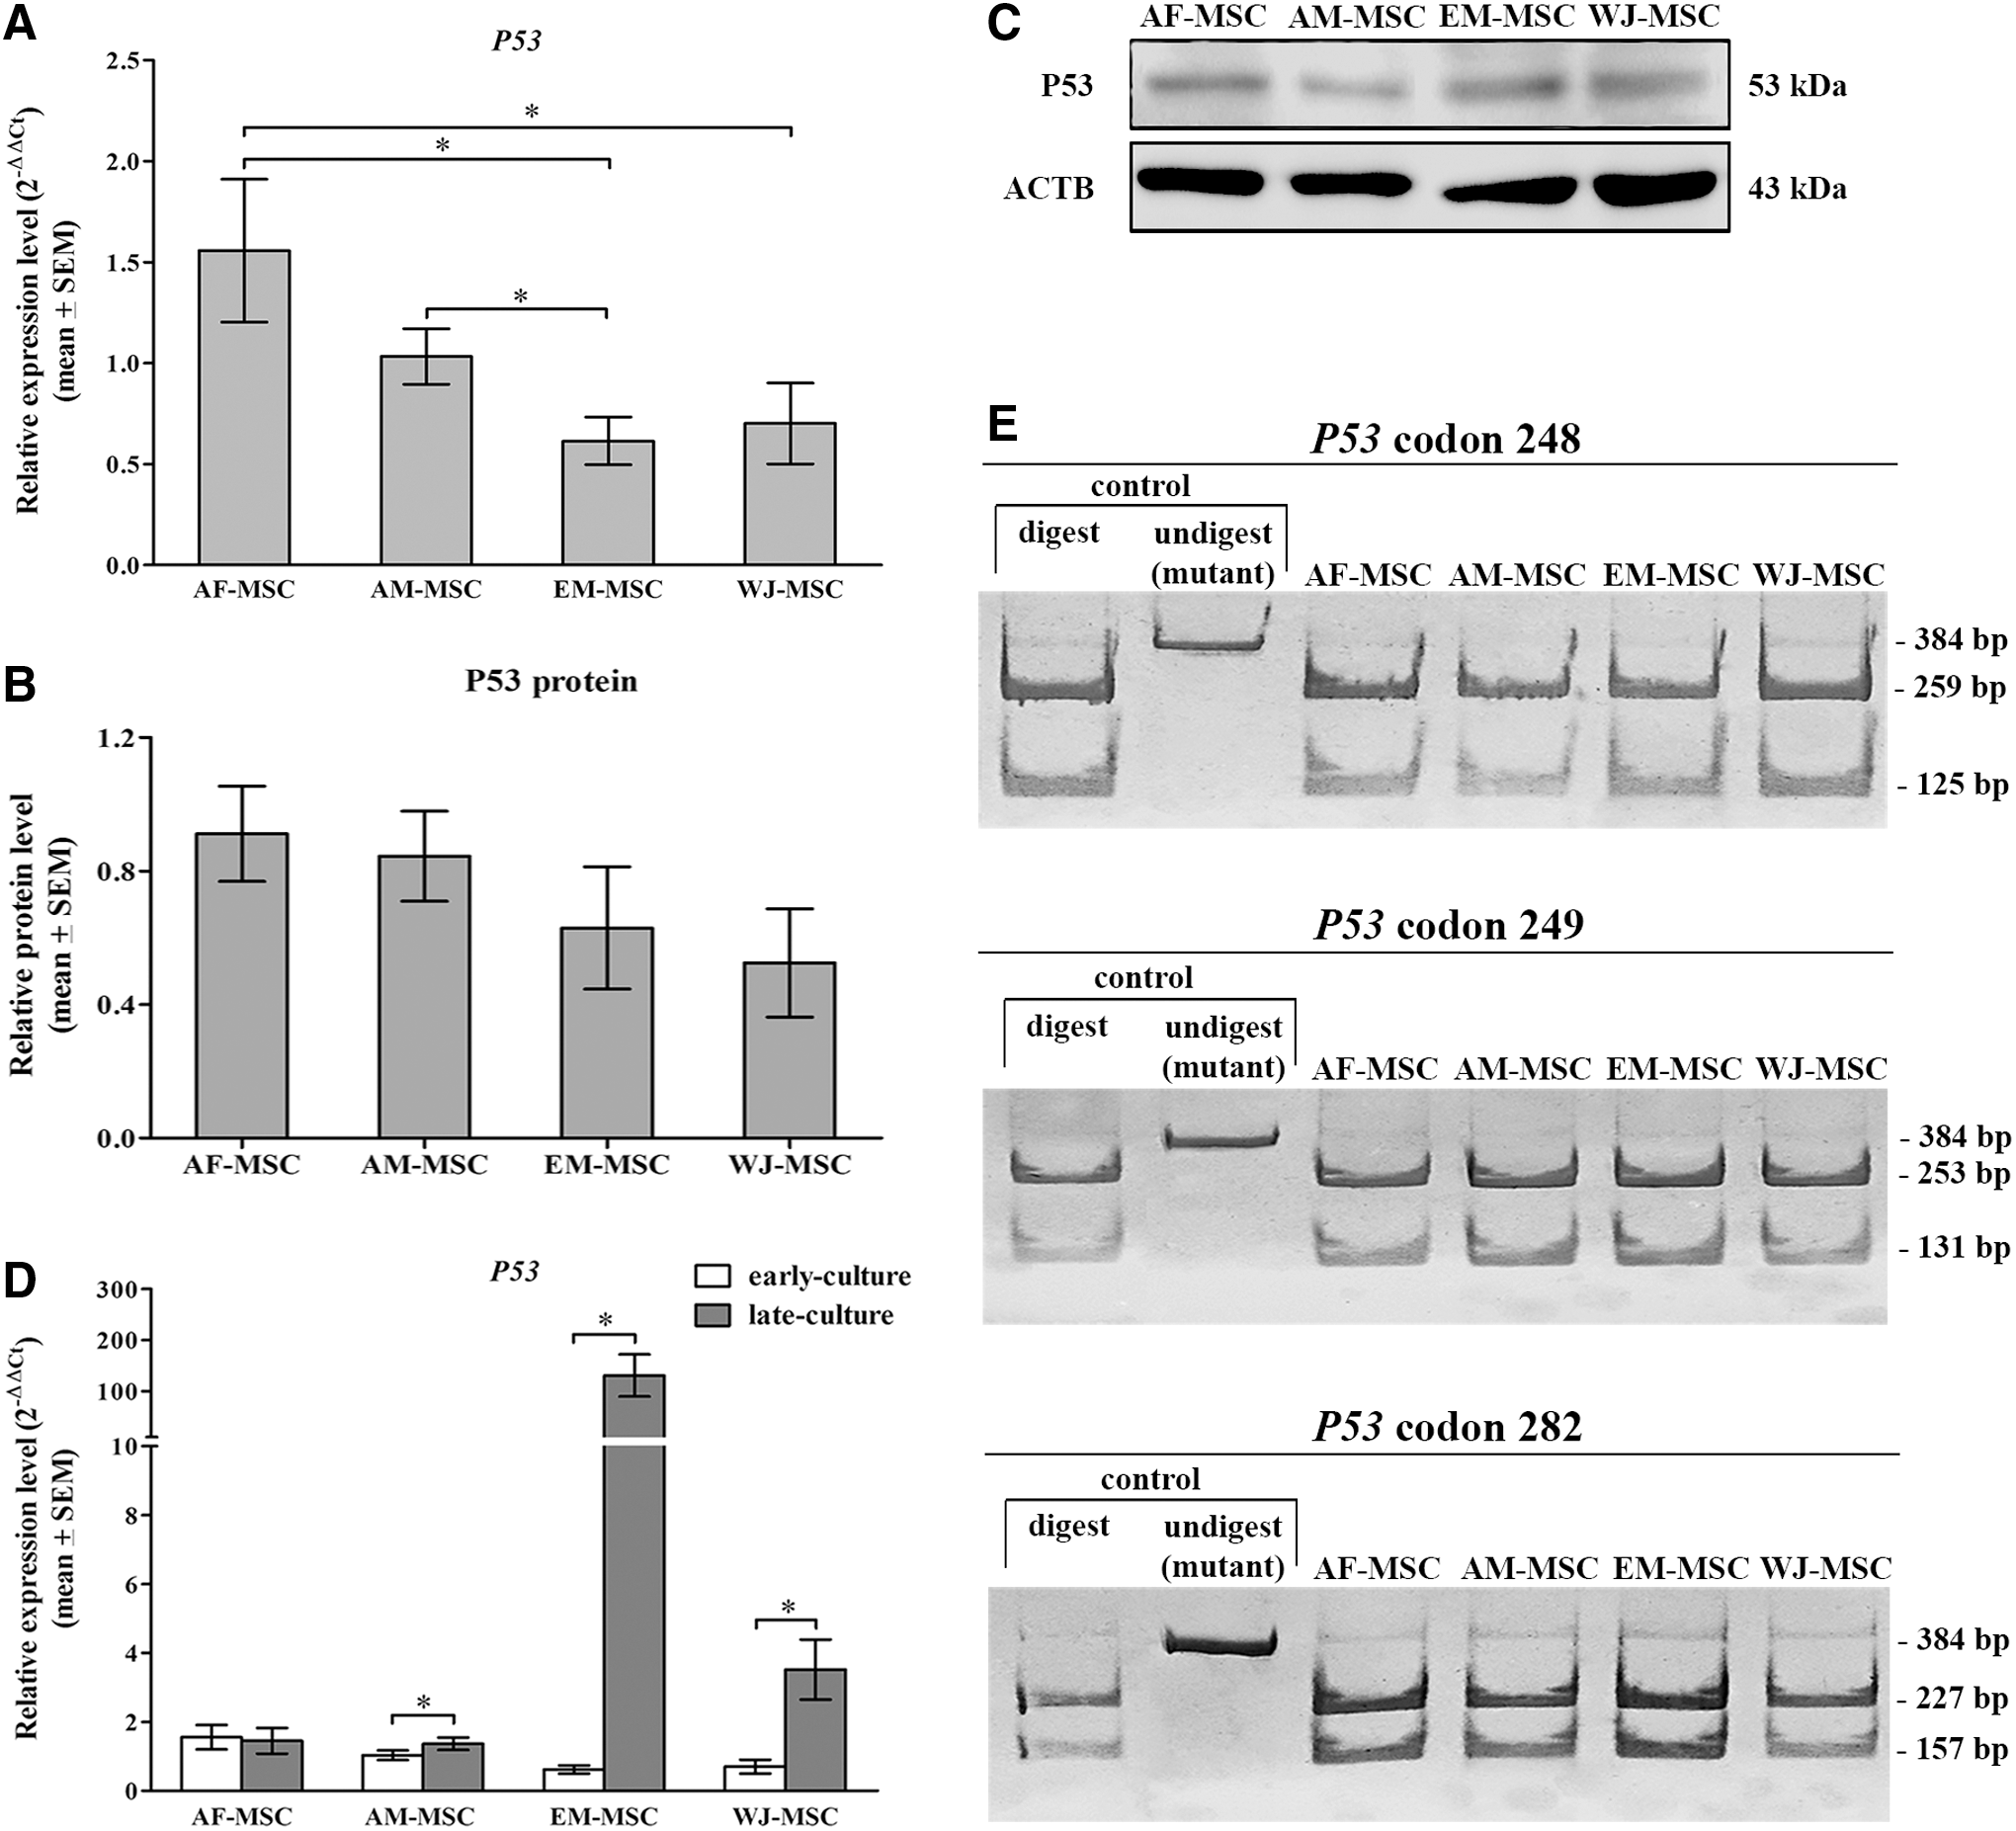
P53 expression and mutation.
For investigating the stability of P53 expression levels for long-term culture, each MSC line at early and late culture was examined and compared for P53 expression levels. We found variation of P53 in AM-MSC, EM-MSC, and WJ-MSC at the late culture. They showed a significantly higher level of P53 expression at the late culture than the early culture (P < 0.05). Only AF-MSC can maintain a stability of P53 level for long-term culture. The greatest difference in P53 expression levels between early and late culture was observed in EM-MSC. The P53 expression in EM-MSC at late culture was a 100 times higher than the early culture. Comparison of P53 expression levels in early and late culture within each MSC type is shown in Fig. 2D.
P53 missense mutations were studied in all MSC lines derived from four different cell sources. The mutation was identified by single base-pair substitution at the codon 248 and 249 on exon 7 and at the codon 282 on exon 8. PCR product from individual MSC lines was enzymatically digested with specific restriction enzyme. Nucleotide on a typical sequence was enzymatically digested into fragments, whereas SNP mutation on target codon showed undigested nucleotide sequence on acrylamide gel electrophoresis. Our result demonstrated that all studied MSC lines at the late culture did not show SNP mutation on the codon 248, 249, and 282 (Fig. 2E).
From our results, we demonstrated that AF-MSC has a higher P53 expression level than AM-MSC, EM-MSC, and WJ-MSC. Moreover, AF-MSC also can stabilize the P53 expression level throughout long period of in vitro culture, whereas AM-MSC, EM-MSC, and WJ-MSC were found to vary from the P53 gene expression level.
Epigenetic stability in MSC
To analyze epigenetic fidelity in AF-MSC, AM-MSC, EM-MSC, and WJ-MSC, the IGF2- and H19-imprinted genes were used in the study. IGF2- and H19-imprinted genes were utilized for messenger RNA (mRNA) expression analysis in MSC at the early culture (P4) and late culture (P10–P14) using quantitative real-time RT-PCR.
For IGF2 investigation, we observed the expression levels of IGF2 among four different types of MSC and between the early and late culture within each MSC type. We found variation of IGF2 expression levels among MSCs in different types. AF-MSC and EM-MSC showed a high expression of IGF2 in the early culture. The expression level of IGF2 gradually declined with the repeat subculture passage, whereas high level of expression was retained in AF-MSC throughout the long period of culture. At early and late culture, we found that AF-MSC exhibited the highest IGF2 expression level, whereas AM-MSC was found to have the lowest level of expression. AF-MSC showed a significantly higher IGF2 gene expression level than AM-MSC (P < 0.001), EM-MSC (P < 0.001), and WJ-MSC (P < 0.001), whereas a comparable IGF2 expression level was observed in AM-MSC, EM-MSC, and WJ-MSC. The difference in IGF2 expression among four MSC types at the early and late culture stage is shown in Fig. 3A. In observing IGF2 with repeated passage at the early and late culture within each type of MSC, we found that the high IGF2 expression in AF-MSC and EM-MSC at early culture declined by subsequent subculture passage. The significant differences of IGF2 expression levels were found between early and late culture passage of AF-MSC (P < 0.001) and EM-MSC (P < 0.001) (Fig. 3B).

Epigenetic expression. Gene expression analysis was performed for H19 and IGF2 genes with real-time RT-PCR.
For our investigation of H19, the expression levels of H19 among different MSC types and between the early and late culture within each type of MSC were determined. Among four types of MSC, H19 expression levels of AF-MSC, AM-MSC, and EM-MSC showed a comparable level, whereas WJ-MSC displayed a variation of H19 expression among individual WJ-MSC lines. Two of 10 WJ-MSC lines exhibited a high overexpression of H19 in early culture. However, we applied the allelic expression study to these two WJ-MSC lines to examine for the loss of H19 imprinting. The enzymatic digestion was performed using the Rsal restriction enzyme and demonstrated a monoallelic expression pattern of H19 in these samples at both early and late culture. The levels and pattern of H19 expression of four types of MSC at the early and late culture expression are shown in Fig. 3C. While observing H19 with repeated passage at early and late culture within each type of MSC, we saw no significant difference of H19 expression among early and late culture. The H19 expression in four types of MSC is displayed in Fig. 3D.
Discussion
The P53 tumor suppressor gene is known as the gene that acts to minimize genetic lesion and protect MSC transformation to cancer stem cells. Mutation and loss of activity of the P53 gene in MSC can result in MSC loss of quality by prohibiting terminal cell differentiation [16], as the MSC cannot develop toward specific differentiation. The differentiated MSC accumulated in early or intermediate progenitors or aged MSC with a carried genomic defect, originate MSC tumors [16]. Moreover, MSC with mutated P53 has been found to have a tumor-promoting effect [32].
In this study, we monitor the P53 mutation and gene expression patterns of four MSC types, which are of high promise for medical therapy, including AF-MSC, AM-MSC, EM-MSC, and WJ-MSC, during in vitro culture. The experiment was designed to investigate the P53 gene activity and stability by levels and patterns of gene expression in MSC, which was expanded in vitro for short term and long term. The reliability of the P53 gene was examined by missense mutation analysis on the critic codons, which have been found to have a high frequency of mutations in various human cancers [16,18,33 –35].
From our study, AF-MSC and AM-MSC sustained stable P53 expression levels throughout long periods of culture. AF-MSC were found to express the highest level of P53 gene and protein among four types of MSC, with no missense mutation. This indicated the great safety of AF-MSC for therapeutic purposes as it had the lowest chance of AF-MSC transformation.
The phenomenon of high P53 expression level observed in all AF-MSC lines may be explained by the route that MSC takes throughout the period of fetal development. The P53 gene not only plays a critical role in controlling apoptosis and cell cycle arrest when the cell is exposed to stress-inducing conditions but is also of crucial importance for cell proliferation and differentiation, and DNA repair [14,16,36]. At a period of 16–20 weeks of gestation, fetal cells promote proliferation and differentiation for fetal growth and organ development. An accelerated P53 gene can be expanded for fetal genomic stability and fidelity. This idea was supported by our result of AF-MSC proliferation capacity as observed in a very low PDT during AF-MSC expansion.
Moreover, an IGF2-imprinted gene, which has been known to accelerate cell proliferation, also showed high expression in AF-MSC. In our study, AF-MSC showed a high level of IGF2 with a stable pattern and level of H19. Furthermore, another crucial function of P53 gene is supporting cell differentiation and embryogenesis and promoting the expression of transcription factor that assists in organ development [9]. MSC with P53 gene defect can lose the capability to achieve terminal specific differentiation. The importance of the AF-MSC source is in the period of organogenesis of the fetus, as the P53 gene can accelerate the expression to support fetal development. This idea was supported by the high expression level of P53 gene in human ESC. In the ESC, P53 not only functions in program cell death but also has crucial functions to force cell differentiation [14]. A high level of P53 in AF-MSC can be increased for genomic stability and epigenomic fidelity, avoiding MSC transformation, and for cell capability, high proliferation and differentiation ability. This emphasizes the efficiency, quality, and safety of AF-MSC at a genetic level to focus on AF-MSC as an MSC source for therapeutic uses.
AM-MSC, EM-MSC, and WJ-MSC have been rooted from differentiated organ tissues. Their cell proliferation continues through asymmetric cell division, which gives rise to one daughter MSC and one transit cell. Their fate in cell propagation needs strict control by the niche [37]. The function of P53 in these MSC is to translate stress signals for program cell death, which results in senescence and cell cycle arrest. AM-MSC, EM-MSC, and WJ-MSC therefore achieved a high P53 gene expression level in MSC at the late culture and were significantly different to levels in early-cultured MSC. This is consistent with our results of their proliferation ability, which subsequently decreased in repeated subculture passages by PDT calculation and into senescence in some MSC lines in the late culture.
From our data, we found that 1 of 10 AM-MSC, 3 of 10 WJ-MSC, and 1 of 10 EM-MSC were observed in the upregulating of H19 expression at early culture, but not at the late stage. If H19 is the gene prohibiting the overexpression of IGF2, a variation in of H19 expression needs to be focused on the function of cancer formation. The P53 gene was not found in the variation of expression patterns in four MSC types. High expression of the P53 gene was found in five EM-MSC lines at the late culture, related to arresting cell proliferation as observed by the incidence of high PDT calculation. From these finding above, we suggest that the incidence of genomic instability and infidelity can occur any time during in vitro culture of MSC, thus P53 mutation and epigenetic monitoring should be candidates screening for MSC for cell therapy.
Mutations of P53 have been found in a variety of base sequences and gained newly discovered mutations over time. The mutations on P53 gene can transcribe P53 protein, which can lose the tumor suppressor function and also gain oncogenic function [18,33,34,38]. P53 mutations occur in almost every type of cancer at rates from 38% to 50% in ovarian, esophageal, colorectal, head and neck, larynx, and lung cancers [33]. P53 mutation prevalence in human cancer accessed through IARC TP53 Database compiles all TP53 gene variations. Almost 400 codon-defined mutations have been discovered in the P53 gene [31,39]. On the coding sequence, 86% of mutations were mainly found on the DNA binding domain between codons 125 and 300 (exon 5–8). Most of them are missense (87.9%).
On the contrary, outside this region, missense mutations represent only about 40%. The mutations are mostly nonsense or frameshift [33]. In our investigation of the P53 mutation, we considered the mutations on codons 248, 249, and 282 to estimate mutation phenomena in in vitro cultured MSC, as regard to its high incidence of P53 mutation of these three codons in various human cancers [35,40]. One of the hotspot codons for P53 mutation is codon 248, which has been found to have the highest incidence of mutation, 6.7 times higher, as related to other mutated codons [39]. The codon 249 mutant DNA, frequently induces G:C to T:A transversions and in cooperation with the hepatitis B virus (HBV) or hepatitis C virus (HCV), is a biomarker of liver tumor [40]. The codon 282 on P53 tumor suppressor gene has been found to have a higher incidence of mutation at 2.5 times that of other mutated codons.
The high incidence in P53 mutation is primarily affecting the DNA domain of protein on exon 7 and 8. Among single-base mutations that occurred in the P53 tumor suppressor gene, about 25% are C:G substitutions at the sites of cytosine-guanine dinucleotides (CpG). About 3%–5% of cytosines in the human genome are methylated at position 5′ with a mechanism of DNA methylation of epigenetic system. The methylation strictly occurred on CpG dinucleotides by the DNA methyltransferase enzyme. The 5′-methylcytosine (5mC) is less stable than cytosine and undergoes spontaneous deamination into thymine. From almost 400 codons that have been found to have the incidence of mutation on the P53 gene, only six codons (codon 175, 245, 248, 249, 273, and 282) are hotspots for highly frequent mutation. Four from six of these hotspot codons represent CpG mutations [33,35,40]. The mutation at CpG sites on the P53 gene can reflect the loss of DNA methylation in the CpG Island in that region, leading to instability and imbalance of epigenetic system in MSC.
Epigenetic imbalance, especially loss of DNA methylation, results in mutation accumulation and has been widely found in many cancers [26 –28,41]. In our study, H19 was considered a representative of the imprinted gene, because of its specific expression characteristics. H19 gene not only generates a noncoding mRNA, which allows it to easily accumulate alterations, but also governs the activity and function of another imprinted gene, IGF2. Loss of methylation on the methylated specific regions on the H19 gene brings about overexpression of H19 gene and loss of function to block the overexpression of IGF2 gene. Loss of imprinting of H19 and IGF2 displayed biallelic expression, which can double the level of expression and reported in various cancers [26 –28,42]. Overexpression of H19- and IGF2-imprinted genes is a crucial phenomenon involving initiation and growth of cancer.
From our results in this work, we found that AF-MSC showed the greatest MSC quality and characteristics among other MSC types. Not only has it carried a constant expression level of a genomic guardian P53 gene at a high level for a long period of in vitro cultivation, but also showed a superiority of cell propagation to AM-MSC, EM-MSC, and WJ-MSC. This is consistent with the report by Poloni et al., [43], who investigated the activity of telomere, oncogenes, and the P53 tumor suppressor gene in AF-MSC. They demonstrated the safety of AF-MSC with the necessity of finding a constant P53 expression and normal karyotype throughout long-term expansion.
From our results and the above information, we suggest that every in vitro MSC preparation for clinical applications and MSC line derivation be identified for the mutation, which may be especially important to clarify the cancer risk on P53 mutations and imprinted IGF2/ H19 gene alteration, and to make safe use of MSC in medical therapy.
Footnotes
Acknowledgments
This work was funded by Siriraj Hospital (Bangkok, Thailand) and the National Research Council of Thailand. The authors are grateful to Peter A. McGuin and Leslee Sinclair for article editing.
Author Disclosure Statement
No competing financial interests exist.