




Abstract
Embryonic stem cells typically show properties of long-term self-renewal and lack of differentiation. When appropriately stimulated, they are able to differentiate into all cell lineages, and lose their self-renewal characteristics. These properties are controlled by a series of genes encoding several transcription factors, including OCT4, the product of POU5F1 gene. OCT4 is expressed in germ cell tumors but also aberrantly in cancers developing in differentiated tissues. In a previous study, we observed a high expression of OCT4 in acute myeloid cell lines and primary cells, regardless of the acute myeloid leukemia (AML) subtype. In this study, we investigated the putative oncogenic role of OCT4 in proliferation and differentiation arrest. OCT4 expression was assessed in a panel of myeloid cell lines, together with clonogenic and proliferation properties, before and after differentiation in the presence of retinoic acid (RA). Same experiments were performed under short hairpin RNA (shRNA)-mediated OCT4 inhibition. In the presence of RA, we observed a decrease of OCT4 expression, associated with a loss of clonogenic and proliferation capacities, cell cycle arrest, and upregulation of p21, in HL60, NB4, KASUMI, and Me-1 cell lines. This effect was absent in the KG1a cell line, which did not differentiate. Downregulation of OCT4 by shRNA resulted in the same pattern of differentiation and loss of proliferation. Although KG1a did not differentiate, a decrease in proliferation was observed. Our findings suggest that OCT4 is implicated in the differentiation arrest at least in some types of AML, and that it also plays a role in cell proliferation through different oncogenic mechanisms. OCT4 might be a potential new target for antileukemic treatments.
Introduction
A
Self-renewal and lack of differentiation are also features of embryonic stem cells (ESC), controlled by specific transcription factors known as “Yamanaka's factors,” including OCT4, the product of the POU5F1 gene. OCT4 can transform differentiated cells into pluripotent stem cells with embryonic properties [3]. Its expression is essential for self-renewal, pluripotency, and maintenance of dedifferentiation [4 –7]. Reinduction of OCT4 expression in skin fibroblasts induces their direct redifferentiation into hematopoietic cells without going through the ESC stage [8].
Moreover, POU5F1/OCT4 is also a newly identified proto-oncogene that serves as a marker of aggressive disease. An abnormal expression has been reported in a variety of solid tumors, in which it induces pluripotency and suppresses differentiation [9,10]. A strong expression of OCT4 was observed in recurrent prostate cancer [11]. In patients with head and neck squamous cell carcinoma, increased expression of OCT4, resulting from the activation of the cytoplasmic/nuclear β-catenin pathway, was associated with a worse prognosis [12]. Concerning hematological malignancies, a more limited number of data are available. Yin et al. described a high expression of OCT4 by quantitative polymerase chain reaction (qPCR) in a series of 87 patients with AML at diagnosis [13], with a trend for worse prognosis in patients exhibiting the highest levels.
In a recent study, we have shown by flow cytometry a high expression of ESC markers, including OCT4, in AML at diagnosis. OCT4 levels were higher in the immature leukemic compartment (CD34+CD38− cells), which contains LSCs [14]. In the present study, we evaluated the putative role of POU5F1/OCT4 in myeloid differentiation, cell proliferation, and clonogenic capacities of OCT4-positive AML cell lines that were selected to represent various stages of differentiation. To this end, we compared the effects of exposure to all-trans retinoic acid (ATRA) to those of OCT4 downregulation by short hairpin RNA (shRNA).
Materials and Methods
Cell lines
HL60, KG1a, KASUMI, and Me-1 human cell lines were cultured in RPMI-1640 medium (Eurobio, Les Ulis, France) supplemented with 10% fetal bovine serum (FBS) (Eurobio) or 20% for Me-1. NB4 was cultured in Iscove's Modified Dulbecco's Medium (ISCOVE) (Sigma Aldrich, St Louis) supplemented with 10% FBS. Experiments were performed during the exponential growth phase. Cell lines were obtained from American Type Culture Collection (ATCC, Manassas, VA).
Flow cytometry
Antigen expression
After washing in phosphate-buffered saline (PBS) containing 0.5% bovine serum albumin (BSA) and 0.09% azide (AZ), cells were resuspended in PBS/BSA/AZ. 106 cells were incubated with antibodies to membrane differentiation antigen (CD34 and CD11b) for 15 min at room temperature, in the dark. For intracellular staining of OCT4, cells were then fixed (BD Cytofix Fixation Buffer; BD Biosciences, San Jose), permeabilized with a solution of PermWash Buffer (BD Perm/Wash Buffer; BD Biosciences), and incubated with the antibody for 20 min at room temperature in the dark. Three isoforms of OCT4 have been described (OCT4A, OCT4B, and OCT4B1) [15]. These variants are reported to be stem-cell specific, but only OCT4A can be directly functionally linked to pluripotency [16]. We used the 40/OCT3 clone which specifically recognizes OCT4A and OCT4B isoforms. Finally, cells were resuspended in PBS/BSA/AZ before flow cytometry analysis.
Nonspecific binding of antibodies was assessed in experiments using an isotype control. Details of antibodies (sources, clones, fluorochromes) are detailed in Table 1.
Samples were acquired on a FACSCanto II cytometer (Beckton Dickinson [BD Biosciences]) and FACSDiva software version 1.7 (BD Biosciences). Analyses were performed using Infinicyt software version 1.6. (Cytognos, Salamanca, Spain). Doublets and debris were excluded with the window FSC/SSC. 7-AAD (BD Pharmingen, CA) was used to exclude nonviable cells. Results were expressed as the ratio of mean fluorescence intensities (MFIs) of marker of interest to MFI of the relevant isotype control.
Untreated and treated cell analyses were performed on six separate experiments and results are shown as mean ± SD.
Cell cycle
The technique was adapted from the protocol provided by Abcam laboratory (#ab139418; Abcam, Cambridge, UK). In brief, after washing in PBS/BSA/AZ, cells were fixed in 500 μL cold Ethanol 70% during 30 min at 4°C, permeabilized with 100 μL Triton X-100 0.2%, and incubated with the antibodies to p21 and Ki67 for 20 min at 4°C. Finally, cells were resuspended in 250 μL of mix staining (200 μL propidium iodide (PI) (BD Biosciences), 5 mg ribonuclease (Sigma Aldrich), and 10 mL PBS. Annexin-V/PI (BD Pharmingen) staining was performed in parallel to evaluate the percentage of the apoptotic cells.
Quantitative reverse transcription polymerase chain reaction
Quantitative reverse transcription polymerase chain reaction (qRT-PCR) was used to measure the expression levels of POU5F1, NANOG, SOX2, and CDX2 (Table 2).Total RNA was extracted using a phenol/chloroform extraction method. RNA concentration was determined by spectrophotometry using a Nanodrop ND-1000 (Nanodrop Technologies, Wilmington). RNA integrity was assessed with the Agilent 2100 Bioanalyzer with a RNA 6000 Nano LabChip kit (#5067-1511; Agilent Technologies, CA). Complementary DNA (cDNA) was synthesized using 1 μg of RNA and subjected to quantitative PCR using 7900HT Fast Real-Time PCR System (Applied Biosystems, CA) with the following settings: 50°C for 2 min and 95°C for 10 min, followed by 50 cycles at 95°C for 15 s and 60°C for 1 min. Primers were obtained from Applied Biosystems. All reactions were performed in duplicate six times with 20 μL TaqMan Universal PCR Master Mix (Applied Biosystems) containing 5 μL of cDNA. The HMBS gene was used as endogenous control to normalize expression data. This gene has been demonstrated to be weakly expressed in stem cells and is adequate for qRT-PCR studies [17]. The relative gene expression in untreated and treated cells was determined by the comparative Ct (2−ΔΔCt) method with the software SDS 2.3.
Differentiation
Cells were differentiated using cis-trans-retinoic acid (RA) (R4643, 10 mM; Sigma Aldrich) and ATRA (R2625, 10 mM; Sigma Aldrich). To do so, 4 × 10⁶ cells/mL were seeded in T-25 flasks in presence of 80 μL RA (10 μM final concentration) during 7 days at 37°C. After differentiation, we performed flow cytometry and clonogenic assays on untreated cells (control) and treated cells. Differentiation analyses using ATRA and RA were performed on six separate experiments.
Clonogenic assay
Thousand two hundred fifty cells/dish were plated in methylcellulose medium H4434 (StemCell Technologies) and cultured in fully humidified atmosphere with 5% CO2 at 37°C for 15 days. CFU-G colonies for untreated and treated cells were then numbered using inverted microscopy (Zeiss). Clonogenic assays were performed on six separate experiments.
WST-1 assay for cell proliferation
2-(4-iodophenyl)-3-(4-nitrophenyl)-5-(2,4-disulfophenyl)-2H-tetrazolium, monosodium salt (WST) (Roche Meylan, France) was used for the measurement of cell proliferation [18]. In brief, leukemic cells were seeded at 4 × 10³ cells/well in 96-well plates and 10 μL WST was added to each well for subsequent 4 h incubation at 37°C and 5% CO2. Then, absorbance was recorded at 450 nm using a microplate reader. Results from pure culture medium wells without cell inoculation and untreated cells were respectively used as blank control and control. Each condition was assayed six times. The cell proliferation percentage in each group (differentiated and inhibited cells) was calculated by comparison to the control (untreated cells).
shRNA vectors and production of viral particles
We used MISSION shRNA strategy from Sigma Aldrich, consisting of bacterial glycerol stock harboring sequence-verified shRNA lentiviral plasmid vectors for human gene POU5F1 cloned into the pLKO.1-puro vector. For this study, we used mixed viruses containing five shRNA vectors targeting different sites of POU5F1 gene (SHCLNG-NM_002701) (Table 3). Sequences 4,879 and 4,881 specifically target the isoform B mRNA of POU5F1 whereas sequences 4,880, 4,882, and 4,883 specifically target the isoform A mRNA of POU5F1.
Each MISSION ShRNA clone was cloned within lentivirus plasmid vector, pLKO.1-puro, followed by bacterial transformation into Escherichia coli. For the production of viral particles, plasmids were transfected in HEK293 cells and medium supernatants were collected for virus purification by NucleoBond Xtra technology (NucleoBond Xtra Maxi EF, #740424.10; Macherey-Nagel, Düren, Germany). Titration for viral particles was performed using standard methods based on spectrophotometry at 260 nm (Nanodrop ND1000). A MISSION pLKO.1-puro Empty Vector Control Plasmid DNA (#SHC001; Sigma Aldrich) that does not contain shRNA insert was used as control. Functional titer (plaque-forming units) was determined with plaque assay on HEK293 cells.
ShRNA-mediated OCT4 inhibition
Leukemic cells (1 × 10⁵), cultured in serum-free RPMI-1640, were infected with shRNA-containing viral particles targeting OCT4 or SHC001-Control-shRNA at 5 MOI (Multiplicity of Infection, calculated as PFU/cell numbers), in a humidified atmosphere of 5% CO2 at 37°C. Medium was removed 8 h later and replaced with fresh RPMI-1640 medium containing 10% FBS. Cells were incubated for another 48 h. Inhibition analyses were performed on six separate experiments.
Western blot analysis
Protein concentration of cell lysates was quantified by the BCA Protein Assay Kit (Pierce). Twenty micrograms of proteins were separated on 4% to 15% sodium dodecyl sulfate polyacrylamide gel electrophoresis (SDS/PAGE) (Bio-Rad) and then were transferred into Hybond ECL membrane (GE Healthcare, UK). Membranes were blocked in TBS with 5% milk and 0.1% Tween-20 in TBS-T buffer for 1 h and then incubated with anti-OCT4 (Cell Signaling Technology) and antiactin antibody (Cell Signaling Technology) for 2 h. After washing, membranes were incubated with anti-mouse or anti-rabbit-HRP secondary antibodies (1:1,000; DAKO, Denmark) for 1 h. Finally, protein-antibody complexes were visualized by an enhanced chemiluminescence detection system (Clarity Western ECL Substrate [Bio-rad]). Signals were quantified by Image J version 1.6.0 software.
Statistical analysis
All data are presented as mean ± SD. Statistical significance was determined using t-test or analysis of variance (ANOVA) using the GraphPad Prism5 software (GraphPad, CA). P < 0.05 was considered as a statistically significant difference.
Results
Decreased OCT4 expression after ATRA differentiation
To evaluate the contribution of OCT4 in restraining LSCs differentiation, we assessed the expression of OCT4 in a panel of AML cell lines following differentiation induction. Differentiation was triggered in HL60, KG1a, NB4, KASUMI, and Me-1 cell lines by either RA (cis-trans) or ATRA treatment. Differentiation efficiency was assessed by following the expression of the differentiation marker CD11b by flow cytometry and morphologically by the presence of cytoplasmic grains (Fig. 1A, B). Results obtained with RA were similar to those with ATRA, except for NB4 cell line, for which there was no significant change following RA treatment. Thus, only results with ATRA treatment are presented.

Evaluation of CD11b and CD34 expression by flow cytometry. Representative flow cytometry diagrams and morphological changes after May-Grünwald-Giemsa coloration in
CD11b expression was significantly upregulated in differentiated HL60 (P < 0.001), NB4 (P < 0.01), KASUMI (P < 0.05), and Me-1 (P < 0.05) cell lines (Fig. 1B, D). Likewise, CD34 expression was significantly downregulated in differentiated KASUMI (P < 0.01) and Me-1 (P < 0.01) cell lines whereas it remained negative in differentiated HL60 and NB4, which are CD34-negative cell lines (Fig. 1B, E). By contrast, KG1a cell line did not differentiate as revealed by a low expression of CD11b and high expression of CD34. Interestingly, there was a concomitant significant decrease of the expression of OCT4 after differentiation with RA and ATRA in HL60 (P < 0.001), KASUMI (P < 0.05), Me-1 (P < 0.01), and NB4 (P < 0.05 for ATRA only), that was not observed in KG1a (Fig. 2A, C). These results were confirmed by qRT-PCR with a significant decrease of POU5F1 transcripts in KASUMI (P < 0.01), Me-1 (P < 0.001), and NB4 (P < 0.001), or even undetectable levels in HL60 after ATRA differentiation (Fig. 2B). CDX2, a transcription factor which cooperates with OCT4, was similarly downregulated after differentiation (Fig. 2B).
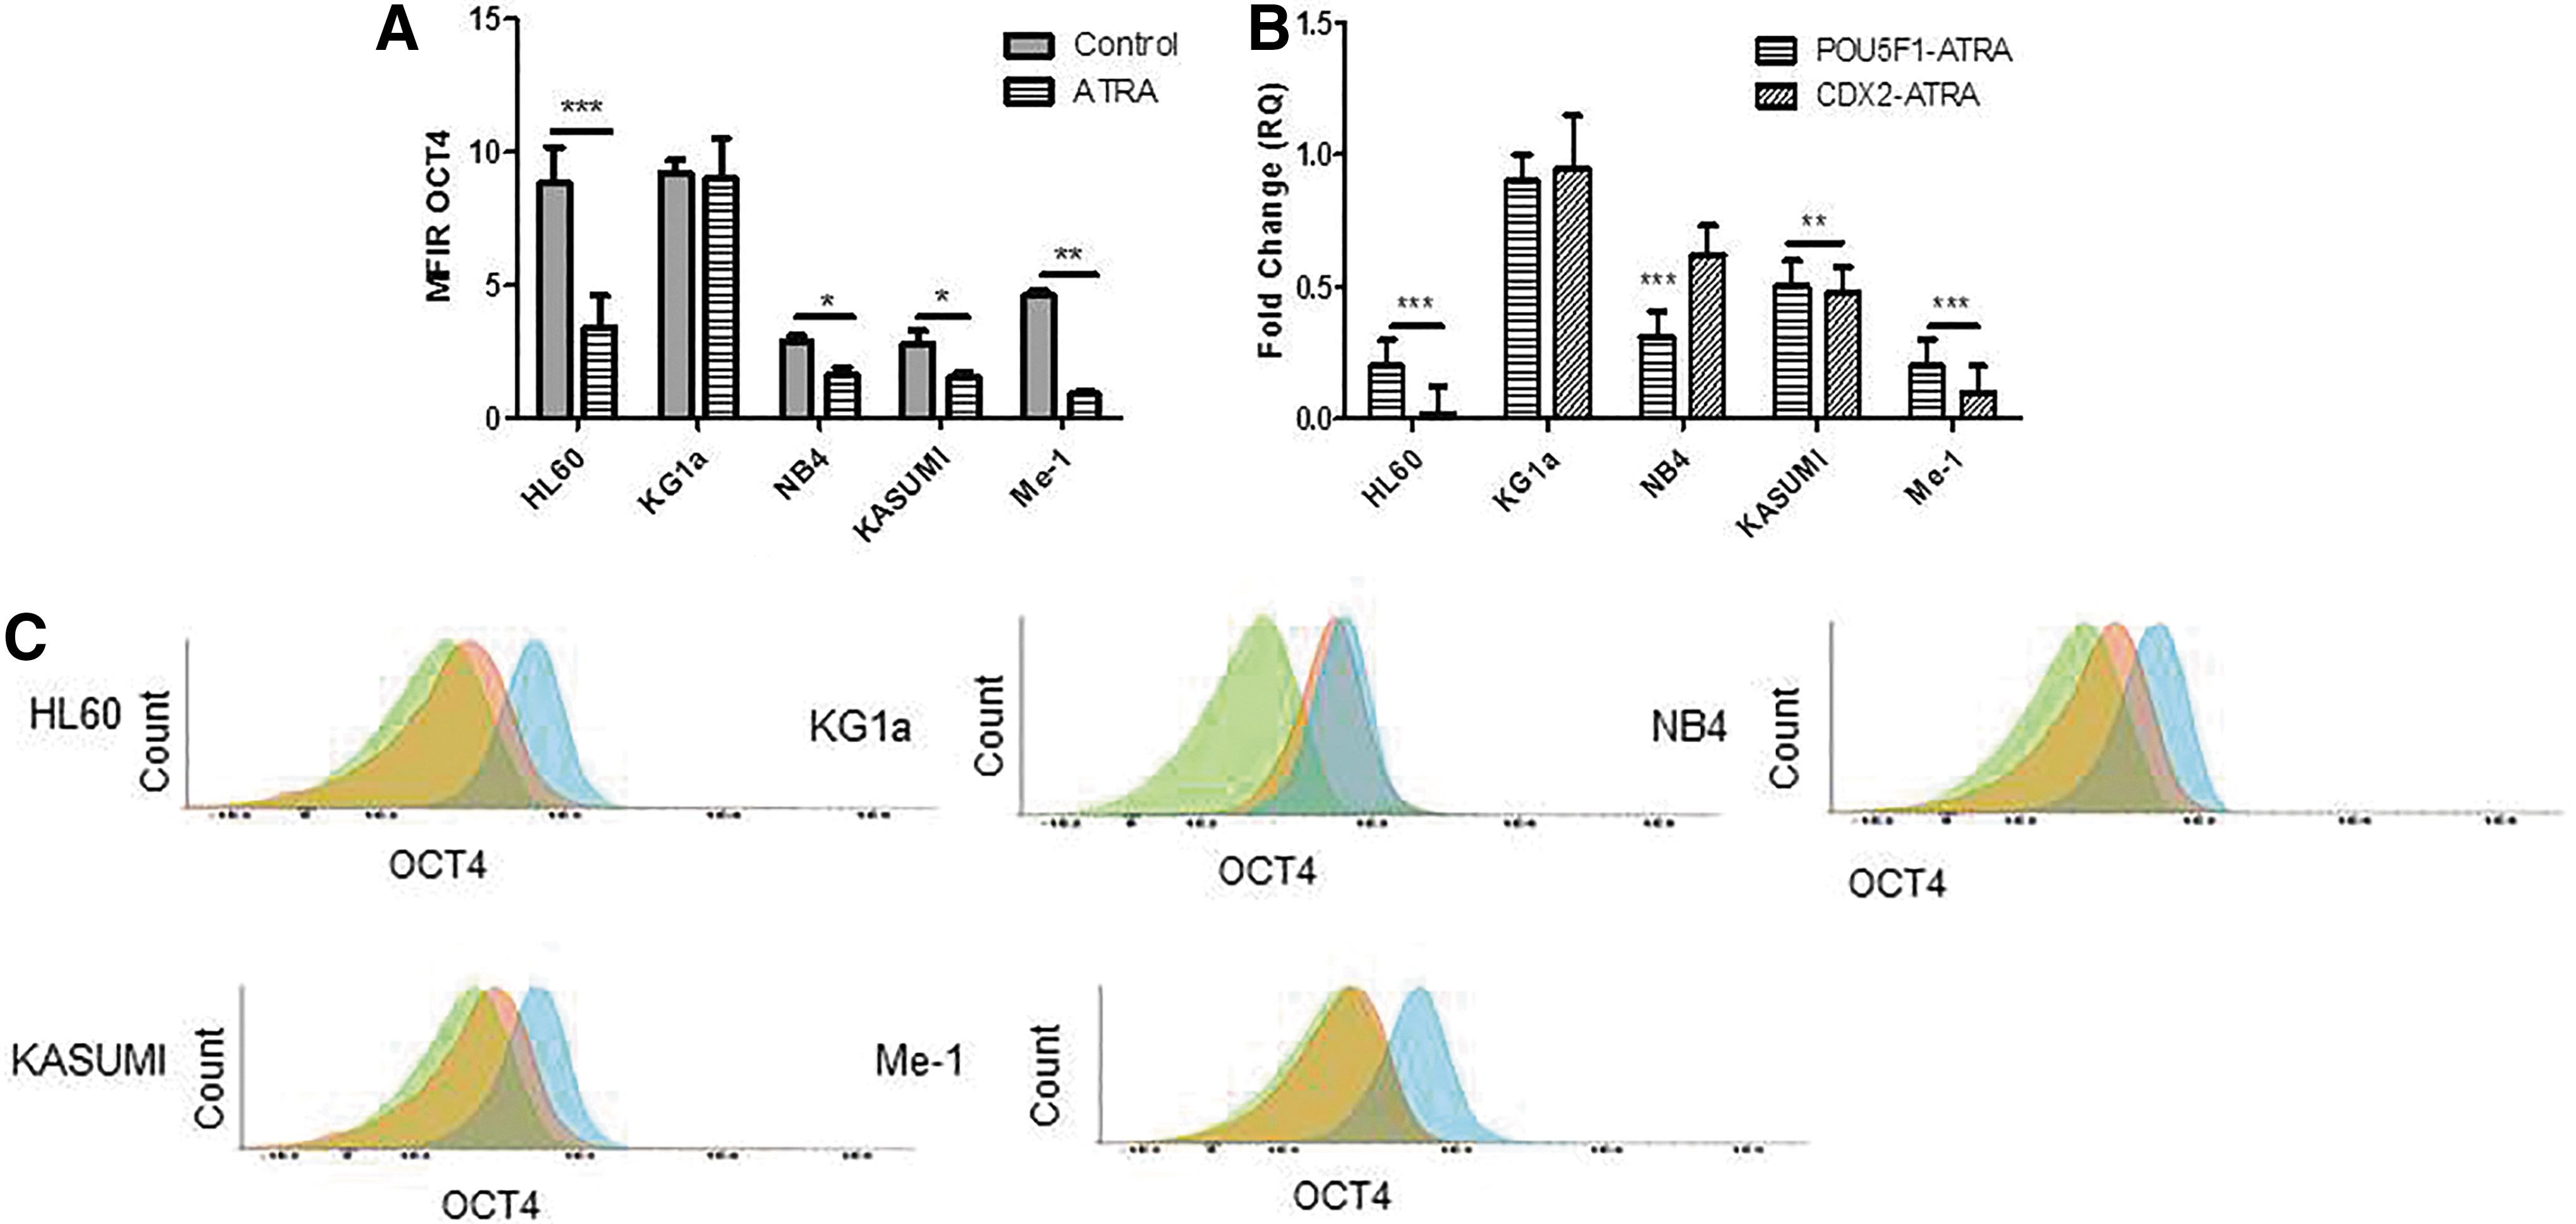
Evaluation of OCT4/POU5F1 and CDX2 expression by flow cytometry and qRT-PCR during differentiation.
Inhibition of OCT4 by ShRNA confirmed by qRT-PCR and flow cytometry
To substantiate these observations, OCT4 expression was inhibited using a shRNA strategy, and similar experiments were then performed to test the differentiation potential of the tested cell lines. Knockdown efficiency was assessed by qRT-PCR, multicolor flow cytometry, and western blot (Fig. 3). When the shRNA constructs were individually transfected, we could observe variable extent of downregulation of the OCT4 isoforms, at the protein level (Fig. 3F). Therefore, to potentialize the knockdown efficiency, we cotransfected the 5 shRNA constructs. At the mRNA level, POU5F1 expression was significantly decreased in all cell lines (Fig. 3A). At the protein level, OCT4 expression was also significantly reduced as revealed by flow cytometry (P < 0.001 for HL60 and KG1a, P < 0.01 for Me-1, and P < 0.05 for NB4 and KASUMI) (Fig. 3B) with an OCT4 fluorescence close to isotype control (Fig. 3E) and by western blot analysis (Fig. 3G).
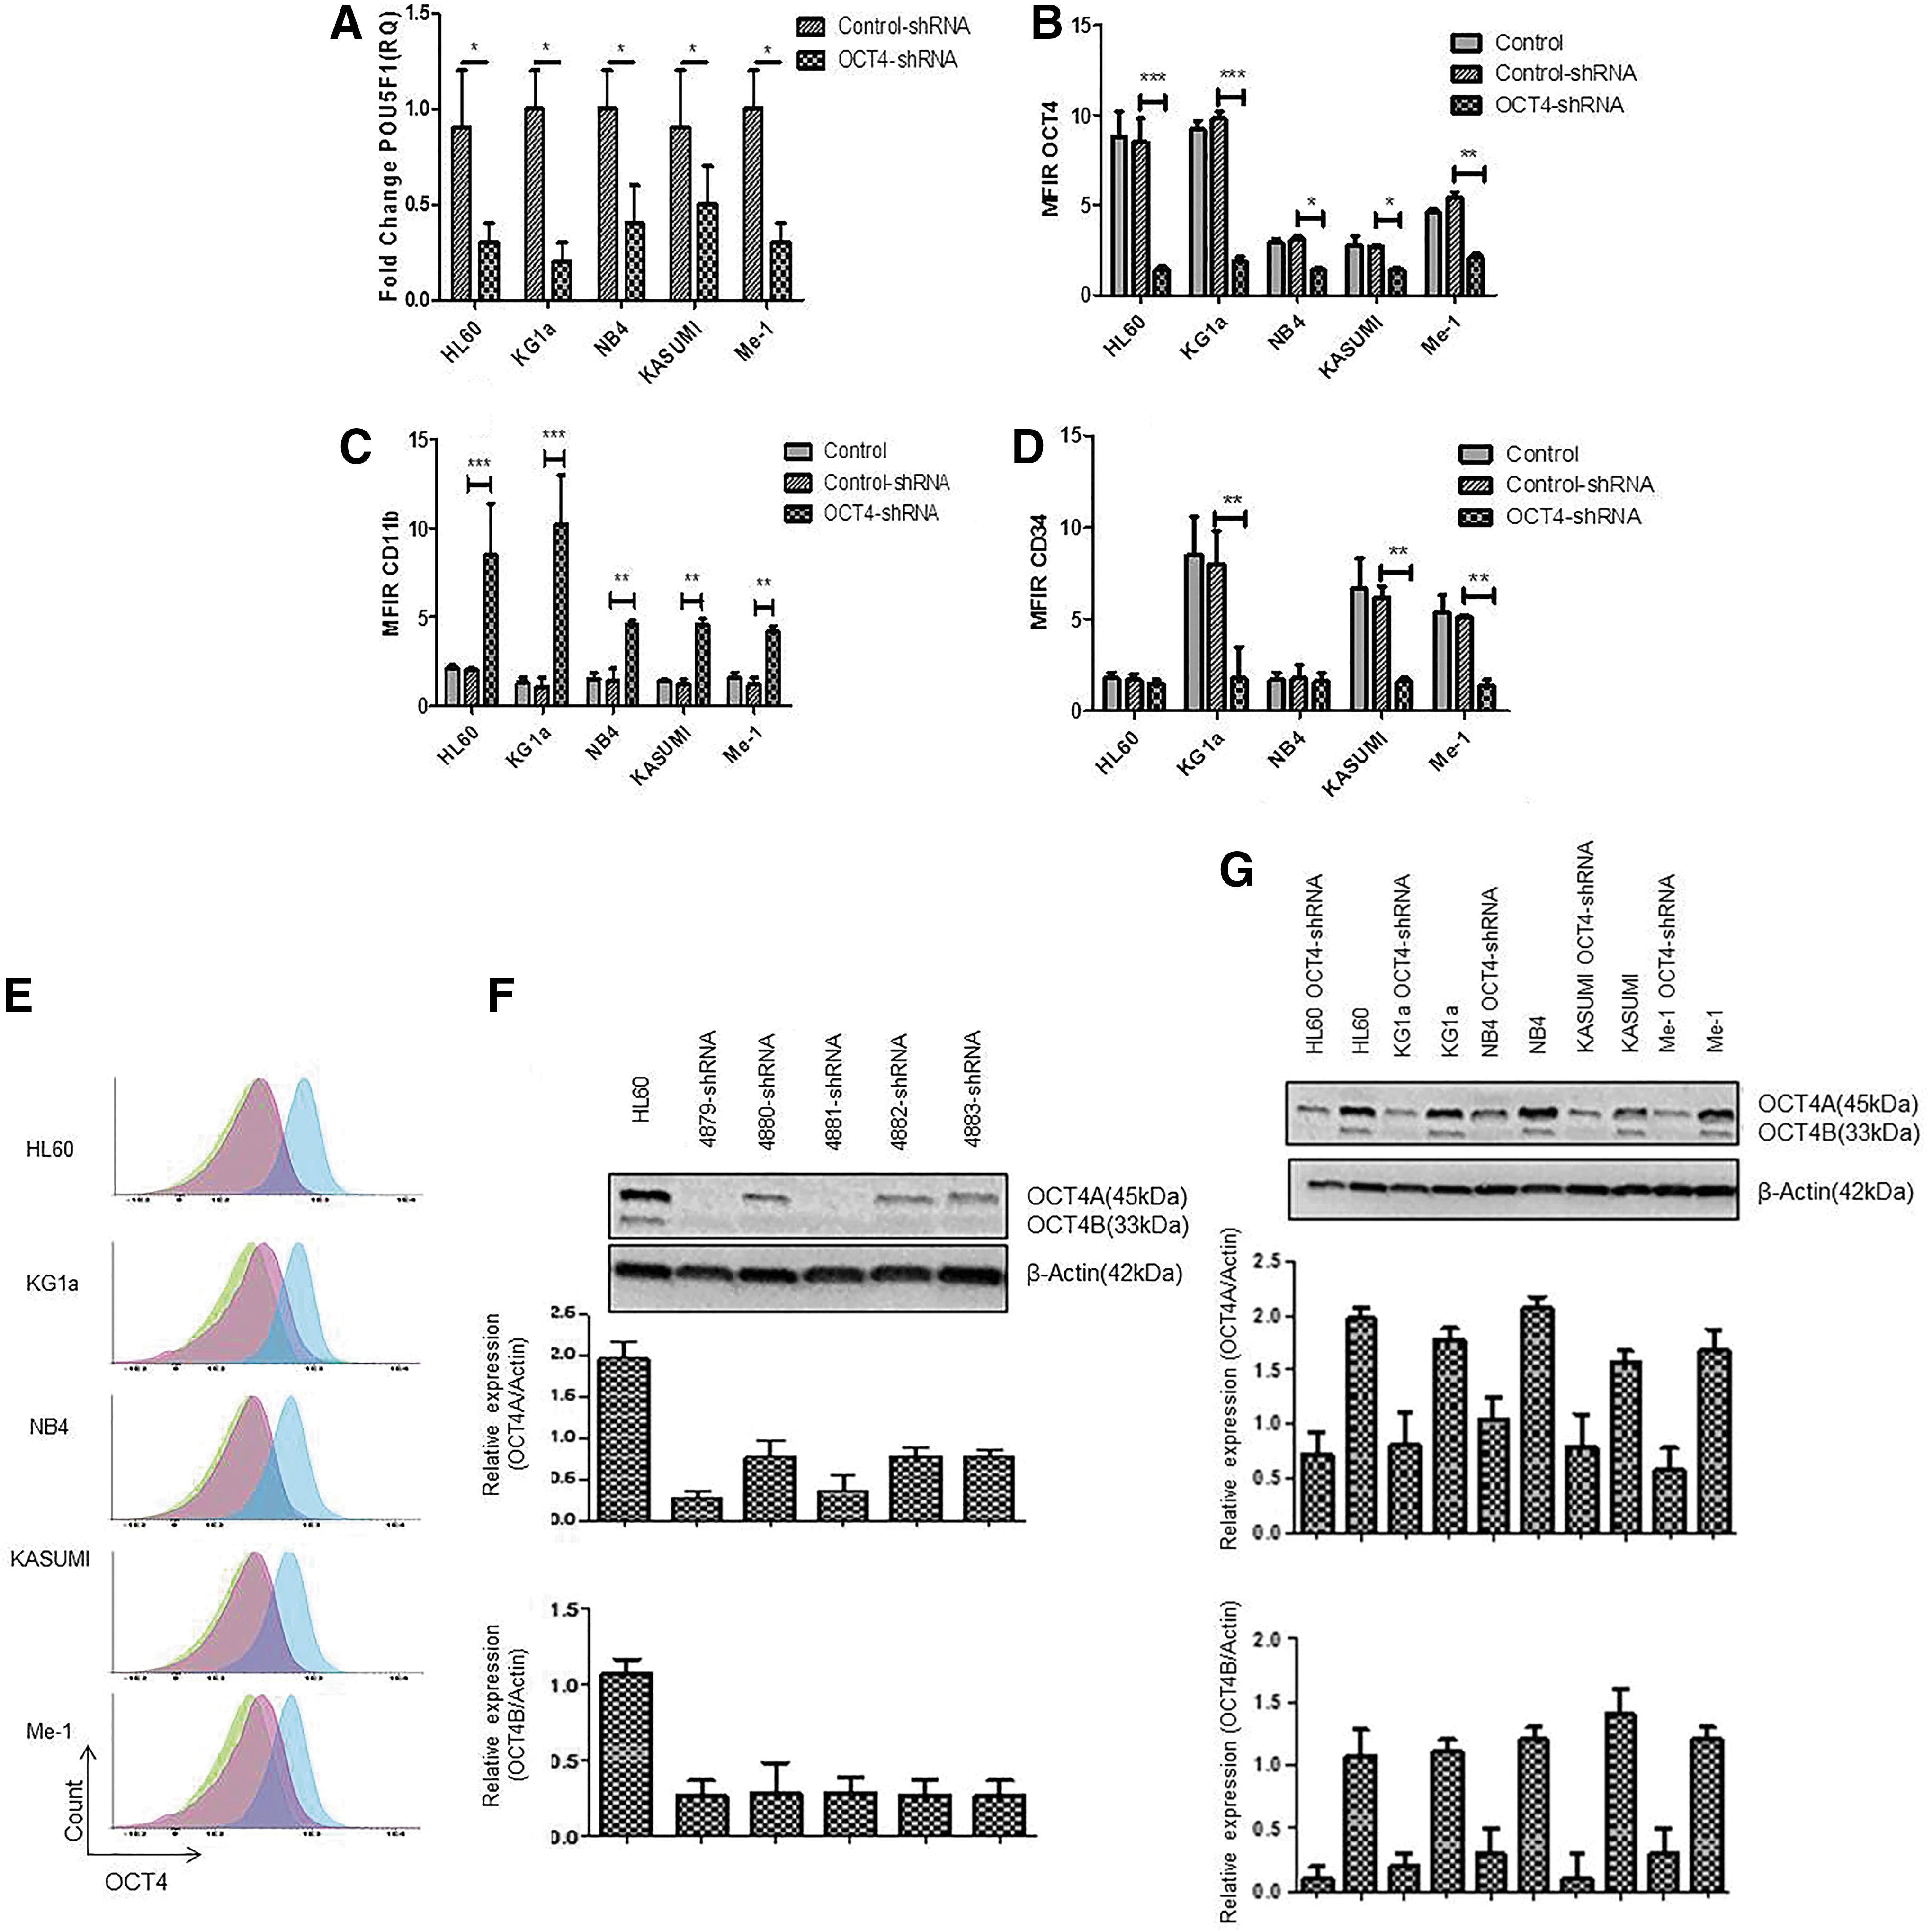
Evaluation of OCT4/POU5F1, CD11b, and CD34 expression by qRT-PCR and MFC after shRNA inhibition.
shRNA-mediated OCT4 inhibition was accompanied by a significant increase in CD11b differentiation marker expression for all leukemic cell lines (P < 0.001 for HL60 and KG1a and P < 0.01 for NB4, KASUMI, and Me-1) and a significant decrease of CD34 as a stem cell marker for three cell lines (KG1a [P < 0.01], KASUMI [P < 0.01], and Me-1 [P < 0.01]) that were initially CD34+ (Fig. 3C, D). HL60 and NB4 cell lines that do not express CD34 at the steady state did not show any modified pattern of CD34 level after OCT4 inhibition.
Role of OCT4 in the arrest of differentiation
To further document the role of OCT4 in differentiation, a comparative analysis was done between ATRA differentiation and shRNA-treated cells (Figs. 1A–C, 2 and 3). For HL60, NB4, KASUMI, and Me-1 cell lines, OCT4 inhibition resulted in spontaneous cell differentiation similar to that observed after ATRA exposure. Regarding KG1a cell line, OCT4 inhibition even induced a more pronounced differentiation effect than ATRA with massive decreased expression of CD34 and increased expression of CD11b (CD11b MFIR: 10.2 vs. 1.2, CD34 MFIR: 1.8 vs. 7.4, OCT4 MFIR: 1.9 vs. 9, comparing OCT4shRNA vs. ATRA) (Fig. 3, C, D).
Evaluation of other pluripotency markers, including SOX2 and NANOG, was performed (Fig. 4). mRNA and protein levels of NANOG were not significantly modified in ATRA and OCT4-shRNA groups, compared with the control group (untreated cells). However, we could notice a trend toward a moderate decrease (RQ NANOG ATRA vs. OCT4-shRNA: 0.65 vs. 0.58 for HL60, 0.88 vs. 0.8 for KG1a, 0.69 vs. 0.6 for NB4, 0.55 vs. 0.6 for KASUMI, 0.57 vs. 0.52 for Me-1) (Fig. 4A, C). Same results were observed for SOX2 mRNA and protein expression (RQ SOX2 ATRA vs. OCT4-shRNA: 0.78 vs. 0.7 for HL60, 0.9 vs. 0.87 for KG1a, 0.71 vs. 0.68 for NB4, 0.79 vs. 0.71 for KASUMI, 0.86 vs. 0.75 for Me-1) (Fig. 4B, D). Overexpression of OCT4 caused a negative impact on the differentiation by blocking it in the leukemic cells.
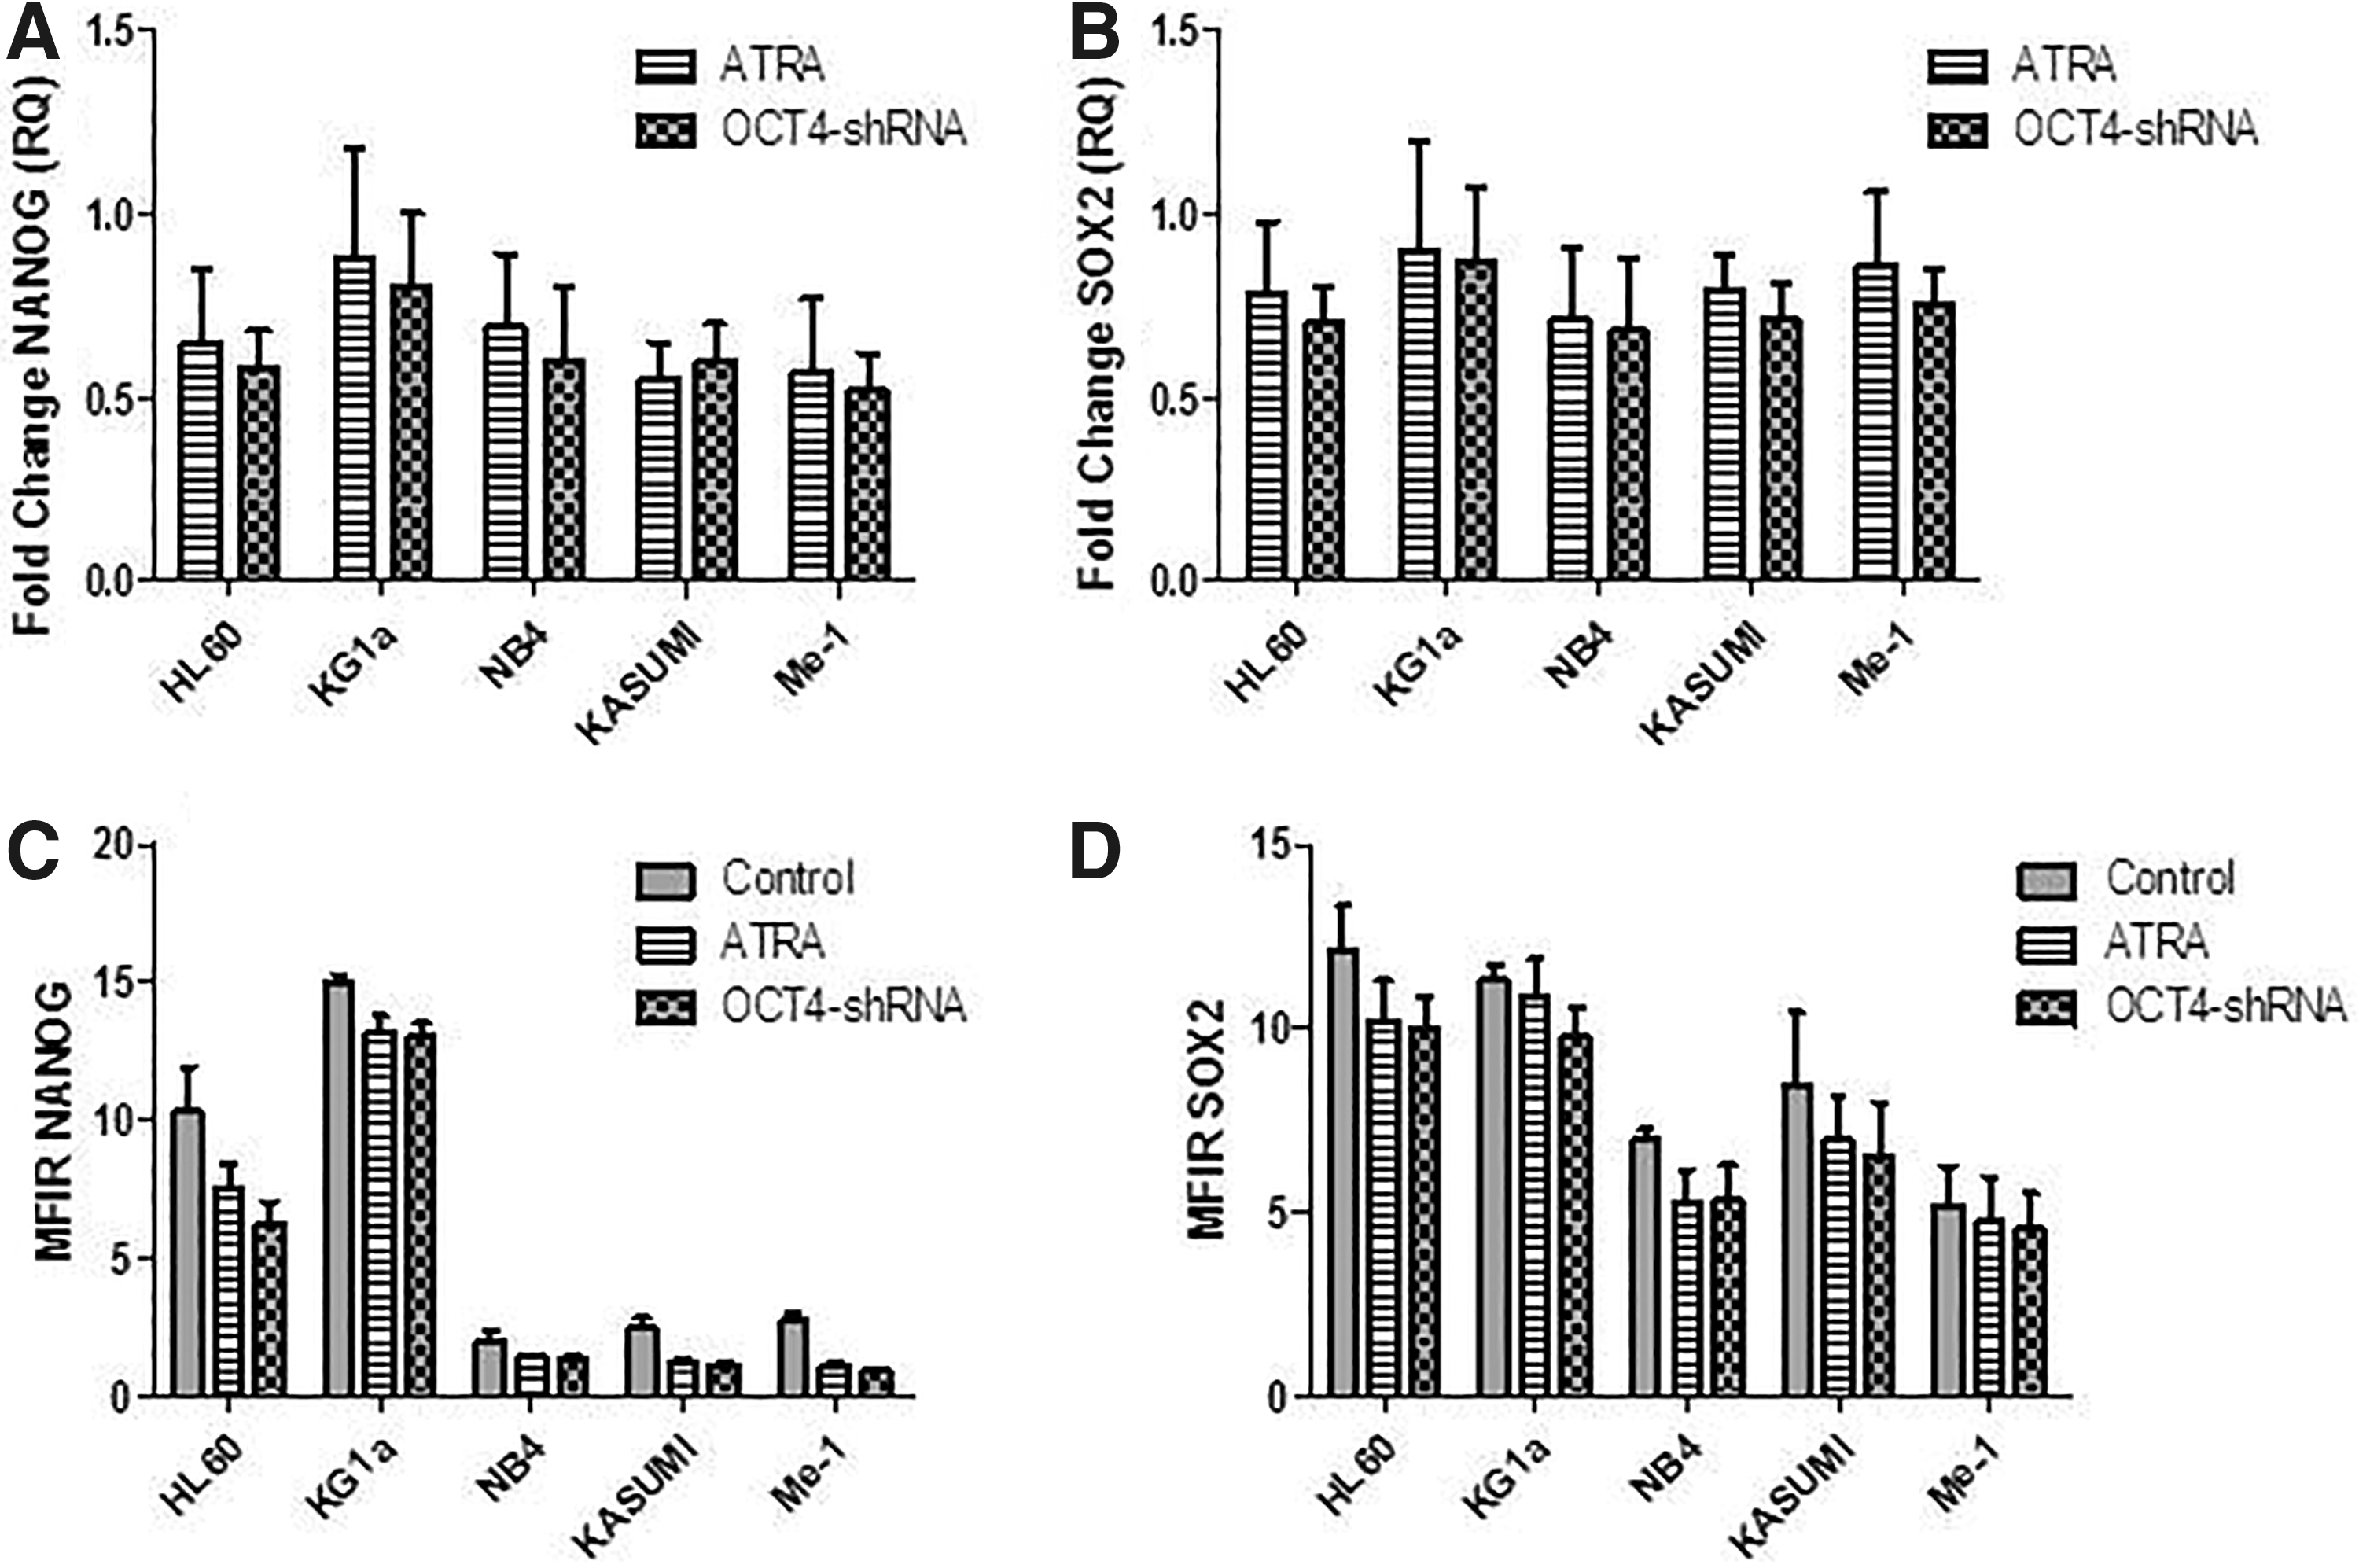
Evaluation of NANOG and SOX2 expression by qRT-PCR and MFC after ATRA and OCT4-shRNA treatments. Fold changes in
Role of OCT4 in the clonogenic capacity
Given the negative impact of OCT4 on differentiation, we therefore evaluated the role of OCT4 on clonogenicity. Following ATRA differentiation, the yield of CFU-G was significantly decreased (P < 0.01 for HL60 and KG1a, P < 0.05 for NB4, KASUMI, and Me-1), even in KG1a (P < 0.01) that did not exhibit a differentiated phenotype upon ATRA treatment (Fig. 5). We obtained comparable results with RA, except for NB4 cell line, for which there was not a significant decrease after RA differentiation. Only results with ATRA treatment were presented (Fig. 5).
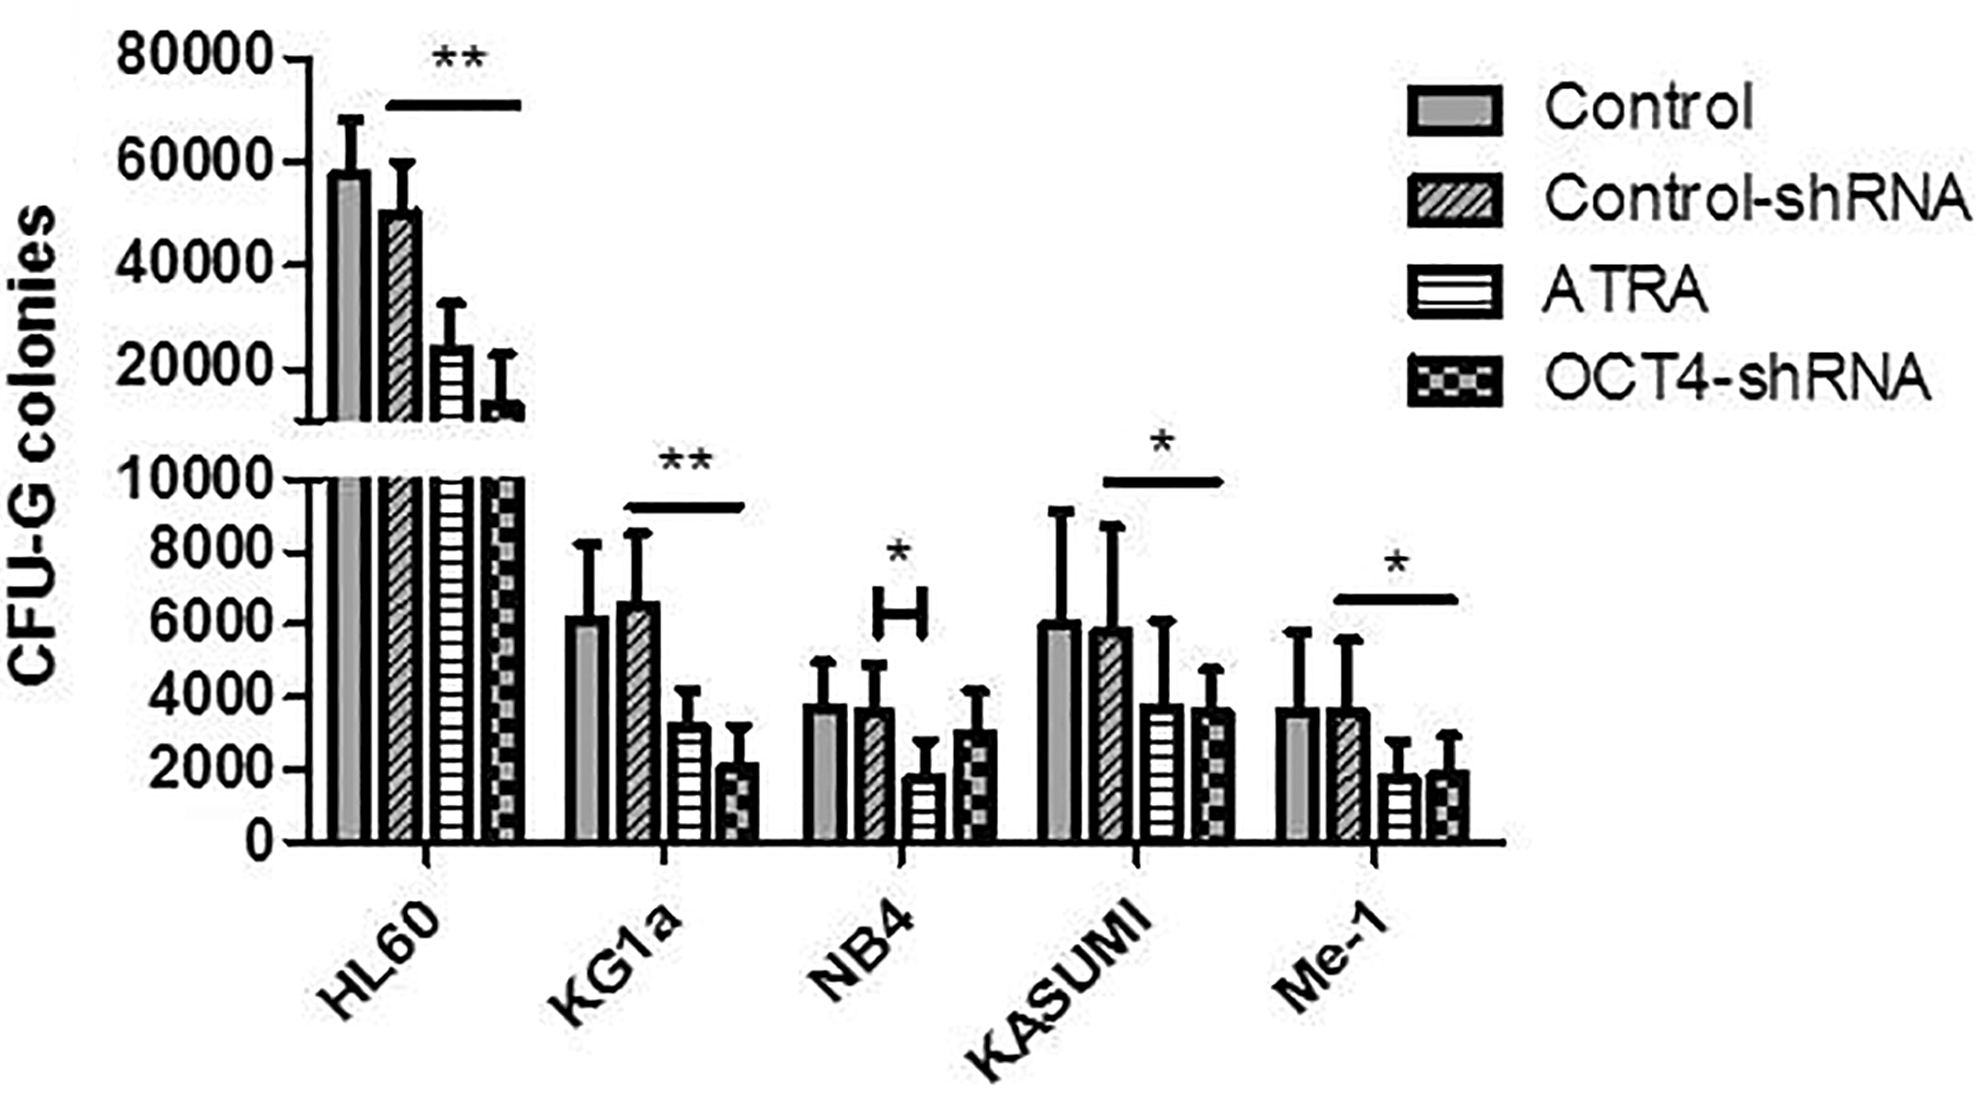
Evaluation of clonogenic capacity in the presence of ATRA and shRNA treatment. CFU-G colonies were numbered in six separate experiments. Student's t-test was used to compare differences in the number of colonies. **P < 0.01, ***P < 0.001.
In shRNA-treated cells, all cell lines, except NB4, showed a significant reduction of the clonogenic capacity (<10,000 CFU-G for KG1a [P < 0.01], KASUMI and Me-1 [P < 0.05] and 20,000 CFU-G for HL60 [P < 0.01]) (Fig. 5).
OCT4 inhibition decreased cell proliferation
Cell proliferation was measured using the WST assay after ATRA differentiation and OCT4 inhibition (Fig. 6A). In both conditions, we could observe a significant decrease of cell proliferation rate in all cell lines (P < 0.001 for HL60, KASUMI and Me-1, P < 0.01 for NB4, and P < 0.05 for KG1a). This effect is even more pronounced in shRNA-treated cells, probably due to a more robust extinction of OCT4 protein by comparison with ATRA treatment.
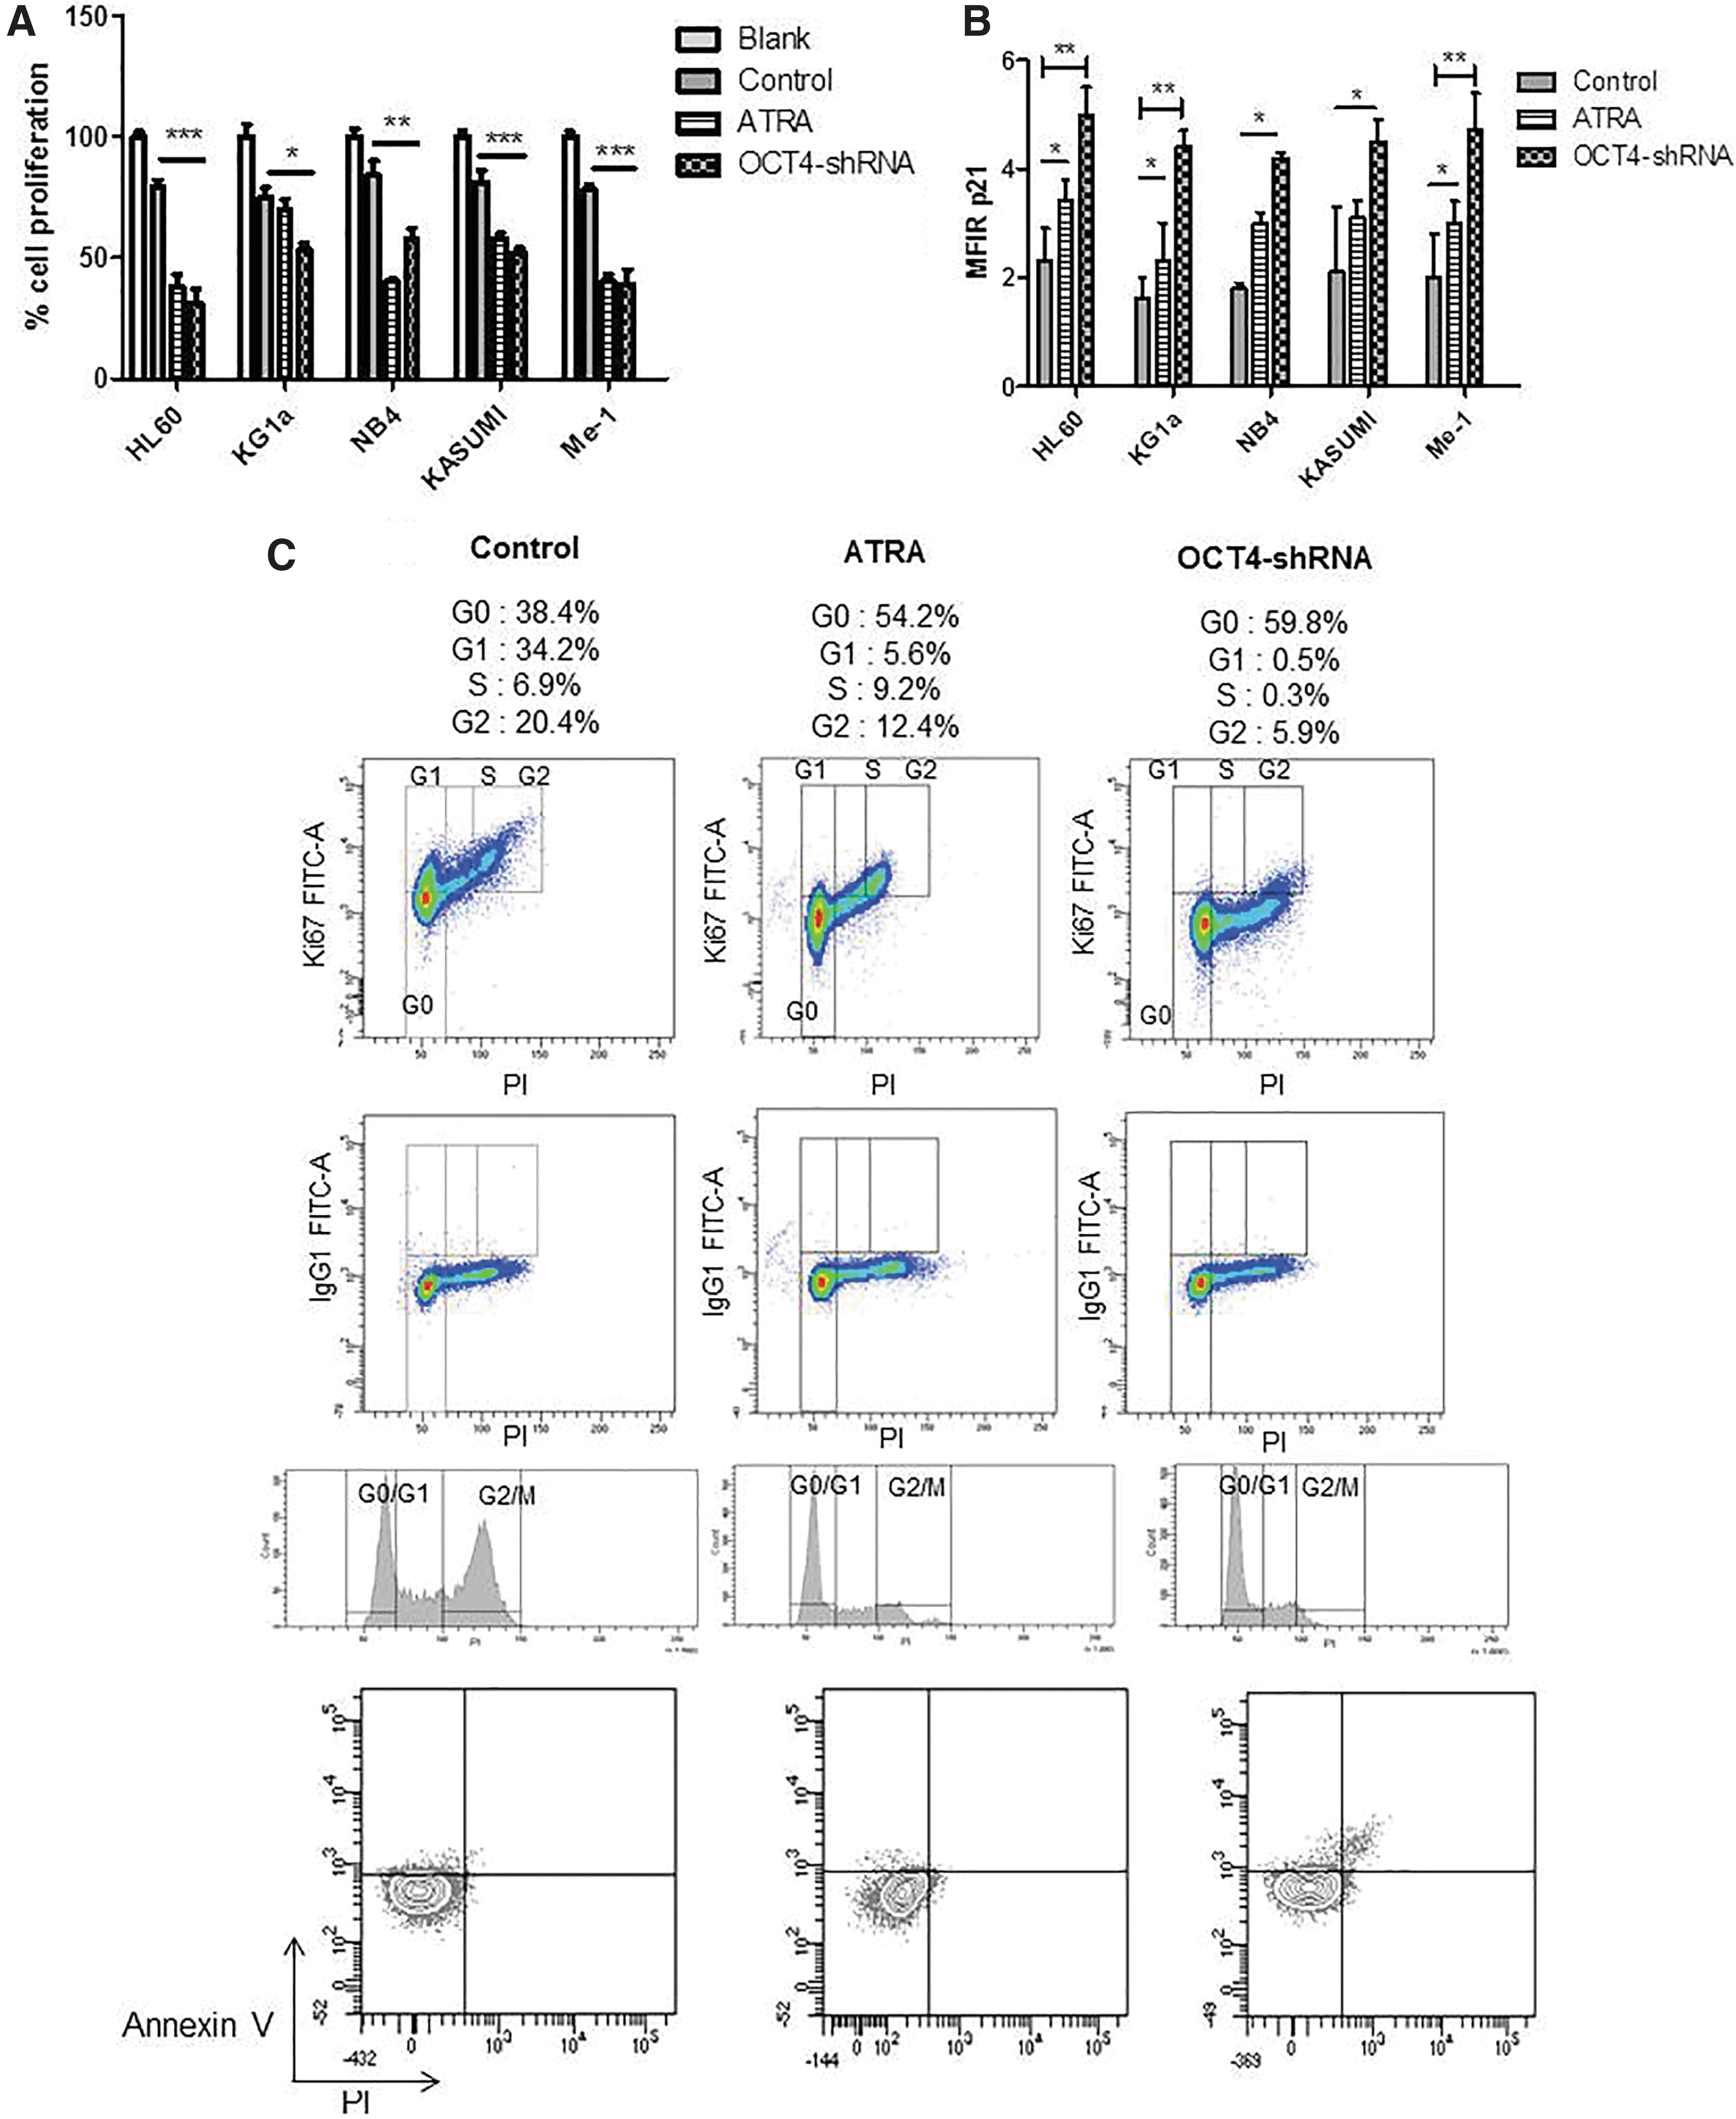
Cell proliferation and cell cycle analysis after ATRA differentiation and ShRNA inhibition.
Results with RA and ATRA were identical for all cell lines. Thus, only results with ATRA treatment were presented in Fig. 6. This proliferation arrest was then confirmed by cell cycle analysis (Fig. 6C) showing a decreased Ki67 expression and an elevated percentage of cells in the G0 phase after ATRA or OCT4-shRNA treatments for HL60 cell line compared with untreated cells (G0 phase%: 54.2 for ATRA vs. 59.8 for OCT4-shRNA vs. 38.4 for control cells). This result was observed in all cell lines (KG1a G0 phase%: 49.8 vs. 60.1 vs. 39.2, NB4 G0 phase%: 52.3 vs. 58.7 vs. 35.5, KASUMI G0 phase%: 50.9 vs. 59.9 vs. 40.1, Me-1 G0 phase%: 55.2 vs. 60.2 vs. 37.6, for ATRA vs. OCT4-shRNA vs. control cells, respectively).
Annexin V/PI staining was performed in parallel to assess the percentage of apoptotic cells (2%). The proliferation arrest could be discriminated from apoptosis or necrosis as showed by Annexin V and PI staining. At the same time, cell cycle arrest was accompanied by a significant increase in expression of cell cycle regulator p21 in all ATRA or RA differentiated cells (P < 0.05) and OCT4-shRNA inhibited cells (P < 0.01 for HL60, KG1a and Me-1, P < 0.05 for NB4 and KASUMI) (Fig. 6B) compared with control. Over-regulation of the transcription factor OCT4 would promote abnormal cell proliferation in leukemic cells.
Discussion
The processes involved in the arrest of differentiation and cell proliferation observed in AML are not fully understood. One mechanism implicates the aberrant expression of transcription factors, involved in normal hematopoiesis [19]. We and others previously showed that OCT4 is overexpressed in AML cells [13,14]. The highest levels were observed in the immature (CD34+CD38−) compartment [14]. In addition to differentiation arrest, LSCs also possess the property of self-renewing and are the source of long-term maintenance and propagation of the disease.
In the present study, we confirm that OCT4 is expressed in leukemic cell lines exhibiting a variety of oncogenic anomalies and phenotypes. HL-60 (AML with promyelocytic differentiation), NB4 (Promyelocytic AML with PML-RARα fusion gene), KASUMI [AML with t(8;21) and RUNX1-RUNX1T1 fusion gene], and Me-1 [AML with inv(16) and CBFβ-MYH11 fusion gene] correspond to more differentiated leukemia with specific molecular anomalies, with a high differentiation potential in the presence of RA or ATRA, and are derived from AML with favorable prognosis. Conversely, KG1a is a differentiation-resistant subtype of AML without known recurrent oncogenic anomaly. Upon differentiation in presence of ATRA, expression of OCT4 decreased in leukemic cells (Fig. 2).
Furthermore, we observed that the clonogenic capacity decreased as well in differentiated cells (Fig. 5). OCT4 downregulation by specific ShRNA reproduced the same behavior with morphological and phenotypic cell differentiation (Figs. 1 and 3) and clonogenic potential (Fig. 5). Interestingly, there was a difference between RA and ATRA for the NB4 cell line, in line with the fact that ATRA is specifically active on leukemic cells with PML-RARα rearrangement [20]. Regarding the KG1a cell line, we observed very limited differentiation and loss of proliferation in response to differentiation treatments, and no variation in OCT4 levels. However, OCT4 levels were significantly decreased upon shRNA treatment. This was associated with differentiation features and loss of clonogenic capacities.
These findings suggest that differentiation arrest and proliferation may depend on different underlying mechanism according to the type of leukemia, and also that OCT4 upregulation remains a common phenomenon whatever the initial oncogenic anomaly is.
OCT4 downregulation reduced cell proliferation (Fig. 6) by arrest of cell cycle in G1 phase. Differentiated cells after ATRA exposure did not reveal differences in apoptosis levels compared with OCT4-shRNA inhibited cells. The arrest of cell cycle and the decrease of cell proliferation were associated with p21 overexpression. p21 acts as an inhibitor of the cell cycle during G1 phase and is tightly controlled by the tumor suppressor protein p53 [21]. In this study, we found an overexpression of p21 that was associated with proliferation arrest and induction of differentiation. These results are correlated with those of Liu et al. who showed that the overexpression of p21 in human leukemic cells U937 leads to the expression of differentiation markers CD11b and CD14 and the inhibition of cell proliferation [22].
Taken together, our findings suggest a potential role of OCT4 in acute leukemia oncogenesis, as already described in solid tumors. The effect of OCT4 on cancer cell differentiation was previously reported in solid cancers, such as glioma [23] and epithelial tumors [24]. It was shown that OCT4 forced expression in C6 rat glioma cells increased the self-renewal capacity and promoted an undifferentiated phenotype [23]. In addition, RNA interference of OCT4 reduced tumor-forming capacity in cultured glioma cells [25].
OCT4/POU5F1 is essential for establishing and maintaining the pluripotent state of stem cells [26,27]. However, the role of OCT4 in the development and progression of malignant tumors has not been fully determined. OCT4 interacts with several signaling pathways that are constitutively activated in AML, such as the MAPK [28,29] and JAK/STAT pathways [30]. Furthermore, OCT4 upregulates the expression of Grb2 associated docking protein (Gab1), which will enable activation of the MAPK pathway. OCT4 also cooperates with the LIF-induced JAK/STAT3 signaling pathway to activate transcription factors Ref1 (redox effector factor-1) and Utf1 (undifferentiated cell transcription factor 1) that are involved in the undifferentiated or pluripotent state of these cells.
Finally, OCT4 cooperates with the transcription factor CDX2 in cell differentiation. CDX2 is involved in embryonic development and intestinal cell homeostasis. It is aberrantly expressed in nearly all cases of AML and promotes leukemogenesis, while it is absent in normal hematopoietic stem and progenitor cells [31,32]. Our preliminary data suggest that CDX2 is downregulated together with OCT4 during RA or ATRA differentiation (Fig. 2).
We also investigated the role of other embryonic markers. In our study on primary AML cells, we observed a strong expression of NANOG and SOX2 in leukemic cells. OCT4 and SOX2 are two of the Yamanaka's factors, which can transform differentiated cells into pluripotent stem cells with embryonic properties [33]. NANOG and SOX2 also promote self-renewal and maintain of pluripotency of ESC. Although it has been demonstrated that each of these transcription factors has a specific role, NANOG, OCT4, and SOX2 cooperate to maintain stemness and pluripotency of embryonic cells [6,34]. In this study (Fig. 4), we did not observe significant variations of NANOG and SOX2 levels after differentiation or OCT4-shRNA treatment, which suggests that OCT4 is necessary to maintain the undifferentiated phenotype.
The causes for POU5F1/OCT4 deregulation in cancer cells remain unknown. One hypothesis would be an epigenetic dysregulation, as there is growing evidence of the implication of this phenomenon in acute leukemia and in preleukemic states. In AML cells, the differentiation arrest could be related to a downregulation of the miRNA let7c [35]. Let-7 processing is negatively regulated by lin28 [36,37], the expression of which is in turn under the control of stem cell transcription factors, including OCT4 [38]. This suggests a possible loop of activation maintaining high levels of OCT4 and points to a possible targeted therapy. Indeed, in a NTERA cell line model, Musch et al. reported that differentiation induced by purine analogs such as decitabine (but not by RA) resulted in a degradation of OCT4 by caspase 7 with a loss of clonogenic properties [39]. In our control experiments, we could confirm that RA induces a limited differentiation of NTERA-2 cells, but has no effect on OCT4 levels (data not shown).
In conclusion, our data strongly suggest the implication of OCT4 overexpression in leukemogenesis, at least in some leukemic subtypes. While the mechanism of this phenomenon remains to be elucidated, these findings point toward a potential use of OCT4 as a target for new antileukemic therapies.
Footnotes
Acknowledgments
We thank BD Biosciences for providing monoclonal antibodies. We thank Gisèle Froment, Didier Nègre, and Caroline Costa (SFR BioSciences de Lyon, UMS3444/US8) for their help with the lentivectors production, Elisabeth Daguenet (Institut de Cancérologie Lucien Neuwirth) for reviewing the article and Véronique Frachet (laboratoire AGIM de Grenoble) for her help in cell cycle analysis. Tiphanie Picot was the recipient of a research grant from the association “Les Amis de Rémi.”
Author Disclosure Statement
No competing financial interests exist.