




Abstract
Nutritional imbalance and metabolic alterations associated with maternal obesity during pregnancy predispose offspring to obesity and/or to type 2 diabetes, but the mechanisms underlying these effects are still obscure. In this context, we evaluated whether the two main energy-producing pathways (glycolysis and mitochondrial oxidative phosphorylation) are impaired in obesity during pregnancy thus contributing to metabolic intrauterine alterations. Specifically, we studied metabolic abnormalities in the intrauterine life of newborns using stem cells isolated from amnion and umbilical cord (hA- and hUC-MSCs). We isolated, at delivery, neonatal hUC-MSCs from 13 obese (Ob) and 10 normal weight control (Co) women (prepregnancy body mass index >30 and <25 kg/m2, respectively) and hA-MSCs from a subgroup of 3 Ob and 3 Co women. The hUC-MSC immunophenotype was characterized by flow cytometry. The extracellular acidification rate and oxygen consumption rate, which are indicators of glycolysis and mitochondrial respiration, respectively, were measured using the Seahorse XFe96 analyzer. Basal glycolysis (Co: 27.5 ± 2.9; Ob: 21.3 ± 2.3 mpH/min) and glycolytic capacity (Co: 65.3 ± 1.2; Ob: 55.0 ± 0.3 mpH/min) were significantly lower in Ob-hUC-MSCs versus Co-hUC-MSCs (P < 0.05 and P < 0.0001, respectively). Mitochondrial basal respiration (Co: 46.9 ± 0.7; Ob: 32.6 ± 0.8 pmol/min), ATP-linked respiration (Co: 29.3 ± 1.9; Ob: 20.1 ± 0.3 pmol/min), and maximal respiration (Co: 75.2 ± 5.3; Ob: 50.5 ± 4.1 pmol/min) were significantly (P < 0.0001) lower in Ob-hUC-MSCs versus Co-hUC-MSCs. Similarly, bioenergetic profiles of the subgroup of Ob-hA-MSCs differed from those of Co-hA-MSCs. These results demonstrate that the bioenergetic performance of Ob-h-MSCs is lower in basal conditions and in conditions of increased energy demand compared with Co-h-MSCs. In conclusion, we describe a new mechanism whereby obesity alters intrauterine metabolism. This process could concur to predispose offspring to metabolic diseases in adult life.
Introduction
G
We recently demonstrated that the adipogenic potential of hA-MSCs isolated from the placenta of obese (Ob) women at delivery was higher compared with hA-MSCs isolated from the placenta of normal weight (Co) women [10]. Using hA-MSCs, we also demonstrated altered miRNome and proteome profiles in association with obesity [11 –13]. Given these findings, we investigated if the bioenergetic profile (glycolysis and mitochondrial respiration) of hU-MSCs and hA-MSCs was impaired during obesity thus contributing to obese-associated cellular malfunction. To this aim, we isolated hUC-MSCs and hA-MSCs from umbilical cord and placenta, respectively, of Ob and Co women at delivery and studied their metabolic behavior in terms of bioenergetic profiles.
Materials and Methods
Patients and controls
Thirteen morbidly obese and ten lean control pregnant women (mean age ± standard deviation: 33.0 ± 4.2 years and 32.1 ± 5.6 years, respectively), scheduled for cesarean delivery, were recruited at the Dipartimento di Neuroscienze e Scienze Riproduttive ed Odontostomatologiche, University of Naples Federico II. The prepregnancy body mass index (BMI) was >30 kg/m2 and <25 kg/m2 in Ob and Co subjects, respectively. The clinical and anamnestic data of the enrolled women were recorded upon hospitalization during a medical interview conducted by an experienced clinician. The exclusion criteria were viral infections, diabetes, and metabolic syndrome. All patients and controls gave their informed consent to the study that was performed according to the Helsinki II Declaration and approved by the Ethics Committee of the School of Medicine, University of Naples Federico II (authorization n. 248/08, 23/02/2009; amendment n. 248/08/ES1, 1/10/2014).
Sample collection
One maternal blood sample was collected in the morning after an 8 h fast from all enrolled women immediately before delivery. The samples were centrifuged, and the serum was stored at −80°C. The main biochemical parameters were analyzed by routine methods, and leptin and adiponectin concentrations were measured by immunoassay (Bio-Rad, Hemel Hempstead, Herts, United Kingdom). Term placentas and/or umbilical cords were collected at delivery by cesarean section. After removal of the maternal decidua, the amnion was manually separated from the chorion. Then, the amnion and umbilical cords were immediately processed to isolate hA-MSCs and/or hUC-MSCs [10].
Briefly, we washed the fetal samples five times in 40 mL phosphate-buffered saline (PBS) containing 100 U/mL penicillin, 100 mg/mL streptomycin, and 250 mg/mL amphotericin B (all from Sigma-Aldrich, St. Louis, MO) and mechanically minced them into small pieces. The latter were digested overnight at 4°C in ACCUMAX reagent (Innovative Cell Technologies, San Diego, CA), a combination of DNase, protease, and collagenolytic enzymes containing 100 U/mL penicillin, 100 mg/mL streptomycin, and 250 mg/mL amphotericin B. The enzymes were then inactivated with complete culture medium constituted by low-glucose Dulbecco's modified Eagle's medium (DMEM) (Sigma-Aldrich) supplemented with 10% of heat-inactivated bovine serum [fetal bovine serum (FBS)], 1% of nonessential amino acids, and 2% of UltraGlutamine (all from Lonza, Basel, Switzerland). After centrifugation at 300 g for 10 min, cell pellets and digested tissue fragments were seeded in a cell culture dish (BD Falcon, New York, NY) in complete culture medium and incubated at 37°C in 5% CO2 for 7 days. We removed digested tissue fragments and isolated cells that formed distinct fibroblast colony-forming units. Colonies reaching 70% confluence were washed with PBS, detached with trypsin/ethylenediaminetetraacetic acid (EDTA; Sigma-Aldrich), and counted and reseeded in complete medium for expansion at a concentration of about 5,000/cm2. The absence of mycoplasma contamination was assessed as described previously [14]. hUC-MSCs were further expanded, and when 70%–80% confluent cultures reached about four population doublings, they were detached with trypsin/EDTA and resuspended in PBS with 10% FBS.
Immunophenotyping of hUC-MSCs and hA-MSCs by flow cytometry
We analyzed the expression of 10 hematopoietic, mesenchymal, endothelial, epithelial, and no-lineage membrane antigens on the surface of MSCs by four-color flow cytometry (CD34, CD45, CD123, HLA-DR, CD13, CD29, CD44, CD90, CD105, CD166) [15]. All monoclonal antibodies (MoAbs) were from Becton Dickinson (San Jose, CA). In all antibody staining experiments, at least 1 × 10⁵ hUC-MSCs or hA-MSCs were incubated at 4°C for 20 min with the appropriate amount of MoAbs, washed twice with PBS, and finally analyzed with an unmodified Becton-Dickinson FACSCanto II flow cytometer (Becton-Dickinson), which was setup according to guidelines [16]. We also measured in each channel the background fluorescence obtained by cell acquisition without antibody (negative control, NC).
Calibrite beads (Becton-Dickinson; catalog no. 340486) were used as quality controls across the study as described elsewhere [17,18], according to the manufacturer's instructions. Daily control of Calibrite intensity showed no change in instrument sensitivity throughout the study. The relative voltage range for each detector was assessed una tantum using the eight-peak technology (Rainbow Calibration Particles, Becton-Dickinson; catalog no. 559123) at the beginning of the study. Compensation was set in the FACSDiva software (Becton-Dickinson), and compensated samples were analyzed. Samples were acquired immediately after staining using the FACSCanto II instrument, and at least 10,000 events were recorded for each monoclonal combination. Levels of CD antigen expression were displayed as median fluorescence.
Bioenergetic profiling
The extracellular acidification rate (ECAR) and the oxygen consumption rate (OCR), which are indicators of glycolysis and mitochondrial respiration, respectively, were measured using Seahorse XFe96 analyzer (Seahorse Bioscience, North Billerica, MA). For each tested subject, cells were plated in 16 wells on Seahorse 96-well plates 24 h before the experiment at a density of 8 × 10³ cells/well. Immediately before the experiment, media was replaced as follows: the OCR was measured in XF media (non-buffered DMEM, containing 10 mM glucose, 2 mM
Quantification of the abundance of mitochondrial DNA in hUC-MSCs
As a relative index of mitochondrial DNA (mtDNA) abundance in the tested cells [20], the mtDNA/nDNA ratio was calculated as described elsewhere [21]. DNA was extracted from both control and obese hUC-MSCs and hA-MSCs with the QIAamp DNA Mini Kit (Qiagen, Hilden, Germany) and quantified spectrophotometrically with the NanoDrop® ND-1000 UV-Vis spectrophotometer (NanoDrop Technologies, Wilmington, DE). Ten nanogram of total purified DNA was amplified in 25 μL PCR reaction mix containing SYBR Green Master Mix (Applied Biosystems, Inc., Foster City, CA) and 10 μM of each primer designed by Primer3 software (primer3.ut.ee) (mtDNA forward: CTCGCACGGACTACAACC, mtDNA reverse: TGGGCGATTGATGAAAAG; nDNA forward: TGACCTTTCTGTAGCTGGGG, nDNA reverse: CAAGCCCACCCCTTCTCTAA). The following amplification protocol was run on the 7900 HT real-time PCR system (Applied Biosystems): 95°C for 5 min; 95°C for 30 s, 60°C for 30 s, 72°C for 30 s, 45 cycles. Reaction specificity was estimated by evaluating the melting temperature of the products obtained. All samples were run in duplicate for each DNA target. Serial dilutions of pooled DNA (0.1, 1, 10, and 100 ng/μL) were run for each DNA target to generate a standard curve for the assessment of RT-qPCR amplification efficiency and for the quantification of mtDNA and nDNA.
Statistical analysis
The investigated parameters are expressed as mean and standard error of the mean (SEM) or standard deviation (SD) (parametric distributions) or as the median value and 25th and 75th percentiles (nonparametric distributions). The Student's t-test and the Mann–Whitney test, as appropriate, were used for between-group data comparison. P values <0.05 were considered statistically significant. Linear regression analysis and the Pearson correlation were used to explore inter-parameter associations. Statistical analysis was performed with the SPSS package for Windows (ver. 18; SPSS, Inc.).
Results
The clinical and biochemical characteristics of the enrolled pregnant women (13 Ob and 10 Co) are reported in Table 1A. Weight gain in pregnancy and total cholesterol levels were lower (P < 0.05) and diastolic blood pressure was higher (P < 0.05) in Ob than in Co pregnant women. Leptin and the leptin/adiponectin (L/A) ratio were higher (P < 0.005) in Ob than in Co women. Biometric characteristics did not differ between Ob- and Co-newborns (Table 1B).
Figures in bold indicate the statistically different parameters between obese and control women groups.
Median value and 25th–75th percentiles (nonparametric distributions).
hUC-MSCs and hA-MSCs
Cultured Ob-MSCs and Co-h-MSCs had a similar proliferation potential and a similar fibroblast-like morphology after four population doublings (Supplementary Fig. S1; Supplementary Data are available online at
Immunophenotyping of h-MSCs
The antigen profile displayed by neonatal Ob- and Co-h-MSCs is shown in Table 2. Based on the median fluorescence intensity (MFI) values of the specific antibody cocktail versus those of untreated cells (Table 2), 4 of the 10 antigens investigated were not expressed on the surface of h-MSCs (hematopoietic antigens: CD34, CD45, and CD123 and the lineage marker HLA-DR). In contrast, both Ob-h-MSCs and Co-h-MSCs expressed the following mesenchymal markers: CD13, CD29, CD44, CD90, CD105, and CD166. Notably, the levels of CD13 and CD90 were higher in Ob-h-MSCs than in Co-h-MSCs, even if not at a statistically significant level.
Not expressed (*) and expressed (°) antigens also in the subgroup of three Ob- and three Co-hA-MSCs.
Italics represents data relative to the negative controls (NC), i.e. values of channel background flourescence obtained by cell acquisition without antibody.
Bioenergetic profiles of hUC-MSCs and hA-MSCs
We investigated the bioenergetic profile in all isolated hUC-MSCs and in the subgroup of hA-MSCs. The glycolytic pathway (measured by ECAR) was impaired in obese hUC-MSCs (Fig. 1A), as shown by both the reduced basal glycolysis level (Co: 27.5 ± 2.9 mpH/min; Ob: 21.3 ± 2.3 mpH/min, P < 0.05, Fig. 1B) and glycolytic capacity (Co: 65.3 ± 1.2 mpH/min; Ob: 55.0 ± 0.3 mpH/min, P < 0.0001, Fig. 1C). A similar trend, although not statistically significant, was observed in glycolytic reserve function (Co: 37.7 ± 3.9 mpH/min; Ob: 33.8 ± 2.7 mpH/min, Fig. 1D). Oxidative phosphorylation (measured by OCR) was also lower in Ob-hUC-MSCs than in Co-hUC-MSCs (Fig. 2A), as indicated by the decreased basal respiration (Co: 46.9 ± 0.7 pmol/min; Ob: 32.6 ± 0.8 pmol/min, P < 0.0001, Fig. 2B), ATP-linked respiration (Co: 29.3 ± 1.9 pmol/min; Ob: 20.1 ± 0.3 pmol/min, P < 0.0001, Fig. 2C), and maximal respiration (Co: 75.2 ± 5.3 pmol/min; Ob: 50.5 ± 4.1 pmol/min, P < 0.0001, Fig. 2D). Linear regression analysis showed that the maximal respiration was negatively correlated to BMI irrespective of the other bioenergetic parameters included in the model (corrected R 2 = 0.228, β = −0.499, P < 0.05) (Supplementary Fig. S2A).
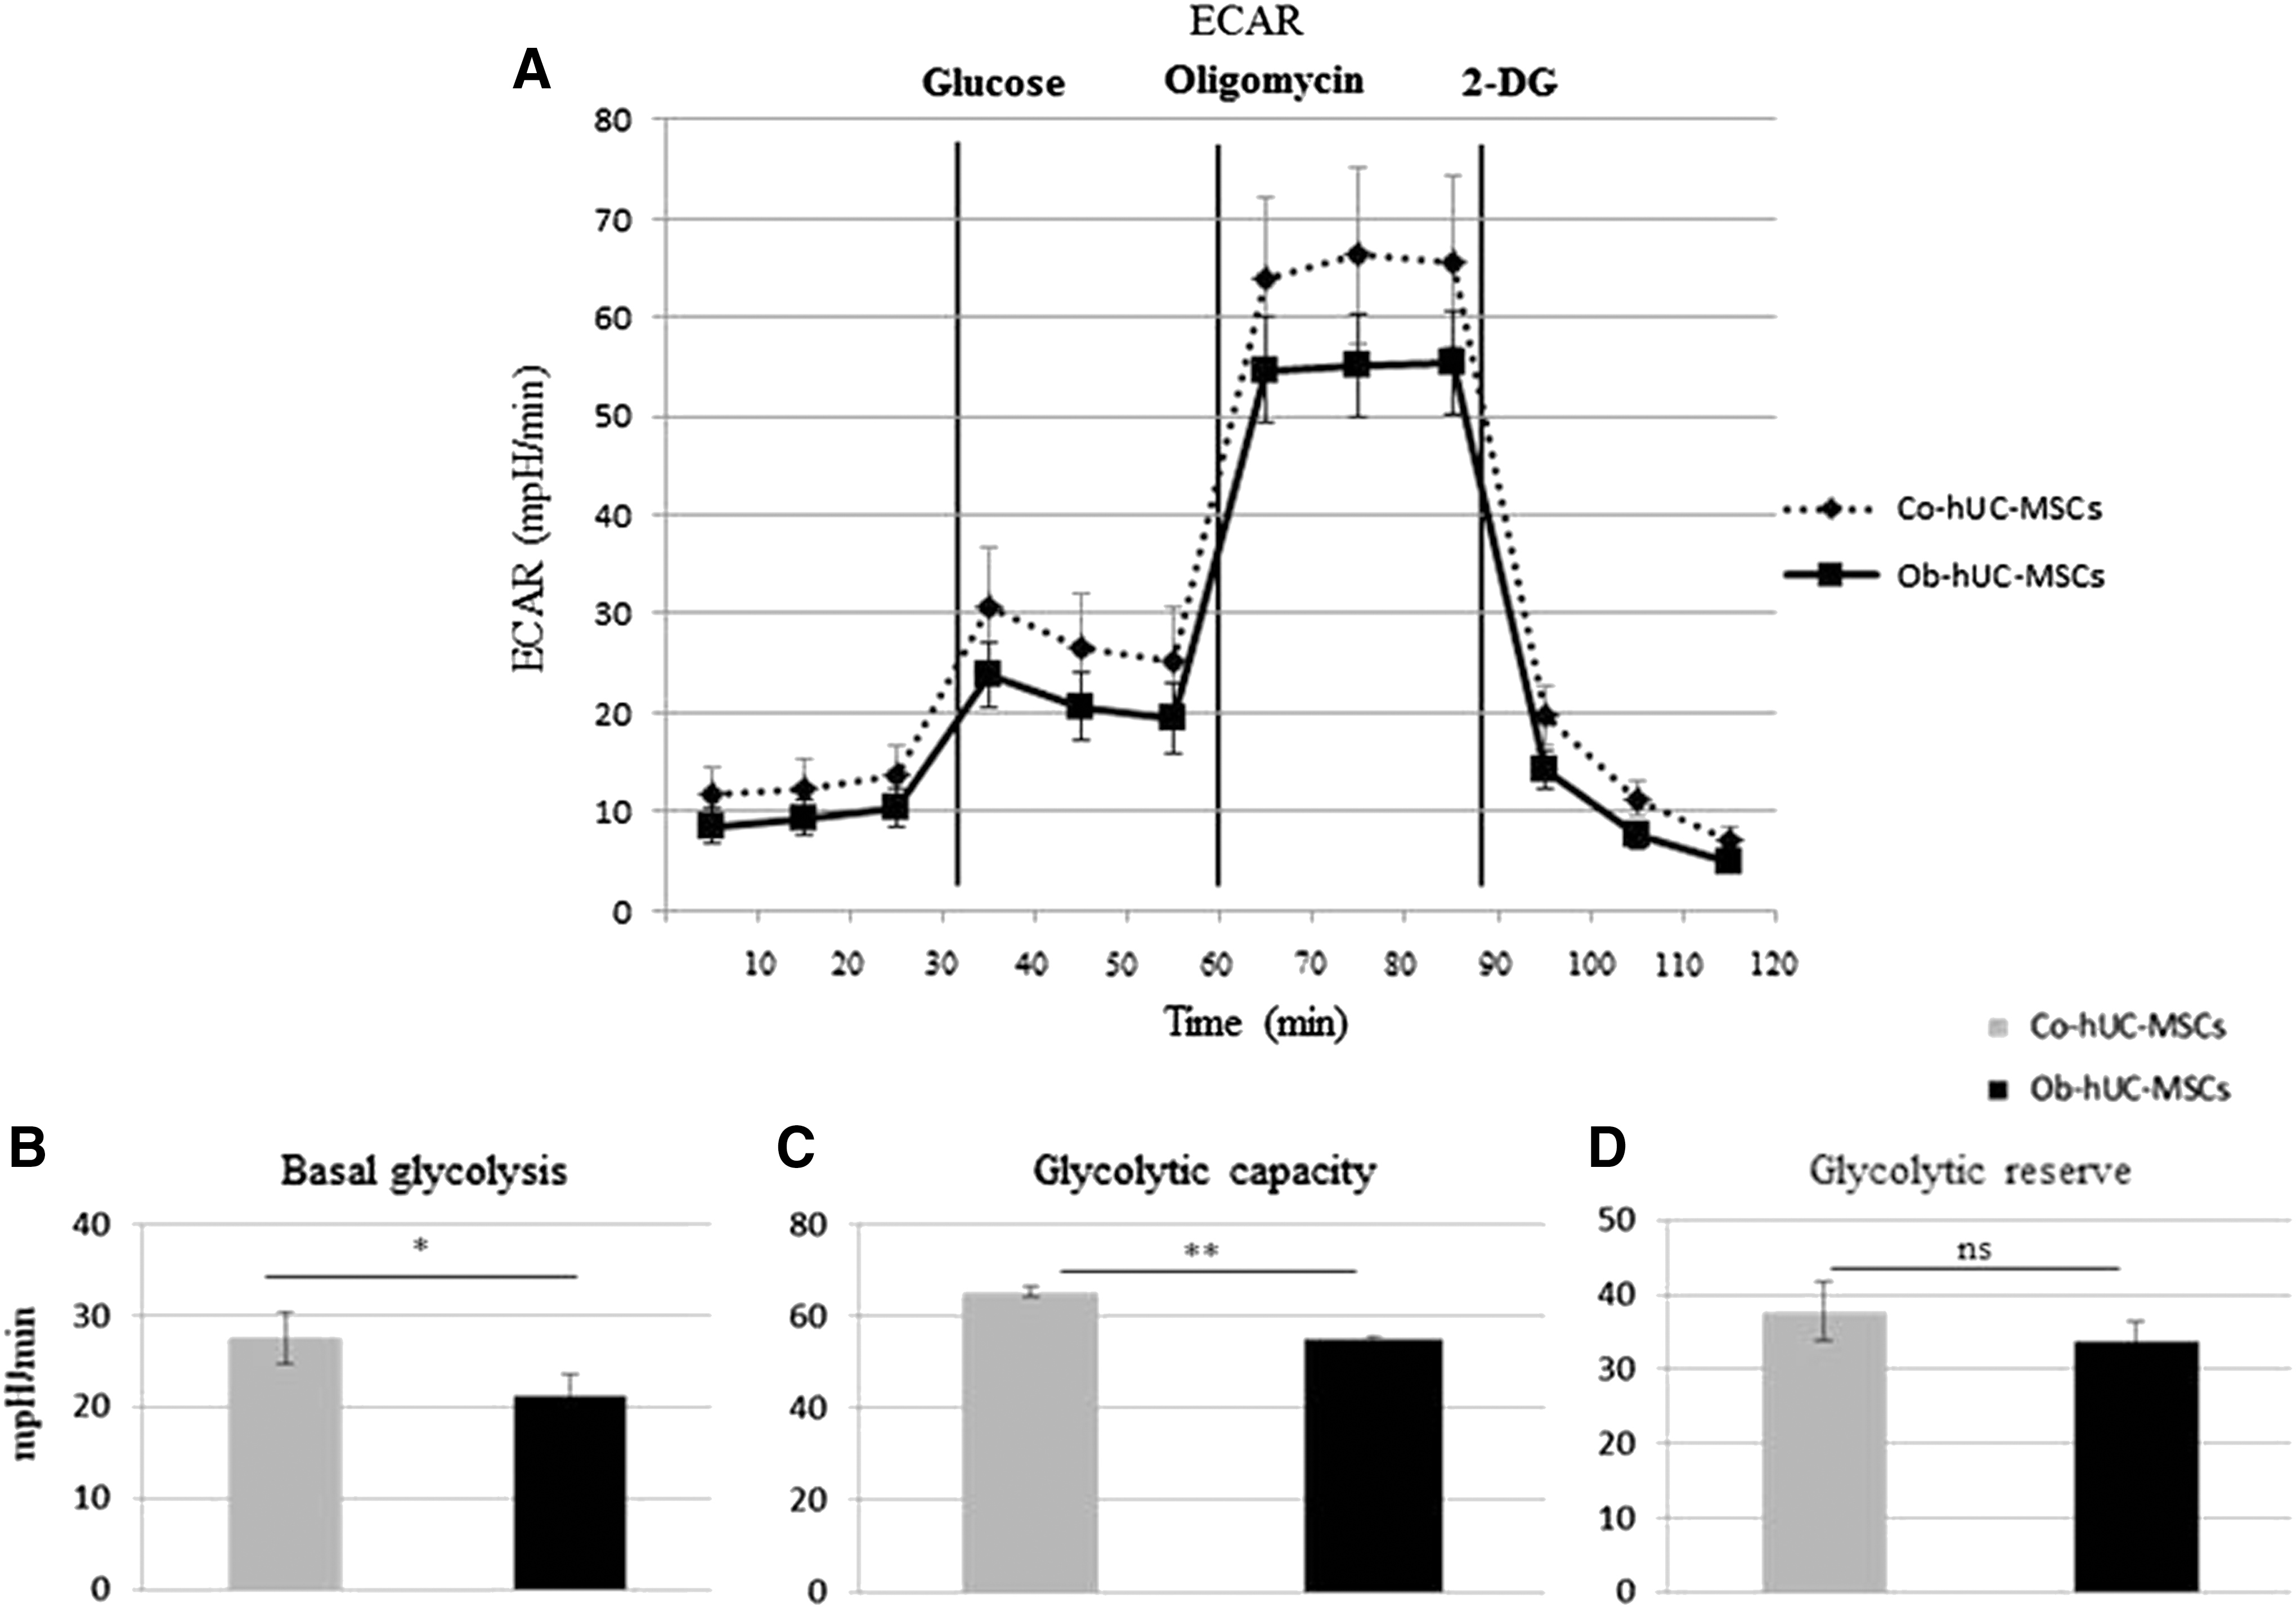
Glycolytic profiling of hUC-MSCs.
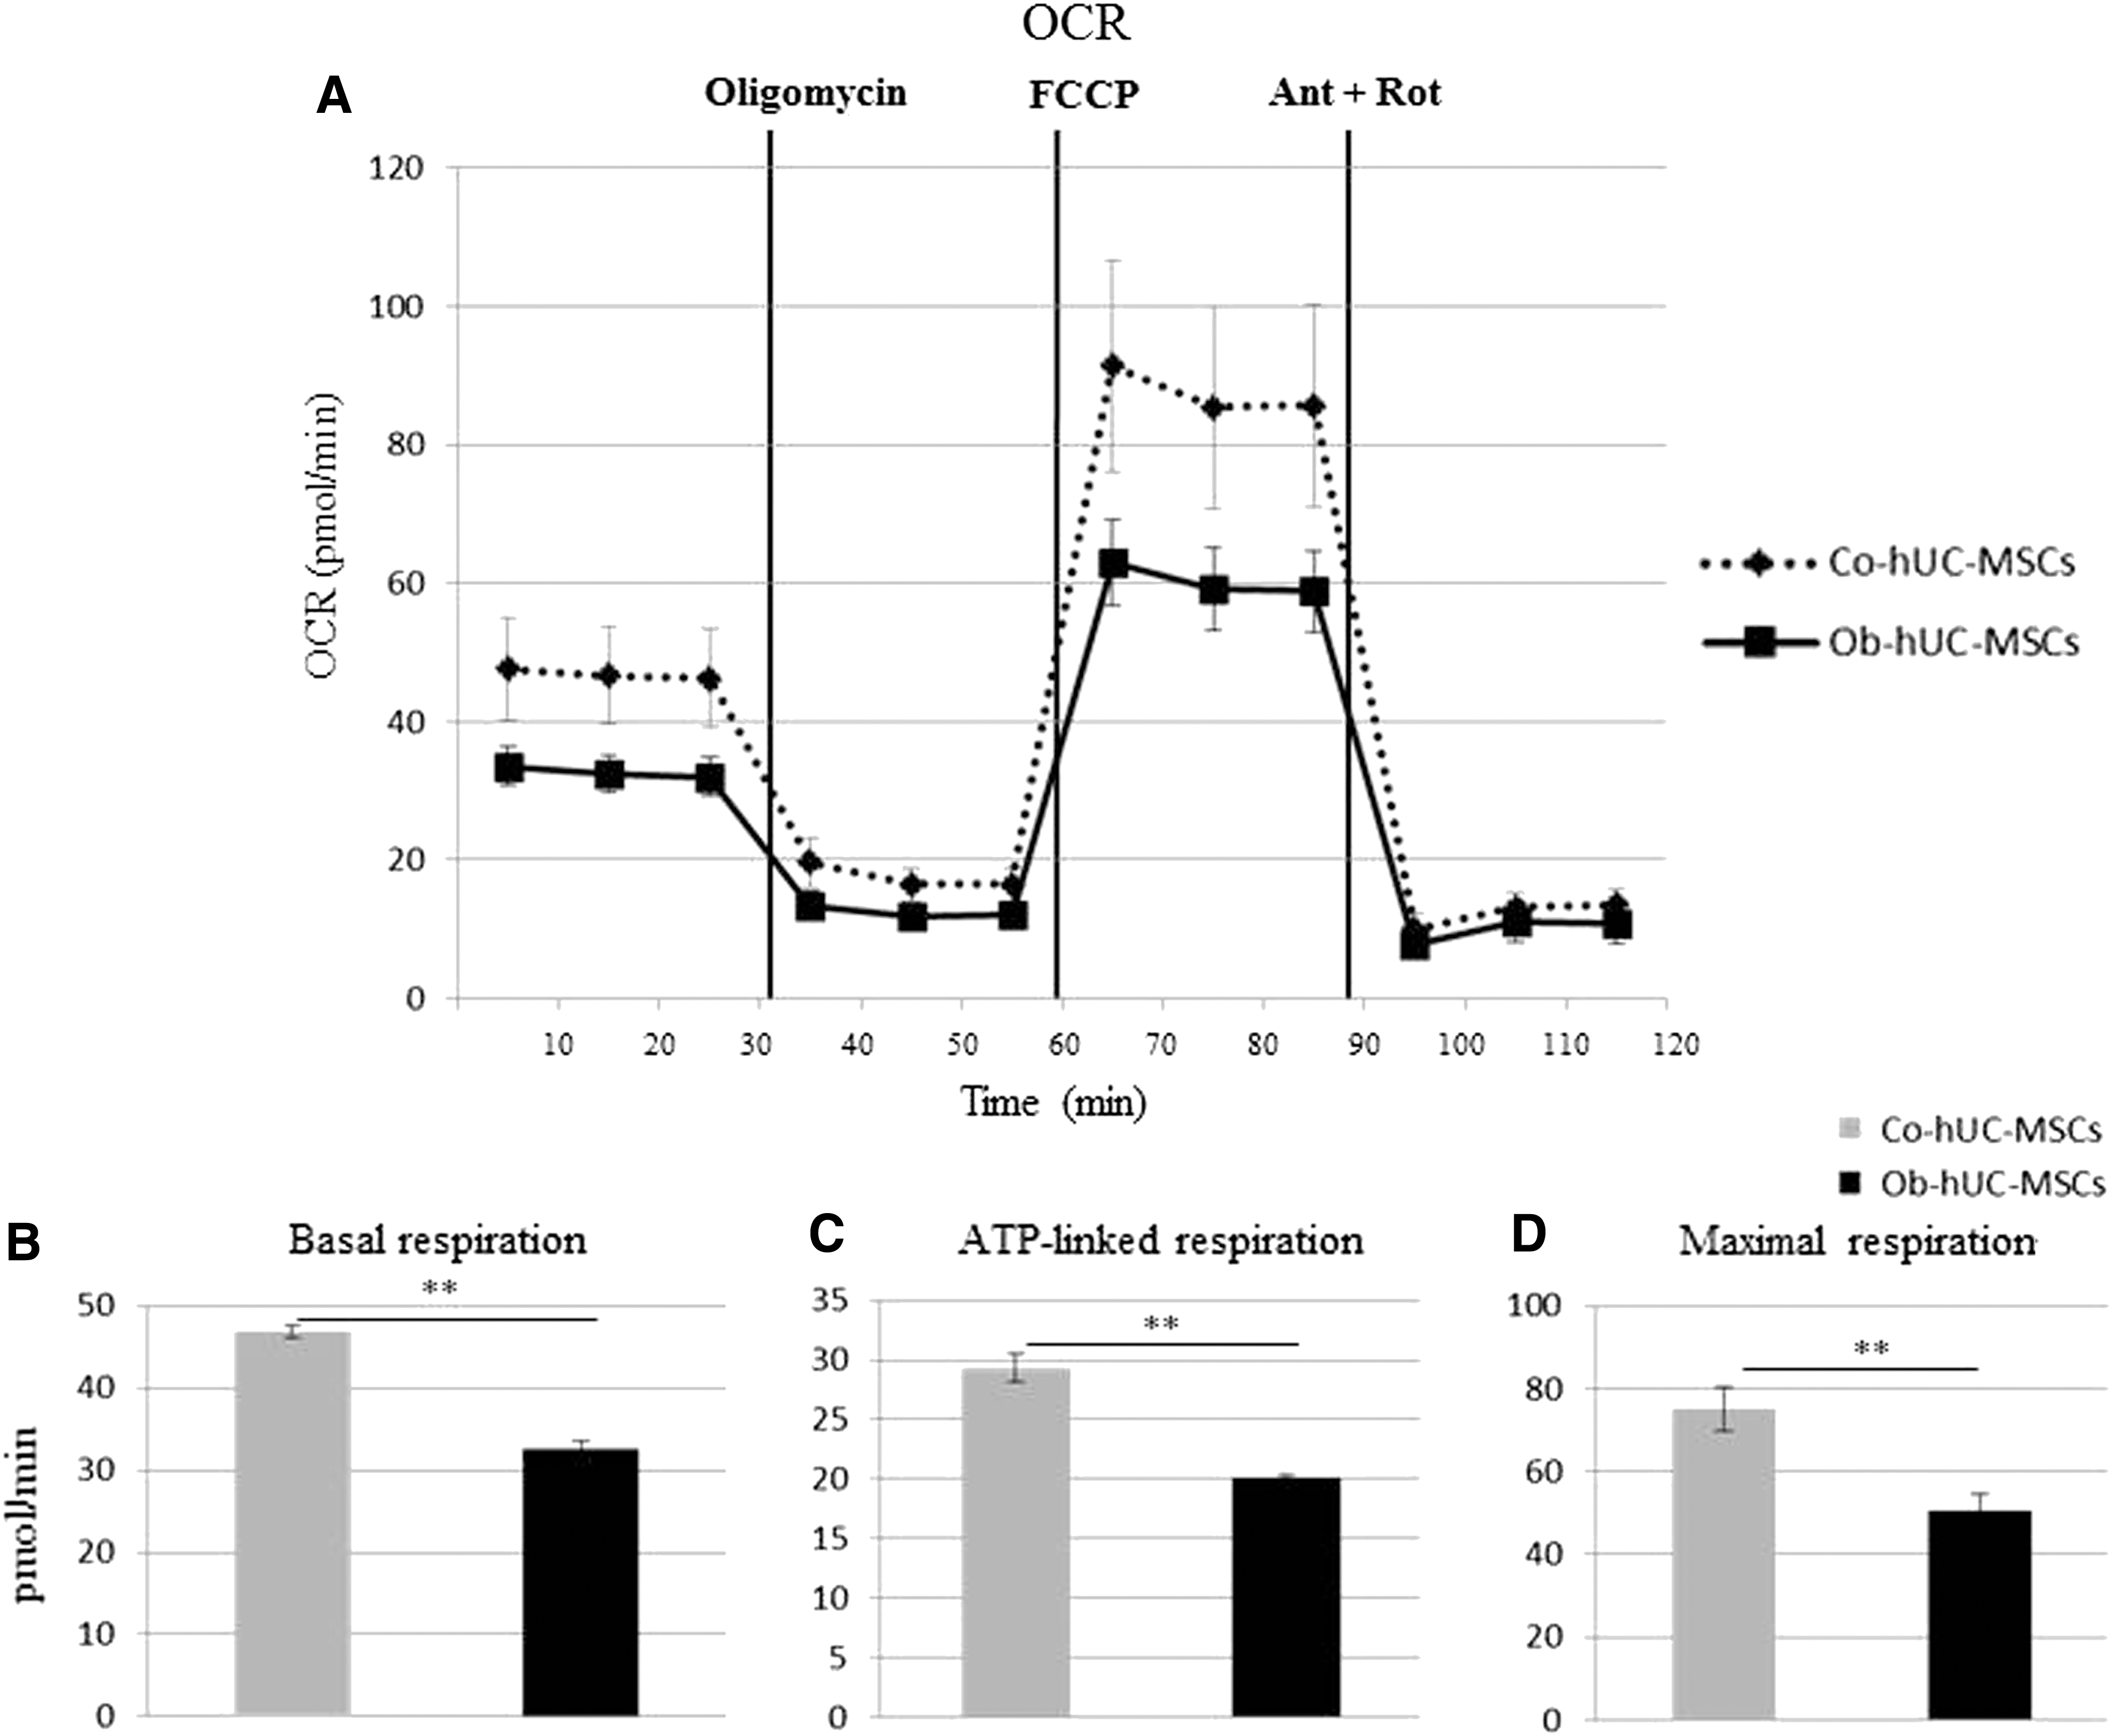
Mitochondrial respiration profiling in hUC-MSCs.
In the attempt to verify whether the differences we identified in bioenergetics could be due, in part, to a different abundance of mitochondria, we measured the mtDNA/nDNA ratio, as a surrogate biomarker of the amount of mitochondria in cells [19]. We found that the mtDNA/nDNA ratio in hUC-MSCs was significantly lower in Ob than in Co pregnant women (mean ± SD: 5.3 ± 1.6 vs. 8.6 ± 1.7, respectively, P < 0.05) (Fig. 3). Linear regression analysis showed that the mtDNA/nDNA ratio was negatively associated to BMI after correction for age (corrected R 2 = 0.598, β = −0.802, P < 0.05) (Supplementary Fig. S2B). The bioenergetic profiles in hA-MSCs isolated from Ob- and Co-pregnant women were similar to those obtained in Ob- and Co-hUC-MSCs. In fact, both the glycolytic pathway and mitochondrial respiration were lower in Ob- than in Co-hA-MSCs (Supplementary Figs. S3 and S4), and all the parameters measured in Ob-hUC-MSCs correlated with those evaluated in Ob-hA-MSCs (Supplementary Table S1).
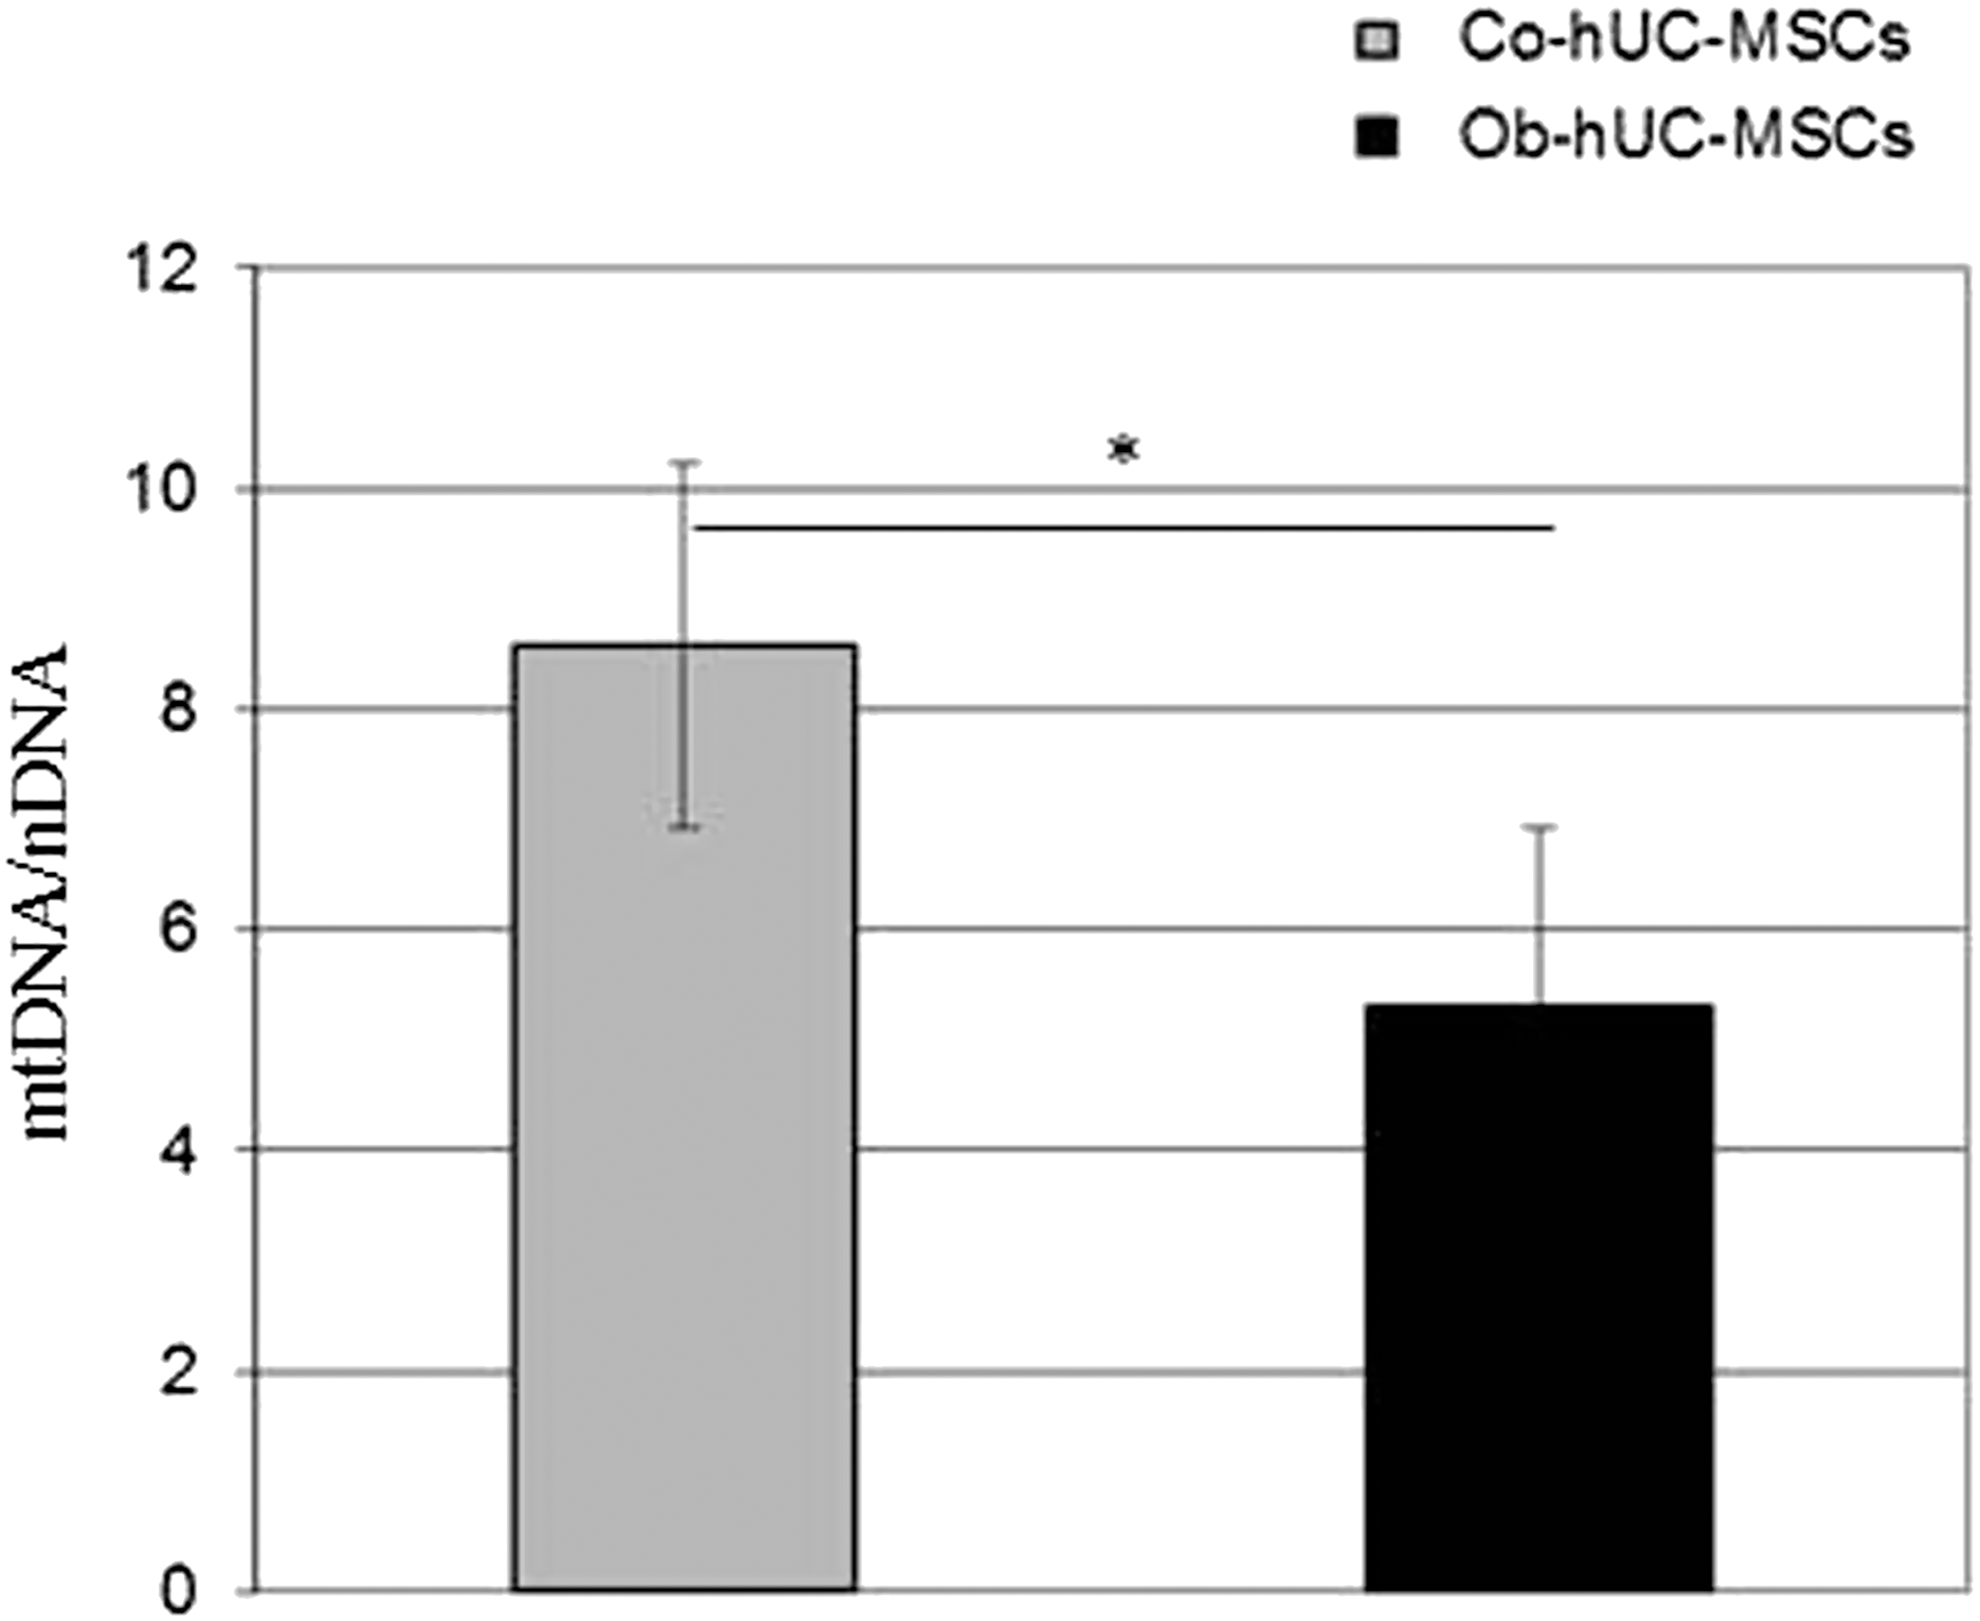
Calculation of the mtDNA/nDNA ratio. Data expressed as mean ± SD, statistical analysis by the Student's t-test. *P < 0.05.
Discussion
In this study we show that glycolysis and mitochondrial respiration are less efficient in neonatal MSCs isolated from placenta and umbilical cord of Ob women than in those isolated from Co women. In detail, both basal and maximum glycolytic capacities were lower in Ob-hUC-MSCs than in Co-hUC-MSCs, which indicate that the glycolytic function of Ob-hUC-MSCs works quite close to its theoretical maximum as previously reported in other types of cell cultures [22]. The latter finding suggests that the glycolytic machinery of Ob-hUC-MSCs is less able than the glycolytic machinery of Co-hUC-MSCs to respond to energy demand. Glycolytic profiles were also lower in our subgroup of Ob-hA-MSCs compared to Co-hA-MSCs. These data are in line with our previous finding that several proteins involved in glycolysis (ie, hexokinase 1, pyruvate kinase, enolase 1, aldolase C, and fructose-bisphosphate phosphofructokinase) were dysregulated in hA-MSCs from placenta of obese individuals compared to Co-hA-MSCs [13]. Interestingly, glucose and its metabolism play a key role in the survival and function of MSCs, including the differentiation process [23]. In fact, Chen et al. [24] reported decreased glucose metabolism in association with less potential toward osteogenesis and greater potential toward adipogenesis in hUC-MSCs from obese mothers. In accordance with these data, we previously reported a higher adipogenic potential in neonatal hA-MSCs from Ob individuals than in those from Co-pregnant women [10], finding then replicated in hUC-MSCs by Boyle et al. [25].
In the present study, we also found that the electron transport chain was impaired in Ob-hUC-MSCs and Ob-hA-MSCs. In fact, both ATP-linked respiration (ie, the portion of basal respiration that serves to drive ATP production) and maximal respiration were lower in Ob-MSCs than in Co-MSCs. Interestingly, in line with our results, the decreased mitochondrial function in terms of ATP production has been related to an increased accumulation of intracellular triglycerides in mouse preadipocytes [26]. Moreover, a maternal high-fat diet was shown to affect mitochondrial respiration and to cause lipid droplet accumulation in primary cardiomyocytes from neonate rats, which led to impaired cardiac function in offspring of diabetic rats [27].
Mitochondrial dysfunction has been described in hUC-MSCs from patients affected by gestational diabetes mellitus [28] and in those of obese and diabetic women [29,30]. In particular, it was demonstrated that the impaired placental mitochondrial function observed in obesity created a state of increased oxidative stress within the placenta [29]. This finding was supported by the positive correlation between maternal BMI and H2O2 levels, and the negative correlation between maternal BMI and placental mtDNA expression observed in obese pregnant women [30]. Increased placental levels of the mitochondrial radical oxygen species H2O2 may directly damage mtDNA and therefore reduce its content in obese pregnant women [30]. Accordingly, also in our cohort the mtDNA/nDNA ratio was lower in Ob-hUC-MSCs than in Co-hUC-MSCs and was negatively correlated with maternal BMI.
Notably, increased oxidative stress has been correlated to reduced mitochondrial ATP production in the placenta of obese women [29] and to decreased respiration and lipid turnover in human adipocytes [31]. Reduced mitochondrial ATP production can derange placental function thereby probably contributing to perinatal complications and affecting early life programming for metabolic disease [32]. In accordance with the hypothesis of a link between oxidative stress and obesity in pregnancy, we previously reported a miRNA-mediated reduction of the FOXO3 protein [12] and reduced levels of some heat shock proteins [13] in Ob-hA-MSCs; both these findings are suggestive of a defective response to oxidative stress in these cells.
Limits of our study are the small number of samples analyzed and the lack of data about the bioenergetic profiles of hUC-MSCs and hA-MSCs from obese and control pregnant women during adipogenic differentiation. In contrast, a strength of this study is the reproducibility of the impaired bioenergetic profiles in the neonatal Ob-MSCs obtained from two different tissue sources, namely, umbilical cord and amnion, which support the concept that the in utero metabolic alteration is associated with obesity.
In conclusion, we describe a new mechanism whereby obesity alters intrauterine metabolism. This process could concur to predispose offspring to metabolic diseases in adult life.
Footnotes
Acknowledgments
The authors thank Jean Ann Gilder (Scientific Communication Srl., Naples, Italy) for revising and editing the article and Vittorio Lucignano, CEINGE-Biotecnologie Avanzate for technical assistance related to graphics. They also acknowledge grants from CEINGE Regione Campania (DGRC 1901/2009), IRCCS SDN, Ministry of Health, POR Campania FSE 2007-2013-CUP B25B09000050007, Project CREME, and Project PON02 00619 3461281; PON02_00677 (BIOGENE) Pot. lab.8 A/B-2012 from the Italian Ministry of University and Research. Centro di Ricerca per lo studio di malattie genetiche dell'uomo e loro modelli cellulari e animali–Progetto: Terapia genica delle malattie metaboliche.
Author Disclosure Statement
No competing financial interests exist.
References
Supplementary Material
Please find the following supplemental material available below.
For Open Access articles published under a Creative Commons License, all supplemental material carries the same license as the article it is associated with.
For non-Open Access articles published, all supplemental material carries a non-exclusive license, and permission requests for re-use of supplemental material or any part of supplemental material shall be sent directly to the copyright owner as specified in the copyright notice associated with the article.
