
Abstract
Spermatogonial stem cell (SSC) self-renewal is an indispensable part of spermatogenesis. Angiotensin I-converting enzyme (ACE) is a zinc dipeptidyl carboxypeptidase that plays a critical role in the regulation of the renin–angiotensin system. In this study, we used reverse transcription-polymerase chain reaction (RT-PCR) and western blot analysis to confirm that somatic ACE (sACE), but not testicular ACE (tACE), is expressed in mouse testis before postpartum day 7 and in cultured SSCs. Our results revealed that sACE is located on the membrane of SSCs. Treating cultured SSCs with the ACE competitive inhibitor captopril was found to inhibit sACE activity, and significantly reduced the proliferation rate of SSCs. Microarray analysis identified 651 genes with significant differential expression. Kyoto Encyclopedia of Genes and Genomes (KEGG) pathway analysis showed that these differentially expressed genes are mainly involved in the mitogen-activated protein kinase (MAPK) signaling pathway. sACE was found to play an important role in SSC self-renewal through the regulation of MAPK-dependent cell proliferation.
Introduction
S
The self-renewal of SSCs is regulated by both extrinsic environmental stimuli and the expression of specific intrinsic genes. In 2000, Meng et al. identified glial cell line-derived neurotrophic factor (GDNF) secreted by Sertoli cells as an SSC self-renewal factor [4]. GDNF and the GDNF family receptor-alpha 1 (GFRα1) on the SSC membranes form GDNF-GFRα1 complexes and activate RET, which further activates mitogen-activated protein kinase (MAPK), Src family kinase (SFK), and phosphatidylinositol-3-kinase-protein kinase B (PI3K-AKT) signaling pathways, regulating the self-renewal of SSCs [5]. Other cytokines, such as basic fibroblast growth factor (bFGF), epidermal growth factor (EGF), and leukemia inhibitory factor (LIF), [6,7] have been identified to maintain self-renewal of SSCs in vitro. With regard to intrinsic gene expression, transcription factors, such as bcl6b, etv5, and lhx1 influence SSC self-renewal under the control of GDNF [8,9]; however, Plzf, Oct4, and Taf4b have been implicated in the regulation of SSC proliferation through non-GDNF stimulation [8 –11]. However, the precise signaling mechanism involved in SSC self-renewal remains to be fully understood.
In our previous study, we established a stable SSC cell line and constructed its proteomic profile, containing a total of 682 proteins expressed in SSCs [12]. Of these, angiotensin I-converting enzyme (ACE) was identified with eight peptides in the SSC proteomic profile, suggesting that ACE was expressed in SSCs. ACE is an important component of the renin–angiotensin system, which converts angiotensin I to the active vasoconstrictor angiotensin II, and it plays a key role in regulating blood pressure. ACE has two isoforms: Somatic ACE (sACE), which is widely expressed and plays critical roles in hematopoiesis [13], hematopoietic cell proliferation [14], myogenic differentiation [15], and tumor progression [16], and the shorter molecular variant testicular ACE (tACE), which is exclusively expressed in haploid germ cells and plays important roles in reproduction [17,18].
In the present study, we studied the expression levels of sACE and tACE in mouse testis samples and cultured SSCs. Furthermore, we analyzed the effect of the ACE inhibitor captopril in SSCs cultured in vitro. We also developed a sAce knockdown SSC line using shRNA and studied the differential genetic expression using microarray gene expression profiles. Finally, we detected the expression level of P38, ERK, and their phosphorylated forms by western blot analysis to study the involvement of the MAPK signaling pathway.
Materials and Methods
Animals
All animal experimentation protocols were approved by the Ethics Committee of Nanjing Medical University (China). Institute of Cancer Research (ICR) mice were maintained in a 12-h light–12-h dark cycle at 20°C–22°C and 50%–70% humidity with food and water provided ad libitum. Testicle samples were obtained postnatally from 3.5- to 4.5-day-old ICR mice.
SSC culture conditions
Long-term culture of mouse SSCs was established according to a previously described protocol [12]. Briefly, dissociated testis cells were cultured on a 0.2% (w/v) gelatin-coated tissue culture plate (2 × 10⁵ cells/3.8 cm2) overnight. The plates were washed twice with phosphate-buffered saline (PBS) before use. Many cells attached to the plate after overnight incubation, but a significant number of germ cells remained floating. The floating cells were passaged to secondary culture plates after vigorous pipetting. Within 1 week, the transferred cells proliferated and formed colonies on top of the flat cell layer. These cells were then passaged two or three times before they were transferred to a medium containing mouse embryonic fibroblasts (MEFs) that were pretreated with mitomycin to prevent cell proliferation. Self-renewing SSCs are present in colonies of germ cells attached to the underlying MEF feeders. SSC cells were cultured in StemPro-34 SFM supplemented with StemPro supplement (Invitrogen), 25 μg/mL insulin, 100 μg/mL transferrin, 60 μM putrescine, 30 nM sodium selenite, 6 mg/mL
Detection of sACE distribution through RT-PCR, western blot analysis, and double immunofluorescence
RNA extract was obtained from MEFs, SSCs, the Sertoli cell line TM4, and from the testis samples of mice at 0.5 days, 1 week, and 8 weeks postnatally using a Tiangen RNA Isolation Kit for RT-PCR. The cDNA was synthesized using PrimeScript® RT Master Mix (DR036A; TaKaRa, Japan), according to the manufacturer's protocol. Specific primers for sAce and tAce (Table 1) were used for PCR amplification. PCR was performed with a final reaction volume of 20 μL, containing 2 μL of cDNA, 10 μL of 2 × GoTaq® Green Master Mix (M7122; Promega), 1 μL of each primer, and 6 μL sterile water.
F, forward; R, reverse.
Western blot analysis was used to determine the sACE, tACE, and TUBULIN protein levels in mouse SSCs and in testis tissue collected at three time points (0.5 days, 1 week, and 8 weeks postnatally). Anti-ACE antibodies (SC-12187; Santa Cruz Biotechnology) that could identify both isoforms were commercially obtained and used at a dilution of 1:200. Tubulin (1:5,000 dilution; Beyotime Institute of Biotechnology, Jiangsu, China) was used as the positive control.
Mouse seminiferous tubules were dissected on postpartum day 3.5. SSCs were cultured on MEF feeders in a Millicell EZ slide (Millipore Corporation). Both mouse samples and cells were fixed with 4% formaldehyde in PBS for 40 min, washed thrice with PBS for 15 min each time, and then blocked with 1% BSA (Triton) for 2 h at room temperature. The cells were then incubated at 4°C, overnight with primary antibodies (sACE, 1:200; DDX4, 1:500; GFRα1, 1:500; PLZF, 1:500), and then incubated with secondary antibody at a 1:1,000 dilution for 2 h at room temperature. The nucleus was stained with 4′,6-diamidino-2-phenylindole (DAPI) for 15 min.
Inhibition of sACE through captopril and lentivirus-mediated shRNA knockdown of sAce in cultured SSCs
At 4–5 days after the passage of SSCs, 0.01 or 0.001 M of captopril was added to the SSC culture and the cells were incubated for an additional 24 h. SSCs cultured in normal medium or in medium containing 0.01 M double-distilled water (ddH2O) served as the normal and negative controls, respectively.
We designed three different shRNAs for sAce knockdown: mus-sAce-1162 shRNA directed against nucleotides 1162–1181, mus-sAce-2952 shRNA directed against nucleotides 2952–2961, and mus-sAce-2248 shRNA directed against nucleotides 2248–2266 of NM_207624.5 (Table 1). The PLVX-shRNA lentiviral vector contains a U6 PolIII promoter sequence for expressing shRNA-sAce and a puromycin selection site. Lentiviral particles were generated by Likeli Biotechnology, Beijing. Briefly, shRNA plasmids and lentiviral packaging plasmids were cotransfected into HEK293T cells using CaCl2 transfection. Virus particles were harvested 48 h after transfection. Lentiviral sAce knockdown was carried out simultaneously with SSC passage. Cells were infected according to a multiplicity of infection of 20 in SSC culture medium supplemented with 5 μg/mL polybrene for 8–10 h. After the infection, SSCs were plated onto the feeder and cultured in SSC medium. RNA extraction, quantitative real-time polymerase chain reaction (qRT-PCR), and 5-ethynyl-2′-deoxyuridine (EdU) assay were performed after culture for 72 h. 18S RNA was used as the internal reference gene.
EdU incorporation assay
The EdU incorporation assay with staining was performed using the Cell-Light™ EdU Apollo®488 In Vitro Imaging Kit (RiboBio). At 4–5 days after the passage of SSCs, 0.01 M of captopril was added to the SSC culture medium, and the cells were incubated for an additional 24 h. The SSCs were further cultured in medium containing 50 μM EdU for 2 h before they were stained according to the manufacturer's instructions. SSCs were cultured in normal medium following EdU incorporation served as the positive control, whereas SSCs cultured without EdU served as the negative control. Images were captured on a laser confocal microscope (Zeiss LSM700, Carl Zeiss, Oberkochen, Germany). To assess EdU incorporation, flow cytometry was carried out using the Click-iT® EdU Alexa Fluor® 488 Flow Cytometry Assay Kit (C10425; Life Technologies). In this assay, the SSCs were cultured in a medium containing 0.01 M EdU for 2 h before staining according to the manufacturer's instructions. Flow cytometry was performed using BD FACSCalibur.
Cell cycle analysis
SSCs cultured with or without captopril were digested into single cell suspensions. The cells were resuspended in 300 μL Dulbecco's phosphate-buffered saline (DPBS), gently mixed with 700 μL of precooled anhydrous ethanol, and incubated overnight at −20°C. After fixation with anhydrous ethanol, the cells were centrifuged at 2,500 rpm for 10 min. Finally, they were stained with DAPI in the dark for 20 min and washed once with DPBS. The cells were then resuspended in 150–200 μL DPBS and used for the flow cytometry assay (BD FACSVerse).
Terminal deoxyribonucleotidyl transferase (TdT)-mediated dUTP-digoxigenin nick-end labeling
Terminal deoxyribonucleotidyl transferase (TdT)-mediated dUTP-digoxigenin nick-end labeling (TUNEL) assay was performed using an Apoptosis Detection Kit (Vazyme Biotech Co., Ltd).
Immunofluorescence detection: SSCs were cultured in Millicell (Millipore) with or without captopril for 4 days. The cells were washed twice with DPBS and fixed in 4% paraformaldehyde (PFA) for 30 min. Then, 20 μg/mL of Proteinase K solution was added for membrane permeability, and the cells were washed with DPBS and balanced with 1 × equilibration buffer. The cells were then incubated with TdT (Bright Red) incubation buffer at 37°C for 60 min in the dark. Finally, they were stained with DAPI for 30 s and detected using a laser confocal microscope (Zeiss LSM700).
Flow cytometry detection: After transfection with shRNA for 10 h, the SSCs were cultured for 3 days. Approximately 3 × 10⁵ SSCs were gently shifted by a pipettor and digested into single suspension. Briefly, cells washed twice with DPBS and fixed in 1% PFA for 20 min at 4°C. The cells were then incubated with 70% ethanol, precooled on ice at −20°C for 4 h. After balancing with 1 × equilibration, the cells were incubated with TdT (bright green) incubation buffer at 37°C for 60 min in the dark. Finally, the cells were resuspended in DPBS containing 5 μg/mL of propidium iodide (PI) and incubated at 37°C for 30 min. Apoptotic cells were detected by flow cytometry.
Microarray gene expression analysis
Total RNA was extracted from three separate mouse SSC samples treated with 0.01 M captopril and three SSC samples without captopril treatment (negative control [NC]) using TRIzol reagent (Invitrogen). The RNA was then purified with the mirVana miRNA Isolation Kit (Ambion) according to the manufacturer's protocol. RNA quality was assessed by 1% formaldehyde denaturing gel electrophoresis. After RNA amplification, the cDNA was labeled with a fluorescent dye (Cy5 and Cy3-dCTP), and arrays were hybridized for final scanning by an Agilent G2565CA Microarray Scanner.
Microarray imaging and data analysis
Data summarization, normalization, and quality control were analyzed using the GeneSpring Software V13 (Agilent). Threshold values of ≥2 and ≤−2-fold change were used to identify the differentially expressed genes that were upregulated and downregulated, respectively, with a Benjamini–Hochberg corrected P value of 0.05. Pathway analysis was carried out using the Kyoto Encyclopedia of Genes and Genomes (KEGG) pathway tool (
qRT-PCR validation
Total RNA was isolated and reverse transcribed using PrimeScript RT Master Mix (DR036A) for mRNAs in accordance with the manufacturer's instructions. qRT-PCR was performed on a StepOnePlus Real-time PCR System using SYBR Premix Ex Taq (Vazyme). Table 1 lists the specific primers used in this analysis. Briefly, the samples were denatured at 95°C for 6 min, and amplified using 40 cycles of 95°C for 5 s, 60°C for 30 s, and 72°C for 30 s. The relative gene expression was then calculated using 2−ΔΔCt and normalized to the expression of Gapdh, which was used as the internal reference gene. Analysis was carried out in triplicate, and the median in each triplicate set was used to calculate the relative mRNA levels (ΔCt = Ct median of mRNAs − Ct median of Gapdh). The mean and standard deviation were obtained from measurements conducted in triplicate, and all trials were repeated three times. Data were statistically analyzed using the Student's t-test.
Detection of MAPK signaling through western blot analysis
SSCs were cultured for 4–5 days and treated with 0.01 M captopril for 30 min, 1, 2, 4, and 24 h. Proteins were extracted from the treated SSCs and the P38, PP38, ERK, and P-ERK protein levels were detected by western blot analysis using corresponding antibodies (all 1:1,000 dilution). The membrane was washed in TBST buffer for 15 min, then incubated with secondary antibodies (1:4,000) at room temperature for 2 h.
Results
sACE is expressed in mouse SSCs
ICR mouse SSCs were established, and several markers (PLZF, GFRα1, and OCT4) were identified (Supplementary Fig. S1; Supplementary Data are available online at
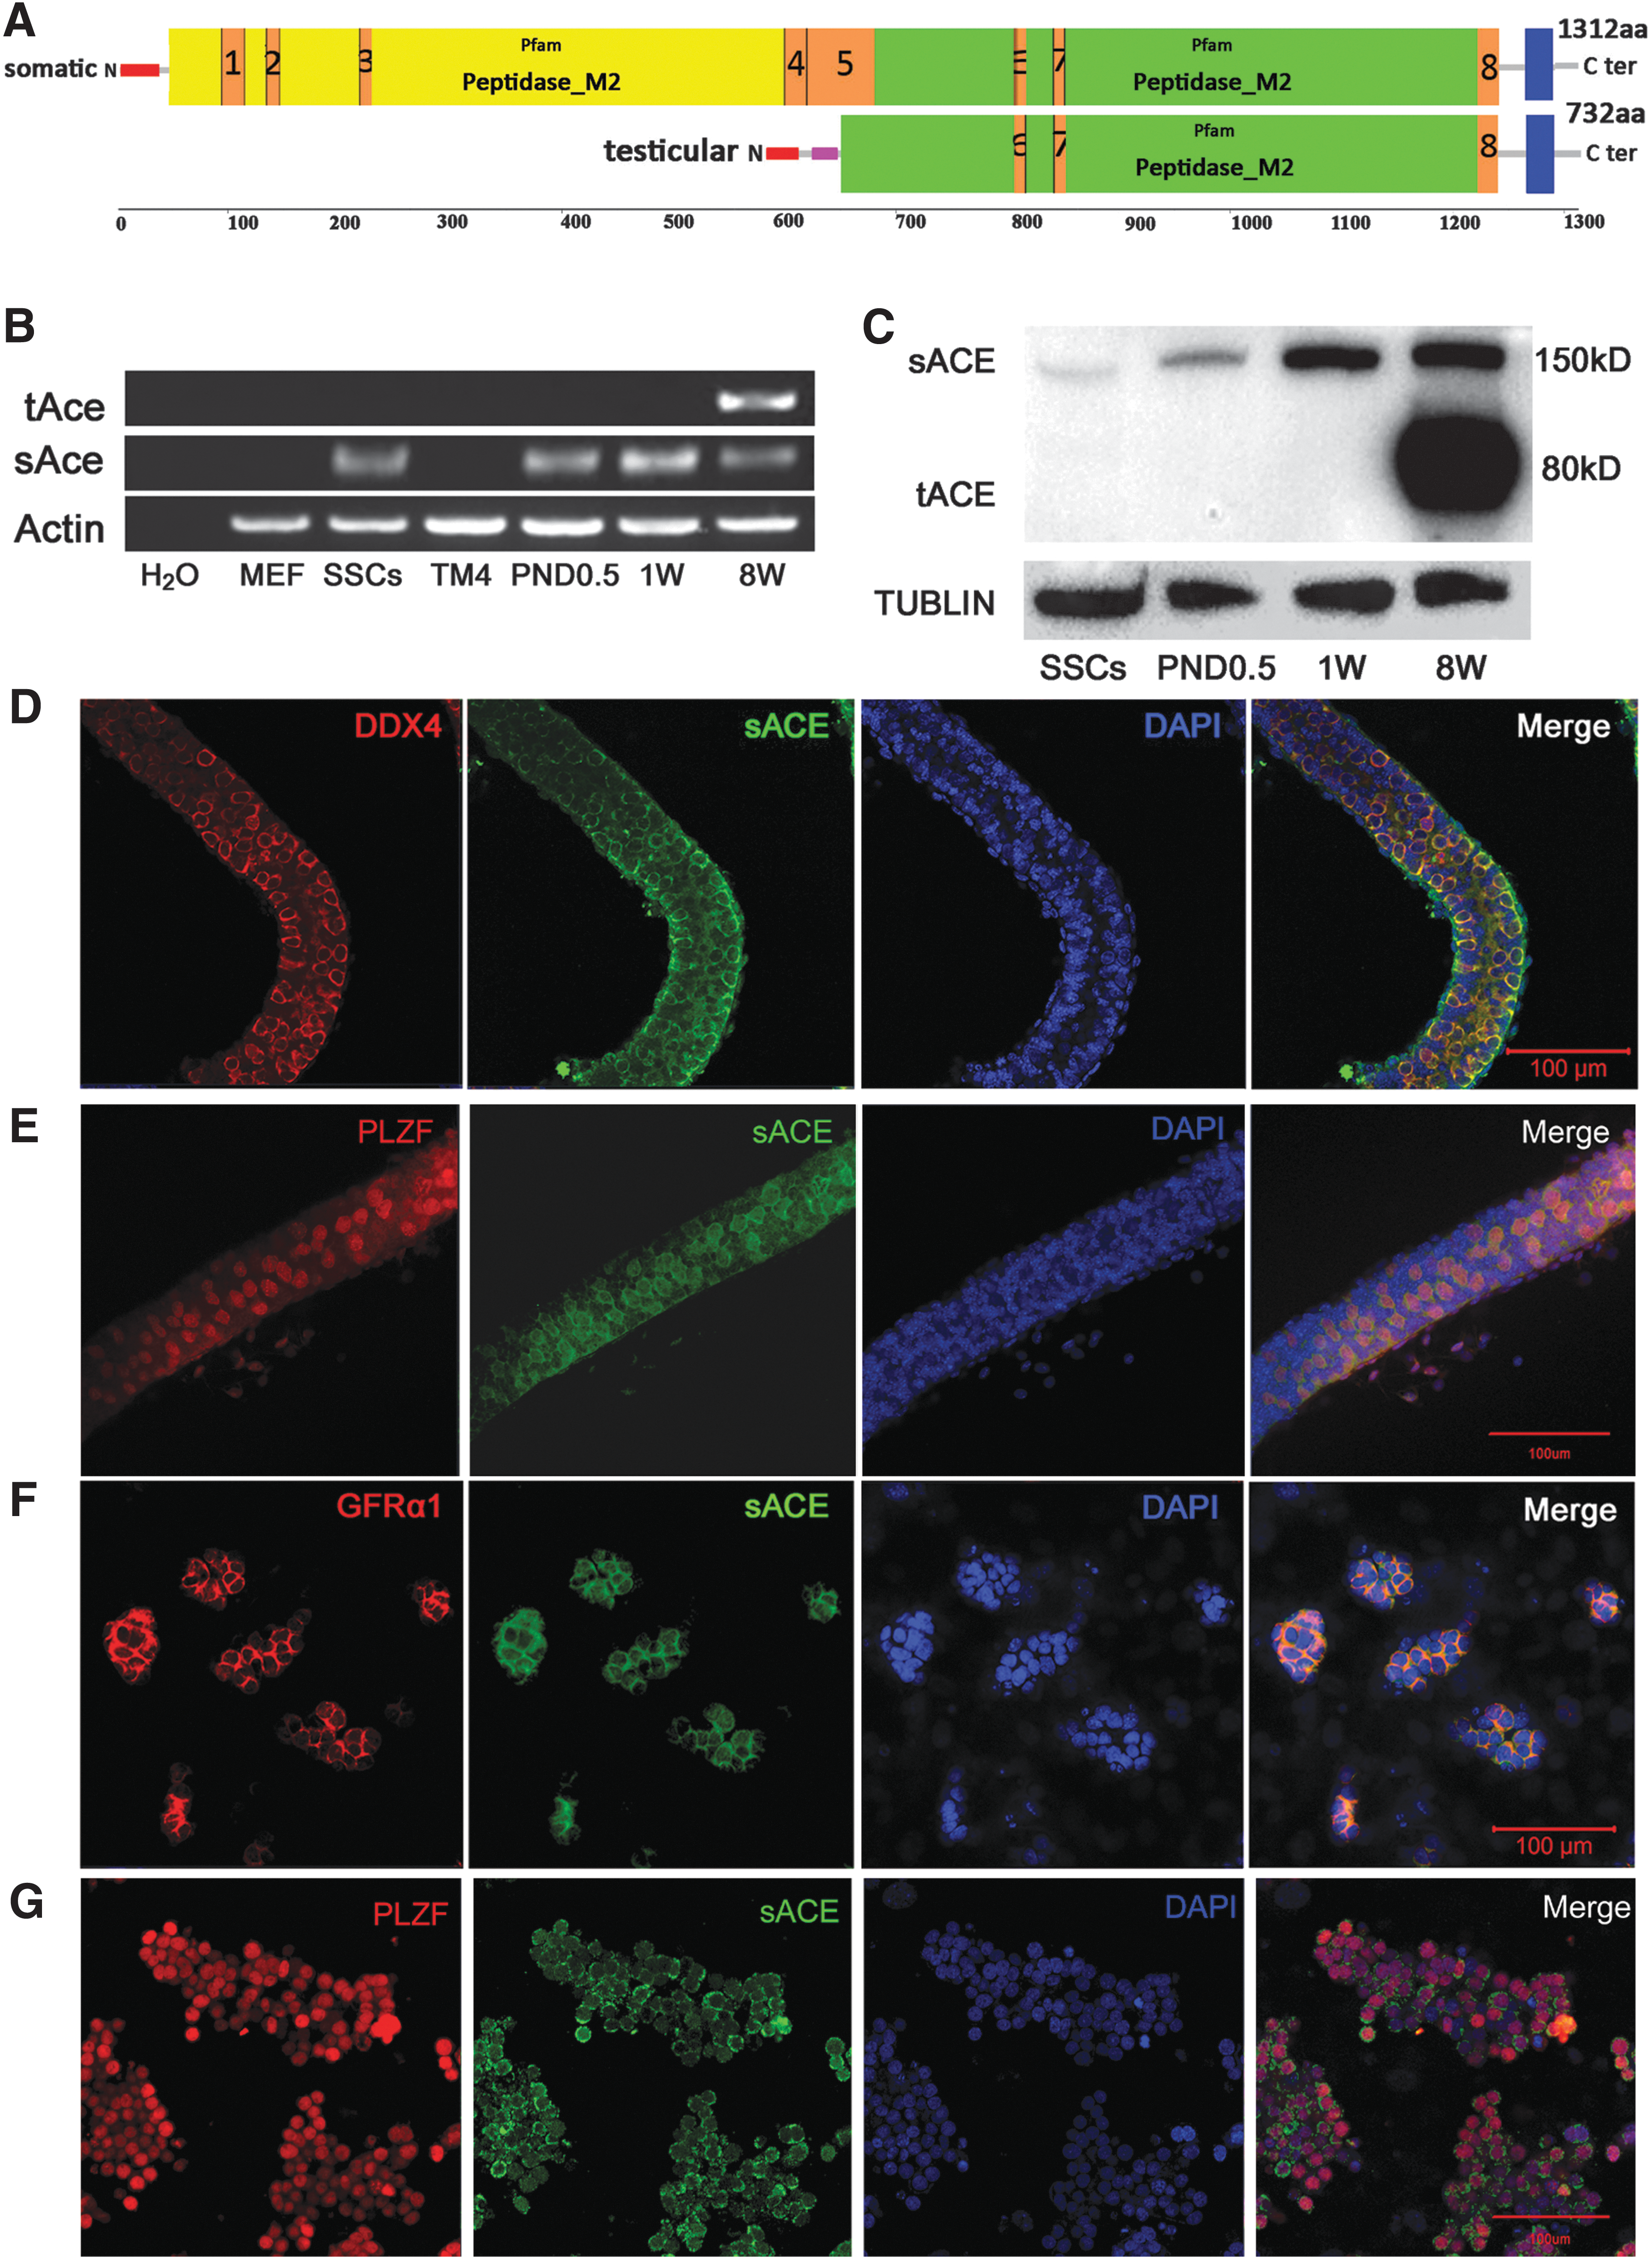
Structure and expression of ACE in mouse testes and SSCs.
We then observed sACE localization in mouse SSCs. At 3.5 days postpartum, there are only two cell types in mouse seminiferous tubules: spermatogonia and Sertoli cells. Double immunostaining revealed that at this stage, sACE was colocalized in spermatogonia with the classical germ cell marker DDX4 (Fig. 1D) and the signals were around the nucleus (PLZF as the nuclear marker, Fig. 1E). Then, we detected sACE localization in cultured SSCs using PLZF and GFRα1 as the classic undifferentiated spermatogonial membrane marker. The results revealed that sACE was expressed as a membrane signal, and its expression pattern was similar to that of the GFRα1 (Fig. 1F) and was located around the nucleus (Fig. 1G).
sACE inhibition in cultured SSCs leads to decreased SSC proliferation, G0/G1 arrest, and increased apoptosis
To explore the effects of sACE on the development of SSCs in in vitro culture, we designed two ways of inhibiting sACE activity: using the specific inhibitor captopril and using shRNA targeting sAce. First, captopril, a competitive inhibitor of ACE, was added into SSC culture at different doses (0.01 and 0.001 M) and incubated for 24 h. The EdU incorporation assay was used to detect SSC proliferation. The percentage of EdU-positive SSCs was determined by flow cytometry. The results revealed that the percentage of EdU-positive SSCs in the positive control was 42.13%, whereas it was 11.59% and 26.05% in the 0.01 and 0.001 M captopril treatment groups, respectively (Fig. 2A). The results revealed a significant difference between the positive control and captopril treatment groups (P < 0.001), and the effect was dose dependent (Fig. 2B). We further verified that the signal of EdU-positive SSCs was decreased after treatment with 0.01 M captopril (Fig. 2C).
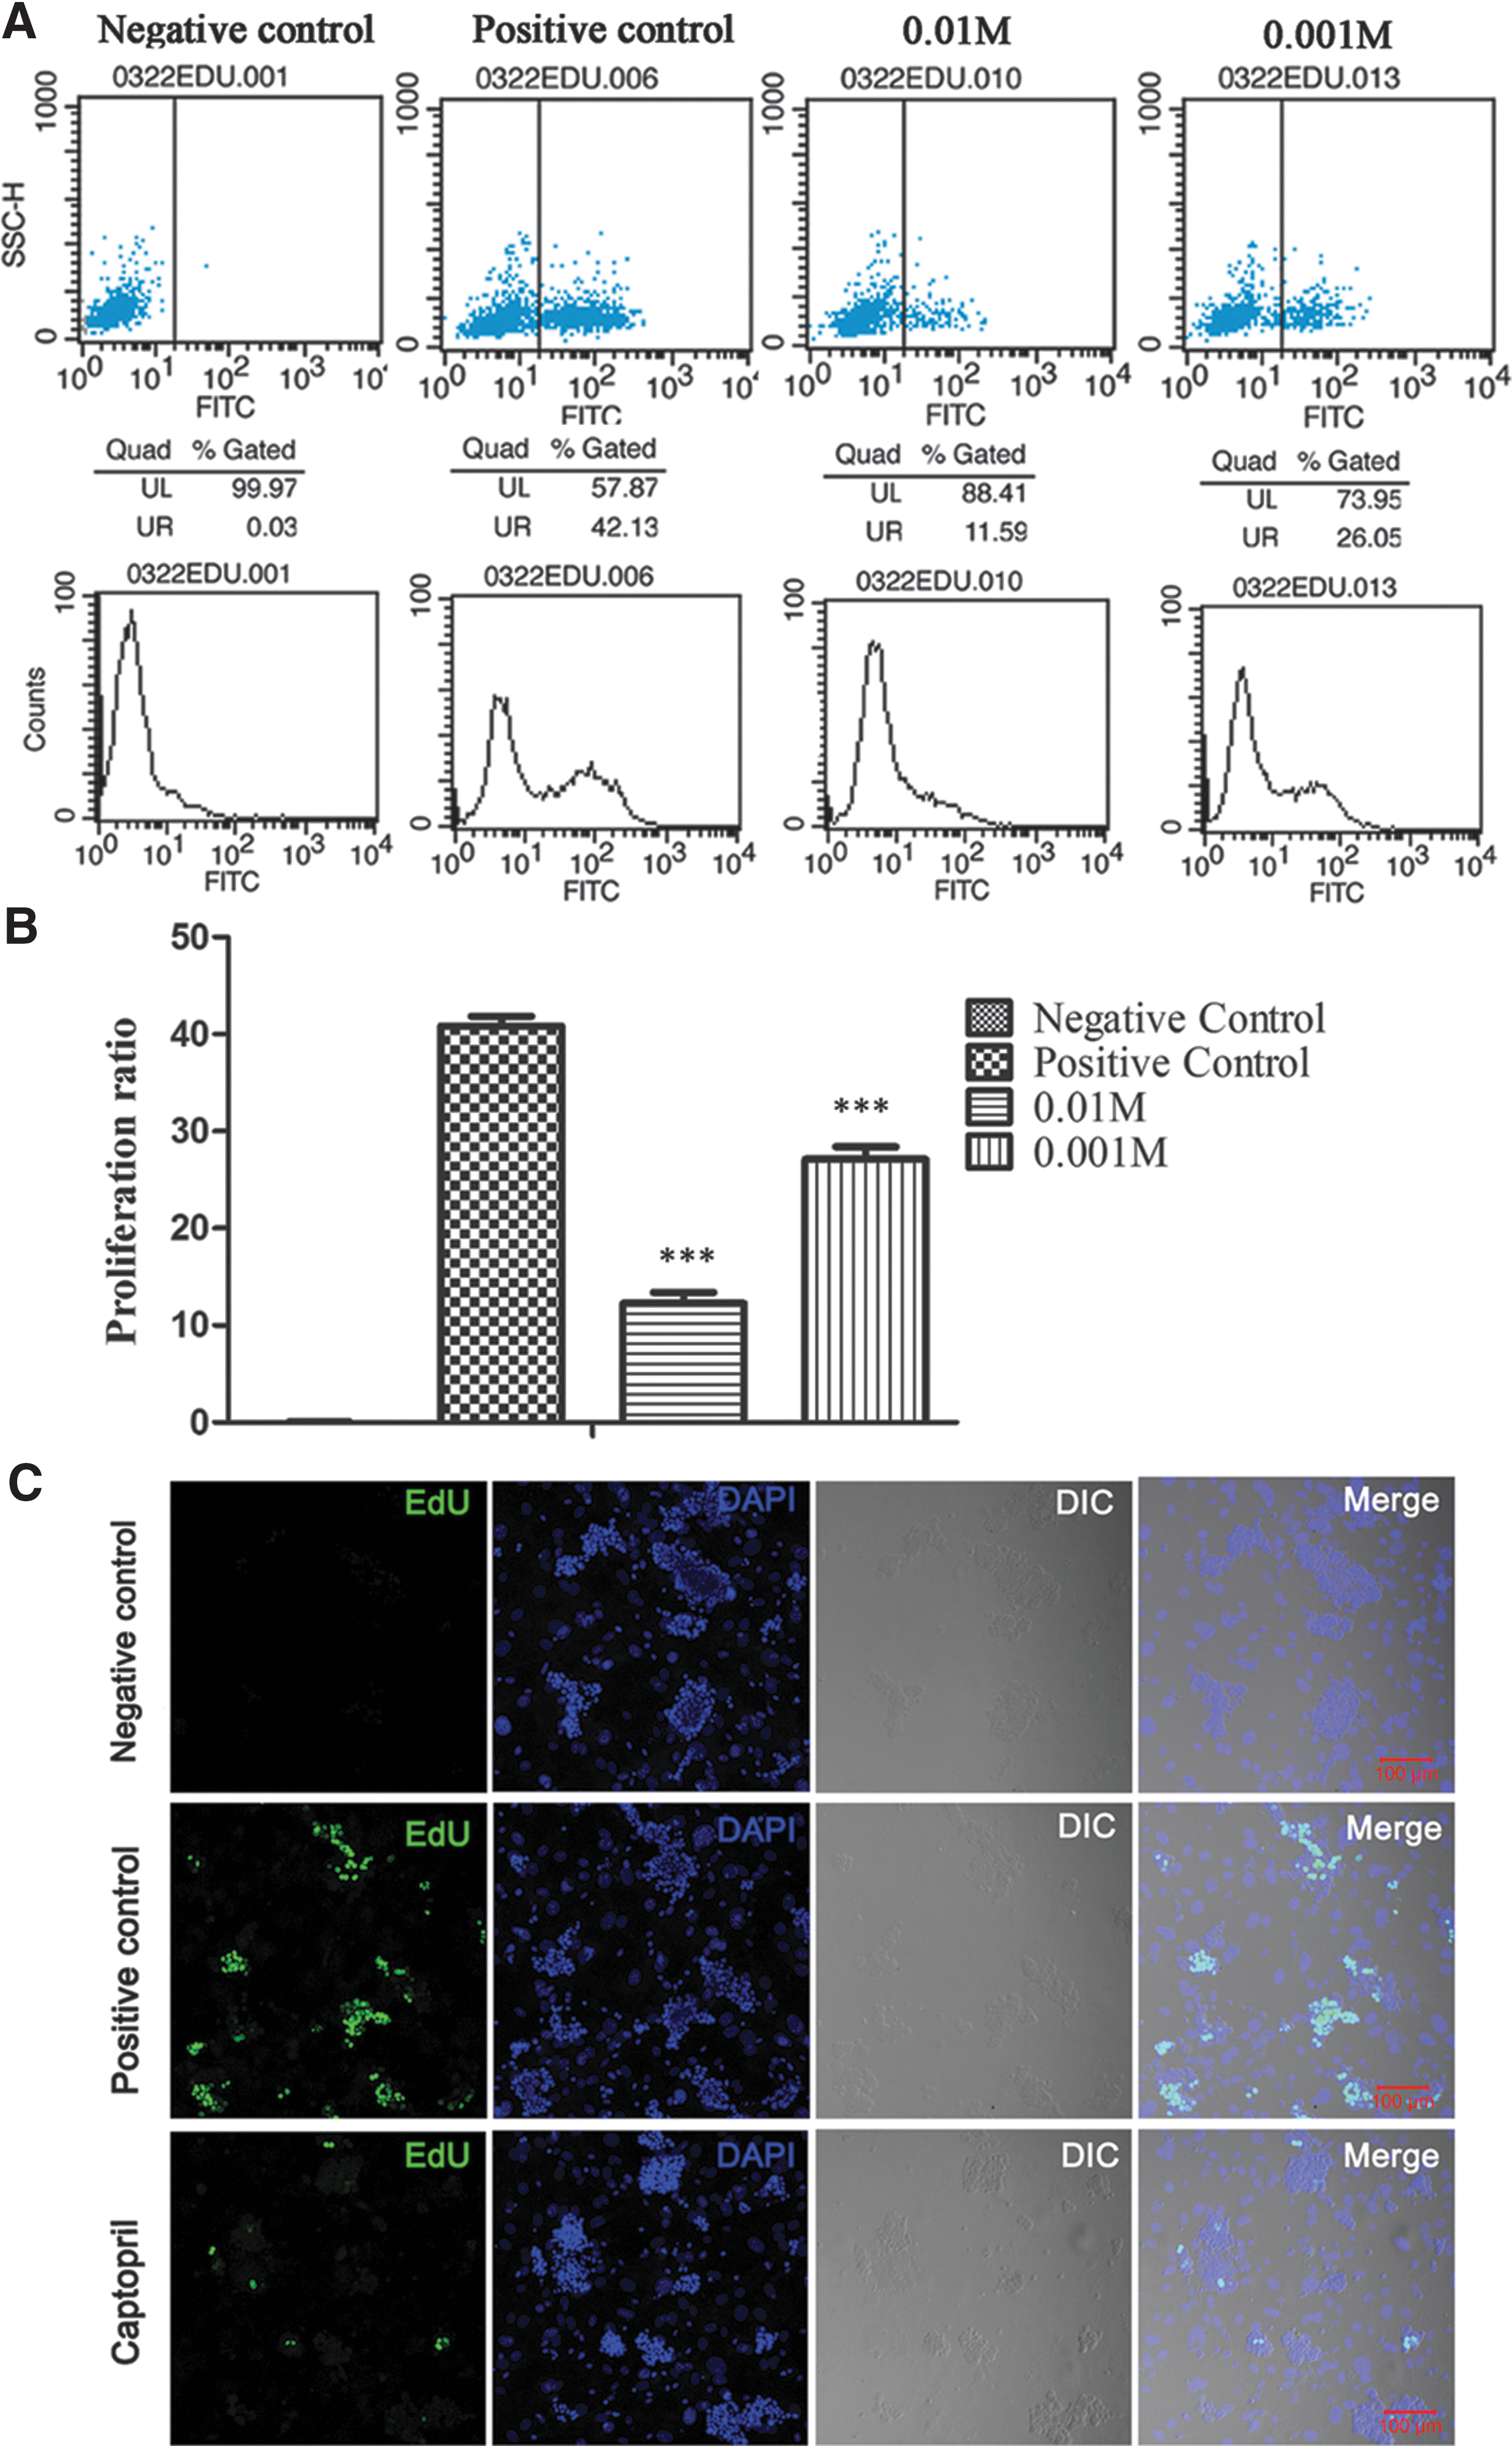
Inhibition of sACE through captopril in cultured SSCs leads to decreased SSC proliferation.
Cultured SSCs were transduced with lentiviruses encoding sh1162, sh2952, and sh2248 against sAce, which reduced the sAce transcript levels by 67.85%, 65.38%, and 49.05%, respectively, as determined through qRT-PCR (Fig. 3A). After incubation with the lentiviruses for 24 h, we carried out the EdU incorporation assay in the SSC cultures. As shown in Fig. 3B, the EdU signals were fewer and the colony sizes were considerably smaller in the cells transduced with sh1162-, sh2952-, and sh2248-encoding lentivirus, respectively, than in the cells transduced with shVector.
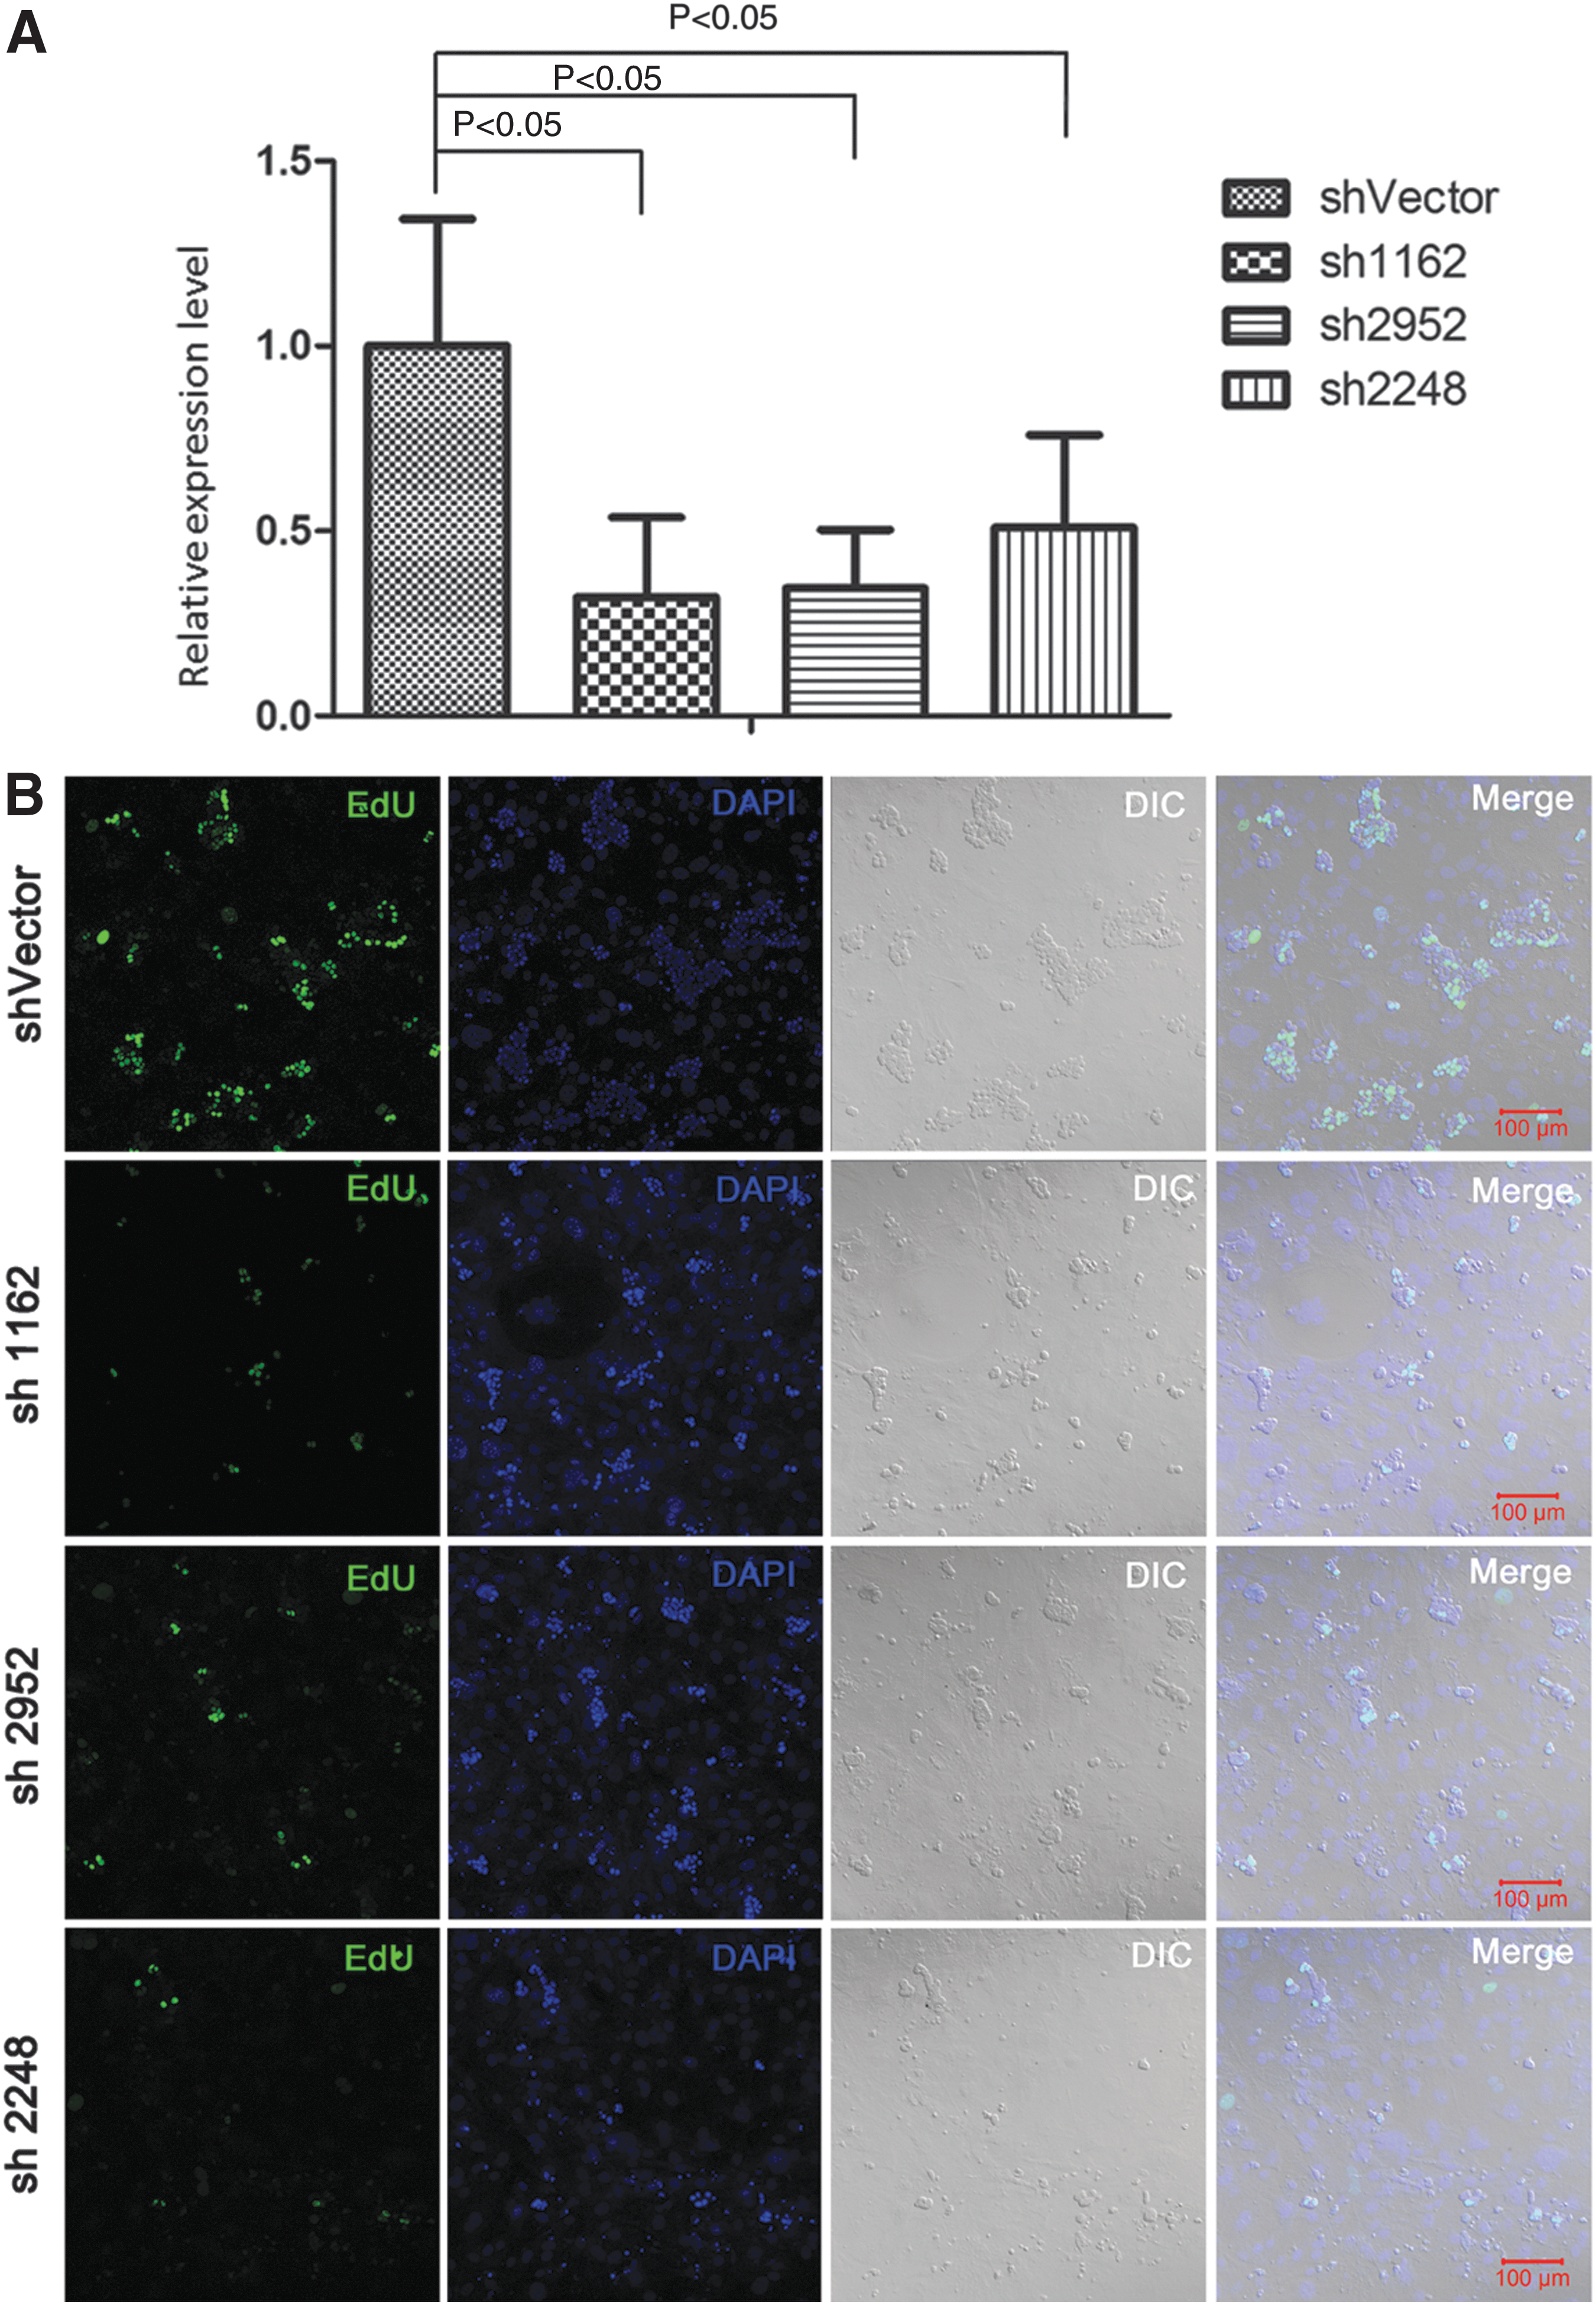
sAce knockdown through shRNAs impairs proliferation of mouse SSCs in vitro.
Furthermore, cell cycle analysis by flow cytometry revealed that inhibition of sACE activity using 0.01 M captopril significantly lowered the percentage of cells in the S phase (P < 0.01) and significantly increased the percentage of cells in the G0/G1 phase (P < 0.001) compared with the negative control, whereas the percentage of cells in each cell cycle phase nearly recovered following captopril withdrawal (Fig. 4A, B). This result suggested that sACE activity inhibition could prevent the transition of SSCs from the G0/G1 phase to the S phase and that the effect of captopril was reversible. Finally, TUNEL assay through immunofluorescence revealed that captopril treatment resulted in an increase of apoptosis in SSCs (Fig. 4C). Flow cytometry repeated three times revealed that the shRNA group had a higher proportion of apoptotic cells than the shVector group, and the percentages of apoptotic cells in the shVector, sh1162, sh2952, and sh2248 groups were 1.14%, 55.9%, 55.5%, and 35.0%, respectively, in one of the experiments (Fig. 4D, E).
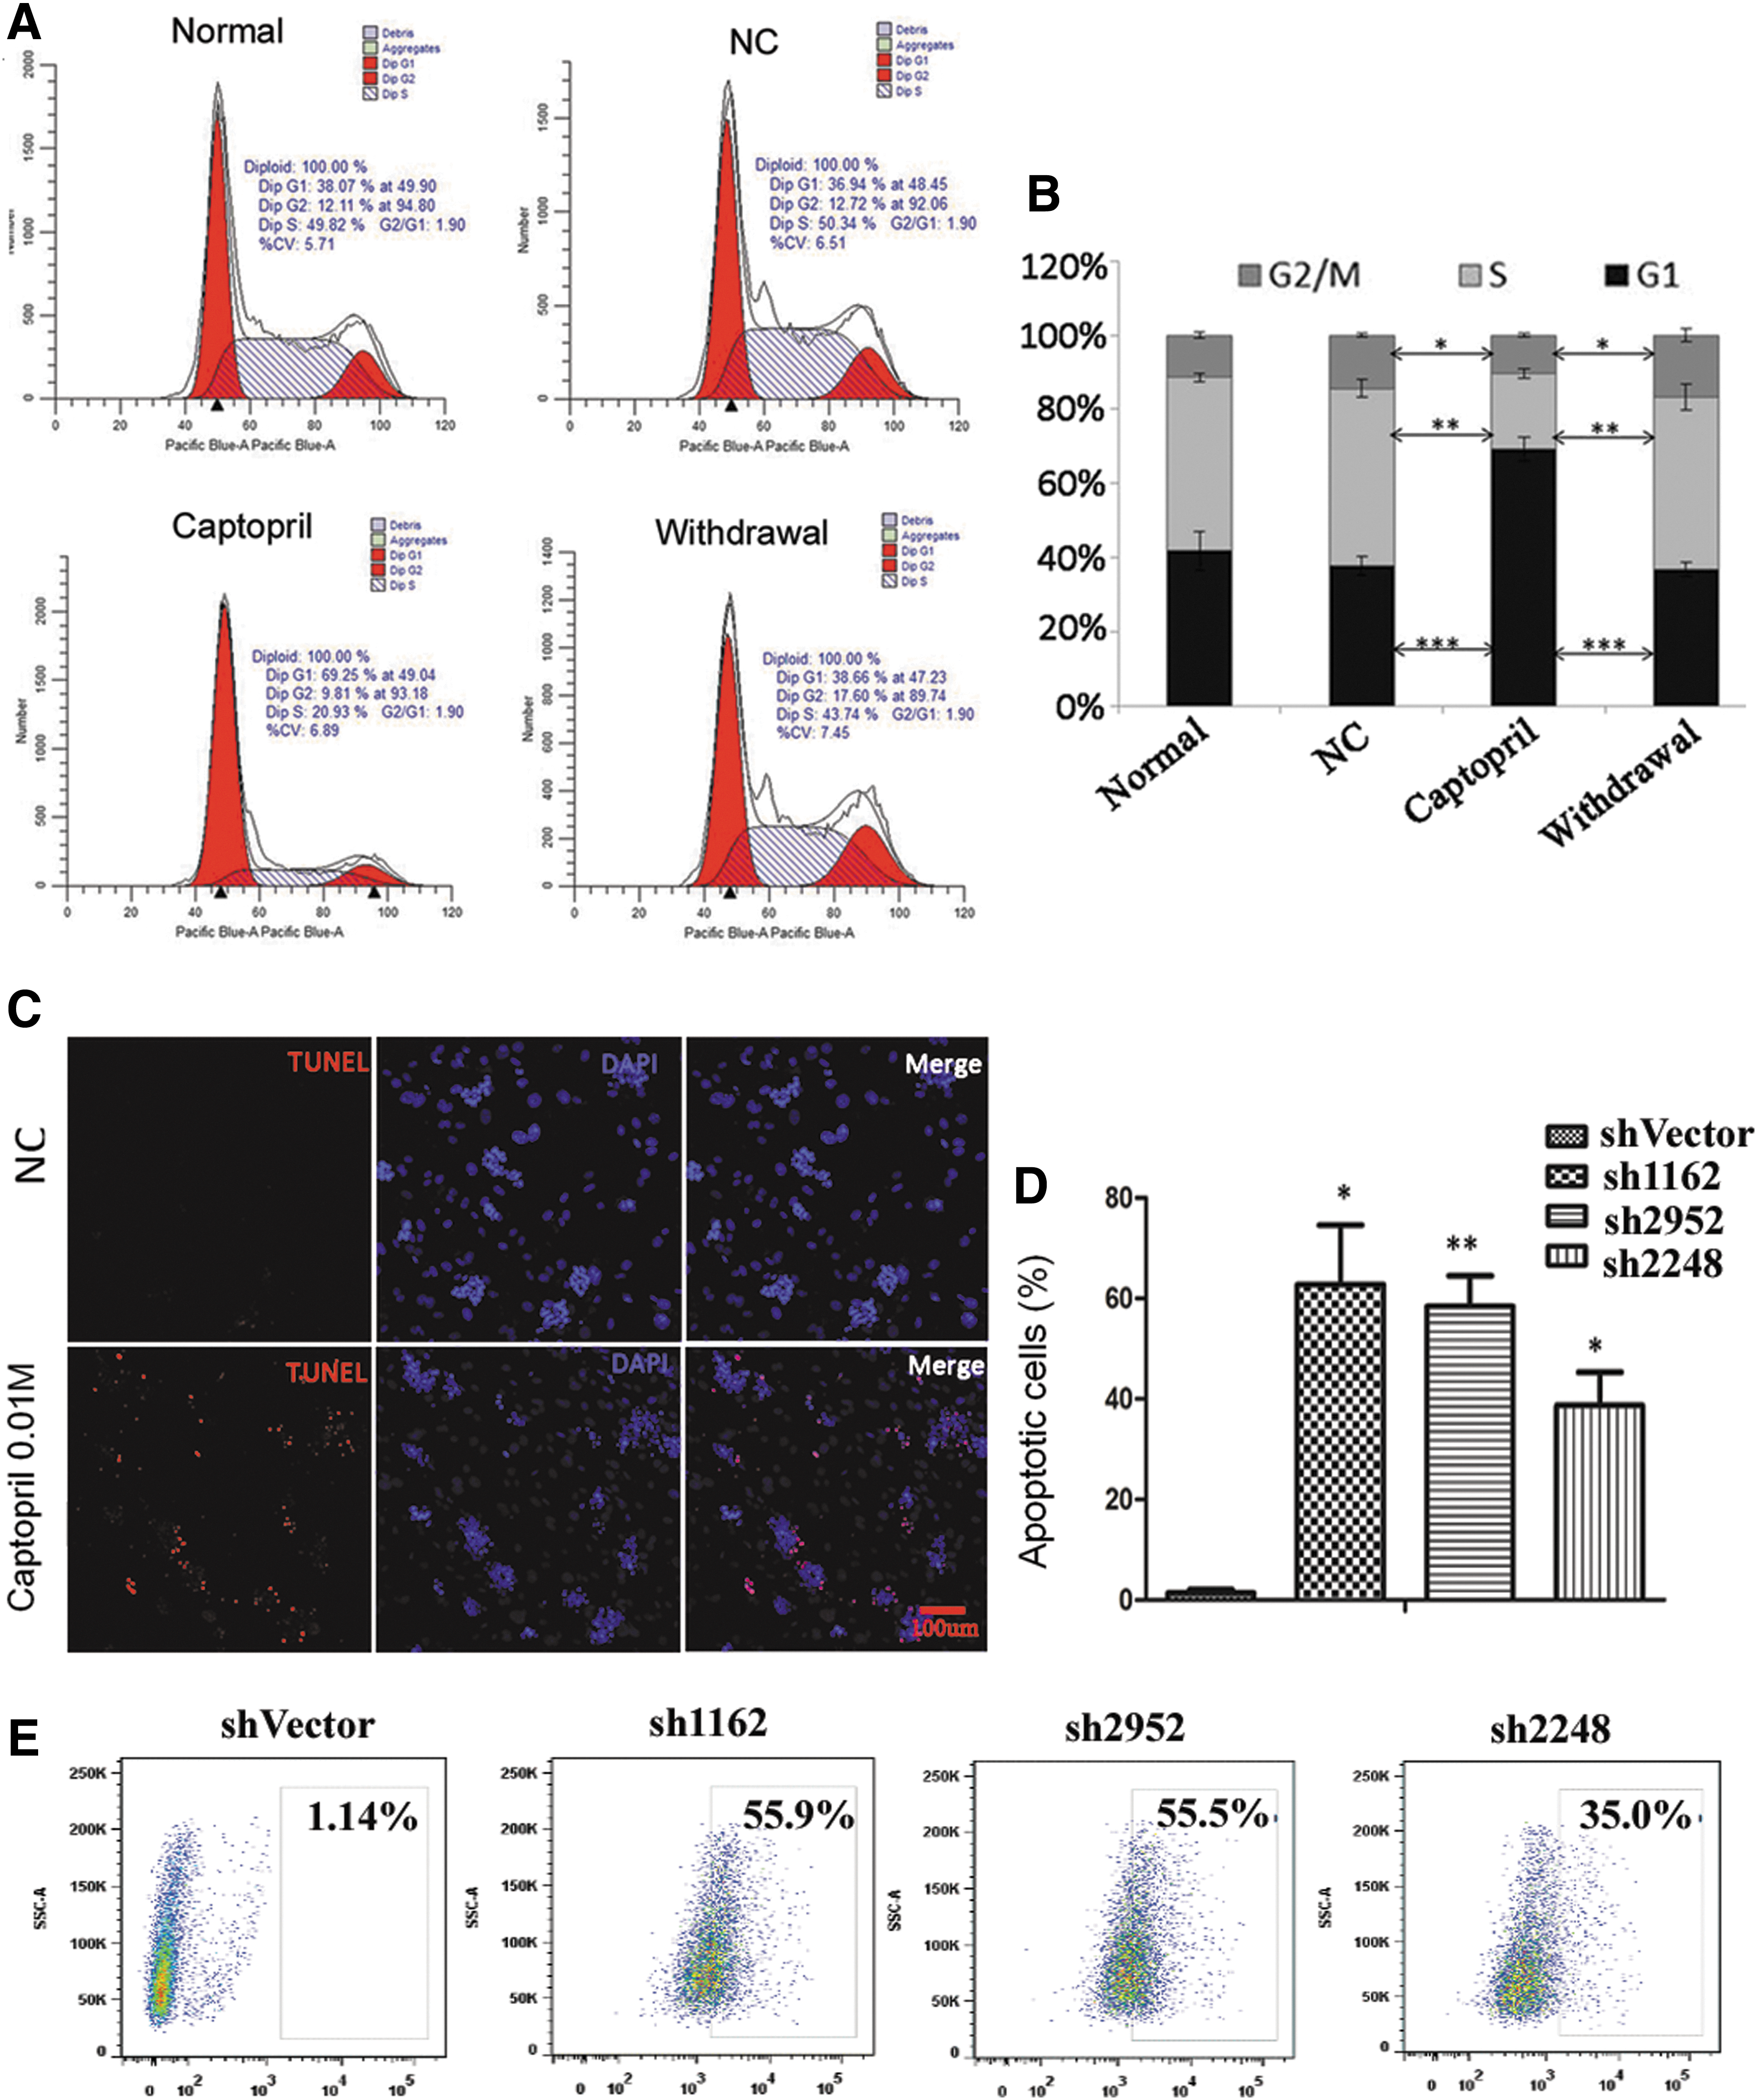
Inhibition of sACE through captopril in cultured SSCs leads to G0/G1 arrest and increased apoptosis.
Differential gene expression profiling of mouse SSCs with or without captopril treatment
To define the mechanism by which sACE regulates the self-renewal of SSCs, we studied the differential gene expression profile following treatment with captopril. Results of the microarray analysis revealed that a total of 651 genes were differentially expressed (fold change >2, P < 0.05). Of these, 297 were remarkably upregulated and 354 were downregulated in three comparison groups treated with captopril (
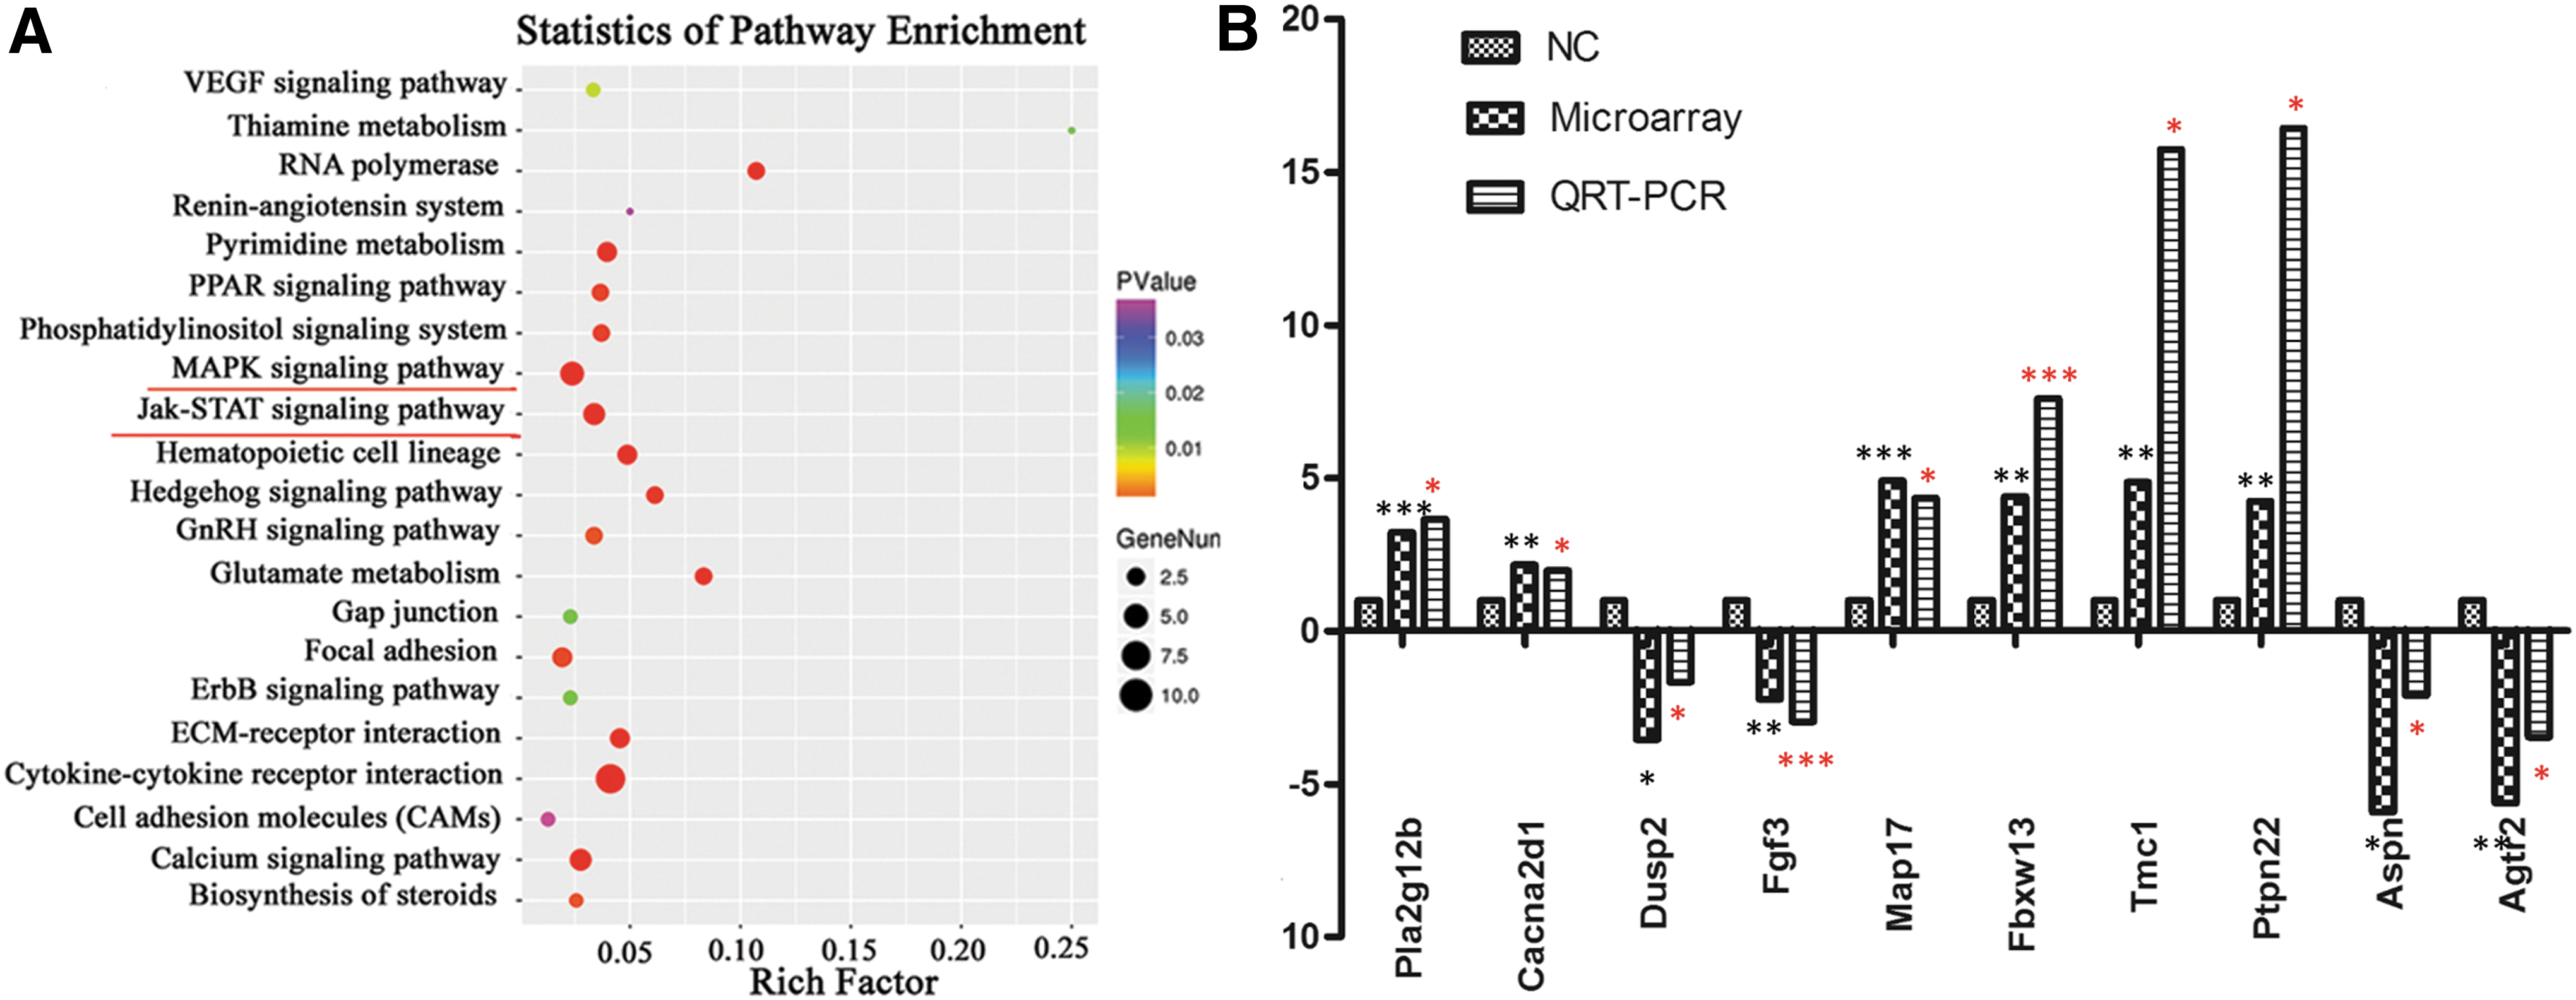
KEGG pathway analysis of differential gene expression profiling of mouse SSCs with or without captopril treatment, and validation of differential expression of selected genes by qRT-PCR analysis.
Validation of differential expression of selected genes by qRT-PCR analysis
To verify the reliability of the microarray results, we performed qRT-PCR with six randomly selected genes (Map17, Fbxw13, Tmc1, Ptpn22, Aspn, and Agtr2) and four MAPK signaling-related genes (Pla2g12b, Cacna2d1, Dusp2, and Fgf3). Of these, Pla2g12b, Cacna2d1, Map17, Fbxw13, Tmc1, and Ptpn22 were upregulated, whereas Dusp2, Fgf3, Aspn, and Agtr2 were downregulated after captopril treatment, as determined in the microarray analysis. Furthermore, the qRT-PCR results revealed that the expression levels of the selected genes were consistent with the microarray data (Fig. 5B).
Detection of MAPK signaling
Following the above results of the differential gene expression profile, we focused on the MAPK signaling pathways. Western blot analysis was used to determine the expression levels of P38, ERK, and their phosphorylated forms in the control and captopril-treated groups. We noted that there was no change in the expression of P38 and ERK, whereas the levels of phosphorylated P38 and ERK MAPK decreased with time (1, 2, 4, and 24 h) after incubation with 0.01 M captopril (Fig. 6A). Furthermore, the percentage of PP38/P38 and P-ERK/ERK differed significantly compared with the control after 1 h (Fig. 6B).
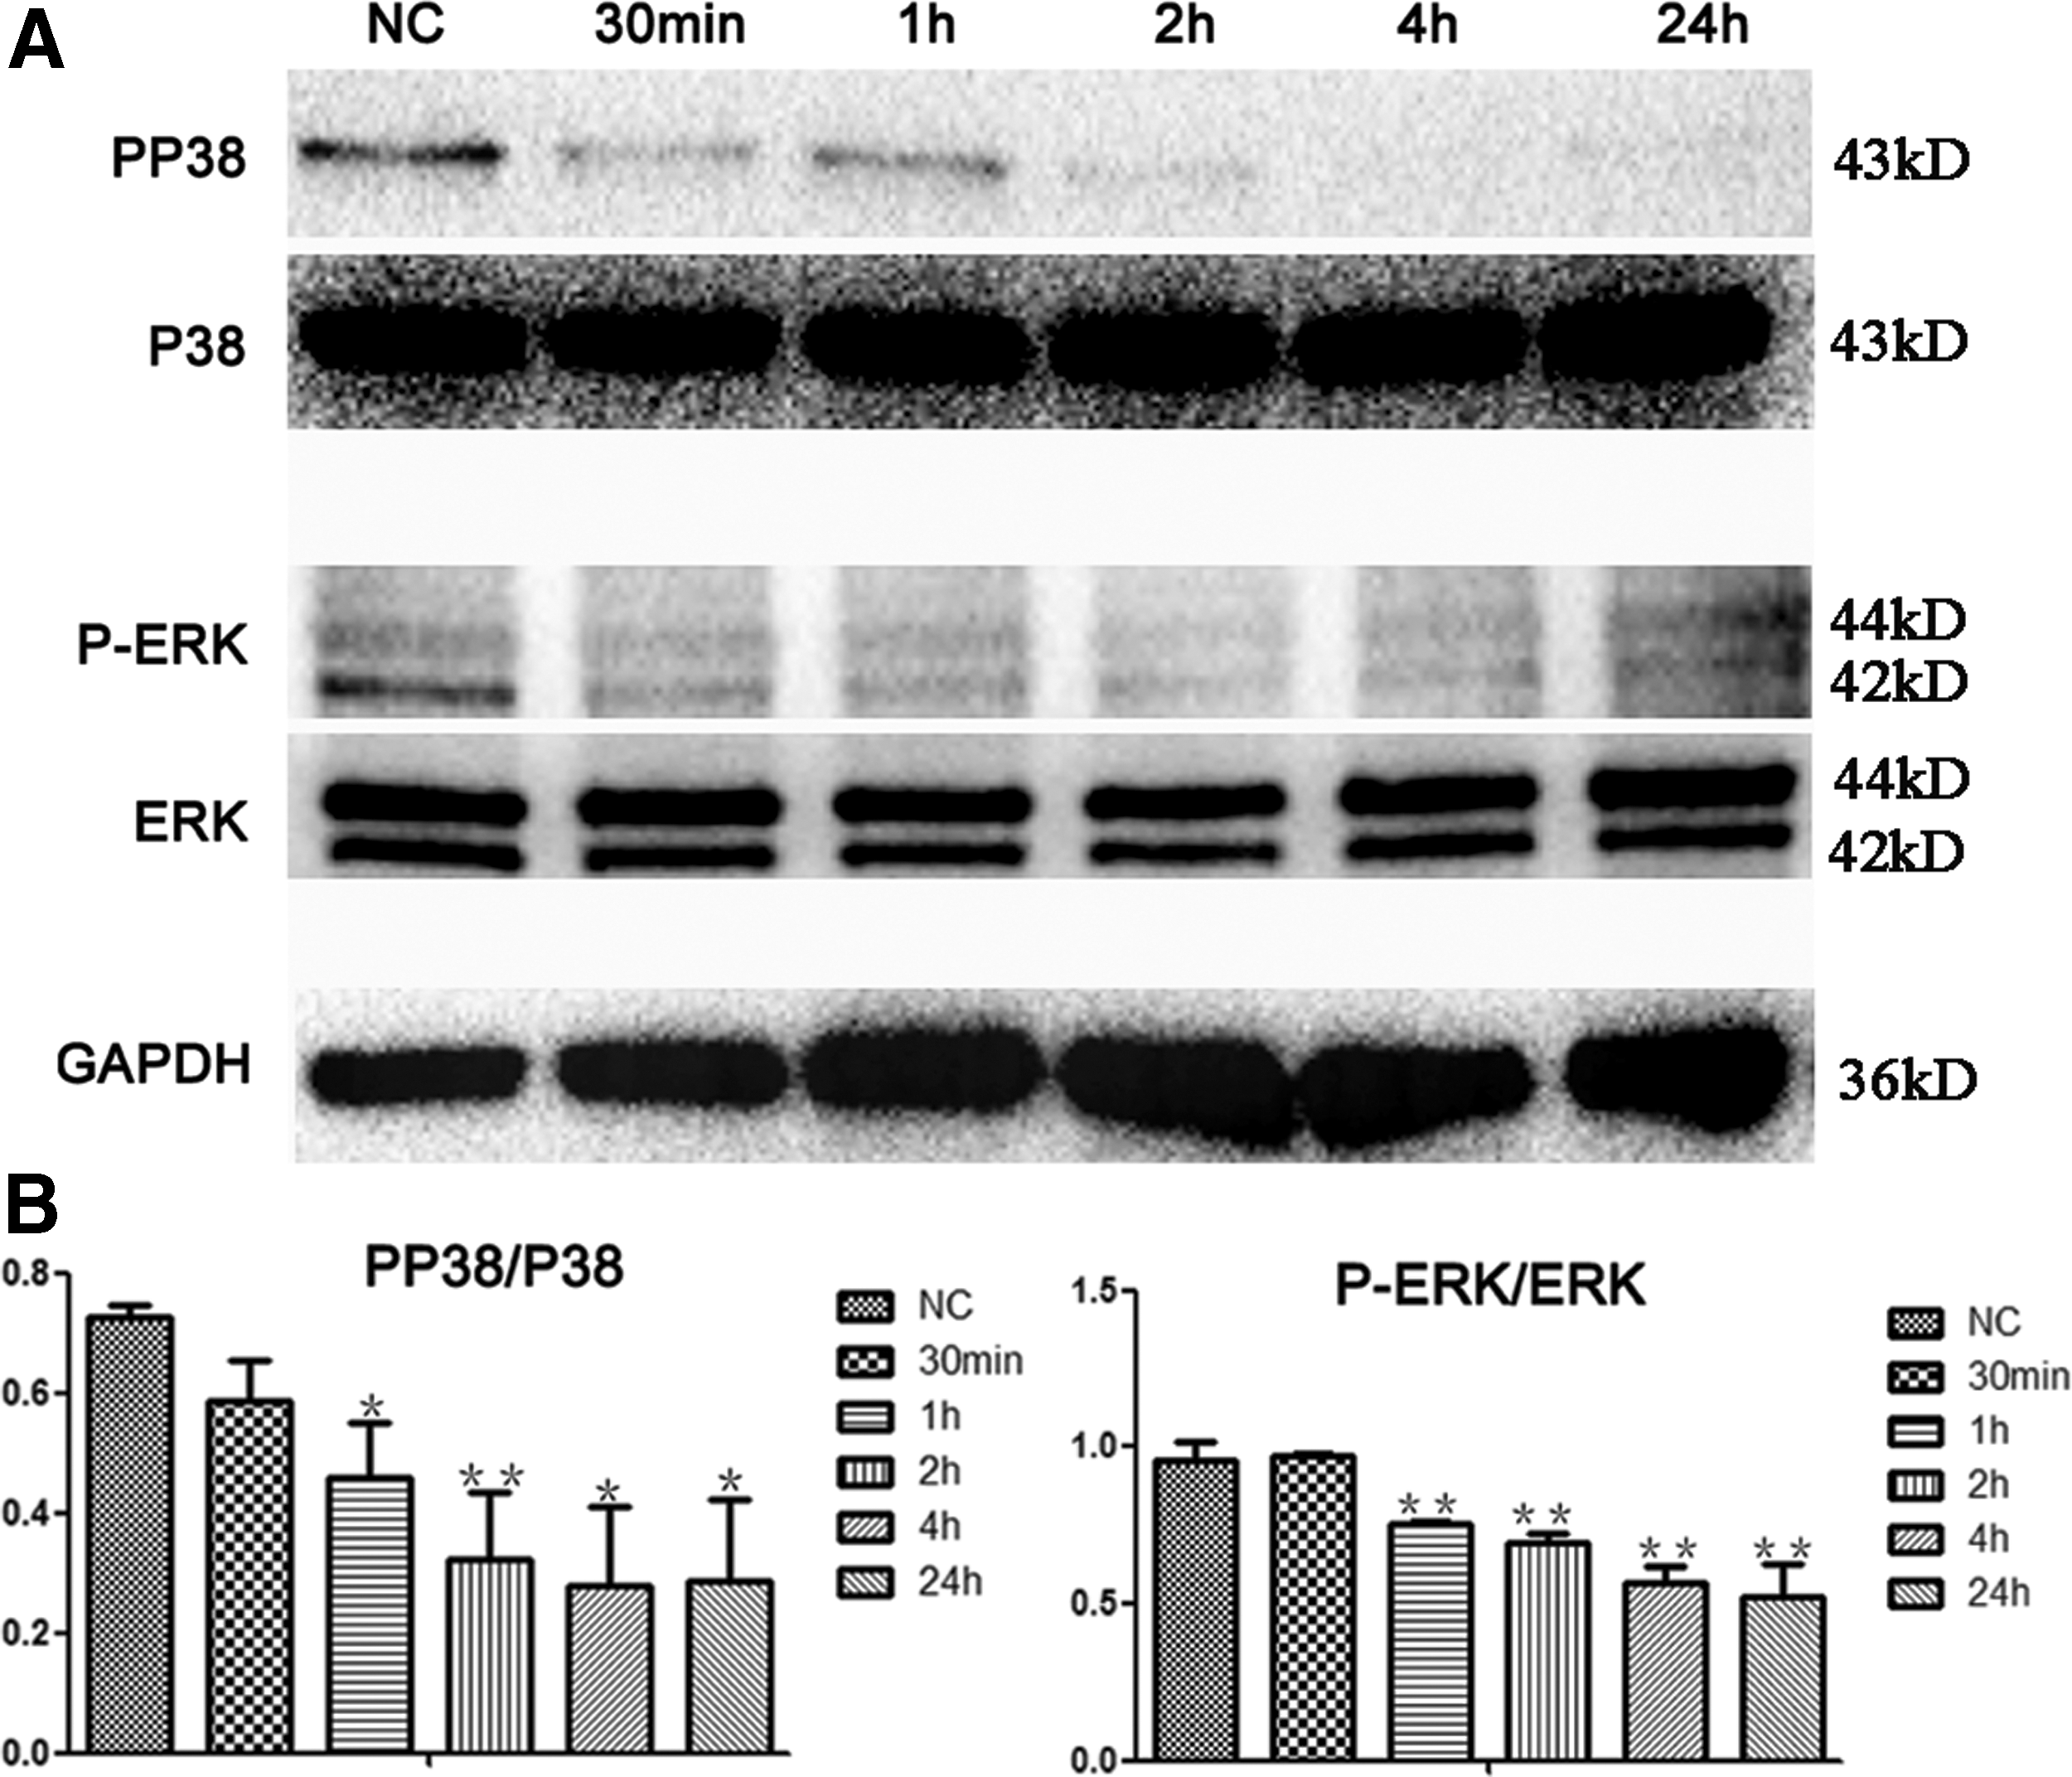
Expression of several important proteins related to MAPK pathways.
Discussion
ACE is a well-characterized zinc peptidase that removes C-terminal dipeptides from substrates such as angiotensin I and bradykinin [19,20], leading to an increase in blood pressure. Therefore, ACE is a prominent target for treating hypertension and cardiovascular diseases, and several ACE inhibitors are already available for use in the clinical setting [21,22]. ACE has been reported to have a distinctive glycosylphosphatidylinositol (GPI)-anchored protein-releasing activity, which has been suggested to be associated with male fertilization [18]. The mammalian gene encoding ACE produces the sACE and tACE isoforms using different promoters [23,24]. Within the testes, tACE is only present in postmeiotic male germ cells, spermatids, and mature sperm. Male mice lacking tACE have been found to be infertile [25]. Carboxypeptidase activity and GPI-anchored protein-releasing activity have both been reported to have distinct contributions to fertilization [18,26].
In our previous work, we identified eight ACE peptides in the mouse SSC proteomic profile. Of these, peptides 1–5 are distributed in sACE, whereas peptides 6–8 are common to both sACE and tACE. Furthermore, sACE but not tACE was found to be expressed in cultured SSCs and in mouse testes before postpartum day 7 at both the mRNA and protein levels. The results of sACE inhibition by captopril and shRNA silencing of sAce showed that both these approaches reduced SSC proliferation and increased SSC apoptosis. Therefore, sACE is required for SSC self-renewal.
Captopril is an active ACE inhibitor that is widely used as an oral antihypertensive agent. Hii et al. reported that at clinically achievable concentrations (0.1–10 μM), captopril did not significantly affect the proliferation of SN12K-1 (human renal cell carcinoma) cells. At concentrations higher than those clinically achievable (30 μM–3 mM), captopril inhibited SN12K-1 cell proliferation by 14%–31%. At 10 mM, a direct cytotoxic effect was observed that resulted in cell detachment and death within 48 h of culture initiation [27]. According to the above doses, we first selected concentrations of 0.001 and 0.01 M of captopril to test its effects on SSC's proliferation through EdU incorporation. The results revealed that both these concentrations can reduce SSC proliferation, and a more significant reduction was observed with 0.01 M captopril. To observe whether 0.01 M captopril had cytotoxic effects, we performed cell cycle analysis and the results showed that inhibition of sACE activity using 0.01 M captopril significantly lowered the percentage of cells in the S phase (P < 0.01) and significantly increased the percentage of cells in the G0/G1 phase (P < 0.001) compared with the negative control, whereas the percentage of cells in each cell cycle phase nearly recovered following captopril withdrawal. Therefore, we used 0.01 M captopril for subsequent experiments in this study.
To identify the downstream molecules involved in sACE-mediated SSC proliferation, we performed gene microarray analysis of captopril-treated and untreated SSCs. The results revealed 651 differentially expressed genes (fold change ≥2, P < 0.05), of which 297 were upregulated and 354 were downregulated. These differentially expressed genes might be involved in various processes such as MAPK signaling and Jak-STAT signaling. As more genes are involved in MAPK signaling, we further studied MAPK pathways. Several genes, such as Pla2g12b, Cacna2d1, Dusp2, and Fgf3, were selected to verify the microarray results and the expression levels of p38, ERK, and their phosphorylated forms in the control and the captopril-treated groups were analyzed.
MAPK cascades have been shown to play a key role in the transduction of extracellular signals to cellular responses. In mammalian cells, three MAPK families have been clearly characterized: extracellular signal-regulated kinases 1 and 2 (ERK1 and ERK2), c-Jun NH2-terminal kinases (JNK), and p38 kinase. They phosphorylate the serine/threonine of target proteins to regulate multiple biological activities such as cellular proliferation, differentiation, development, and apoptosis [28 –30]. Morimoto et al. reported that the reactive oxygen species generated by Nox1 play critical roles in SSC self-renewal through the activation of the p38, MAPK, and JNK pathways [31]. Lu and Xu reported that ERK1/2 could up- or downregulate protein expression of the apoptosis signaling molecule to achieve an antiapoptotic effect [32]. Inhibition of ERK1/2 activity results in G1 phase arrest and reduces the expression of Mcl-1 and Bcl-XL, which are the antiapoptotic homologs of Bcl-2 [33,34]. Hasegawa et al. showed that MEK/ERK signaling contributes to cycle-related self-renewal of SSCs [35]. Together with our results, p38 and ERK phosphorylation significantly decreased after captopril treatment, following decrease in cell proliferation, G0/G1phase arrest, and increase in cell apoptosis, demonstrating that sACE is required for the self-renewal of SSCs through the MAPK signaling pathway.
In our microarray results, we selected four genes involved in the MAPK signaling pathway to validate their differential expression. Of these, fibroblast growth factor 3 (fgf3), which belongs to the family of fibroblast growth factors (FGFs), regulates several biological activities, including cell proliferation, differentiation, and motility, by binding, dimerizing, and activating FGF receptors (FGFRs) [36,37]. In Xenopus laevis, FGF3 is expressed in the anterior neural ectoderm and activates an intracellular p38 MAPK signaling pathway and its downstream target CREB, all of which are involved in the differentiation of cardiac progenitor cells [38]. In chick hindbrain development, Weisinger et al. reported that FGF3 is a major signaling pathway that contributes to the activation of ERK1/2 and expression of the downstream targets Pea3 and Erm [39]. There are no reports on the role of FGF3 in SSC self-renewal, but Hasegawa and Saga showed that FGF8/FGFR1 signaling maintains undifferentiated spermatogonia by activating ERK1/2 signaling in vivo [40]. Several studies have demonstrated that both FGF3 and FGF8 possess a unique combined function in the regional patterning of the forebrain and hindbrain [41 –43]. In the present study, we demonstrated that fgf3 expression was downregulated after captopril treatment. Therefore, we predict that FGF3 may have an important role in SSC self-renewal and might interact with sACE to activate the MAPK signaling pathway.
The Dusp2 (also named Pac-1) gene is an inducible, nucleus-specific, dual-specificity MAPK phosphatase. DUSP2 is known to inactivate its target kinases ERK1 and ERK2 [44,45]. However, Grumont et al. showed that MAPK pathway activation in hematopoietic cells induces transcription of the Pac-1 phosphatase gene [46]. In our study, Dusp2 expression level was reduced in SSCs treated with captopril. Therefore, we believe that inhibition of sACE would inactivate MAPK signaling pathway, consequently reducing Dusp2 mRNA levels, affecting the self-renewal ability of SSCs.
In conclusion, SSC self-renewal regulation is a complicated process involving many cytokines and transcription factors as well as signaling pathways [3 –5]. Our study provides novel insights into the effect of sACE in the regulation of SSC self-renewal through the ERK and P38 MAPK pathways.
Footnotes
Acknowledgment
This work was supported by the Southeast University-Nanjing Medical University Cooperative Research Project [grant number 2242017K3DN09].
Author Disclosure Statement
No competing financial interests exist.
References
Supplementary Material
Please find the following supplemental material available below.
For Open Access articles published under a Creative Commons License, all supplemental material carries the same license as the article it is associated with.
For non-Open Access articles published, all supplemental material carries a non-exclusive license, and permission requests for re-use of supplemental material or any part of supplemental material shall be sent directly to the copyright owner as specified in the copyright notice associated with the article.