




Abstract
The ventral spinal population of V0 interneurons (INs) contributes to the coordinated movements directed by spinal central pattern generators (CPGs), including respiratory circuits and left-right alternation in locomotion. One challenge in studying V0 INs has been the limited number of cells that can be isolated from primary sources for basic research or therapeutic use. However, derivation from a pluripotent source, such as has been done recently for other IN populations, could resolve this issue. However, there is currently no protocol to specifically derive V0 interneurons from pluripotent cell types. To generate an induction protocol, mouse embryonic stem cells (mESCs) were grown in suspension culture and then exposed to retinoic acid (RA) and collected at different time points to measure mRNA expression of the V0 progenitor transcription factor marker, Dbx1, and postmitotic transcription factor marker, Evx1. The cultures were also exposed to the sonic hedgehog signaling pathway agonist purmorphamine (purm) and the Notch signaling pathway inhibitor N-{N-(3,5-difluorophenacetyl-L-alanyl)}-(S)-phenylglycine-t-butyl-ester (DAPT) to determine if either of these pathways contribute to V0 IN induction, specifically the ventral (V0V) subpopulation. From the various parameters tested, the final protocol that generated the greatest percentage of cells expressing V0V IN markers was an 8-day protocol using 4 days of suspension culture to form embryoid bodies followed by addition of 1 μM RA from days 4 to 8, 100 nM purm from days 4 to 6, and 5 μM DAPT from days 6 to 8. This protocol will allow investigators to obtain V0 IN cultures for use in in vitro studies, such as those examining CPG microcircuits, electrophysiological characterization, or even for transplantation studies in injury or disease models.
Introduction
Spinal interneurons (INs) generate a complex relay between the body and the brain, as dorsal IN types confer sensory information, while ventral IN types have roles in motor output. The ventral IN circuits formed through various interconnections with each other, motor neurons (MNs), and the dorsal INs allow for the rhythmic, oscillatory movements—walking, breathing, swimming, and so on—which are generated from circuits centralized in the spinal cord, central pattern generators (CPGs) [1,2]. These movements occur as neural circuits of the CPG excite or inhibit the appropriate muscle groups to create coordinated motions. Ventral INs thus must project axons in many directions along the rostrocaudal axis and relative to the midline, with commissurally projecting INs involved in left-right coordination to allow for alternation or synchronous motion [2 –4].
V0 INs include a large proportion of cells having commissural axonal projections and are known to contribute to left-right alternation [5,6]. V0 IN progenitors (p0s) arise near the central-most ventral neural tube, adjacent to the dorsal progenitor domains, near the central canal and express the transcription factor Dbx1 (Fig. 1) [7]. These p0 progenitors mature into two major subclasses, ventral V0V and dorsal V0D INs, with the excitatory V0V INs distinguished by transient expression of the transcription factor Evx1, while the inhibitory V0D INs as yet have no specific, direct marker for their identification (Fig. 1B) [5,8,9]. V0V INs are further diversified into the uncommon ipsilaterally projecting Pitx2+ subclasses V0G (glutamatergic) and V0C (cholinergic), which form monosynaptic connections with MNs [10].
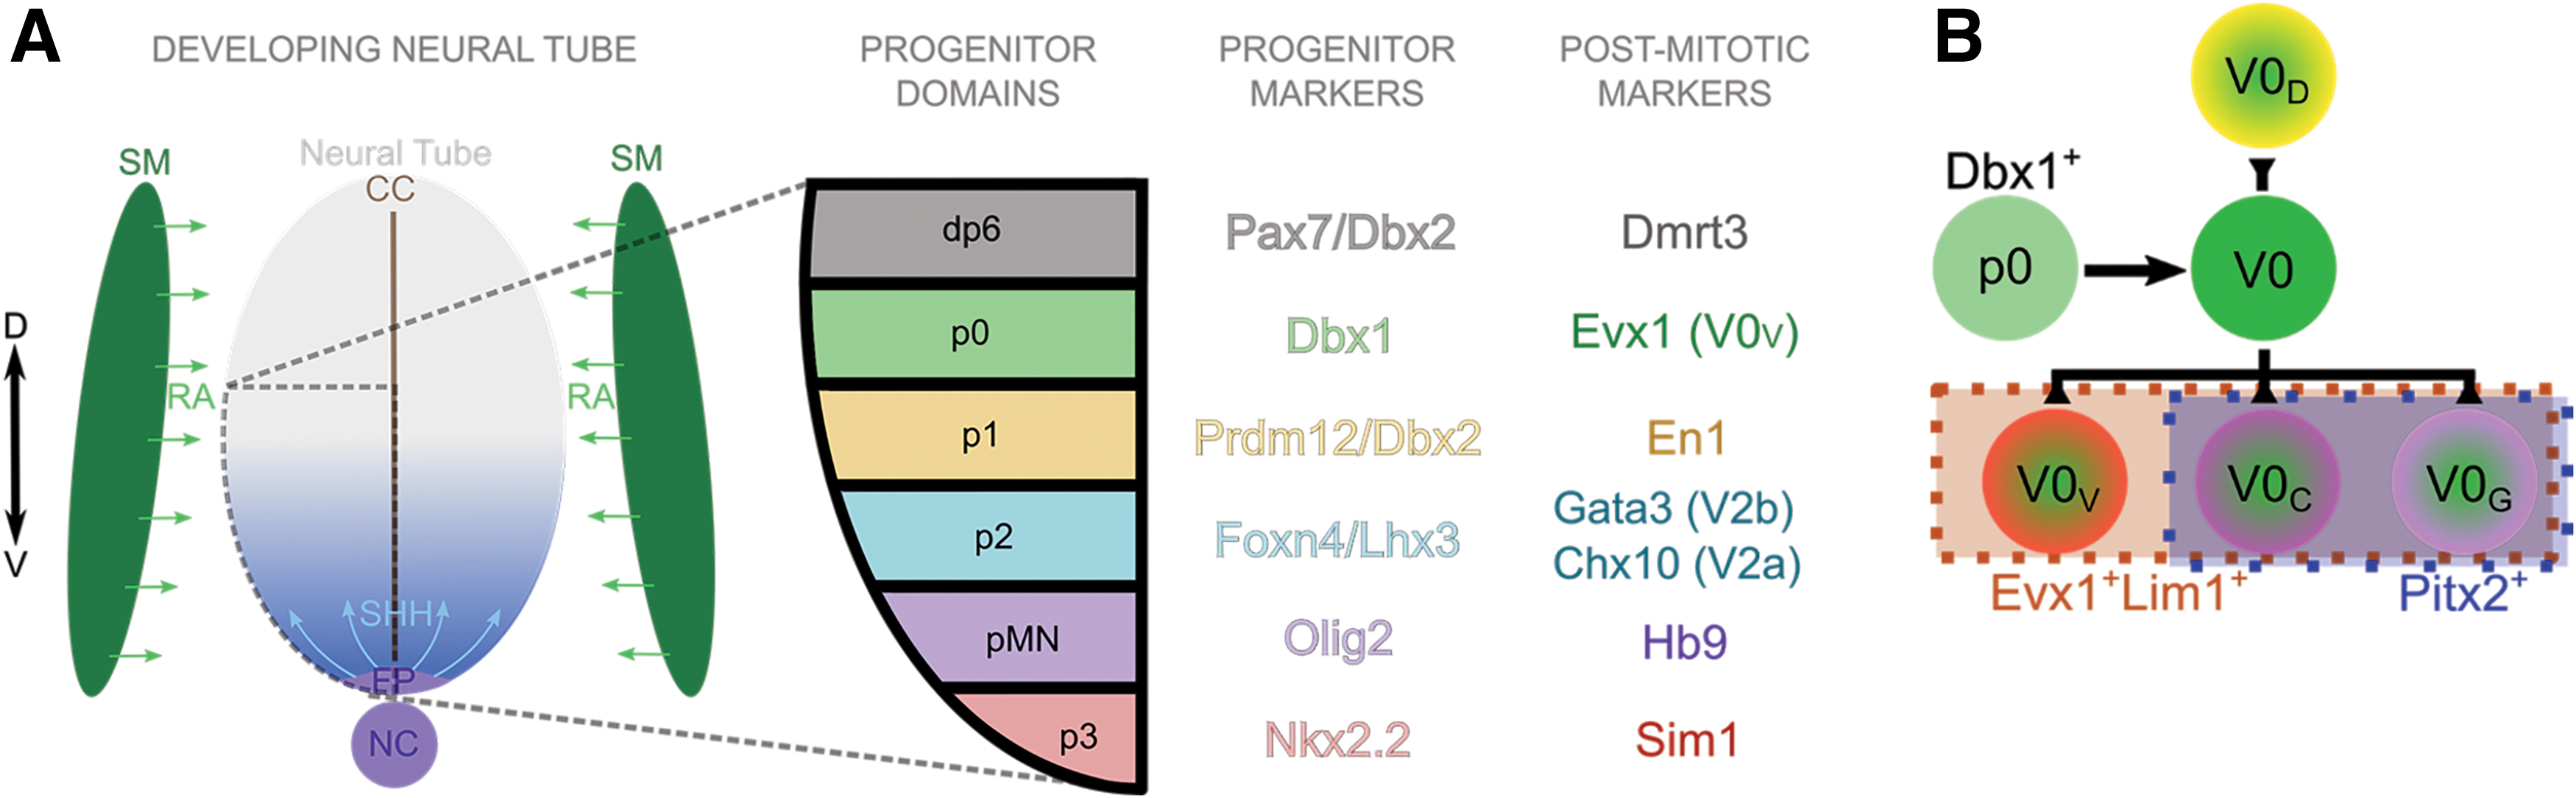
Schematic of RA and Shh gradient specifying IN progenitor domains and current distinctive markers of V0 IN subpopulations.
Genetic ablation studies in mice showed that the two major subclasses are recruited in a frequency-dependent manner during locomotion; the inhibitory V0D INs are more active at low speeds and the excitatory V0V interneurons at higher frequencies [6]. However, a recent study in larval zebrafish showed that, in contrast to mice, V0D INs are important at higher frequencies [11]. V0 INs also have been shown to contribute to backward locomotion and scratching—rhythmic movements—and postural correction and righting behavior—nonrhythmic motor functions [12]. Much remains to fully understand and characterize V0 IN subtypes and their role in locomotor circuits.
To better study V0 IN populations and their contributions to CPGs, a means of obtaining a large number of V0 INs would be beneficial. Deriving INs from a pluripotent cell type, such as induced pluripotent stem cells (iPSCs) or embryonic stem cells (ESCs), is a means of isolating a potentially large number of INs from an expandable source. Recently, groups have used human PSCs and mouse ESCs (mESCs) to generate different ventral IN populations, including V1, V2a, and V3, as well as MNs [13 –20]. These differentiation protocols yield postmitotic neurons expressing population-specific markers in mouse cells after ∼7 days and in human cells after ∼21 days. After induction, examination of expression, and localization of mature markers, such as synaptic and dendritic proteins, as well as electrophysiological properties of the generated neurons show that PSC-derived mouse neurons mature over ∼2–4 weeks, while human neurons take ∼5–9 weeks to mature [18,20 –22].
The work presented in this article uses methods similar to those previously shown to be successful in deriving ventral mouse INs and MNs to generate postmitotic V0V INs from mESCs in about a week and maturation continues over the next 2 weeks postinduction. These mouse neurons are a useful tool in comparative investigations for which human PSC-derived neurons are available, such as with the V2a INs or MNs, but they allow studies to be performed on a shorter time scale than with human cells, and they allow more rapid co-cultures to examine how different combinations of INs and MNs change network dynamics in vitro [23,24].
Approaches deriving INs and MNs from pluripotent sources recapitulate some aspects of normal spinal cord development. During this complex process, the ventral neural tube is exposed to retinoic acid (RA) from the adjacent somitic mesoderm and a gradient of sonic hedgehog (Shh) from a ventral source—beginning from the notochord and later including the floor plate (Fig. 1A). RA caudalizes the tissue, allowing for spinal identity versus midbrain or cortical identities, whereas the Shh gradient establishes the boundaries of the different ventral IN progenitor domains.
The progenitor and postmitotic IN domains can be identified by particular transcription factor profiles, with progenitor V0 INs (p0s) expressing the homeobox protein Dbx1 [7], and a postmitotic, ventral subpopulation—V0V INs—expressing the homeobox protein Evx1 (Fig. 1A) [5,8,9]. Lim1 is another transcription factor expressed in several ventral IN populations and distinguishes V0V INs from a dorsal IN population, dI1, which transiently expresses Evx1, but not Lim1 [7]. Therefore, in this study, Dbx1 and Evx1 with Lim1 are used as markers of p0s and V0V INs, respectively, in induced cultures derived from mESCs.
Using PSCs to induce any cell type will result in a heterogenous culture, likely including populations that arise close to the induced population during development. For V0 INs, the neighboring populations include dI6, the adjacent dorsal population that expresses Dmrt3, and the adjacent ventral V1 INs, which express En1 (Fig. 1A) [25 –27]. V2a INs transiently express the transcription factor Chx10 (Fig. 1A) and can be induced from PSCs preferentially over the V2b IN subtype through Notch inhibition [14,18,28]. Olig2 marks progenitor MNs (pMNs) before oligodendrogliogenesis, soon after which it can be considered a glial marker, and postmitotic MNs express Hb9 [29,30].
An induction protocol to generate INs from mESCs should ideally produce a considerable proportion of INs among the heterogenous resultant mixture, yet practically, it should entail as simple and quick a procedure as possible. Existing protocols used to derive various spinal neurons can be informative for possible methods to derive V0 INs from mESCs. To induce mESCs to form MNs and V2a INs, cells are cultured in suspension for 2 days in the absence of any morphogen (2−) and allowed to form embryoid bodies (EBs) to simulate embryogenesis. EBs are exposed to RA and a Shh agonist (purmorphamine [purm] for V2a and smoothened agonist [SAG] for MNs) is added to the EBs for another 4 days (4+) [14,17]. V2a IN induction also includes exposure to a Notch signaling inhibitor during the last 2 days to preferentially specify the V2a over V2b IN subtype.
Considering such protocols and what is known about the development of the V0 IN population can guide creation of a protocol to induce them from pluripotent cells. Of the ventral progenitor subtypes, p0s arise furthest from the floor plate, and, as it was previously shown that V0 INs can arise in the absence of Shh [7], it is plausible that V0 INs can be generated in the absence of Shh signaling factors; the p0 marker, transcription factor Dbx1, is also a class I transcription factor that is inhibited by Shh [31]. Therefore, when first developing the V0 IN induction protocol, conditions with exposure to different concentrations of RA without addition of Shh agonists (purm or SAG) were tested. After p0 and V0V IN markers were detected in cultures only exposed to RA, activation of Shh signaling and inhibition of Notch signaling were also examined and were found to increase the proportion of cells expressing V0V IN markers.
Materials and Methods
ESC maintenance
RW4 mouse embryonic stem cells (ATCC and SCRC-1018) were maintained in T-25 flasks coated with 0.1% gelatin (MilliporeSigma; G1393; in water) in complete medium containing 1,000 U/mL leukemia inhibitory factor (LIF; MilliporeSigma, ESG1106) and 100 μM β-mercaptoethanol (BME; Thermo Fisher Scientific, 21985023) at 37°C in 5% CO2. mESCs were passaged by dissociating colonies with 0.25% trypsin ethylenediaminetetraacetic acid (trypsin-EDTA; Thermo Fisher Scientific, 25200072) for 5 min followed by quenching and trituration with excess complete medium. Single cells were plated in a new flask containing complete medium +LIF +BME at a 1:5 ratio for 2 days or until ∼80% confluent.
Media formulations
Complete medium: Dulbecco's modified Eagle's medium (DMEM; Thermo Fisher Scientific, 11965; +
DFK5 medium: DMEM/F12 (Thermo Fisher Scientific, 11320; +
Neuronal medium: DFK5 medium and Neurobasal medium (Thermo Fisher Scientific; 21103), 1:1 (v/v) ratio.
V0V interneuron induction and culture
Please note that the following protocol is the final protocol determined through the work presented in this publication. Please refer to the results section for descriptions of variations in testing protocol parameters.
RW4 mESCs were dissociated with 0.25% trypsin-EDTA, quenched with complete medium, and counted. Three × 106 single cells were pelleted at 300 g, the medium was aspirated, and the cells were suspended in 10 mL DFK5 medium in a 10 cm tissue culture-treated dish coated with 0.1% agar (in water) to allow for EB formation. After 2 days (2−), EBs in DFK5 medium were collected into a 15 mL conical tube and allowed to settle for 10 min. The medium was aspirated, and 10 mL of fresh DFK5 medium was used to resuspend the settled EBs and return them to the agar-coated dish. After another 2 days (4−), ∼30 μL of EBs per cm2 was settled (eg, for a 10 cm dish, settle 2.5 mL of EBs) in a 15 mL conical tube for 10 min. Old medium was aspirated and 10 mL of fresh DFK5 + 1 μM all-trans retinoic acid (RA; MilliporeSigma, R2625: resuspended as a 20 mM stock in dimethyl sulfoxide [DMSO; MilliporeSigma, D2650]) +100 nM purmorphamine (purm; MilliporeSigma, 540223) was used to resuspend settled EBs and plate them on a non-tissue culture-treated 10 cm dish coated with 0.1% gelatin. After 2 days (4−/2+), the medium was aspirated and replaced with 10 mL of fresh DFK5 + 1 μM RA +5 μM N-{N-(3,5-difluorophenacetyl-L-alanyl)}-(S)-phenylglycine-t-butyl-ester (DAPT; MilliporeSigma, D5942: resuspended as a 10 mM stock in DMSO). Induction was complete after another 2 days (4−/4+).
For cultures grown longer than 8 days, multiwell plates were coated with 0.01% poly-L-ornithine (MilliporeSigma, P3655; in 10 mM borate buffer, pH 8.3), rinsed thrice with HEPES-buffered saline solution (HBSS, pH 7.2), and coated with 10 μg/mL laminin (natural mouse; Thermo Fisher Scientific, 23017015; in HBSS). Induced cultures were dissociated with 0.25% trypsin-EDTA, quenched with complete medium, counted, and plated on laminin-coated wells at a range of densities, depending on the endpoint (to account for proliferation, Supplementary Table S1), to achieve ∼1 × 10⁵ cells/cm2 in neuronal medium supplemented with 1 × B-27 supplement (Thermo Fisher Scientific; 17504044), 1 × GlutaMAX (Thermo Fisher Scientific; 35050061), and 5 ng/mL for each of brain-derived neurotrophic factor (BDNF, recombinant human, PeproTech, 450-02: resuspended as a 10 μg/mL stock in 0.1% bovine serum albumin [BSA, MilliporeSigma; A2058] in phosphate-buffered saline [PBS]), glial cell line-derived neurotrophic factor (GDNF, recombinant human, PeproTech, 450-10: resuspended as a 10 μg/mL stock in 0.1% BSA in PBS), and neurotrophin-3 (NT-3, recombinant human, PeproTech, 450-03: resuspended as a 10 μg/mL stock in 0.1% BSA in PBS). For cultures grown past day 12, cells were grown in Neurobasal medium (Thermo Fisher Scientific; 21103049) supplemented with 1x B-27, 1 × GlutaMAX, and 5 ng/mL BDNF, GDNF, and NT-3.
Isolation of RNA, reverse transcription, and qPCR
To collect cultured cells for qPCR analysis, medium was aspirated and cells were detached by addition of 0.25% trypsin-EDTA followed by quenching and dissociation in complete medium. Cells were pelleted at 300 g. All medium was aspirated, and pellets were resuspended in RLT buffer as provided from the RNeasy Mini Kit (Qiagen; 74106). Pellets were either frozen at −80°C or immediately used with the RNeasy kit to isolate RNA as per manufacturer's instructions. Two hundred fifty nanograms or 500 ng of RNA was reverse transcribed using the High-Capacity cDNA Reverse Transcription Kit (Thermo Fisher Scientific; 4368813) as per manufacturer's instructions.
For qPCR, a solution of ultrapure water, TaqMan Fast Advanced Master Mix (Thermo Fisher Scientific; 4444963), a TaqMan probe against mouse β-actin as a reference gene (Thermo Fisher Scientific; Mm02619580_g1, using VIC-MGB_PL dye), and the TaqMan probe against the target gene using FAM-MGB dye (Dbx1: Mm02344179_m1; Evx1: Mm00433154_m1) was prepared and loaded into MicroAmp Fast Optical 96-Well Reaction Plate (Thermo Fisher Scientific; 4346906) before loading each sample in triplicate. Plates were sealed, spun briefly to remove bubbles, and loaded into the QuantStudio 3 instrument for measurement. The fold change in mRNA expression levels was calculated using the comparative CT method (2^−ΔΔCT values) with β-actin as the reference gene relative to uninduced cultures as the reference sample.
Immunocytochemistry and image analysis
Cultures were plated on 48-well, laminin-coated plates for immunocytochemistry (ICC) analysis. Day 8 time point cultures were plated for 2–4 h before fixation, and day 10 cultures were plated for 2 days and day 12 cultures for 4 days before fixation. Long-term cultures for examining mature neuronal markers were grown until either day 16 or day 22 (8 or 14 days post-induction). Wells were rinsed once with PBS after aspirating the culture medium, and then cells were fixed in 4% paraformaldehyde (PFA; MilliporeSigma, P6148) in 0.1 M phosphate buffer for 20 min at room temperature. Cells were then exposed to 2% normal goat serum (NGS; MilliporeSigma, G9023) with 0.1% Triton X-100 (MilliporeSigma, X100; in PBS) to permeabilize and block for 30 min at room temperature. Primary antibodies (Table 1) were diluted in 2% NGS with 0.1% Triton X-100 and cells were stained overnight at 4°C. Primary antibody solutions were removed and cells were washed thrice for 10 min per wash with PBS. Secondary antibodies (Table 2) were diluted in 2% NGS with 0.1% Triton X-100 and then filtered with a 0.22 μm PVDF syringe filter (MilliporeSigma; SLGV033RS). After adding secondary antibodies, plates were wrapped in foil and the cells were incubated for 1 h at room temperature. Secondary antibody solutions were removed and cells were washed thrice for 10 min per wash with PBS. Cells were then stained in 1:1,000 Hoechst 33258 (Thermo Fisher Scientific, H3569; in PBS) for 10 min, rinsed once with PBS, and then imaged with a DFC9000 GT camera (Leica) mounted on a DMi8 inverted widefield microscope (Leica) using a SOLA Light Engine light source (Lumencor).
Primary Antibodies Used for Immunocytochemistry and Flow Cytometry
Used for ICC.
Used for flow cytometry.
ICC, immunocytochemistry.
Secondary Antibodies Used for Immunocytochemistry and Flow Cytometry
All secondary antibodies were from goat hosts.
All secondary antibodies were purchased from Thermo Fisher Scientific.
Images were analyzed using a CellProfiler pipeline to determine the percentage of cells co-stained for βIII tubulin, Evx1, and Lim1 [32,33]. At least 2 images each were taken from at least two wells for each condition at each time point with N = 3–6.
Flow cytometry
Cultures were plated on multiwell, laminin-coated plates for flow cytometry analysis. Before collection, day 8 time point cultures were plated for 2–4 h, and day 10 cultures for 2 days and day 12 cultures for 4 days. For collection, medium was aspirated and cells were detached by addition of 0.25% trypsin-EDTA followed by quenching and dissociation in complete medium. Cells were spun at 400 g for 5 min, medium aspirated, and pellets were resuspended in 4% PFA in 0.1M phosphate buffer to fix for 10 min at room temperature. Before staining, samples were divided and pelleted at 400 g. For staining with βIII tubulin antibody, samples were resuspended in 5% NGS with 0.1% saponin (% w/v; MilliporeSigma, S4521) in PBS to permeabilize and block for 20 min at room temperature (Supplementary Fig. S3). For staining with all other antibodies, samples were resuspended in 5% normal NGS with 0.1% Triton X-100 (% v/v) in PBS to permeabilize and block for 20 min at room temperature. Primary antibodies (Table 1) were diluted in 2% NGS in PBS and cells were stained for 1 h at room temperature. Primary antibody solutions were removed and cells were washed thrice for 10 min per wash with PBS. Secondary antibodies (Table 2) were diluted in 2% NGS in PBS and then filtered with a 0.22 μm PVDF syringe filter. After adding secondary antibodies, samples were protected from light, while incubating for 1 h at room temperature. Secondary antibody solutions were removed and cells were washed thrice for 10 min per wash with PBS. Cells were resuspended in PBS for measurement on an Attune NxT Flow Cytometer (Thermo Fisher Scientific).
Microelectrode array recordings, including mESC-derived MN co-culture
A CytoView 24-well microelectrode array (MEA) plate (Axion Biosystems; M384-tMEA-24W-5) containing 16 microelectrodes per well was used for recordings on a Maestro Edge instrument (Axion Biosystems). Electrode areas were coated with 0.01% poly-L-ornithine followed by washing with HBSS and coating with 5 μg/mL laminin before plating cells at 1 × 10⁵ cells/well.
Day 8 mESC-derived V0V IN inductions were dissociated with 0.25% trypsin-EDTA, quenched with complete medium, and then pelleted at 400 g. After aspirating medium, cells were resuspended in 1 mL of Neuronal medium containing supplements and counted.
MNs derived from RW4 mESCs were used as a co-culture population, with induction starting on day 2 of V0V IN inductions. For MN induction, RW4 mESCs were dissociated with 0.25% trypsin-EDTA, quenched with complete medium, and counted. Around 1 × 10⁶ single cells were pelleted at 300 g, the medium was aspirated, and the cells were suspended in 10 mL DFK5 medium in an agar-coated 10 cm tissue culture-treated dish to allow EBs to form. After 2 days (2−), EBs in DFK5 medium were collected into a 15 mL conical tube and allowed to settle for 10 min. After aspirating medium, 10 mL of fresh DFK5 medium containing 2 μM RA and 500 nM SAG (MilliporeSigma; 566661) was used to resuspend EBs and return them to the dish. The procedure on day 2 was repeated on day 4 (2−/2+). MN induction was complete on day 6 (2−/4+). Cells were dissociated, pelleted, and resuspended in 1 mL of Neuronal medium with supplements before counting.
Wells were seeded at a density of 1 × 10⁵ cells/10 μL droplet of Neuronal medium with supplements; for co-cultures, MN:V0V IN ratios were tested at 1:1 and 1:4. After allowing seeding for 4 h, additional supplemented Neuronal medium was added to the well slowly to reduce detachment of cells. Medium was refreshed by half volumes every 2 days. From day 12 onward, the medium was exchanged with Neurobasal supplemented with B-27, growth factors, and GlutaMAX in the above-mentioned amounts.
Recordings were taken for 10 min every 2 days for spontaneous activity for 5 min, followed by an electrical stimulus and another 5 min of recording. On day 16 of V0V IN culture, some wells were exposed to 30 μM 1,2,3,4-Tetrahydro-6-nitro-2,3-dioxo-benzo[f]quinoxaline-7-sulfonamide (NBQX) disodium salt hydrate (MilliporeSigma; N183-5MG: resuspended as a 1 M stock in water) to observe changes in activity. Baseline recordings were taken, followed by incubation in drug for 20 min, a recording during drug exposure, and then a washout period followed by a final recording 20 min later.
Statistics
GraphPad Prism version 7 and Microsoft Excel were used for statistical analyses. Outliers were identified and excluded using the ROUT method with Q = 5% in Prism; briefly, this method first uses a robust curve fit from a Lorenzian distribution—which, with long tails, is not impacted by outliers—using Q as a false discovery rate to determine outliers from the residuals and then using least-squares regression on the remaining data. Values are reported as means and error bars are standard error of the mean (SEM). One-way analysis of variance (ANOVA) using Scheffe's multiple comparison method with 95% confidence was used to determine significance, which is indicated in figures as follows, unless otherwise stated: * for P < 0.05, ** for P < 0.01, *** for P < 0.001, and **** for P < 0.0001.
Results
Generating V0 progenitor and IN marker-expressing cells from mESCs
With the goal of achieving a protocol specific to deriving V0 INs from mESCs, different induction conditions were tested by modifying procedures known to produce V2a INs and MNs [14,17]. By first culturing EBs through growing mESCs in suspension for either 2 or 4 days (known as 2− or 4−, Fig. 2A), embryogenesis is stimulated, as well as the beginning of lineage specification, including neurogenesis. The EBs are then exposed to RA, which is involved in inducing neuralization and in caudalization toward a spinal fate. Several concentrations of RA were tested at amounts known to induce spinal neurons [17,34,35]. To determine whether these conditions effectively generated cells expressing V0 progenitor and IN markers, cultures were collected for qPCR analysis.
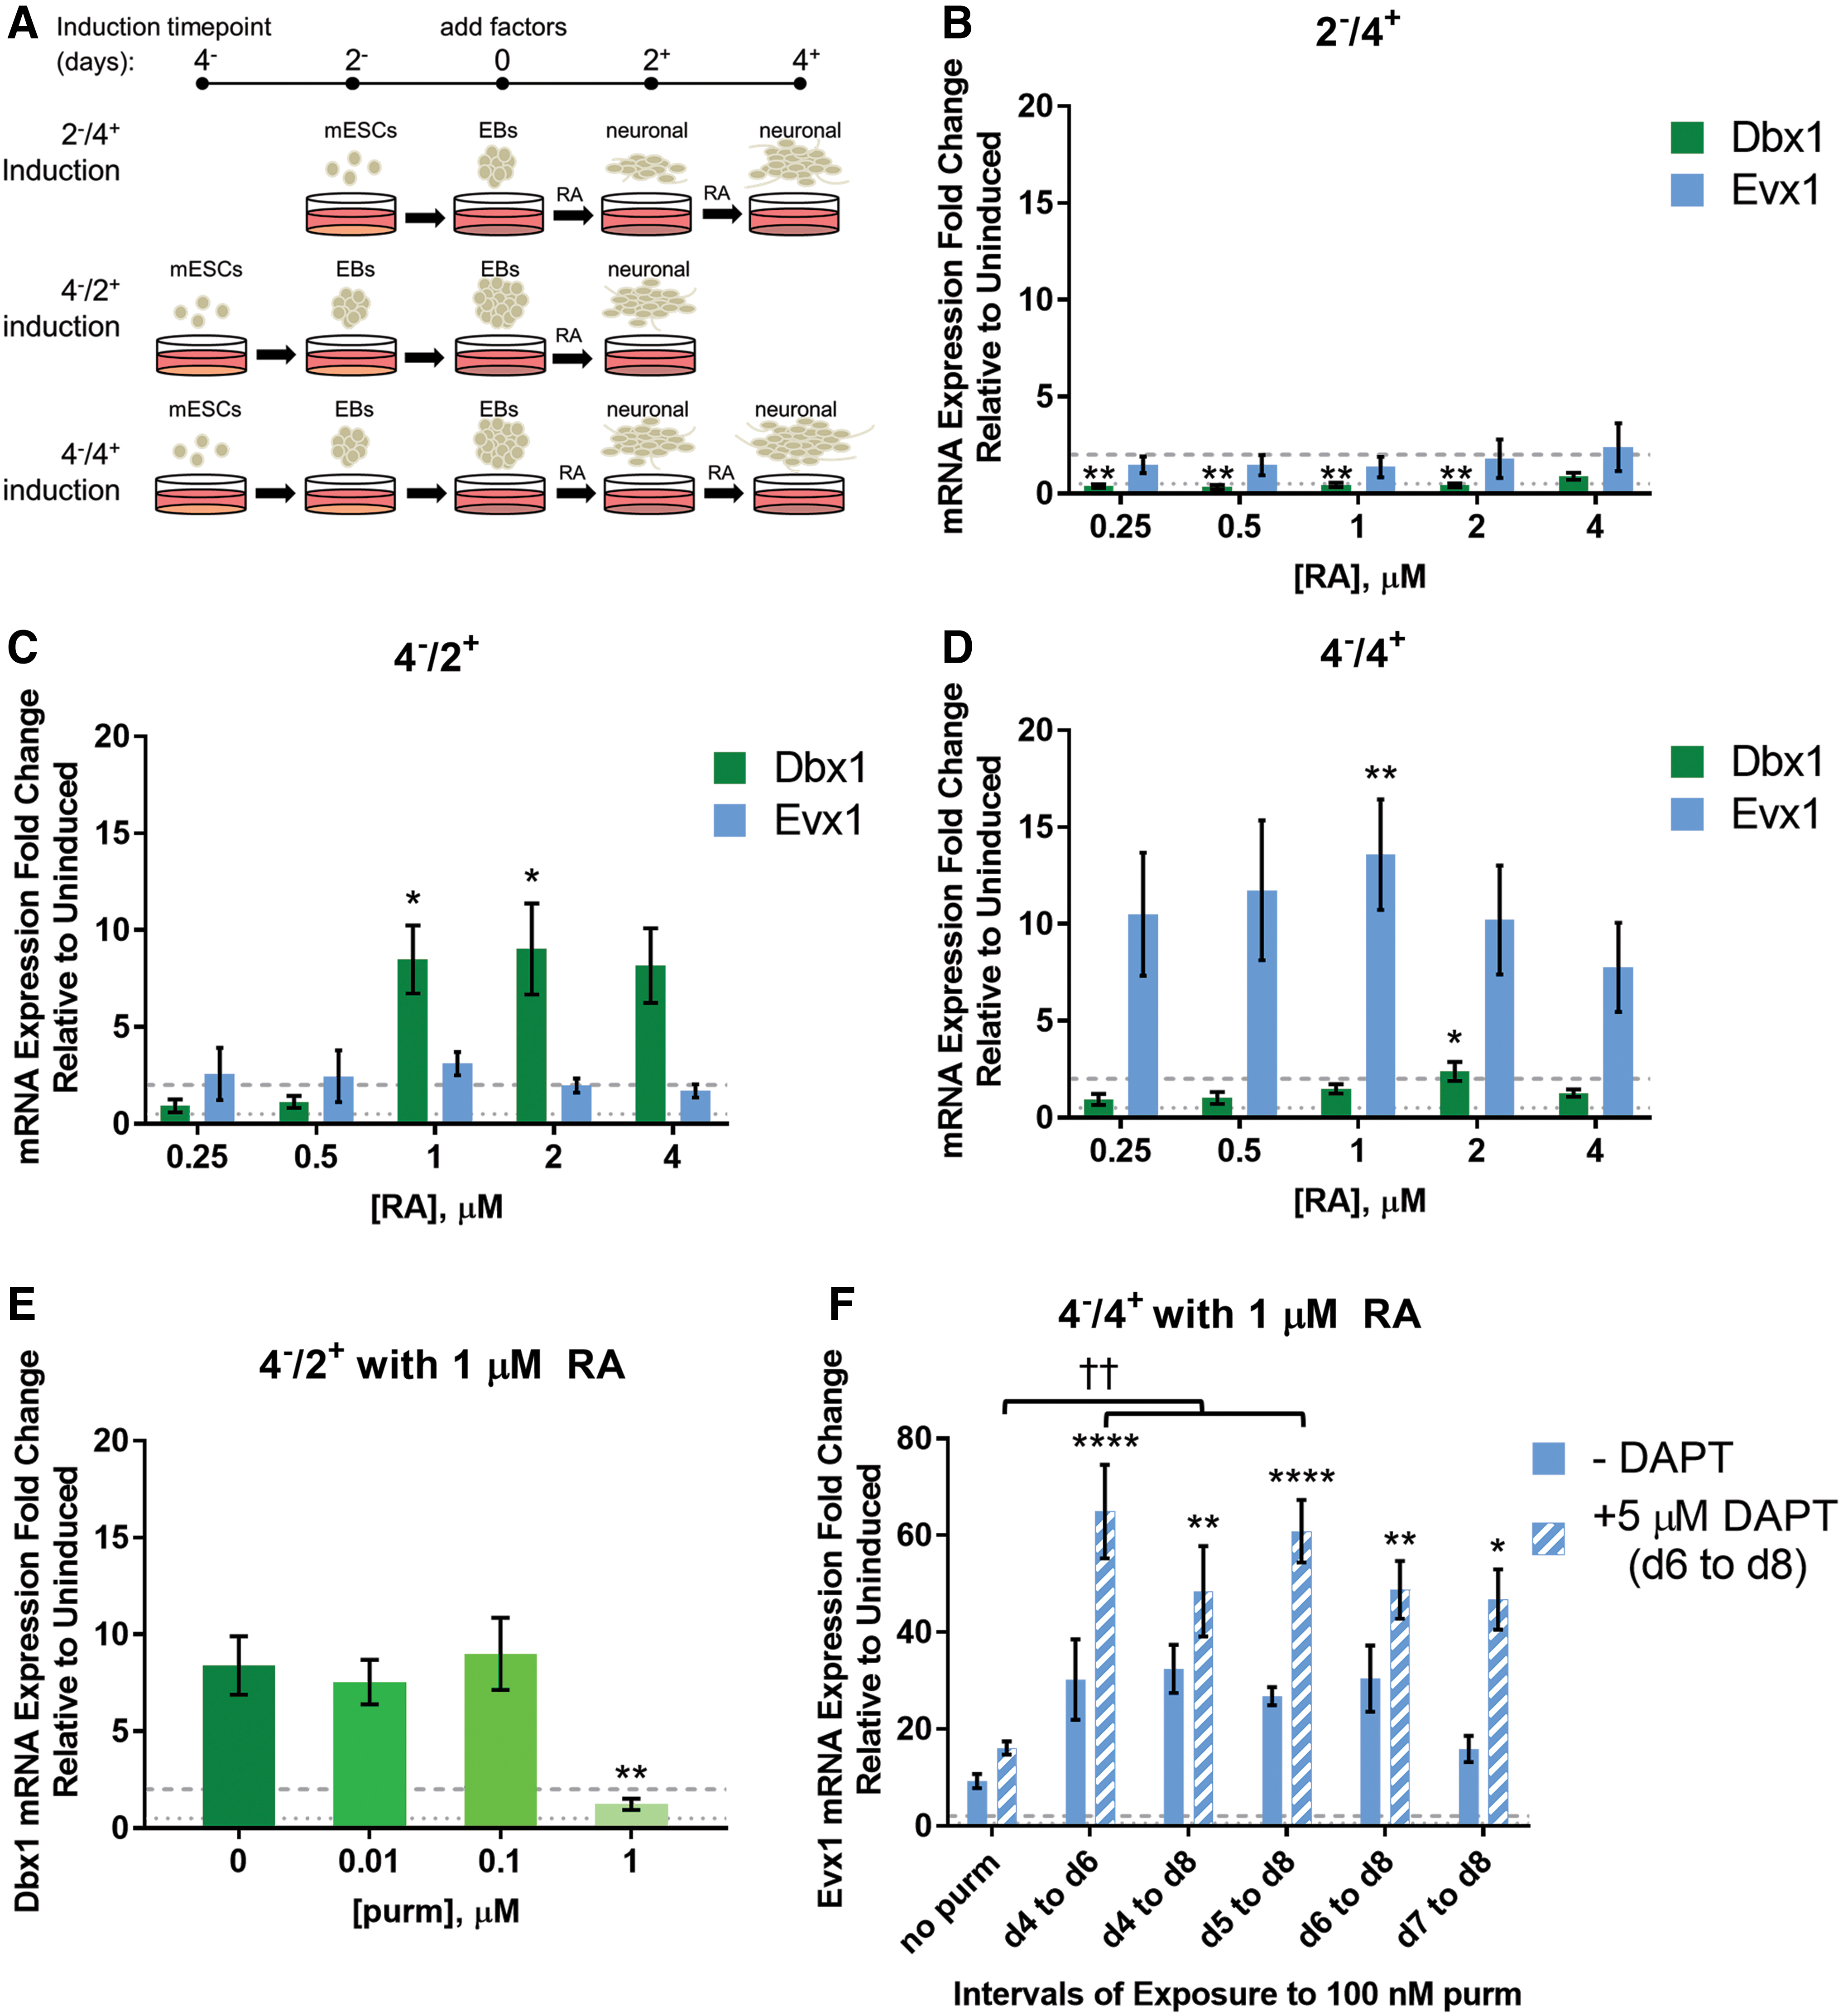
Generating V0 progenitor and IN marker-expressing cells from mESCs.
As seen in Fig. 2B, 2 days of EB formation followed by 4 days of exposure to RA resulted in a significant decrease in Dbx1 (progenitor) mRNA expression at all concentrations tested, except 4 μM RA, and little change in Evx1 (V0V INs) mRNA expression over uninduced cultures grown under the same conditions without RA exposure. However, allowing 4 days of EB formation produced a significant increase in the Dbx1 mRNA expression versus uninduced cultures after exposure to 1 or 2 μM RA for 2 days (4−/2+, Fig. 2C). Another 2 days of RA exposure (4−/4+) generated a significant increase in Evx1 mRNA expression over uninduced cultures at 1 μM RA (Fig. 2D). In accordance with previous observations in the literature of transient progenitor and postmitotic V0 IN markers during development, both Dbx1 and Evx1 mRNA were transiently expressed, and relative expression of these markers was greatly reduced over the ensuing 4 days (Supplementary Fig. S1) [8 –10]. Based on these data, a 4−/4+ protocol using 1 μM RA was used in further protocol development.
Improving expression of V0V IN subtype markers in the population
Although V0 progenitor and IN markers were induced when cultures were exposed only to RA, we wanted to determine the effect of Shh signaling, as it is known to be involved in ventral progenitor IN domain specification. Also, within the different IN populations, there exist many subtypes where the specification of some subtypes (ie, V2a versus V2b) depends, in part, on Notch signaling. Therefore, to see if Shh and Notch signaling had an effect on the specification of V0V INs, various conditions were tested with small molecule effectors for these pathways. The weak smoothened agonist purmorphamine (purm) was used to stimulate Shh signaling, while the gamma-secretase inhibitor DAPT was used to impede Notch signaling.
To observe effects of Shh signaling on V0 IN induction, changes to both Dbx1 and Evx1 mRNA expression were measured. Initially, 4−/2+ cultures induced with 1 μM RA were examined to see the effects of different purm concentrations on V0 progenitor marker Dbx1 mRNA expression after exposure from days 4 to 6; 10 and 100 nM purm did not significantly affect Dbx1 mRNA expression, while 1 μM purm, a concentration used to induce V2a INs from mESCs, significantly decreased Dbx1 mRNA expression (Fig. 2E) [14]. To examine Shh signaling in V0V IN induction, 4−/4+ cultures induced with 1 μM RA were exposed to 100 nM purm for different intervals (Supplementary Fig. S2).
Some of these cultures were also treated with 5 μM DAPT at the latter part of induction to determine whether Notch plays a role in V0V IN induction as well. Figure 2F shows that exposure to 100 nM purm from days 4 to 6 or 5 to 8 with addition of DAPT from days 6 to 8 resulted in the greatest increase in Evx1 mRNA expression (64.9-fold or 60.8-fold over uninduced cultures, respectively). These conditions also resulted in significantly greater Evx1 mRNA expression over induction with RA and DAPT without purm, suggesting that affecting both Shh and Notch signaling is important for achieving a greater level of V0V IN induction. Based on qPCR data of the conditions tested, the most efficient method of inducing Evx1 mRNA expression from mESCs is using a 4−/4+ protocol with addition of 1 μM RA from days 4 to 8, 100 nM purm from days 4 to 6, and 5 μM DAPT from days 6 to 8.
Quantifying proportion of cells expressing markers for V0V INs at different time points
To ensure induction of cells expressing V0V IN markers, we examined cultures by ICC with antibodies against Evx1, Lim1, and the pan-neuronal marker βIII tubulin. Lim1 was used to distinguish the Lim1+ V0V INs from a dorsal IN population, dI1, which also transiently expresses Evx1 during development, but is Lim1− [7]. Uninduced cultures, 4−/4+ cultures with only RA, and 4−/4+ cultures with RA, purm, and DAPT were stained after dissociation and plating on laminin-coated plates. Cells were plated at lower densities for day 10 and 12 cultures to account for cell proliferation (Supplementary Table S1); however, final cell densities were still variable and often higher at the later time points, especially in uninduced cultures. Cultures were fixed on days 8, 10, and 12: Fig. 3A–C show representative images of each condition and time point. Images were analyzed using a CellProfiler pipeline to determine the proportion of “triple positive” cells expressing βIII tubulin, Evx1, and Lim1 (Fig. 3F). Triple positive cells were greatest in day10 cultures grown with RA, purm, and DAPT, with ∼44% of cells expressing V0V IN markers. As an additional measurement of the proportion of cells expressing V0V IN markers, we stained uninduced cultures and 4−/4+ cultures exposed to only RA or RA, purm, and DAPT on days 8, 10, and 12 and analyzed them by flow cytometry (Fig. 3D, E). Flow data show that addition of RA, purm, and DAPT significantly increases the percentage of cells expressing Evx1 and Lim1 on days 10 and 12 over uninduced cultures. On day 10, ∼57% of cells induced with RA, purm, and DAPT express Evx1 and Lim1 (Fig. 3E), while 60% of cells are positive for βIII tubulin (Fig. 3D)—this proportion is comparable to the values seen by ICC analysis.
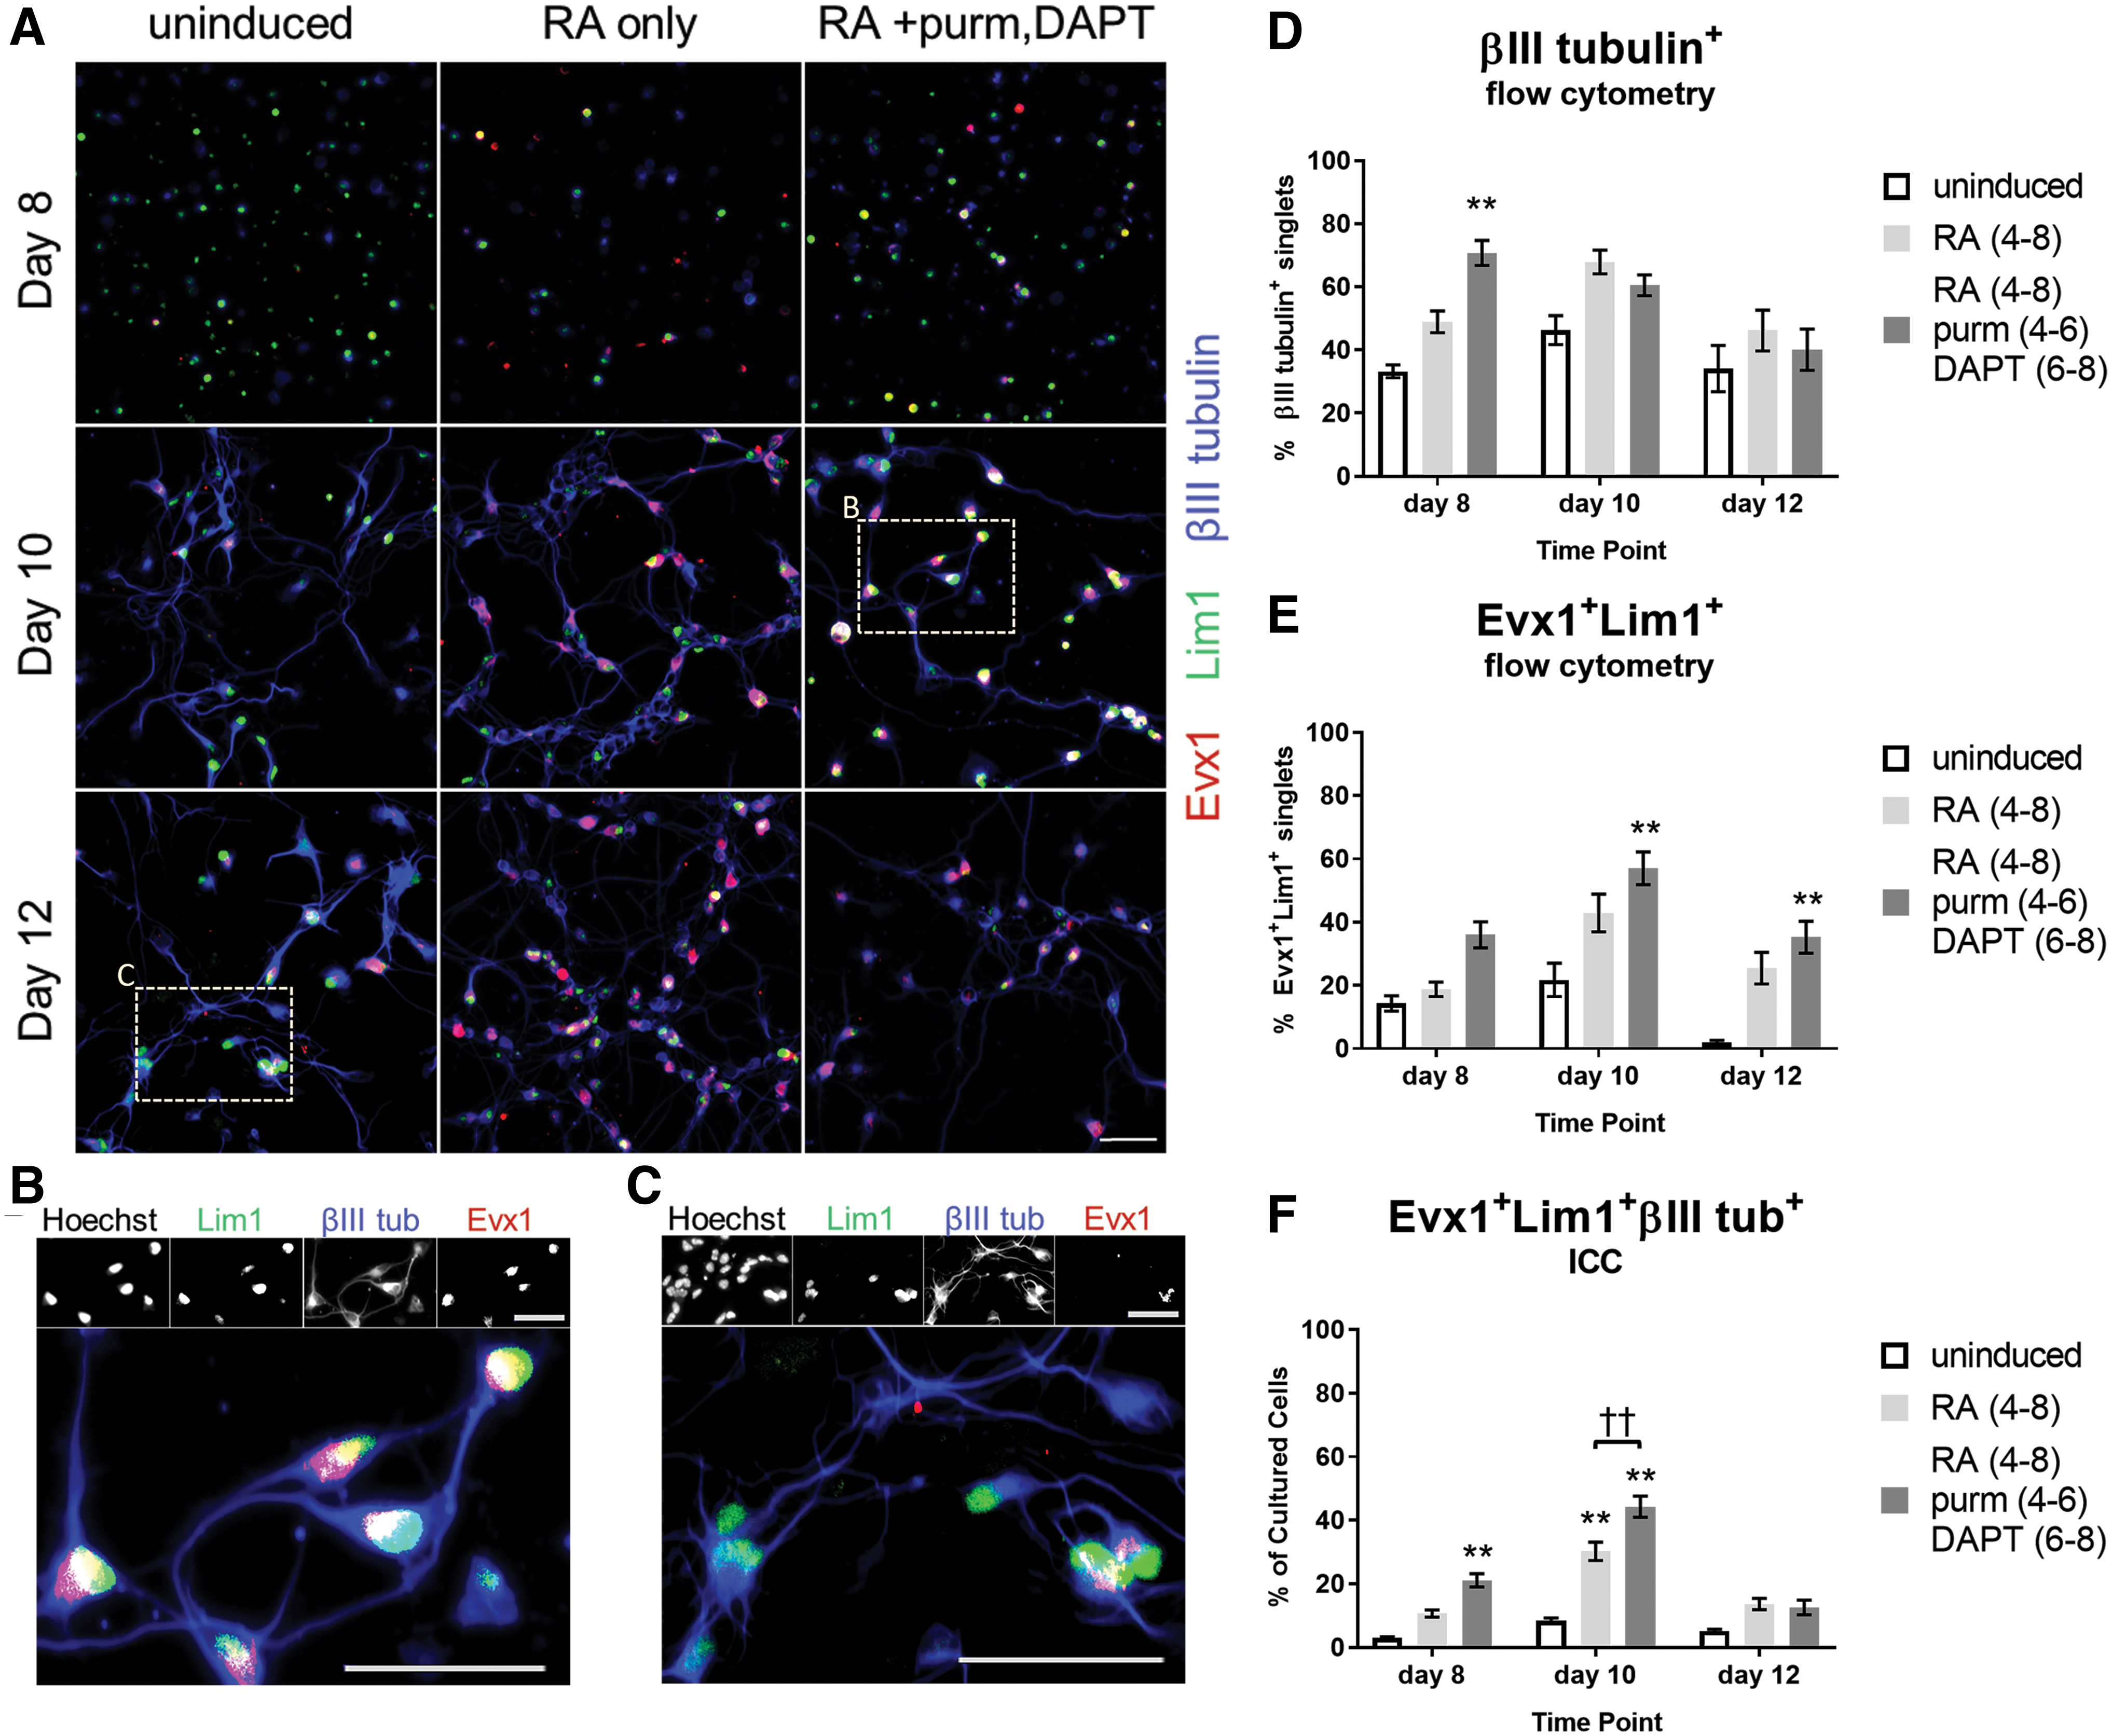
Quantifying proportion of cells expressing markers for V0V INs at different time points. mESCs were induced with 4−/4+ protocol and fixed on day 8, day 10, or day 12; cultures were dissociated on day 8 and thereafter grown on laminin-coated plates in supplemented Neuronal medium until fixation 2–4 h, 2 days, or 4 days later for day 8, day 10, and day 12 time points, respectively.
Determining presence of other cell types after 4−/4+ V0V IN induction
To examine the composition of the resultant heterogenous culture produced through the 4−/4+ induction with RA, purm, and DAPT, cells were probed by immunostaining (Fig. 4). By day 8, V0V IN inductions yielded 36% of cells co-expressing Evx1 and Lim1 (Fig. 4A). The populations that arise adjacent to the V0 INs are the dI6 and V1 INs and are marked by Dmrt3 and En1, respectively (Fig. 1A). In the day 8 cultures, 30.2% of cells were Dmrt3+, while 15.8% were En1+, showing a large portion of the other cells arising in the cultures are of the adjacent IN populations (Fig. 4A). V2a INs can be identified by transient Chx10 expression, and in these cultures, 6.1% were Chx10+. Hb9+ cells in the spinal cord not only largely include MNs but also mark another CPG population of INs [36]. In day 8 V0V IN inductions, 11.6% of the cells were Hb9+Olig2−, suggesting either Hb9+ INs or postmitotic MNs are present, while 3% were positive for both Hb9 and Olig2, showing the presence of pMNs transitioning to postmitotic MNs. Approximately 2.4% of cells were Hb9−Olig2+ cells comprising pMNs and oligodendroglial precursors. Representative ICC images examining these different populations can be seen in Fig. 4B–E, affirming that the majority of non-V0V IN marker-expressing cells are neurons of the nearby neuronal populations.
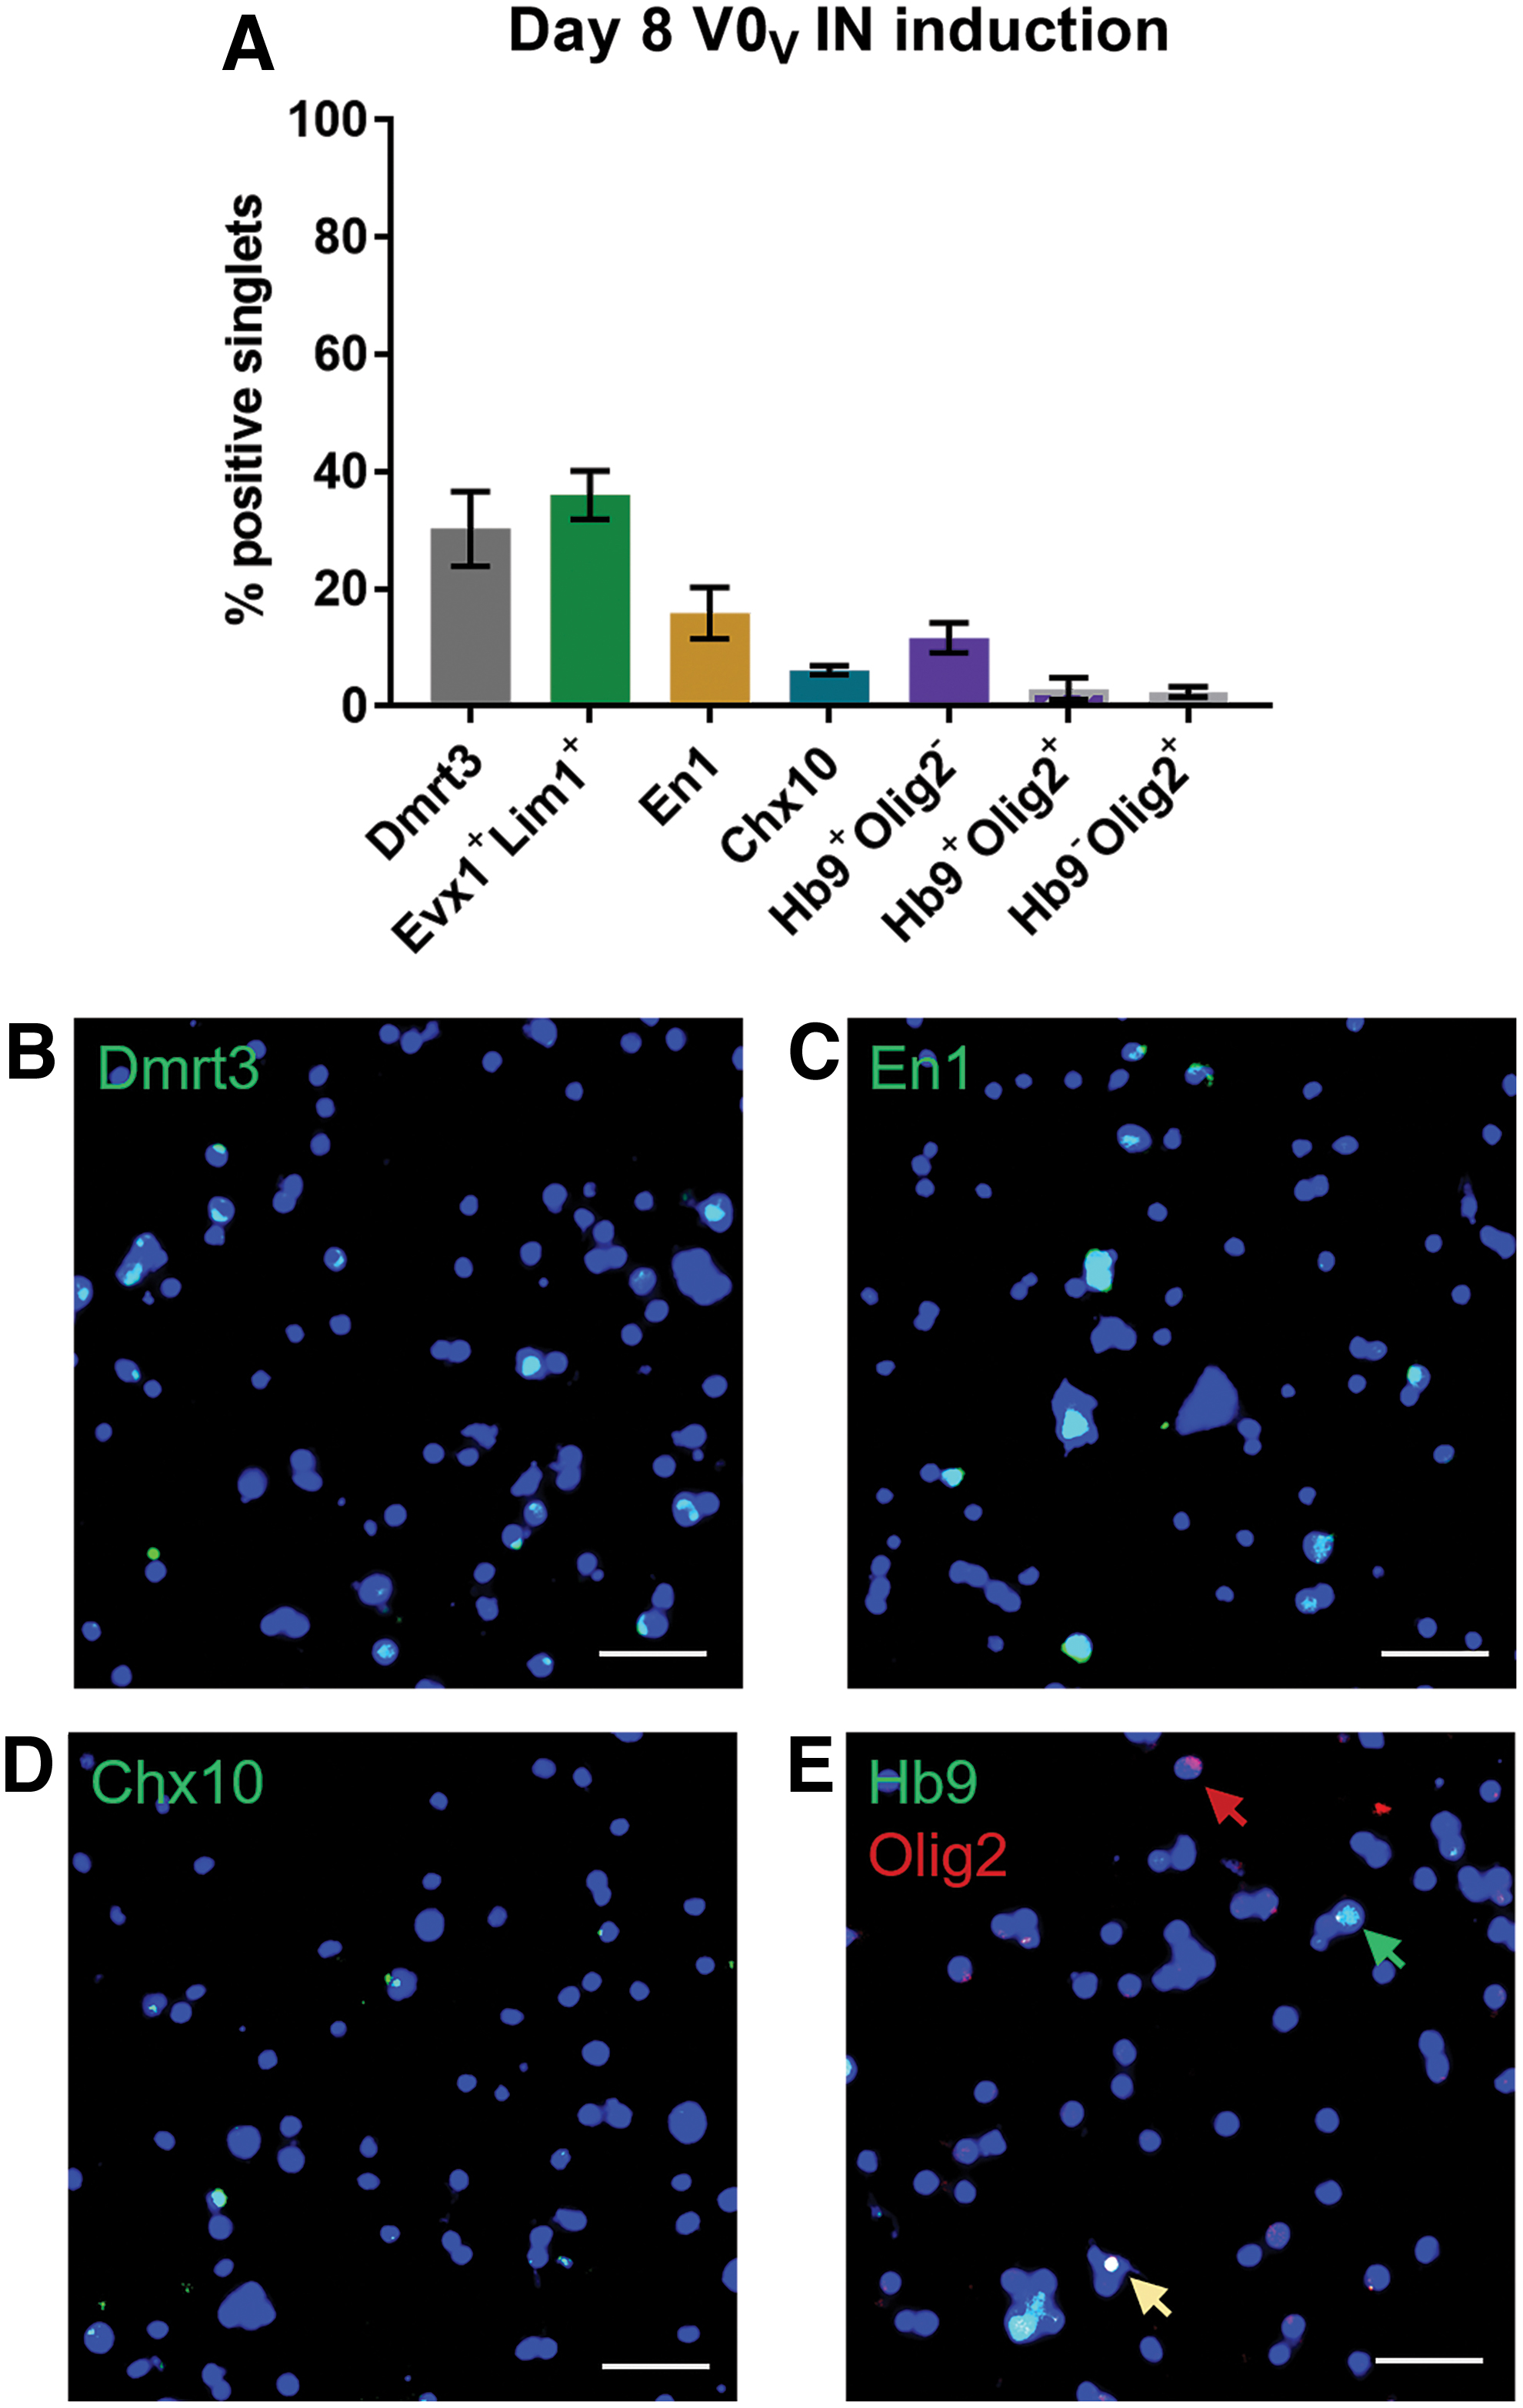
V0V IN induction cultures stain for populations that arise adjacent to V0 Ins. mESCs were induced with 4−/4+ protocol using RA, purm, and DAPT, and then fixed on day 8.
Functionality and maturation of mESC-derived V0V IN cultures
To generate PSC-derived interneurons that can fire action potentials, synapse onto, and affect other cells, V0V IN cultures were induced and examined on day 16 and day 22 for the presence of the mature markers for neuronal nuclei, NeuN, and the dendritic marker MAP2, as well as VGLUT2 for glutamatergic cells (Fig. 5A–D). Day 16 cultures were positive for the mature markers examined, but compared to cultures on day 22, staining seems less organized with fewer NeuN+ cells co-staining with high levels of VGLUT2 (Fig. 5A). By day 22, MAP2 staining becomes more diffused along the processes that have extended, and VGLUT2 appears to have increased in cell bodies. Some VGLUT2 staining is seen along MAP2+ extensions (Fig. 5D). Based on such images, V0V IN inductions show maturation as NeuN, VGLUT2, and MAP2 coincide in more cells on day 22 than on day 16.
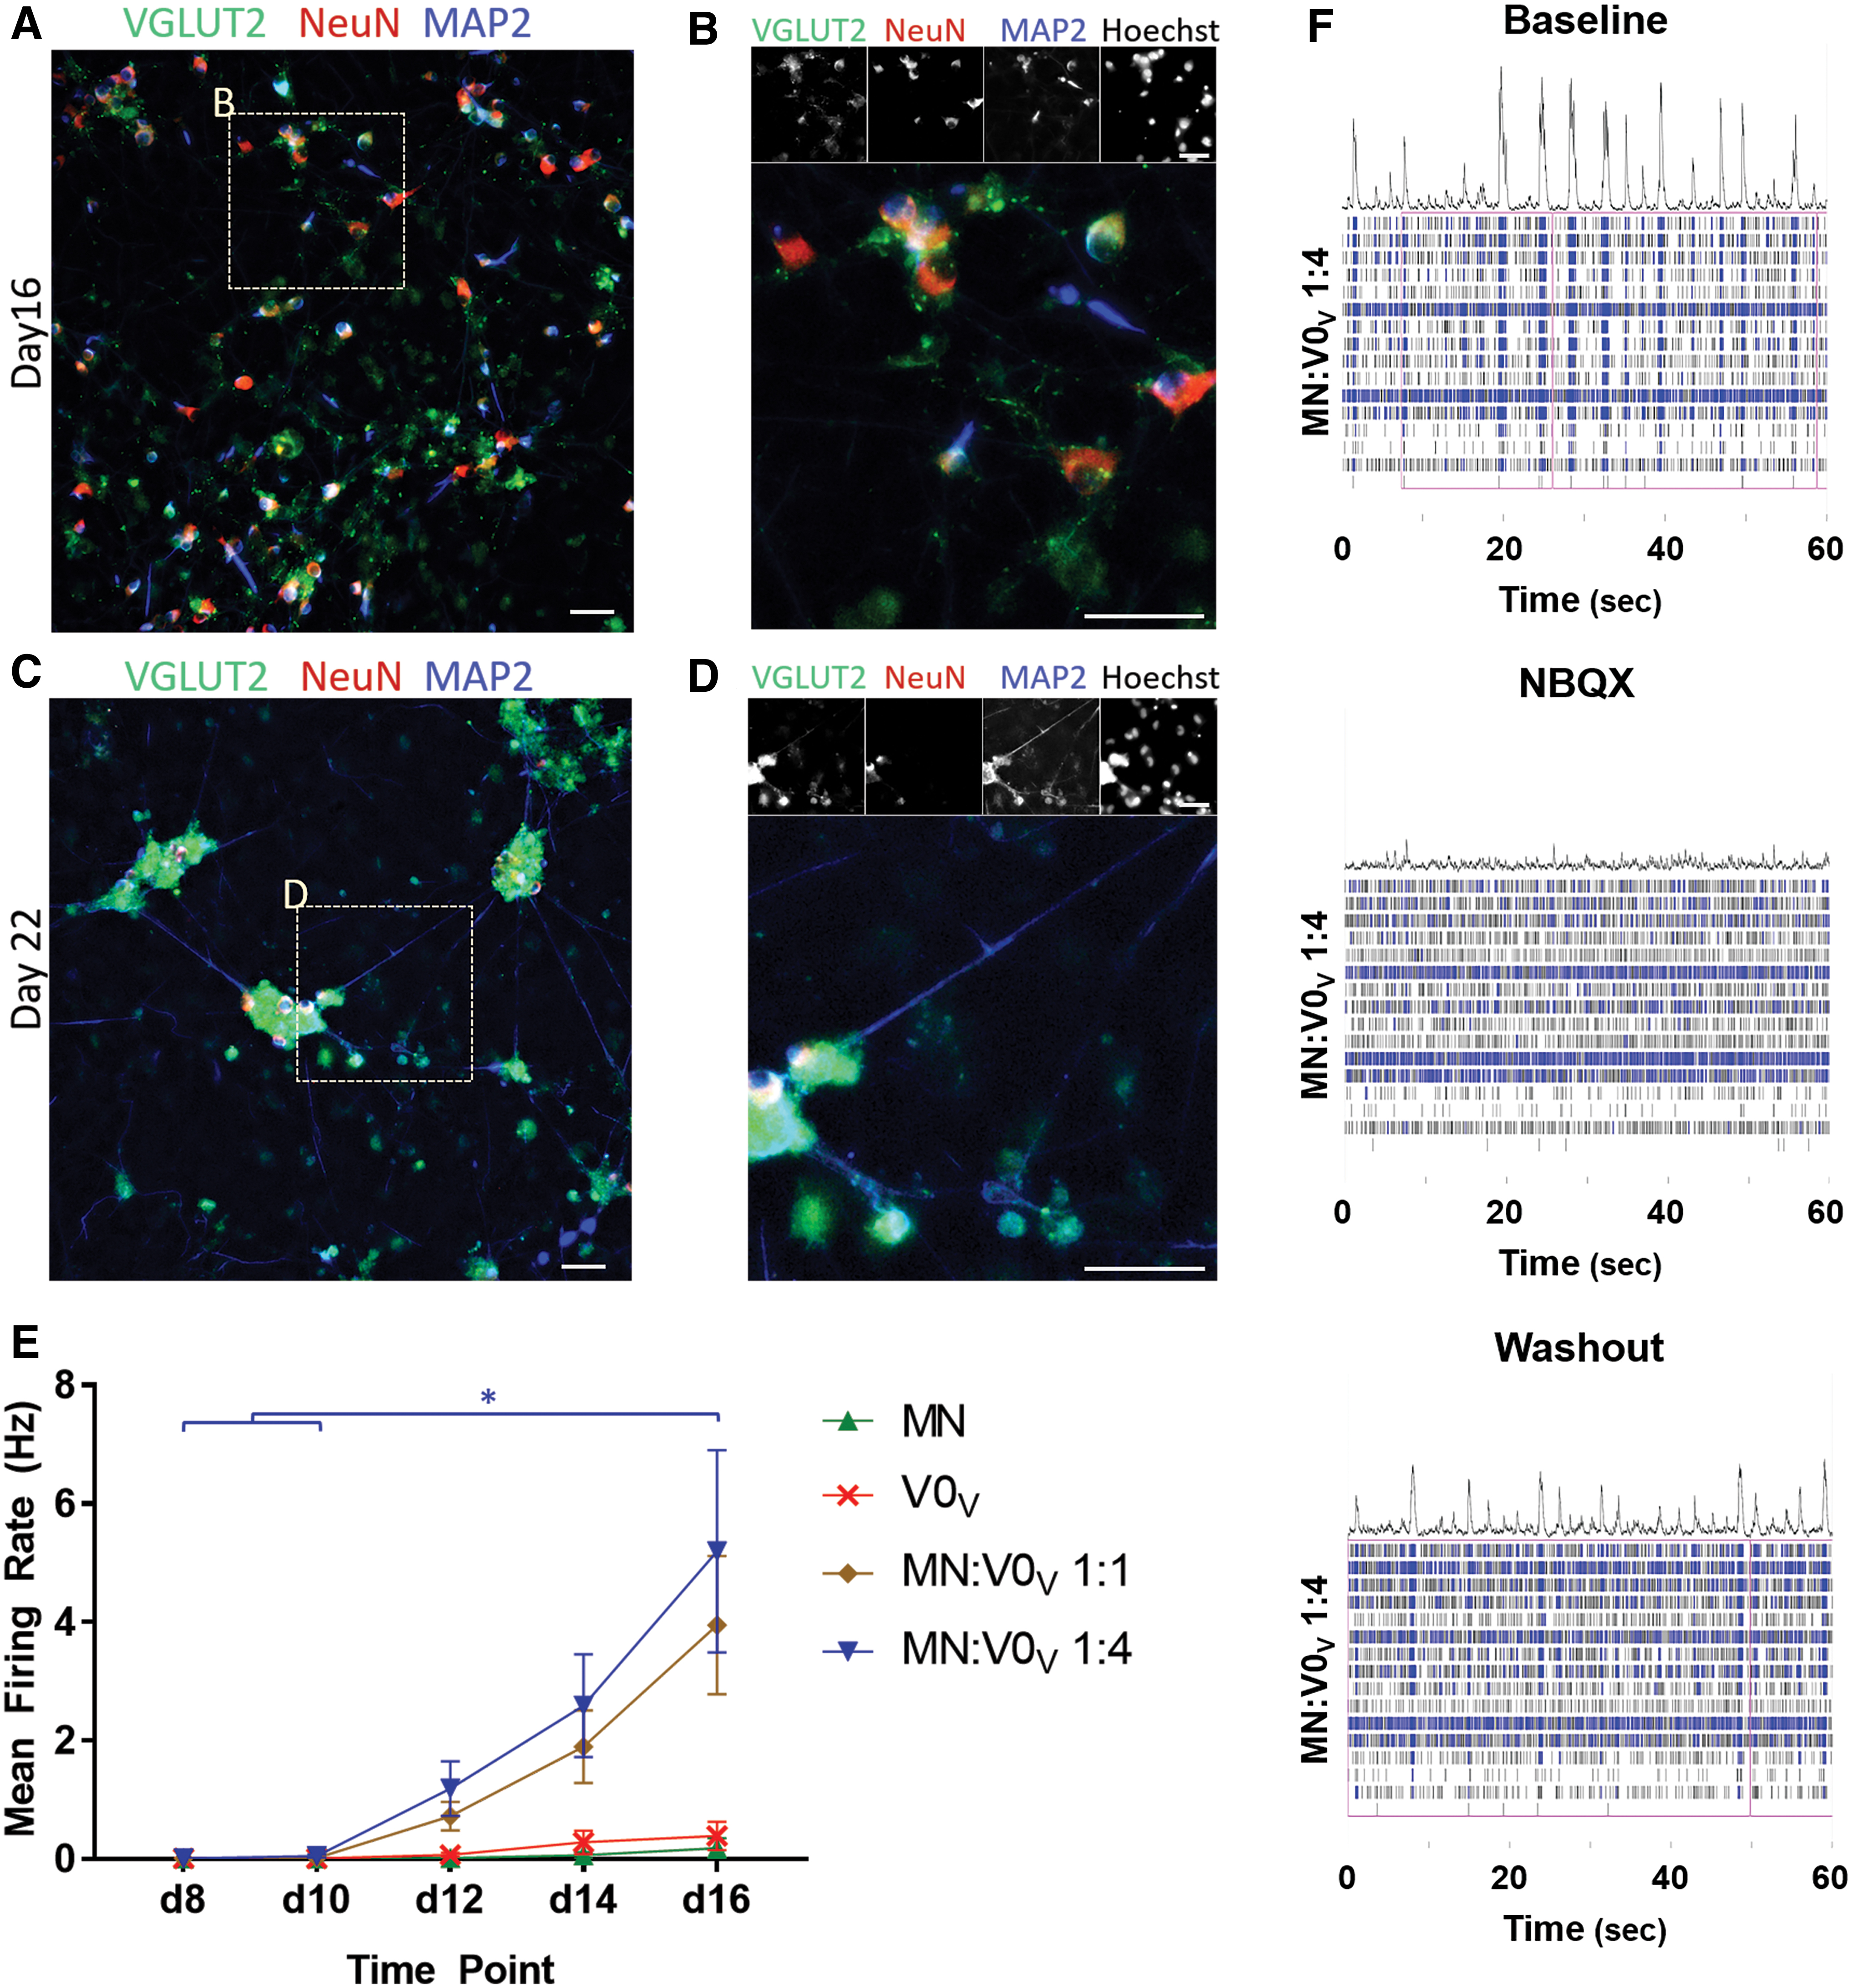
V0V IN cultures show mature neuronal marker protein expression and electrophysiological activity. 4−/4+ cultures with RA, purm, and DAPT were plated on laminin-coated plates and grown up to 22 days.
In these cultures, because of a mixture of cells present, precisely determining the functionality of the V0V INs—which by the time they mature will no longer be marked by their early definitive postmitotic marker, Evx1—cannot be done without a method of tracing or purification. However, cultures were examined to get an overall sense of the presence of functional neurons by culturing the inductions on MEA plates to observe spontaneous activity over time (Fig. 5E, F). For comparison, mESCs were also induced into heterogenous MN cultures following an established 2−/4+ protocol known to generate functional MNs that show maturation over time [37]. Cells were plated either alone or as mixed cultures in a ratio of either 1:1 or 1:4 MNs:V0V INs to allow communication between the different cell types.
The mean firing rate of spontaneous activity for MN cultures was ∼0.2 Hz by day 16, which is on a similar scale to what was observed in a study evaluating the contribution of different ventral INs in in vitro circuitoid cultures [23]. V0V IN cultures' spontaneous activities were around 0.4 Hz on day 16 (Fig. 5E), which is also on a similar scale to that observed of other ventral IN populations in vitro. The mean firing rate was much higher when MN and V0V IN cultures were grown together, and in MN:V0V 1:4 wells, increased to about 5 Hz by day 16—a significant increase over day 8 and 10 spontaneous mean firing rates in these cultures (Fig. 5F). Little has been reported in the literature about the in vitro mean firing rate for spontaneous activity of V0V INs, but the V0C subpopulation has been shown to have a firing rate around 3 Hz in spinal cord preparations where they can synapse onto other IN and MN populations [10].
When cultures were also exposed to the AMPA/kainite receptor antagonist NBQX, a difference in spontaneous activity was only observed in especially active 1:4 MN:V0 co-culture wells, which showed a decrease after a 20-min incubation (Fig. 5F) [38]. Together, these data suggest that there are glutamatergic cells present in the V0V IN cultures that contribute to an increased rate of firing spontaneous action potentials through communication with MN cultures compared to lone MN or V0V IN cultures, but glutamatergic synapses do not play a large role in the spontaneous activity of MN or V0V IN cultures alone.
Discussion
The objective of this study was to derive V0 INs from mESCs with a simple and short protocol. While other inductions deriving MNs or IN populations from mESCs have used 2 days for EB formation before exposure to morphogens, this study has shown that allowing 4 days of EB formation produces higher V0 progenitor and V0V IN marker mRNA expression. Perhaps the additional 2 days provide a necessary increase in cell layers in the EBs to better simulate the conditions of V0 progenitor development in vivo (positional depth in the tissue in combination with morphogen concentration), as these cells are known to arise near the medial central canal.
Compared to established protocols to induce ventral neuronal populations, similar concentrations of RA led to significant increases in V0 marker mRNA expression, with 1 μM RA producing the greatest effect for inducing both the progenitor marker Dbx1 and the V0V IN marker Evx1. Although exposure to only RA was sufficient to induce V0V IN marker Evx1 mRNA expression, providing additional factors to stimulate Shh signaling and inhibit Notch signaling improved the expression of this postmitotic V0V IN marker significantly in the population (Fig. 2F). For Shh, the less potent agonist, purm, was chosen over SAG to achieve signaling levels closer to those known to induce V2a INs. It seems there is a threshold concentration for purm to affect V0 progenitor development, as the 10 and 100 nM concentrations had little effect on Dbx1 mRNA expression over induction with only RA; exposure to 1 μM purm significantly reduced Dbx1 mRNA expression (Fig. 2E). This idea is supported by previous work using 1 μM purm as the concentration to induce mESCs to form V2a INs [14], a more ventral population exposed to a higher concentration of Shh during specification. Also, previous studies have shown and discussed that threshold effects contribute to the definition of the progenitor boundaries [26,31,39 –41]. Based on this effect seen on Dbx1 mRNA expression, further studies were completed using 100 nM purm, the highest concentration tested without effect on Dbx1 mRNA expression. It is possible that induction of cells expressing V0V IN markers would be enhanced if further testing was completed to find the best concentration of purm for induction. Different time courses of Shh stimulation through purm exposure showed that earlier addition on days 4 or 5 tended to yield higher Evx1 mRNA expression. However, addition of purm alone did not significantly increase marker expression over induction with only RA; addition of the Notch inhibitor DAPT alone from days 6 to 8 also did not significantly increase Evx1 mRNA expression over RA-only cultures (Fig. 2F). When both are present during the induction, however, there is a synergistic effect producing significantly higher expression in all cultures exposed to both factors relative to inductions only exposed to RA. In this study, a later addition of DAPT was tested, as subtype specification has been suggested to occur later in the developmental timeline [42], as occurs with V2a versus V2b INs [28,43]. Other time courses of DAPT exposure might alter Evx1 mRNA expression levels, but a brief examination of addition of 5 μM DAPT from days 4 to 6 was also tested with no obvious changes over RA-only induction in the proportion of V0V INs stained by ICC (data not shown).
While there is an approximately fivefold increase in Evx1 mRNA expression in cultures exposed to RA, purm, and DAPT compared to only RA, exposure to these factors yields only a modest increase in the number of cells co-expressing V0V IN protein markers Evx1 and Lim1. This could be due to a few factors. First, as qPCR is a population assay, the relative amount of mRNA measured could either increase slightly in a large number of cells or increase by a large amount in a few cells. Therefore, the small increase in the proportion of cells expressing Evx1 protein as seen in Fig. 3 might comprise cells that have a large increase in Evx1 mRNA expression in a smaller population of cells instead of many cells expressing a slight increase in Evx1 mRNA. Second, the percentage of cells co-expressing Evx1 and Lim1, not just Evx1 alone, is reported; there are some cells that only express Evx1 or only express Lim1, but these values are not reported as this protocol seeks to generate cells co-expressing these proteins. It is possible that using these immunofluorescent assays to measure the V0V IN population has missed some cells that once expressed Evx1, but have already turned off its expression, as Evx1 is known to be transiently expressed [8,10]. This idea is supported by transient Evx1 mRNA expression observed over different time points (Supplementary Fig. S1). The decrease in the “triple positive” cells by day 12, as seen in Fig. 3F, is likely due to a combination of this transient expression of Evx1 as well as a change in the proportion of βIII tubulin+ cells present. On day 10, the morphogen exposure during induction has driven many of the cells toward a neuronal fate, especially when DAPT is present, as it is known to enhance neuronal differentiation [44]. This can be seen as a shift to an earlier peak of βIII tubulin+ cells in the RA, purm, and DAPT induction versus the RA-only or uninduced cultures (Fig. 3D). Also, there are Hb9−Olig2+ cells present (Fig. 4A), which are glial lineage cells that proliferate, resulting in a smaller ratio of postmitotic neurons by day 12. The composition of the induction culture was examined at the day 8 time point because it is the end of induction, when the cultures have the largest ratio of βIII tubulin+ cells, which could give the most representative distribution of cell populations before glia begin to proliferate.
The cultures produced through the protocol presented in this article make a heterogenous mixture, including cells that express markers for the population of interest, V0V INs. However, marker expression alone does not ensure that there are functional neurons present. To show functionality of a heterogenous culture is difficult without using a lineage-traceable cell line to identify the V0V IN population from the culture is problematic; thus, patch clamping for single-cell electrophysiological characterization is difficult when individual V0V INs cannot be identified while alive. Therefore, MEAs were used an alternative means to ascertain that functional neurons are present after induction, although specifying which cells are directly contributing to functionality is not possible using this system. However, if the V0V IN population could be purified from the heterogenous mixture, MEA data could provide more to precisely determine V0V IN functionality—future studies could explore this idea.
In this study, heterogenous MN cultures were used both as a comparison for heterogenous V0V IN cultures as well as to provide a correspondent population, as the MN cultures produced have been shown to include functional MNs that demonstrate maturation over time [37]. The MEA data show that MN or V0V IN heterogenous cultures have limited spontaneous activity on their own (Fig. 5E), which was not entirely expected since other cell types are present that could communicate with the V0V INs, including En1+ (V1 INs), Chx10+ (V2a), and Hb9+ (MN or “Vx” INs) cells. This supports the idea that finding an appropriate ratio of different CPG-associated cell types is necessary to elicit more robust spontaneous electrophysiological activity. In this study, 1:1 and 1:4 ratios of MN:V0V INs were tested, and the mean firing rates were comparable between these groups, with the 1:4 ratio achieving a significantly higher rate on day 16 over days 10 and 8, suggesting maturation and communication between the different cells present in the mix. Because the cultures include proliferative cells, they become overcrowded by about 2 weeks postinduction (observation not shown), emphasizing the need for purified cultures for longer term studies.
ICC of V0V IN cultures on day 16 and 22 using the dendritic marker MAP2, glutamatergic marker VGLUT2, and neuronal marker NeuN show cells expressing all three markers at both time points. However, although not quantified, the number of cells co-expressing these mature markers was observed to be fewer on day 16 compared to day 22, suggesting maturation over this 6-day period. MAP2 staining was intense and constricted on day 16, whereas it became weaker and more widespread by day 22, which follows inference, as more mature cultures have more extensive neuronal processes. However, since MAP2 is known as a dendritic marker, the presence of MAP2 in longer processes suggests that the neurons can mature further. The antibody used to detect MAP2 detects all isoforms of MAP2, including MAP2C, which is known to be expressed in axons in less mature neurons and is later downregulated in preference for MAP2A and B isoforms expressed mainly in dendrites [45].
The presence of glutamatergic cells was also determined through suppression of spontaneous activity in the presence of the AMPA/kainite blocker NBQX. Bursts of action potentials were seen before exposure to NBQX (Fig. 5F), which were obliterated after exposure. Together, ICC and MEA data suggest that the glutamatergic cells present have an important role in spontaneous electrophysiological activity in these cultures, including contributing to the bursting activity observed.
The data presented in this study have shown that the derived cells include those that express V0V IN markers and glutamatergic markers, and neurons firing spontaneous action potentials; however, other cell types are also induced in these cultures, which obscure any observation on the function of V0V INs obtained from utilizing the induced cultures in further studies. Therefore, a means of purification of V0V INs from the heterogeneous population is desirable. A high-purity culture of V0V INs would provide a tool for investigators for use in studies including analyzing spinal microcircuits in a controlled manner, such as in MEAs or microdevices, or after transplantation in animal models to determine whether V0V INs contribute to any functional recovery in injury or disease models. Recently, neural progenitor cells and high-purity V2a INs were transplanted in a cervical level contusion spinal cord injury rat model, and rats receiving the V2a INs showed increased functional recovery over other groups [46]; this shows the utility of obtaining a large, high-purity population of INs and the promise of their therapeutic potential.
This study has provided the first step for future investigations using isolated V0V INs: a method of obtaining a high proportion of V0V INs from a renewable source with a simple 8-day induction protocol. The use of this protocol might be expanded to use in human PSCs. Other spinal populations, MNs and V2a INs for example, have been derived from mESCs as well as from human pluripotent cells [18,47]; V0V INs could potentially be derived from human pluripotent cells using a modified version of this protocol, bringing this research a step closer to translational therapeutics.
Footnotes
Acknowledgments
The authors acknowledge Nisha Iyer, Hao Xu, Sarah Oswald, Mary Salazar, and Nick White for guidance, discussion, and technical assistance.
Author Disclosure Statement
No competing financial interests exist.
Funding Information
The authors were funded by NIH R01NS090617 (S.S.E.) and F31NS100432 (J.P.).
Supplementary Material
Supplementary Figure S1
Supplementary Figure S2
Supplementary Figure S3
Supplementary Table S1
References
Supplementary Material
Please find the following supplemental material available below.
For Open Access articles published under a Creative Commons License, all supplemental material carries the same license as the article it is associated with.
For non-Open Access articles published, all supplemental material carries a non-exclusive license, and permission requests for re-use of supplemental material or any part of supplemental material shall be sent directly to the copyright owner as specified in the copyright notice associated with the article.
