
Abstract
Abstract
As space travel matures and extended duration voyages become increasingly common, it will be necessary to include arrays of early fire detection systems aboard spacefaring vessels, space habitats, and in spacesuits. As gasses that are relevant to combustion and pyrolysis have absorption features in the mid-infrared range, it is possible to utilize absorption spectroscopy as a means of detecting and quantifying the concentration of these hazardous compounds. Within this work, a sensor for detecting carbon dioxide has been designed and tested autonomously on a high-altitude balloon flight. The sensor utilizes a 4.2-μm light-emitting diode source, amplitude modulation to characterize species concentrations, and frequency modulation to characterize ambient temperature. Future work will include expanding the sensor design to detect other gases, and demonstrating suborbital flight capability.
Introduction
As human space development within the coming decades shifts toward commercial travel and interplanetary civilizations, the need for monitoring hazardous gaseous species concentrations becomes increasingly paramount. Aboard spacecraft, within spacesuits, and even in confined habitats, such as those planned for future Mars or Earth Moon Missions,1–3 the monitoring of gasses hazardous to humans, experiments, and equipment is paramount for ensuring safe operations.1,4,5 Detection of toxic gases is necessary in every part of the mission from prelaunch fueling, where volatile fuels such as toxic hydrazine may partially decompose exothermically at room temperature in the presence of exposed catalytically active metallic surfaces, 6 to routine inspection and status monitoring. Even chemically inert gases such as carbon dioxide (CO2), at concentrations below asphyxiating limits, can pose an indirect risk to humans by reducing cognitive performance. 7 Although the total list of gases hazardous to spacecraft operation is extensive, Table 1 lists gaseous species and various volatile organics observed by NASA and others to be more commonly occurring in spacecraft.
Hazardous Trace Gaseous Compounds That May Be Present in Spacecraft
Many different technologies are used in fire detection systems for use in conventional structures and naval vessels such as 3D stereoscopic methods, 8 alpha particle emission-based smoke ionization detectors, 9 forward scattering near-IR lasers to identify particles characteristic of smoke, and others. However, there are key differences between fire mechanisms on spacecraft compared with those occurring on Earth. As there is negligible gravity-induced buoyancy within spacecraft, the residence time of particles in the air increases 10 ; this enables larger aerosol particulate to form, and the difficulty in distinguishing between smoke and naturally occurring aerosols may lead to false-positive fire detection. 11
Although one approach to minimizing fire potential in space missions and extraterrestrial applications is to use energy conversion techniques that are innately safer such as fuel cells, heterogeneous combustion, photovoltaics, and thermoelectric energy conversion,12–15 fire detection and suppression systems will remain necessary. In larger spacecraft or structures intended for long-term human utilization, arrays of hazardous gas detection sensors will be necessary to assist in locating combustion events to enable rapid crew, or automated, response to contain the problem and correct the underlying cause. Locations for such detector systems should be extended beyond the crew cabins and galleys to volumes that may be kept at lower pressures, such as cargo bays, and near-fuel/oxidizer tanks (both on vehicle and on ground).
This work describes a proposed design scheme and test procedure of a sensor utilizing light-emitting diode (LED) light sources for the detection of hazardous gases in space. As presented herein, the sensor is only intended to detect CO2, though a final version to be used on future spacecraft should also include more gasses from Table 1. The technology can be used for developing affordable distributed sensors that are sensitive to targeted combustion byproducts. Using LEDs as sources instead of lasers is advantageous as lasers require extensive external driver components, and are usually associated with extremely high cost. Conversely, LEDs require minimal power overhead in some instances below 1 W, produce ultra stable output (>20,000 h), and are more robust than lasers; these attributes of LEDs are high-value factors in aerospace design constraints, 16 enabling sensor placement in discrete locations through the spacecraft or habitat.
Theory of Absorption Spectroscopy
Absorption spectroscopy is a technique of gaseous species detection that is achieved via the attenuation of light at wavelengths corresponding to the molecular oscillations of the gases being identified.
17
A basic absorption spectroscopy setup is schematically represented in Figure 1. Using an abstraction of the Beer–Lambert law (Eq. 1), the Transmittance T, (unitless), is the ratio of the observed spectral irradiance,

Schematic of detector and source with
Proposed Single Sensor Configuration
The sensor design presented in this work based on a brassboard version that utilizes LEDs. 23 The configuration of the sensor's ancillary components for miniaturization, details of the optical configuration, and the electrical system are discussed within this section. The data collection methods are briefly discussed as well as the specifics of the NASA-LSU sponsored High-Altitude Student Payload (HASP) flight profile. 24
System Configuration
As the sensor's intended use is for space applications, the sensor design prioritized compactness and overall robustness. To enable the testing of the sensor on a high-altitude balloon flight, an enclosure to contain gasses is necessary. The sliding frame supporting the optical system, electrical components, and gas cell had two levels (Fig. 2). The lower level houses a cRio-9031 real-time embedded controller with various IO modules (National Instruments, Austin, TX), which is utilized for data logging and sensor control. The lower level housed a high-pressure gas cell for use in future experiments to measure changes in the mole fraction of standard calibration gasses. The gas cell has a solenoid valve that can be actuated via the cRio. The optical system and circuit board are housed on the upper level. Wiring passthroughs are placed at necessary locations on the sliding assembly for efficient cable routing. By design, the sliding assembly's upper and lower levels are separable to enhance sensor serviceability.
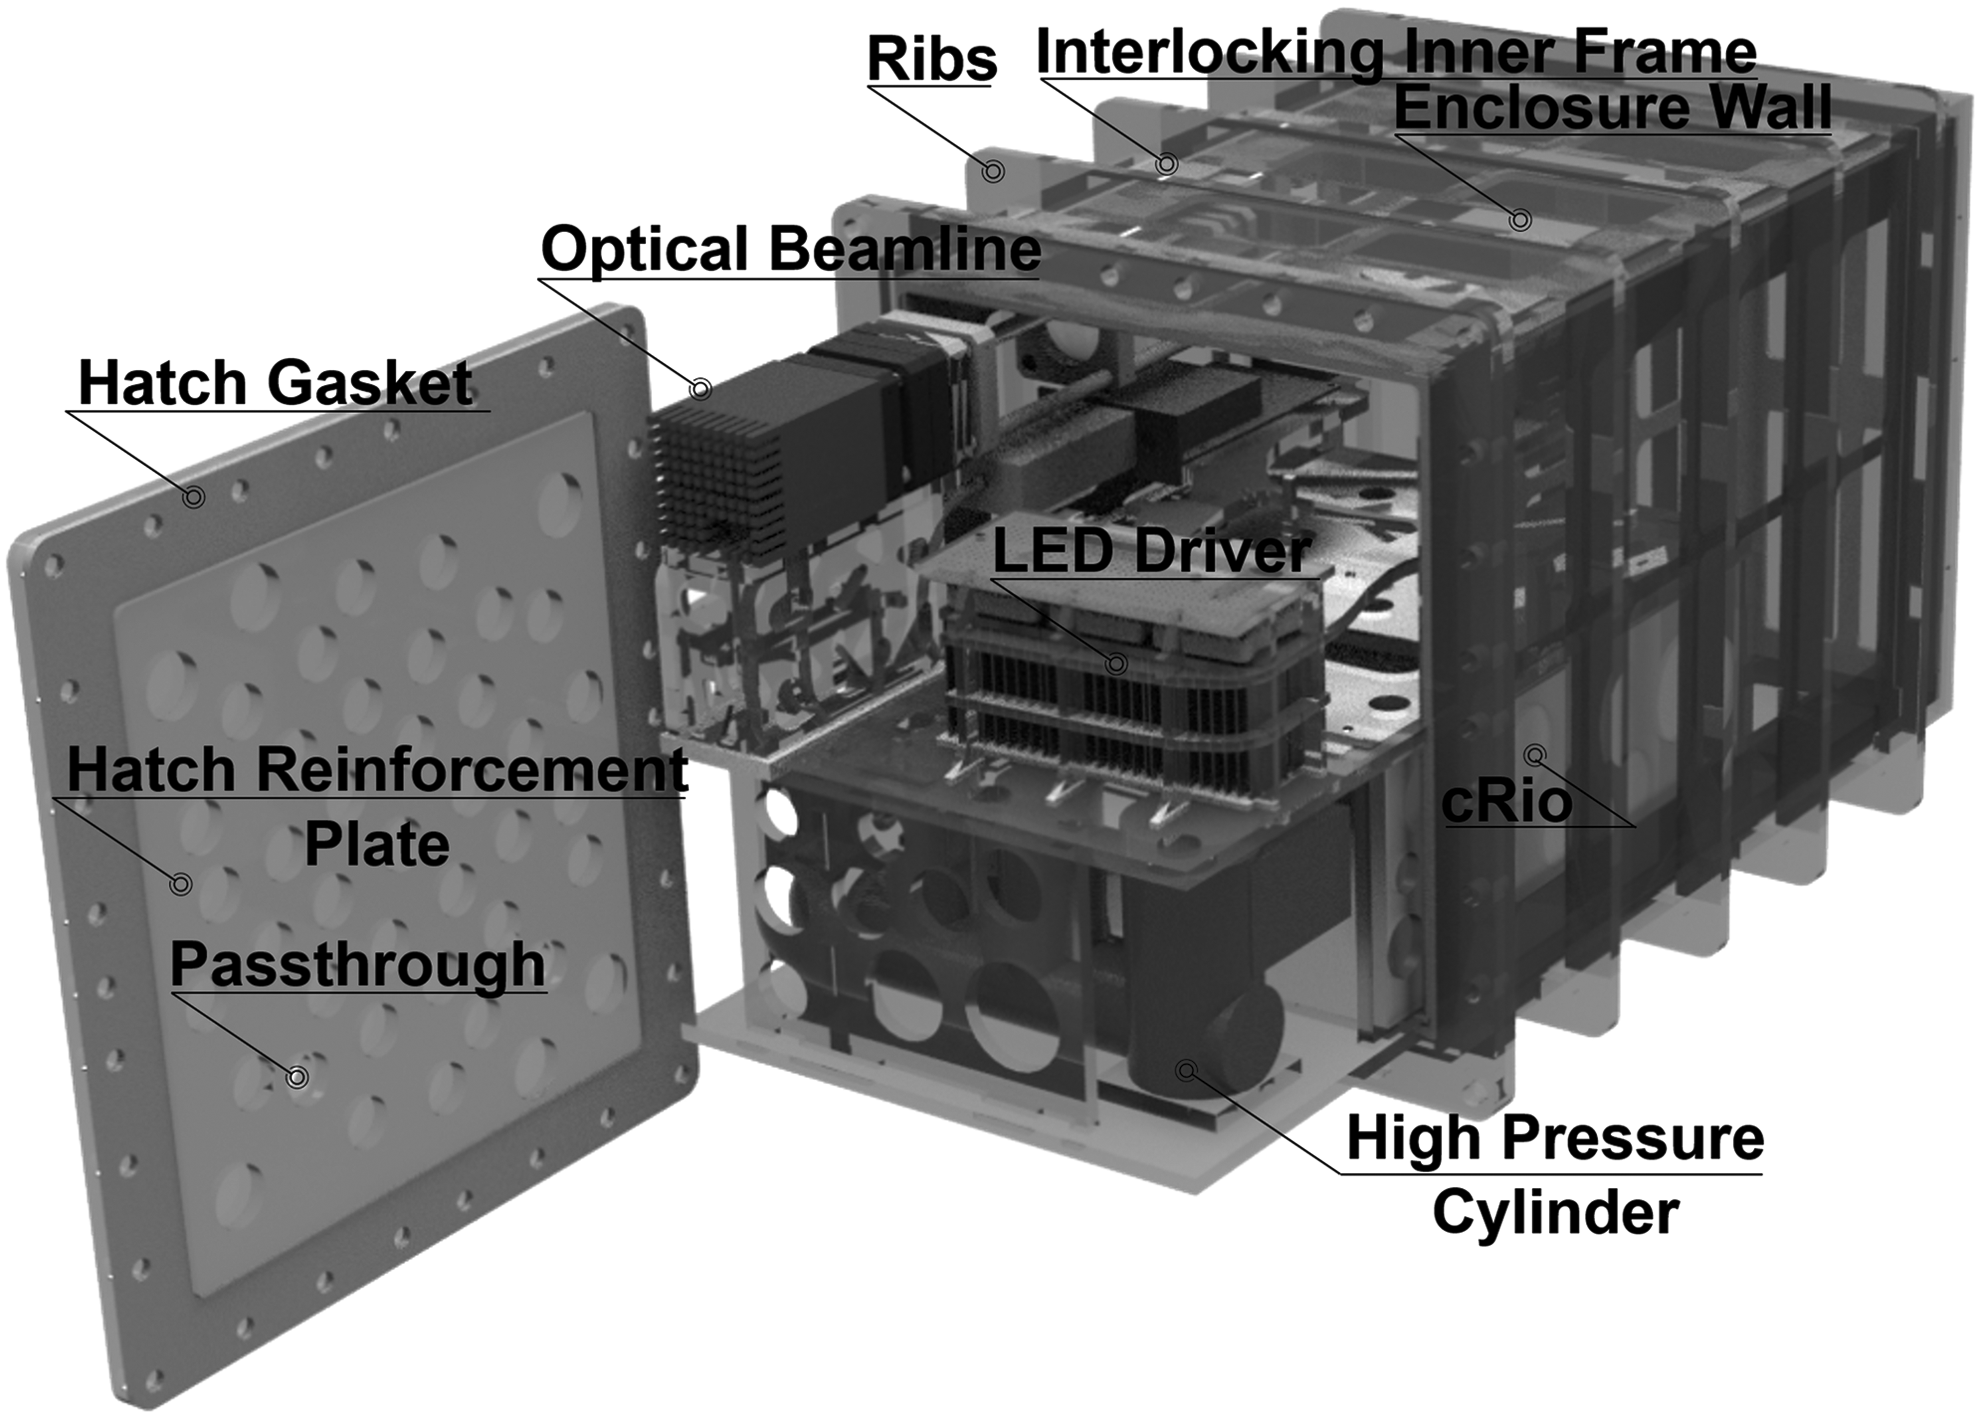
Schematic of the sensor housed in its acrylic enclosure with labeled components. LED, light-emitting diode.
Sensor Spectral and Optical Configuration
The test flight examined the sensor's ability to detect CO2. Spectral characteristics of the LED, filter, and CO2 absorption are presented in Figure 3. The LED was sourced from IoffeLED (LED42, St. Petersburg, Russia), and its emissions profile was centered at 4.2 μm. Figure 3A shows the LED's spectral emission irradiance at three LED operating temperatures, normalized to 22°C, and the filter's spectral transmission

Figure 3B–D shows the temperature and pressure dependence of
The sensor optical path is shown in Figure 4. All lenses (CaF2) are sourced from Thorlabs (Newton, NJ); the 4.2 μm filter is sourced from Edmund Optics (Barrington, NJ). Immediately after the LED, a lens trio consisting of a bi-convex lens (1/2-in outside diameter [OD], 15.0-mm f) and a plano-convex lens (1-in OD, 50.0-mm f), with a 4.2 μm filter placed between the two, and a third plano-convex lens (1-in OD, 100.0-mm f) are used to collimate the emissions to a 25-mm diameter beam. Following the collimating lenses, a set of four condenser lenses (1-in OD, 40.0-mm f), (1/2-in OD, 20.0-mm f), (1/2-in OD, −25.0-mm f), (1/2-in OD, 15.0-mm f) are then utilized to focus the beam onto the photodiode detector (PVI-3TE-5, Vigo Systems S.A., Ozarow Mazowiecki, PL).
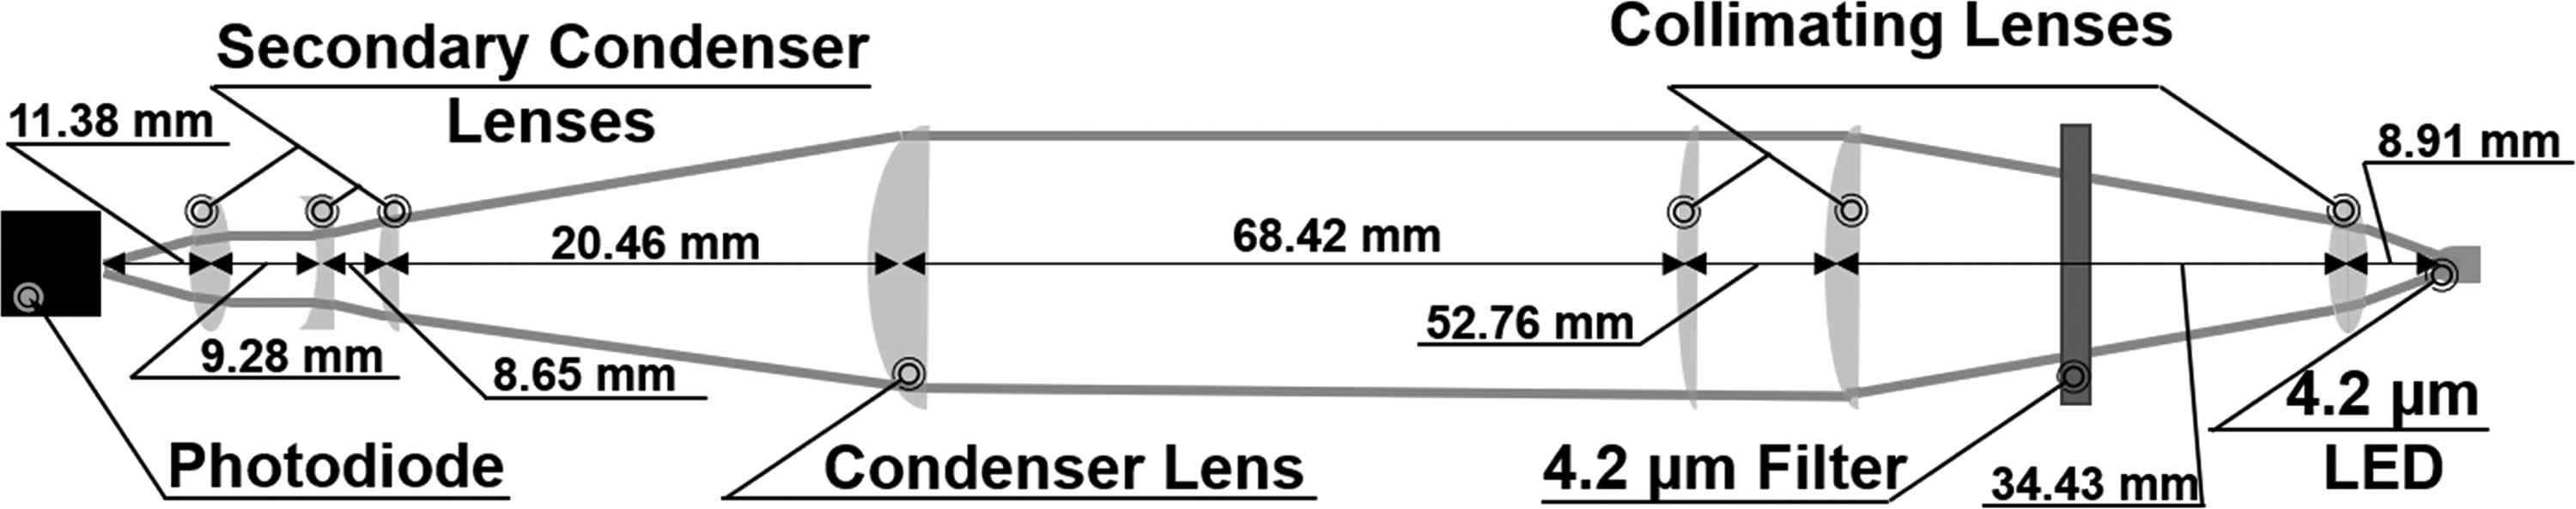
Optical path of the sensor. Figure not to scale.
Sensor Electrical Schematic
A schematic of the electrical systems is shown in Figure 5. The sensor is designed to operate on a 30VDC, 0.6A. A DC voltage regulator (Fig. 5A) was designed by using an LM2596 IC (Texas Instruments, Dallas TX), utilizing a potentiometer (P1) to enable voltage output between 1.23 and 30.0 V. Electrical system noise was mitigated by using a single inline choke (L1) coupled with load-leveling capacitors (C1 and C2) before and after the LM2596. Using this same design, five separate DC/DC converters are used in parallel to provide: (1) a 24VDC line to power the cRio, and solenoid valve relay; (2) a 12VDC line to power the photodiode and stepper motor controller; and (3—5) three independent 5VDC rails are used as shown in Figure 5B to power the state-variable circuit (Fig. 5C), LED driver circuit (Fig. 5D), and amplifier circuit (Fig. 5E).
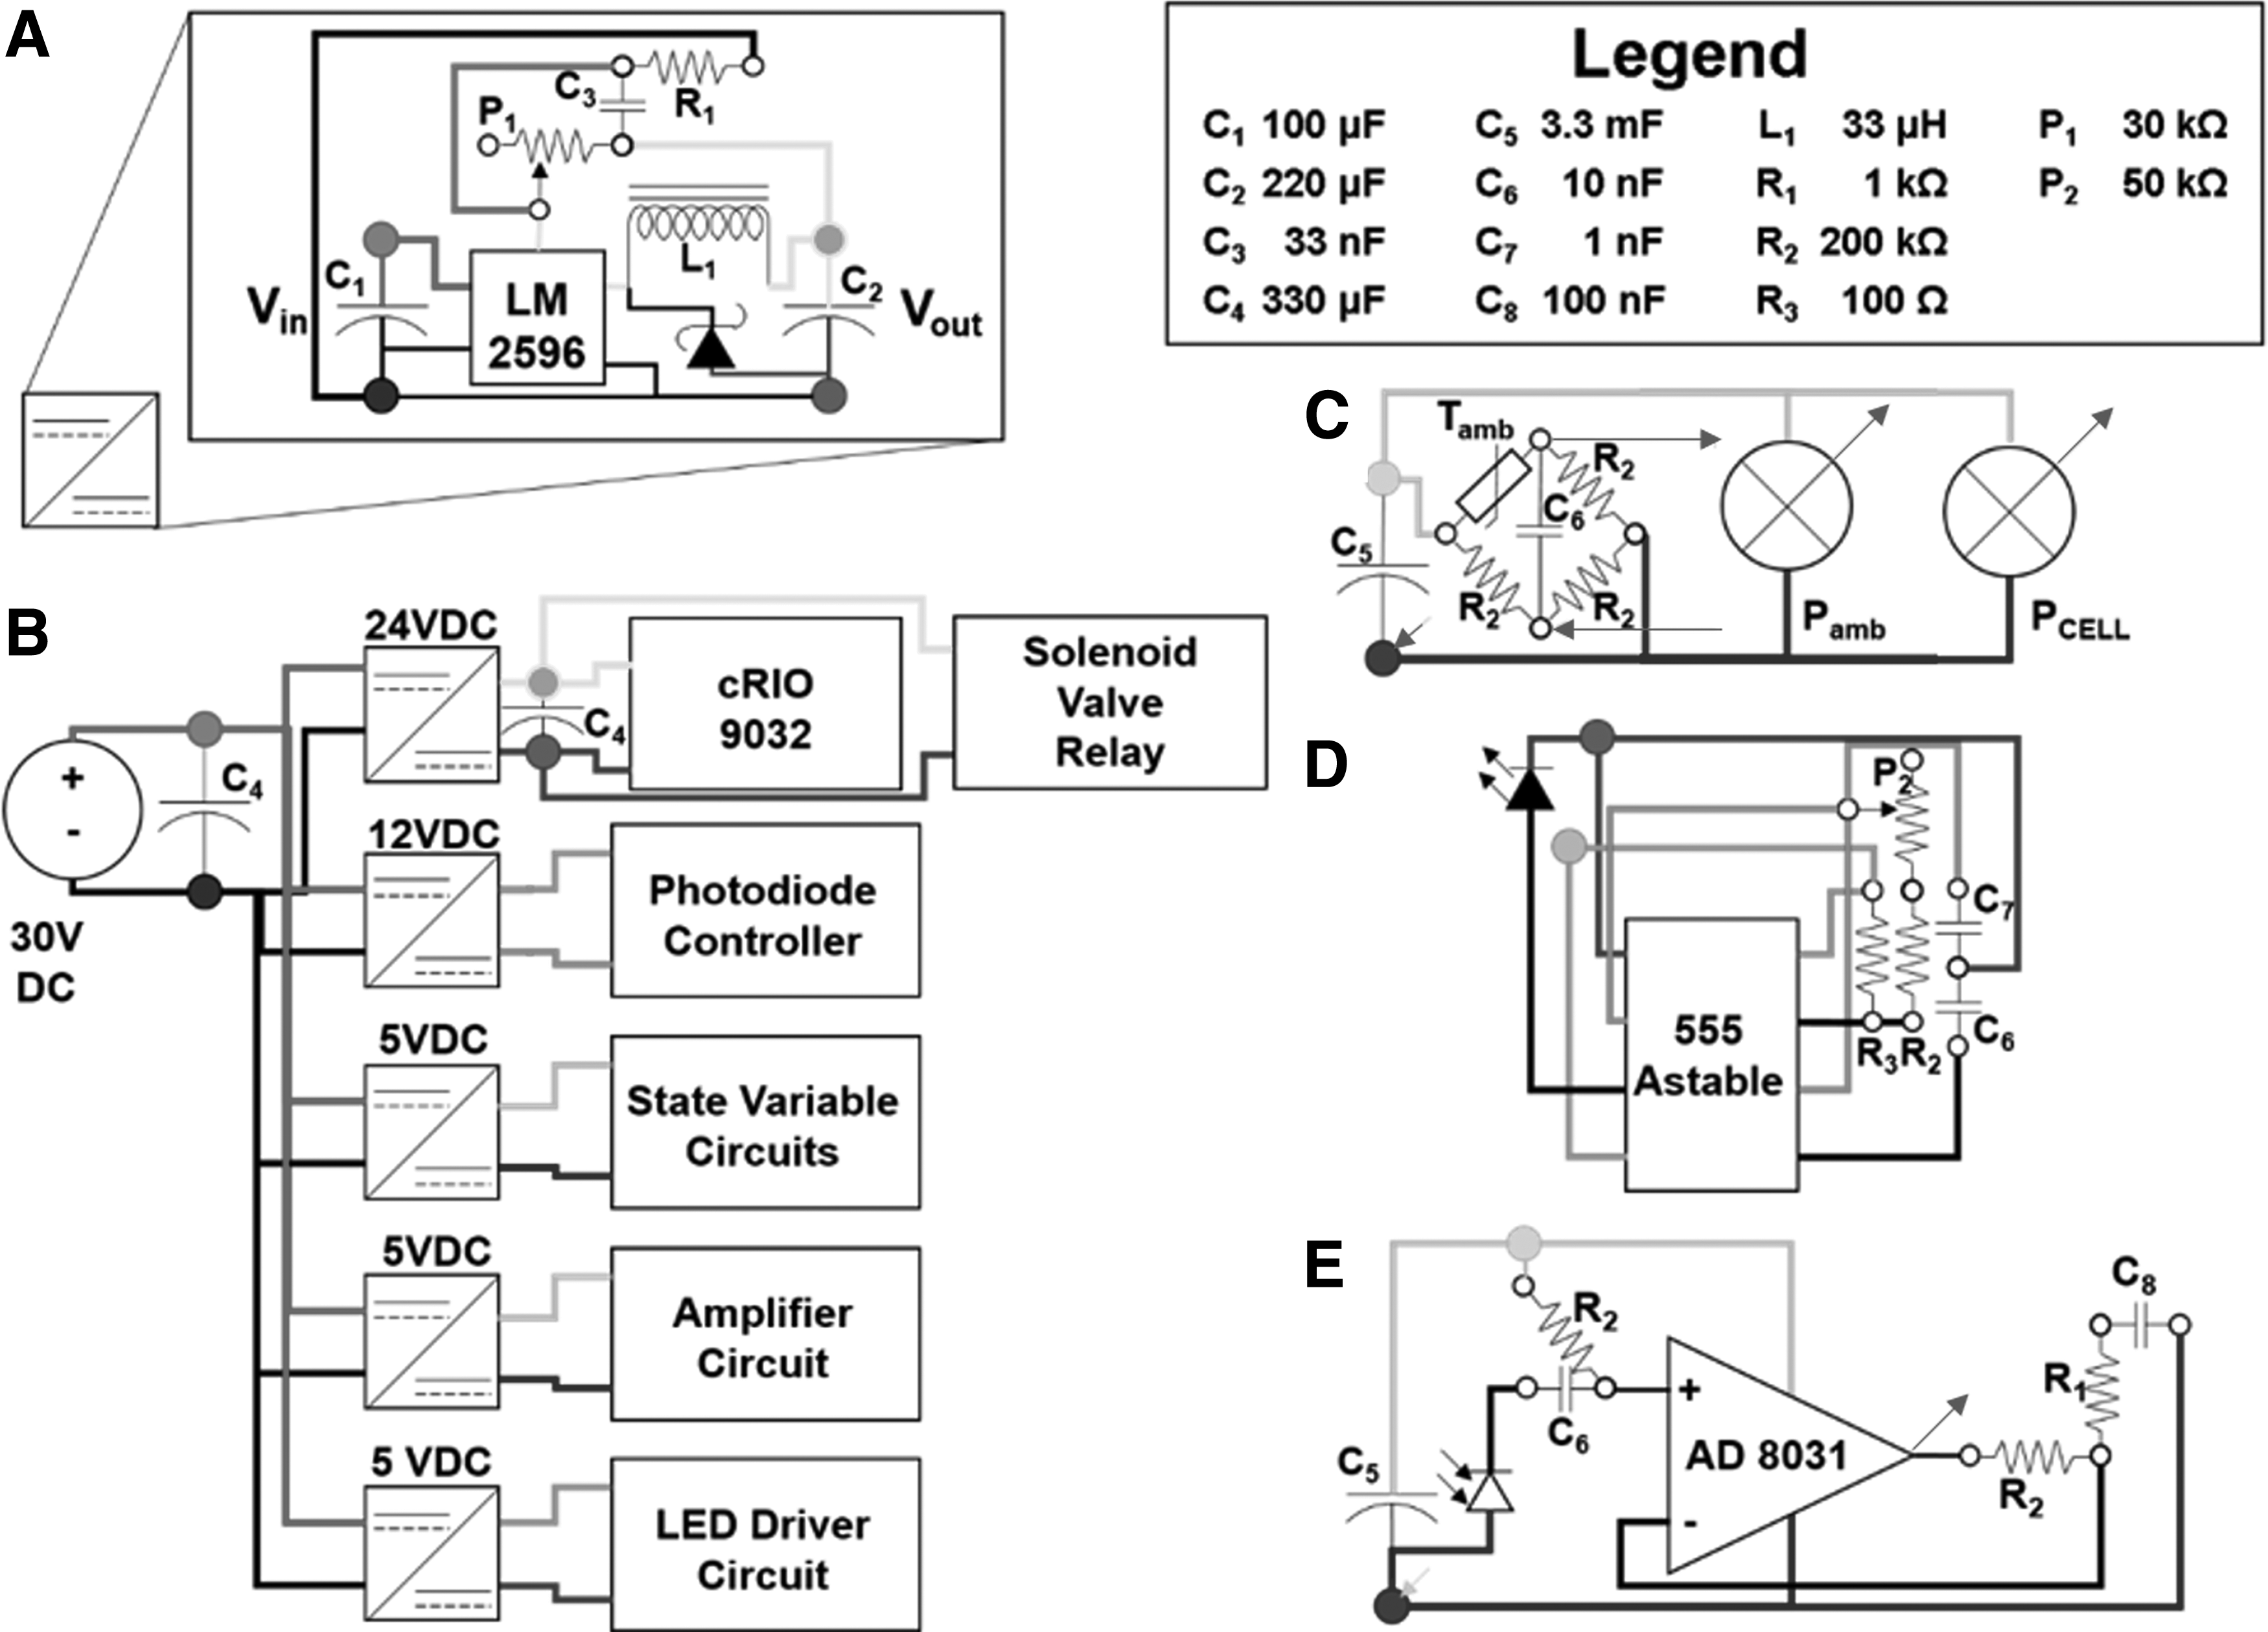
The state-variable circuit has output signals from thermistors and pressure transducers, to the cRio and are used internally to calibrate the sensor response for a range of temperatures and pressures. Temperatures are recorded by using NTC thermistors, (NXFT15WF104FA2B050; Murata, Kyoto, Japan) incorporated into a Wheatstone bridge with a ceramic capacitor across the measurement terminals to mitigate burst noise. In conjunction, two pressure transducers are utilized to measure ambient static pressure within the enclosure (SSCSANN015PAAA5; Honeywell, Wabash, IN) and on the high-pressure cell (PX3AN2BS100PAAAX; Honeywell). To drive the LED, an astable 50% duty cycle timer circuit (NE555P; Texas Instruments) was used. A potentiometer (P2) was included on the circuit to enable the LED modulation frequency to be varied about 3.4 kHz. Photodiode output is amplified by 40 dB through a non-inverting OP-AMP (AD8031; Analog Devices, Norwood, MA) band pass filter.
The cRio utilized three separate data acquisition modules for system instrumentation and a 32-GB SDHC memory card (Extreme; SanDisk, Milpitas, CA) for data logging. An NI 9401 digital I/O module (National Instruments) was incorporated for future digital actuation. An NI 9201 analog input module (National Instruments) was used to obtain signals from pressure transducers, thermistors, and system voltages; sampling at a rate of 1 kHz, with a 1-s average and standard deviation recorded. A dedicated high sample rate analog input module, NI 9215 (National Instruments) was used to collect the amplified photodiode signal at a rate of 100 kHz; where an FFT amplitude spectrum was processed every 65,536 samples and saved.
NASA HASP Flight
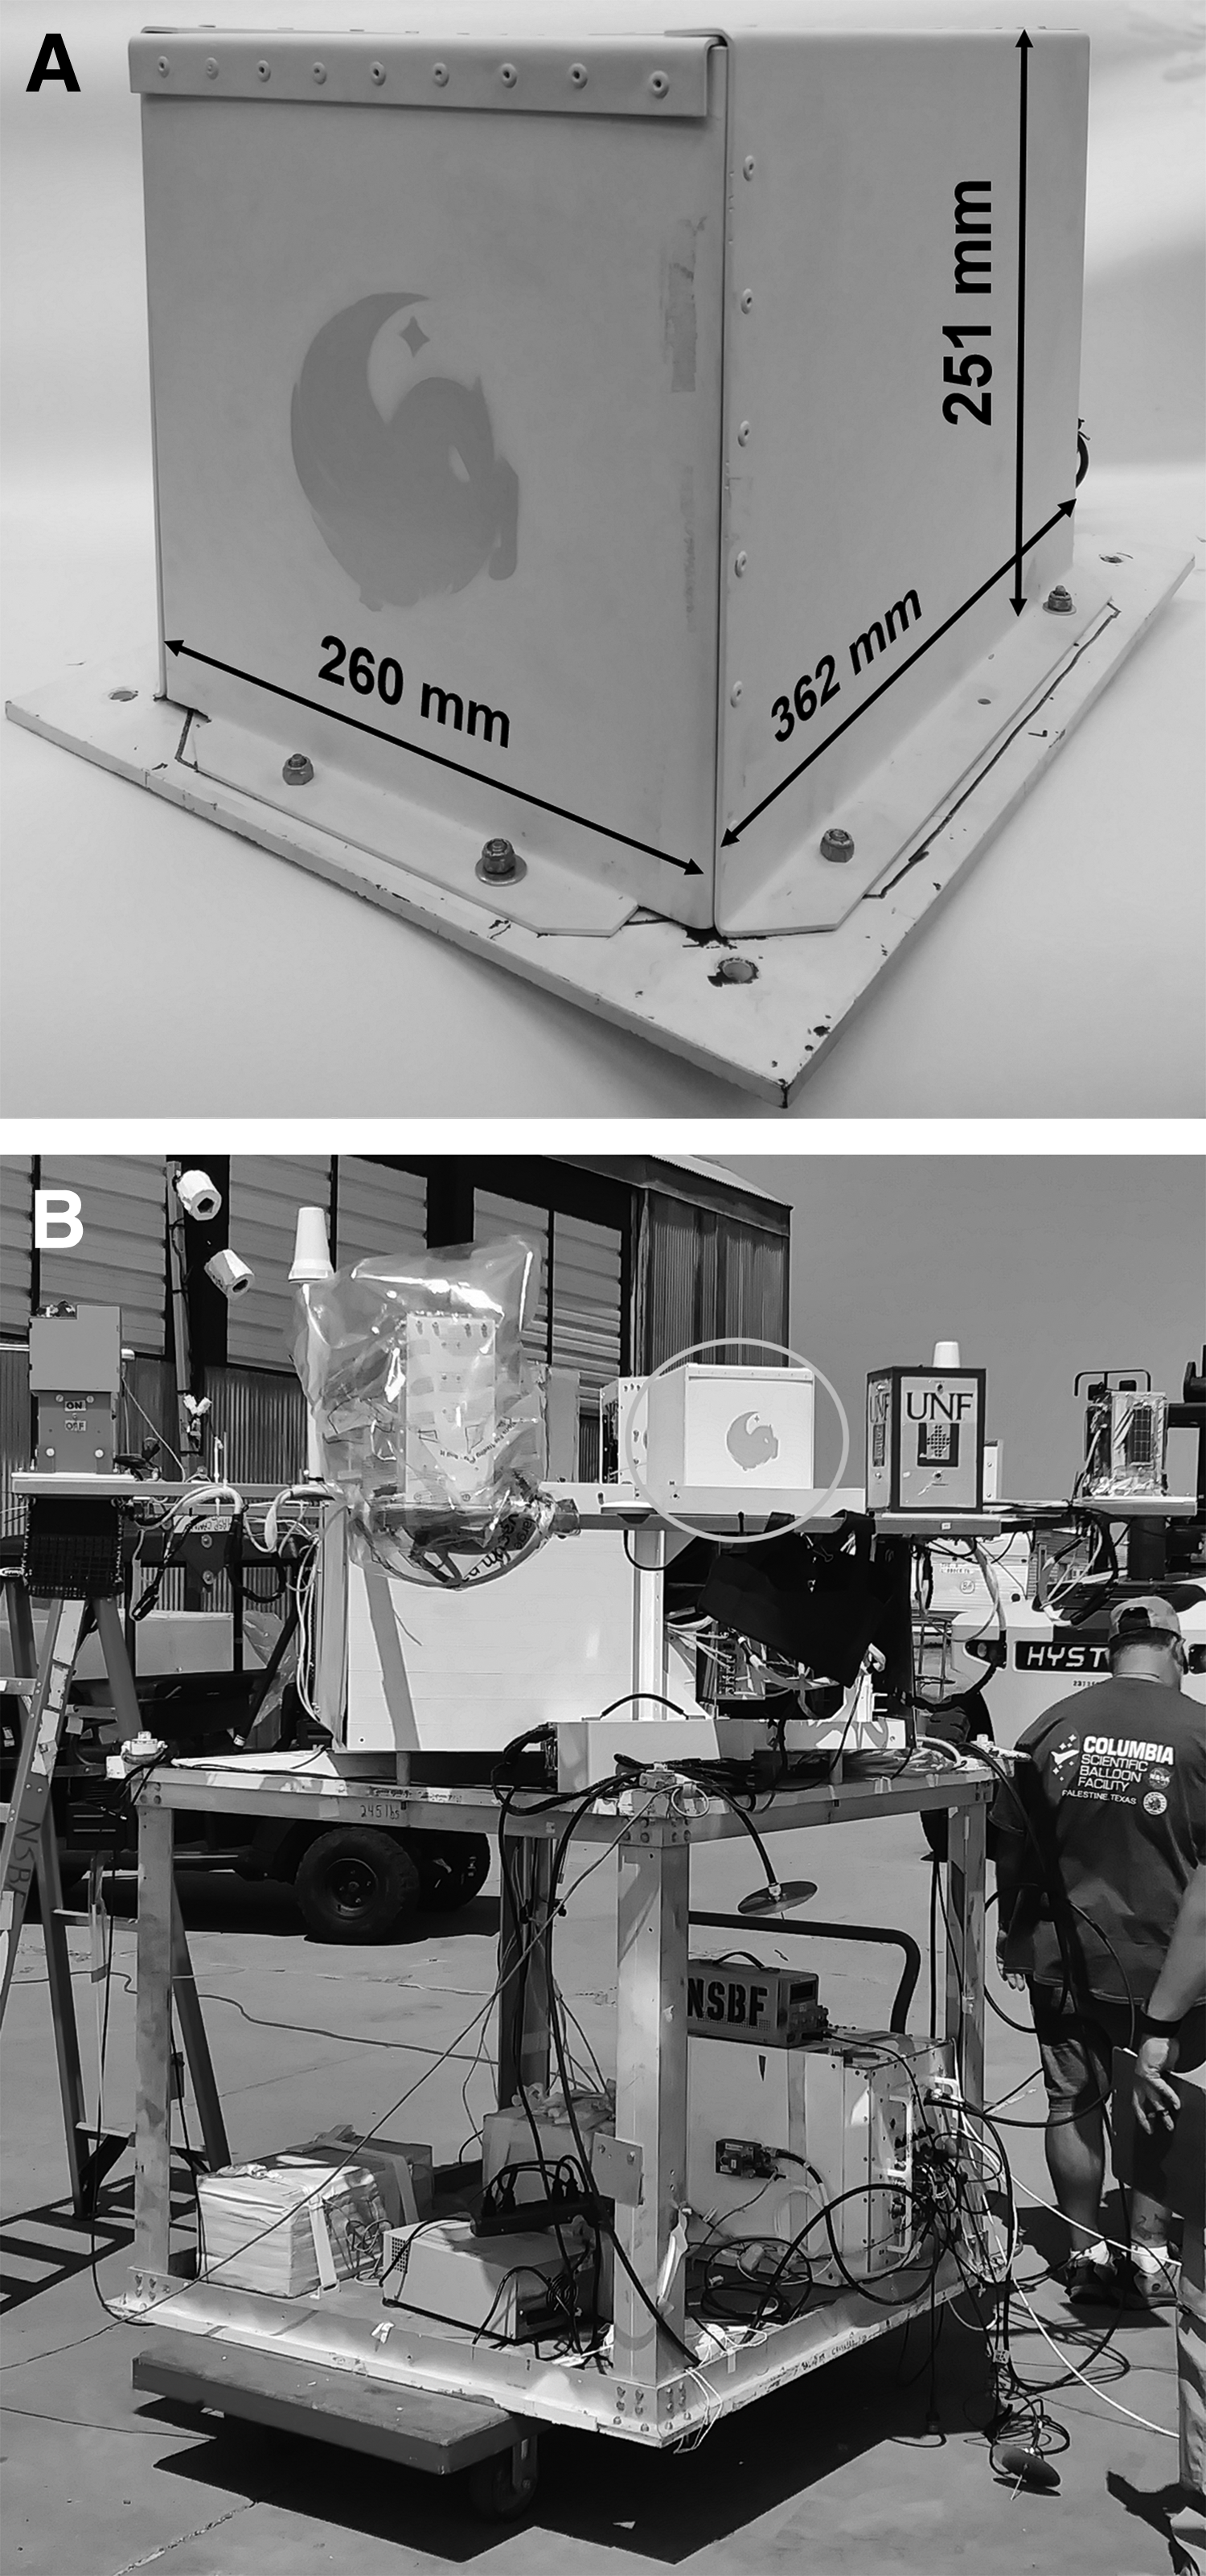
Testing of this sensor was performed on the NASA Sponsored HASP balloon flight occurring on September 4th, 2017. For this flight, the sensor was placed inside its acrylic enclosure and sealed with ambient air from Ft. Sumner NM. The acrylic interior structure that sealed the sensor was designed in such a way that air would slowly be allowed to escape. This slow venting was intentional by nature to examine the performance of the sensor being evaluated in a low partial pressure environment. This enclosure was then secured to the HASP platform by using a Sheetmetal retention system shown in Figure 6.
Launch at 14:04:25 UTC at the NASA Ft. Sumner NM facility (104.242232° W, 34.473162° N), and this launch time coincides with t = 0. The flight profile is shown in Figure 7A. Float was achieved at 138 min into the flight and lasted a duration of 638 min.
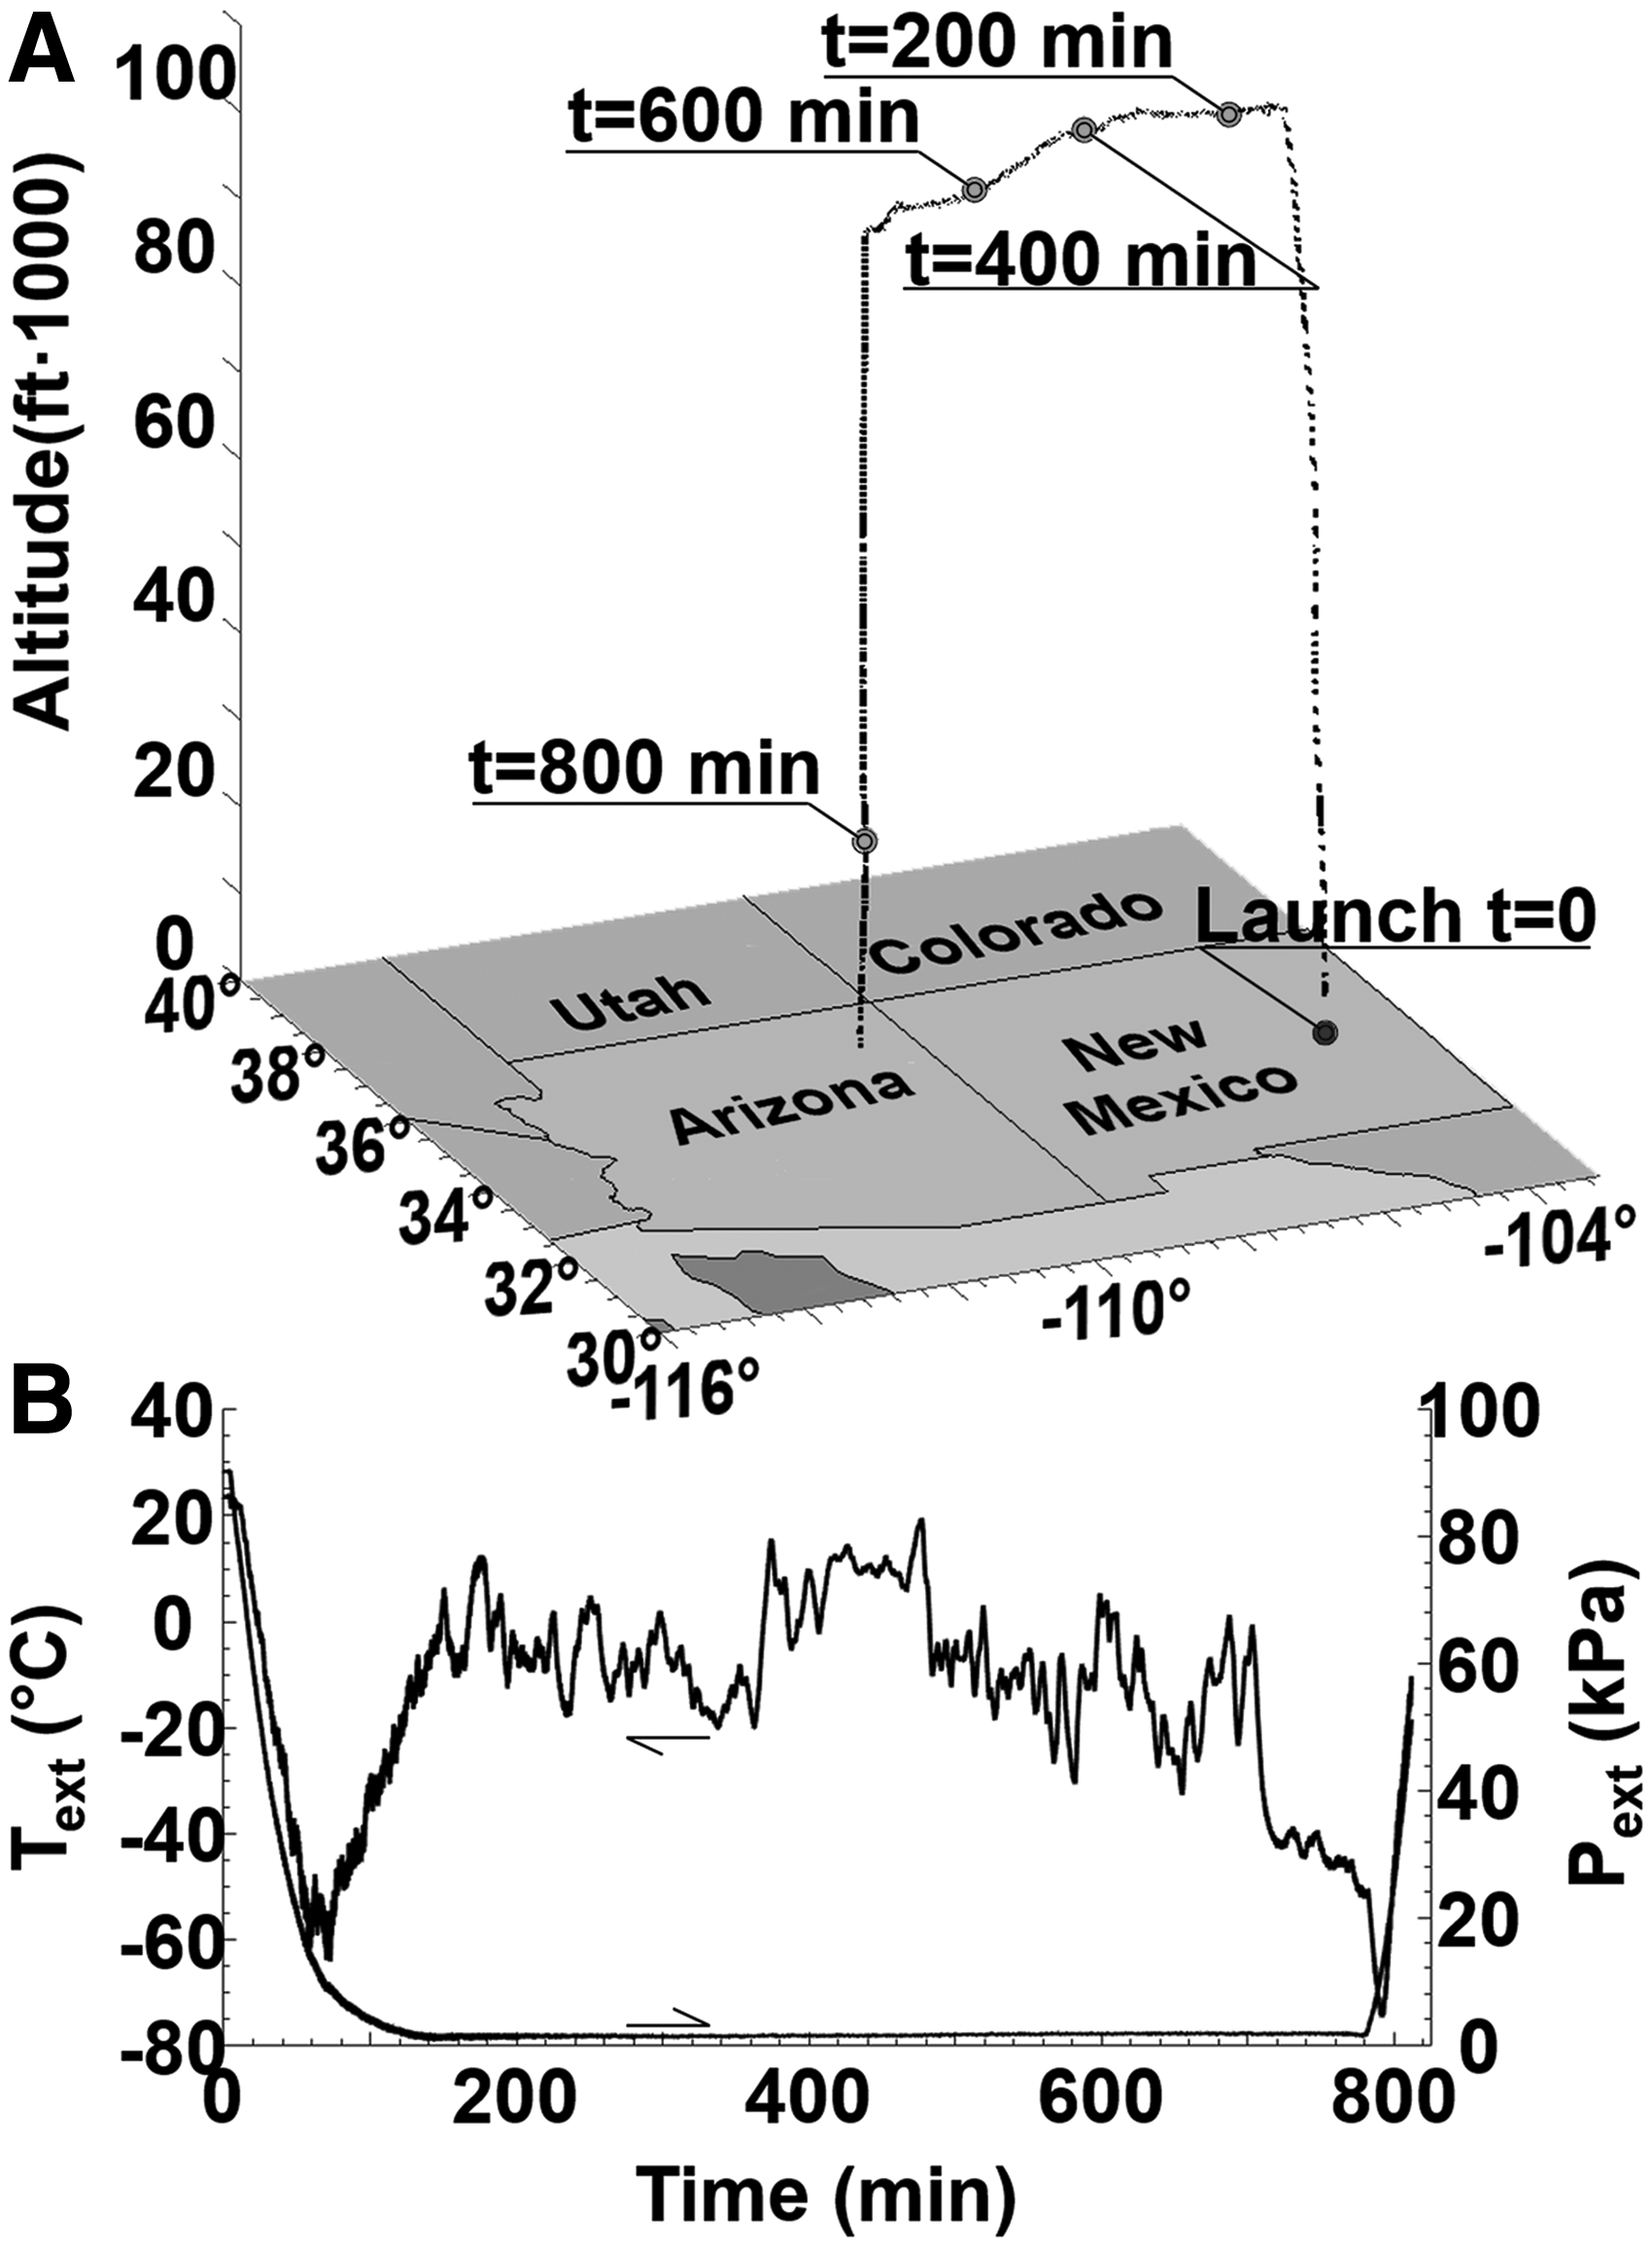
During the flight, the recorded ambient pressures and temperatures (Fig. 7B) ranged between: 1.6 kPa and 90.3 kPa, and between −64.3°C and 23.2°C, respectively. A maximum altitude of 109,412′ was achieved with the nominal float altitude of 105,000′. At ∼776 min into the flight, float was terminated with impact recorded 820 min after launch just North of the Apache-Sitgreaves National Forest in Arizona (34.5981°, −110.5613°). Complementary data to what was recorded by the cRio were provided from the HASP program. The purpose of this test was to establish a noise floor of CO2 measurements and to analyze signal drift under real world conditions.
Results From Flight Test
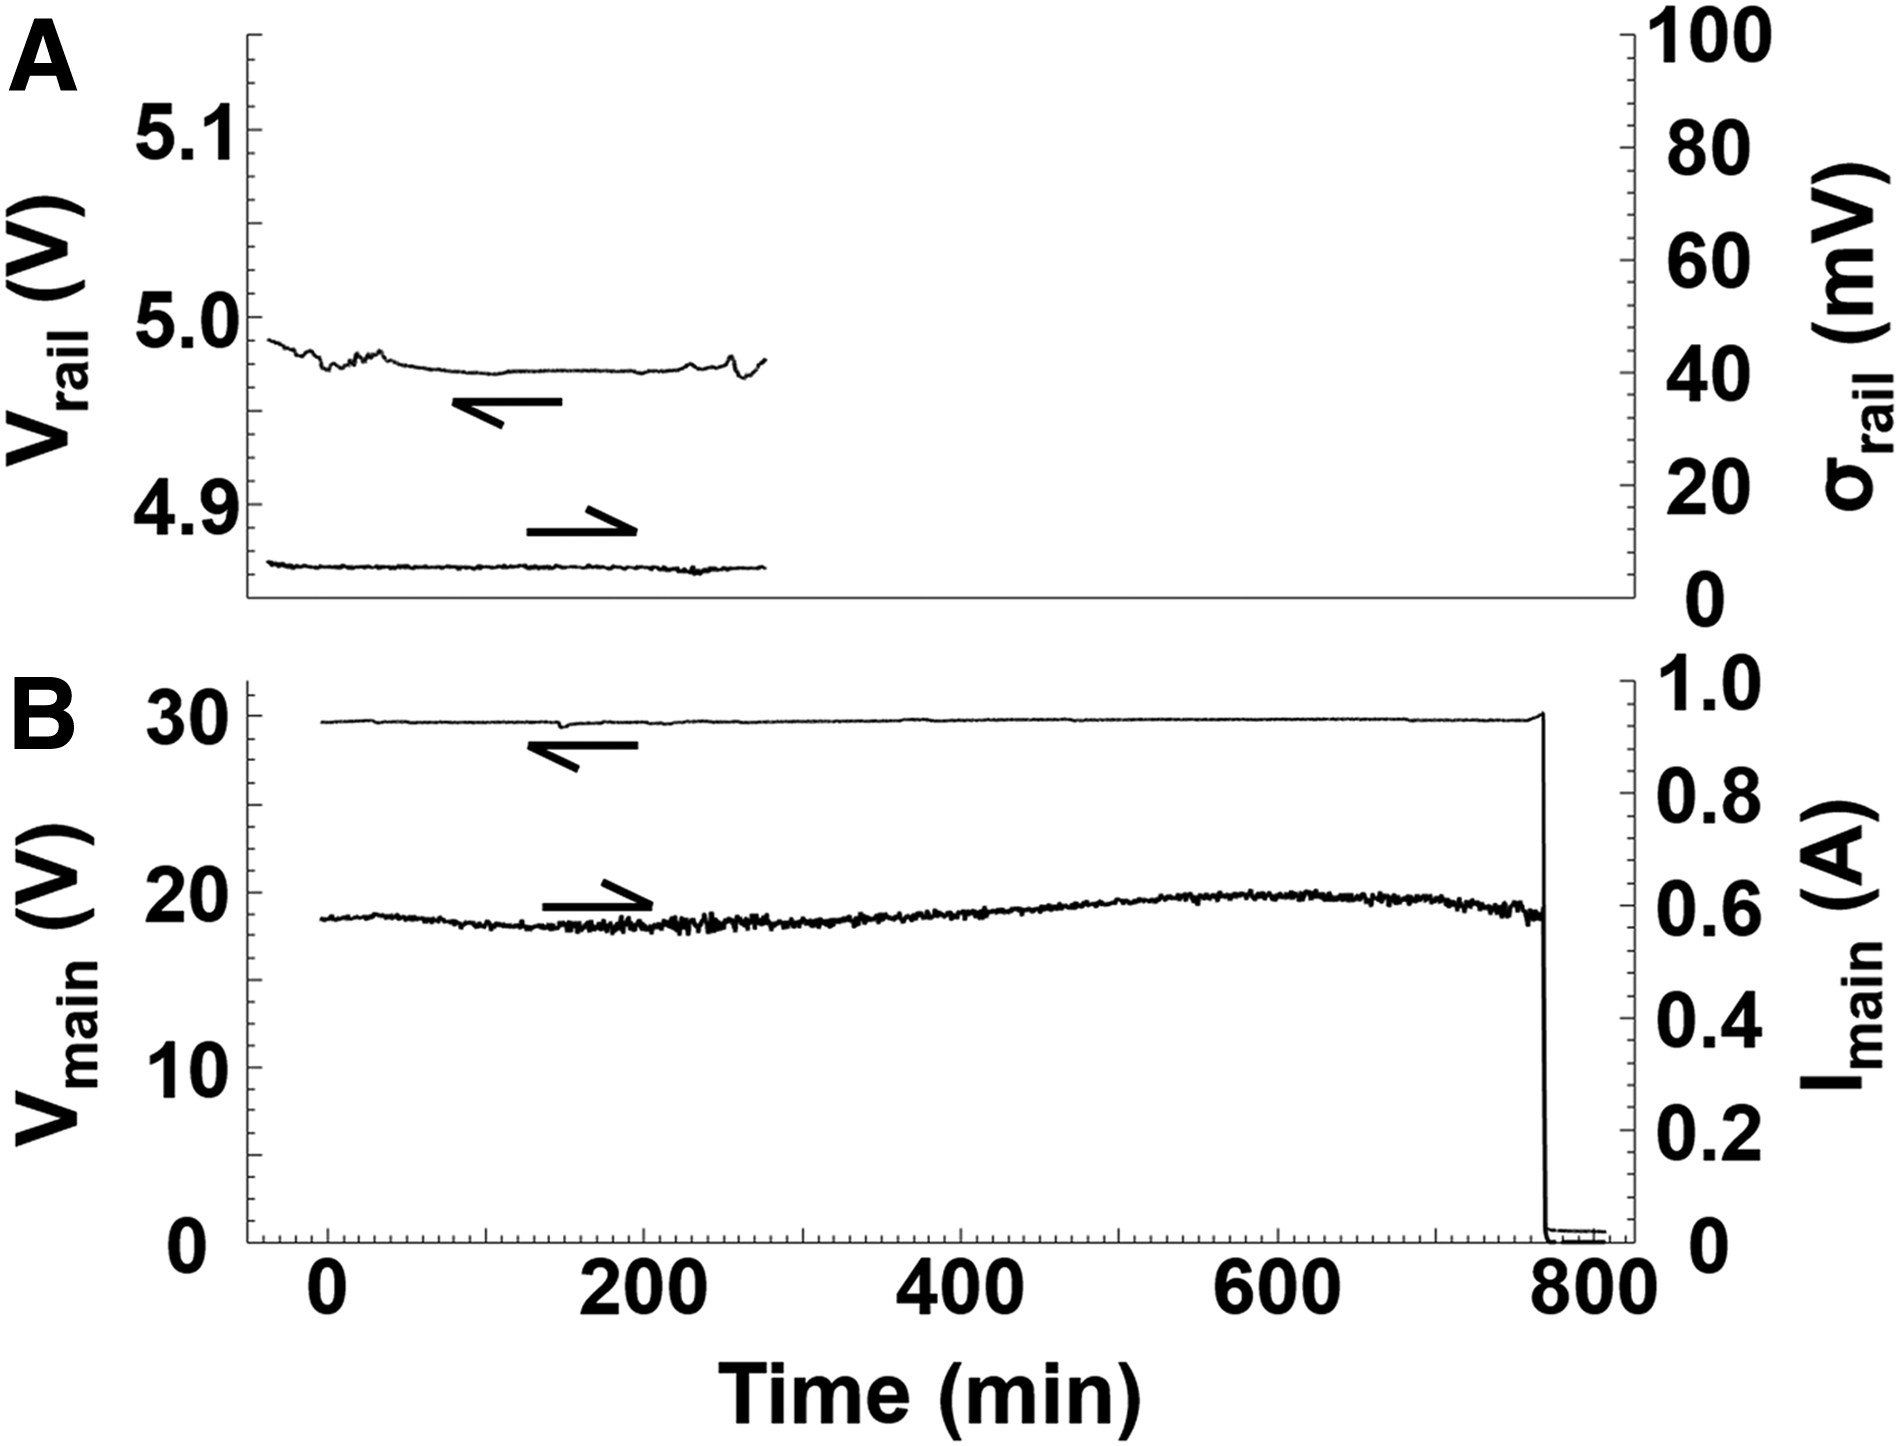
From Figure 8A, which shows the voltage and current characteristics of the sensor's state variable circuit and the main power input in Figure 8B, the sensor was powered on ∼34 min before launch and successfully logged data files up to 277 min into the flight. Only data after launch were provided by HASP. Data files recorded to the onboard SD card beyond 277 min into the flight were corrupted and irrecoverable. During the duration of the flight, the nominal voltage observed on the state variable rail (Fig. 8A) was within 4.95 and 5 V, with standard deviation on the order of 15 mV during the flight duration. During the flight, the nominal power draw calculated from the minimum voltage and current traces (Fig. 8B) of the sensor and all supporting hardware was 17 W. The cRio was the largest power draw of the sensor's sub systems, drawing an average of 10.6 W.
Signals from the photodiode after amplification A are presented in Figure 9A, which presents a time history of the spectra recorded from the photodiode. Within the figure the amplitude corresponding to frequency changes in time dramatically during the first 25 min of the flight, then changes minimally thereafter. From Figure 9A, it can also be seen that the maximum intensity recorded at any given time is changing even while the composition of the gas within the enclosure is fixed. Aside from the maximum intensity plot, significantly lower intensity peaks are also present. These spurious peaks are a result of aliasing of higher frequency signals collected from the square-wave modulation of the source LED. 25
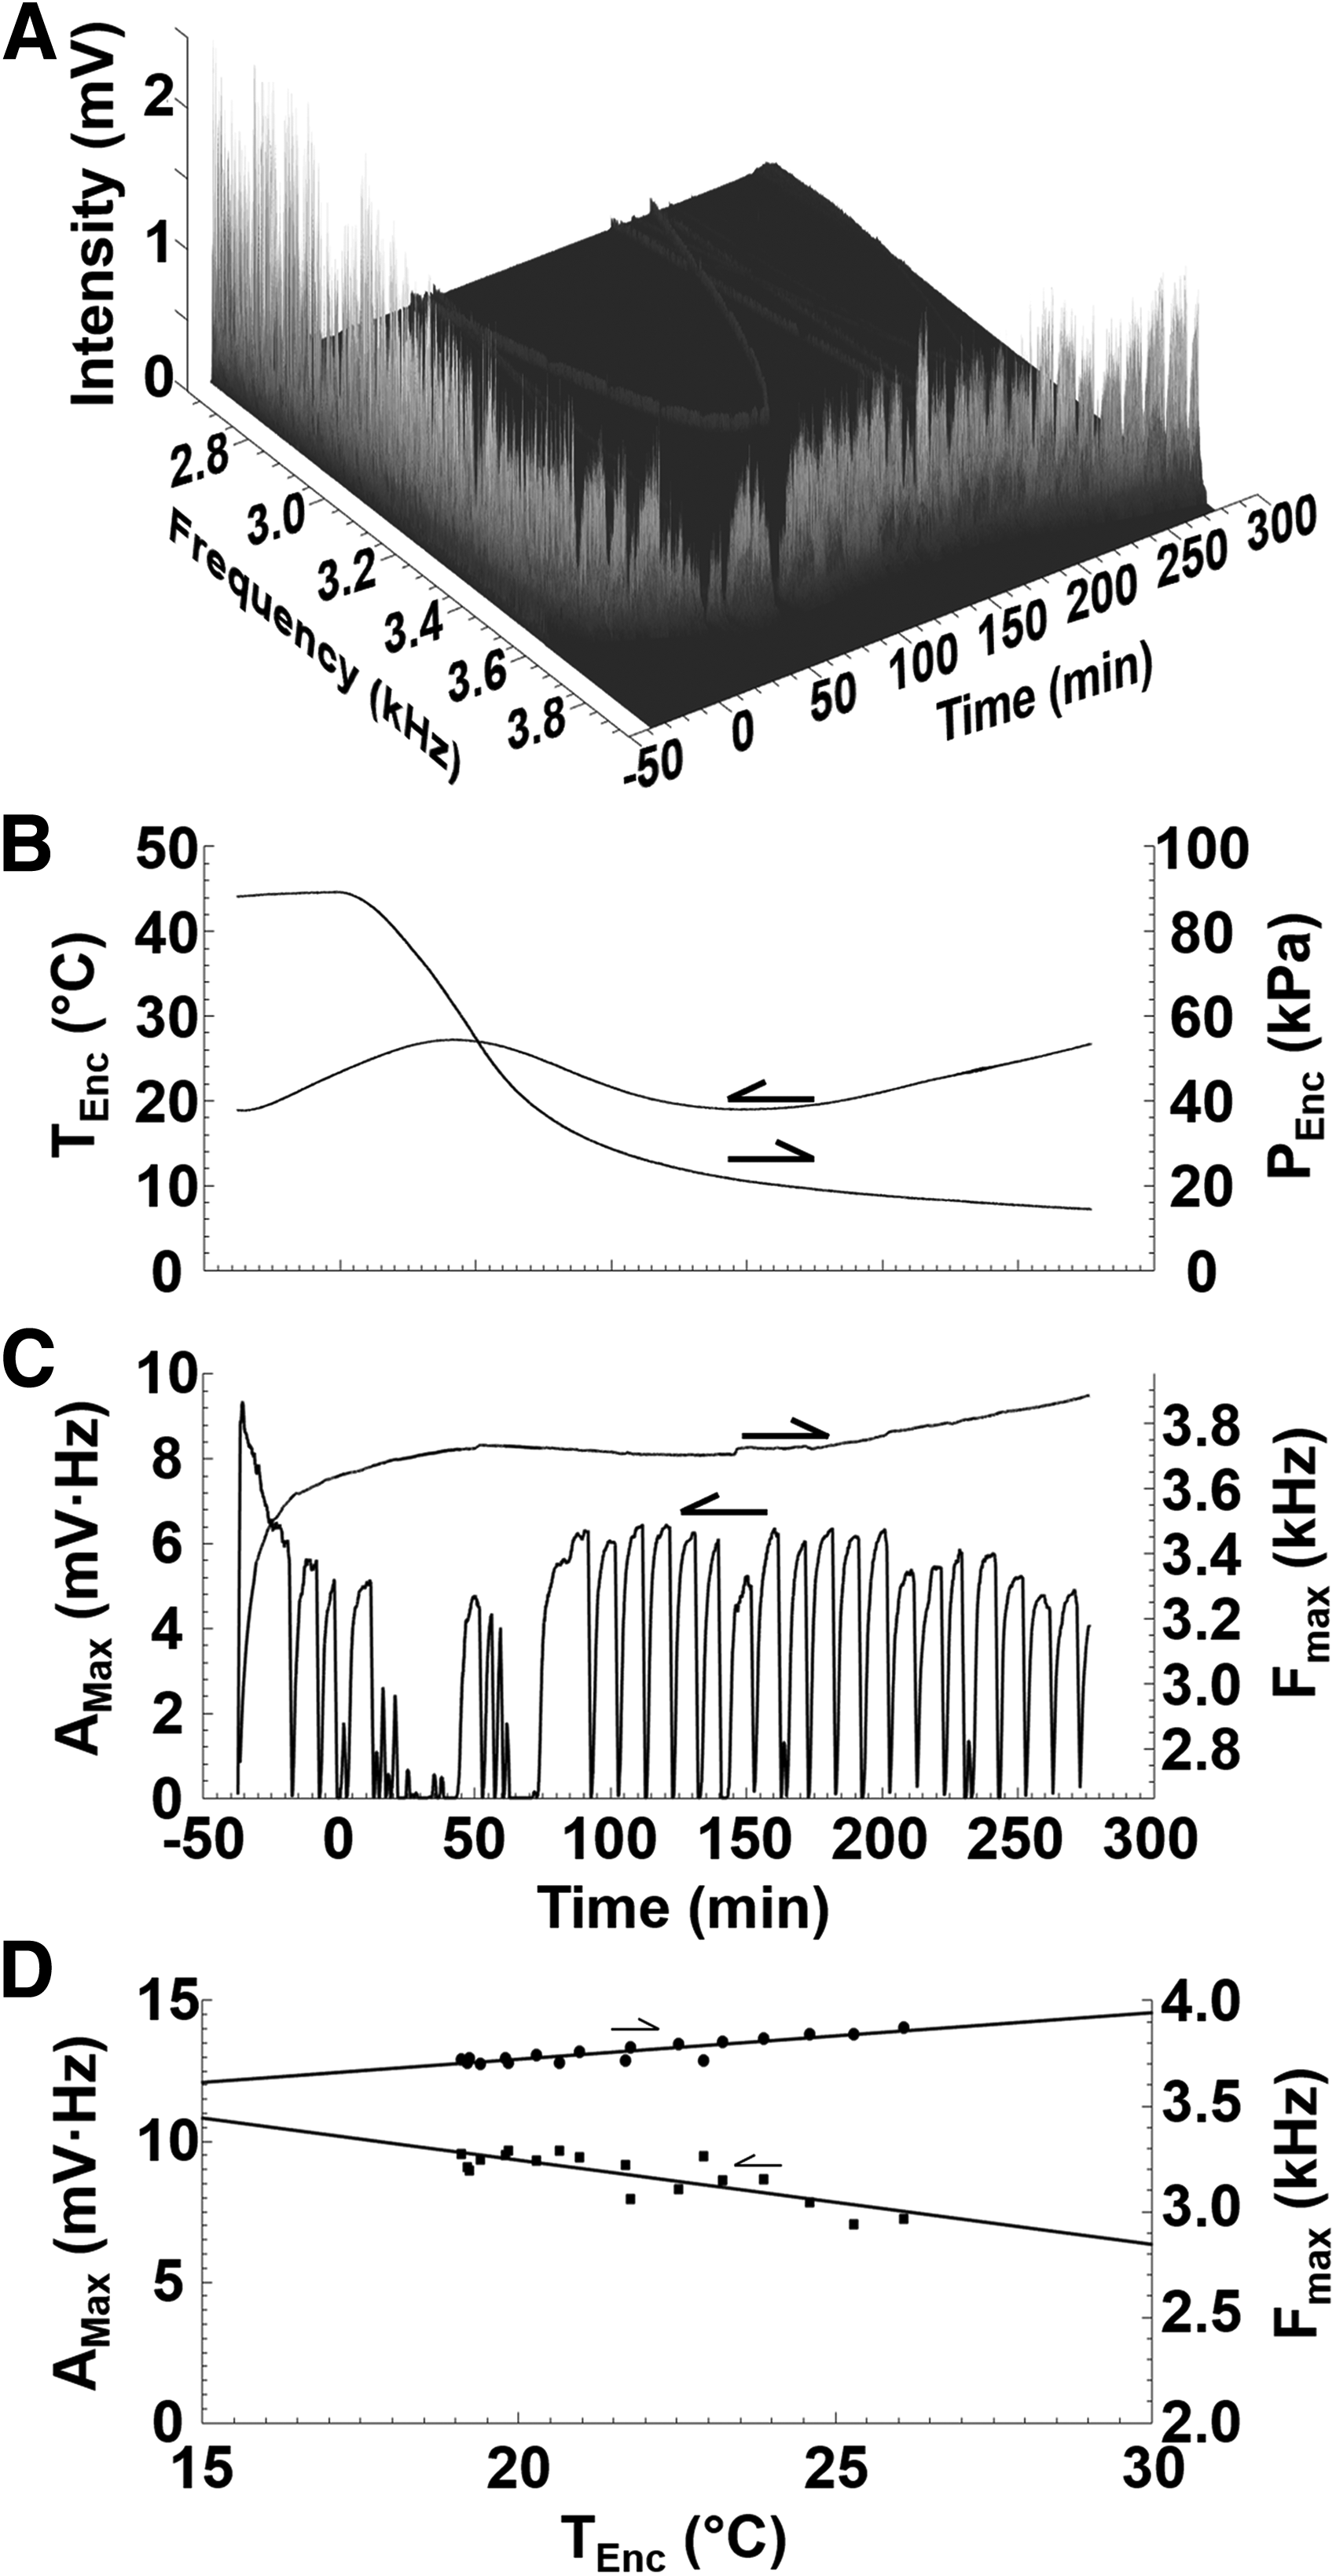
Temperature and pressure profiles observed within the sensor enclosure are presented in Figure 9B. During the duration of the recorded data, the temperature observed within the enclosure, Tenc ranged between 18.9°C and 27.2°C. Correspondingly, the pressure within the enclosure varied between 89.2 kPa and 14.4 kPa. Over this range of pressures and temperatures, the changes of
Raw data from the photodiode presented in Figure 9A are simplified and presented in the two traces of Figure 9C. The locus of frequency, Fmax, corresponds to the maximum recorded amplitude at any point in time and is the instantaneous LED modulation frequency. During the test flight, Fmax ranged between 2.76 and 3.89 kHz. Changes in modulation frequency are the largest on startup, when during this period transient effects are predominant. The additional trace presented within Figure 9C shows Amax, the integral quantity of the collected signal along the frequency axis at fixed time steps, Fmax ± 7.6 Hz. Such integration is necessary due to binning errors encountered by the cRIO and spillover effects of operating the modulation circuits in a constant current mode as it may be assumed that over a single sampling period there is an inherent drift of signal. From Figure 9B and C, it may be seen that there is a strong correlation of Tenc with the observed maximum frequency Fmax and the envelope of Amax. Over a range of temperatures observed within this test flight, linear curve fits have been ascertained that characterize the modulation frequency and temperature-dependent CO2 signal during the flight; these are presented in Equations (4) and (5), respectively. A plot of these linear curve fits and the observed maximum signal intensities may be seen in Figure 9D.
Summary and Future Work
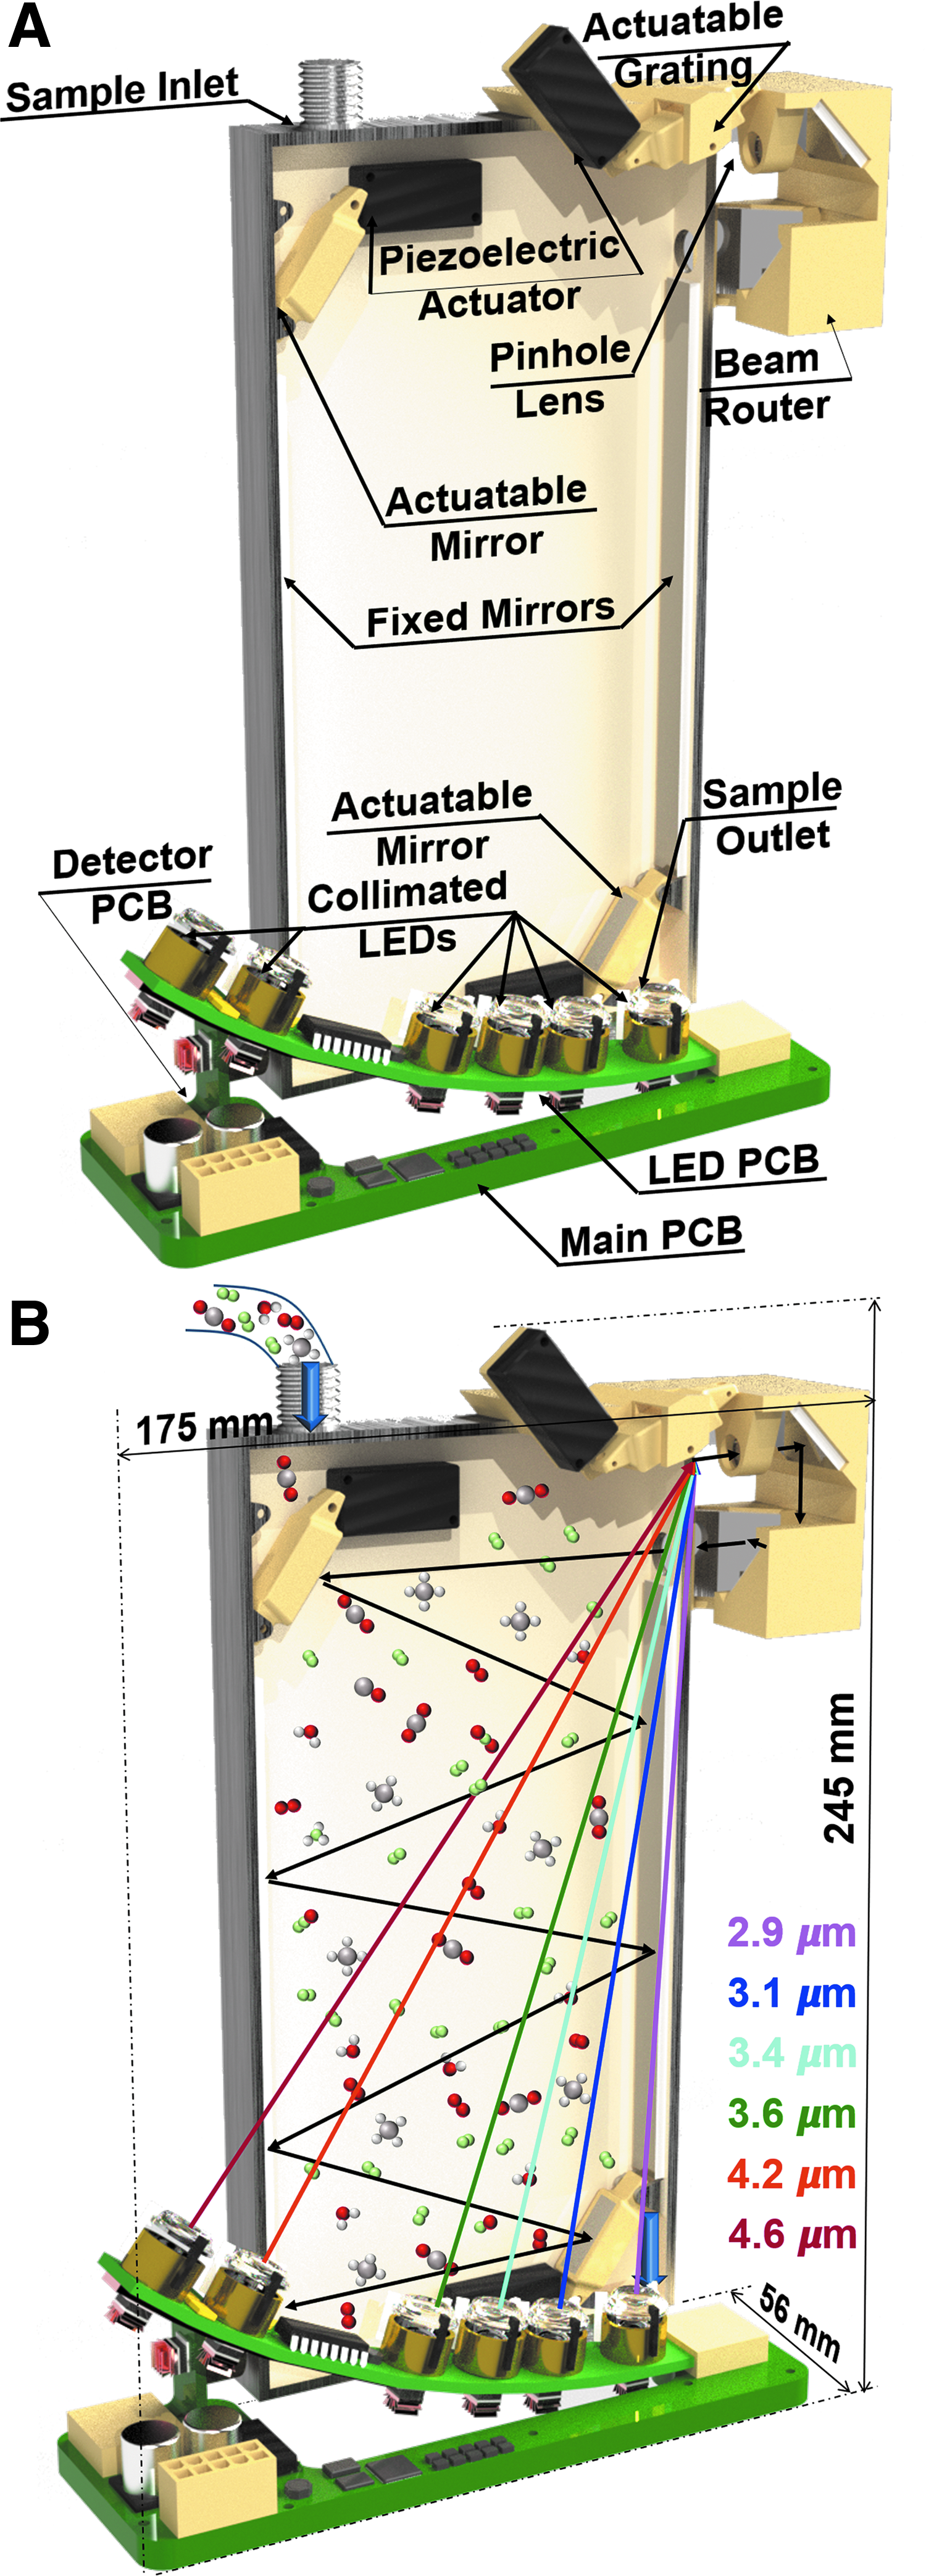
A sensor was developed and tested on a high-altitude balloon flight to measure CO2 composition, as a proof-of-concept demonstration for use of such a sensor to detect hazardous gasses on spacecraft. An autonomous test was conducted on the high-altitude balloon flight where amplitude modulation was used to reveal the CO2 concentration, whereas frequency modulation was used to reveal temperature within the enclosure. Using ambient air within the sensor as a test gas, a linear curve fit for temperature and CO2 signal intensity was found with respect to temperature. As this sensor validated its proof of concept, a more practical sensor is shown here in Figure 10; which enables multiple LEDs to be directed at a common detector path by using a variable position grating and multipass absorption cell.
Footnotes
Acknowledgments
Research at the University of Central Florida (UCF) was supported by financial assistance from the Federal Aviation Administration Center of Excellence for Commercial Space Transportation (FAA COE-CST) with Ken Davidian as program manager, Florida Space Institute (FSI), NASA Florida Space Grant Consortium (FSGC), the UCF Mechanical and Aerospace Department, and the UCF Office of Research and Commercialization. Z.L. thanks NSF GRFP for partially supporting this effort. The authors would like to thank Dr. Robert Peale (UCF) for assistance with environmental chamber tests. This material is based on work supported by the U.S. Department of Energy, Office of Science, Office of Energy Efficiency and Renewable Energy, Vehicle Technology Office, program managers Gurpreet Singh and Ken Howden, under contract number DE-AC05-00OR22725. Notice: This article has been authored by UT-Battelle, LLC, under Contract No. DE-AC0500OR22725 with the U.S. Department of Energy. The United States Government retains and the publisher, by accepting the article for publication, acknowledges that the United States Government retains a non-exclusive, paid-up, irrevocable, world-wide license to publish or reproduce the published form of this article, or allow others to do so, for the United States Government purposes. The Department of Energy will provide public access to these results of federally sponsored research in accordance with the DOE Public Access Plan (![]() ).
).
Author Disclosure Statement
No competing financial interests exist.