
Abstract
The key to human expansion into space and space development, in general, is developing space activities that deliver value in an economic sense. In other words, the key to space development is making money in space, that is, profit. However, the search for money making space activities has proven elusive. We present a business case for a commercial company to mine lunar ice and process the ice into rocket propellant. We discuss the existing and future markets for propellant and an architecture for mining and processing propellant and the associated costs. We then examine 3 scenarios, 1 commercial stand-alone and 2 involving a public/private partnership (PPP) model with NASA. We provide a comparison with other similar analyses. Business returns are positive for all 3 scenarios, although the PPP models provide increased returns and share risk with the government. Once established, lunar-sourced propellant will dramatically reduce the cost of all beyond low Earth orbit space activities and potentially enable other profitable commercial ventures to emerge.
Introduction
Persistent and sustainable space development, to include permanent human presence in space, will not occur until the main driver of this development is economics. This premise is supported by the history of space exploration and development. To date, the primary motive of space exploration has been geopolitics, nations striving for military advantage or prestige via space activities. There have been a few sectors within the space industry that have been motivated by economic reasons, most notably, the communication satellite industry, but this is a small fraction of all space activities.
The relatively small footprint of commercial, economically driven space activities is not due to a lack of interest or effort. Many aspiring commercial space companies have come and gone. It is due to the simple fact that is difficult to make money in space other than by supporting a government-funded, geopolitically motivated activity.
There are several reasons why it has proven difficult for purely commercial space ventures to succeed. All are related to fundamental principles of economics. For a company to be successful, it must generate a profit. Profit is a measure of the value added by the activities of the company. For a company to make a profit, its revenues must exceed its costs. Revenues come from customers willing to buy the space-related product or service. The ultimate customers are consumers, almost all of whom reside on Earth. Hence, the first challenge faced by a commercial space company is how to deliver value to consumers on Earth. The second challenge is cost. Due to a number of factors, the cost of space activities is exorbitant. These factors include the deep gravity well of Earth, vast distances between locations of interest in space, and harsh environments.
These harsh realities have been prevalent in the emerging field of Space Resources. The credibility of finding economically viable uses of space resources suffered with the demise of the first asteroid mining companies, Planetary Resources and Deep Space Industries. These companies were originally formed to pursue metallic asteroids for precious metals. They both realized too late that water from asteroids or the Moon represented a more likely path to viability. The shift toward water as the first economically viable use of space resources has been accelerated by the scientific discoveries of water at the poles of the Moon. It is now widely recognized around the world that lunar and asteroid water represents a significant business opportunity. For example, the Luxembourg Space Agency commissioned a study indicating potential revenues from Space Resources of 73–170B€ in the period 2018 to 2045—beginning with lunar water. 1
In this article, I explore the business case for developing the water ice resources on the Moon to produce rocket propellant. If a viable business can be made to produce propellant from lunar ice, the availability of space-sourced propellant will dramatically lower the costs of all space activities beyond low Earth orbit (LEO). This will lower barriers of entry for every other potential space business, enabling the creation of a vibrant space economy.
To be economically viable, the lunar propellant production operation must generate economic value, measured by profit. In principle, making a profit is quite easy. As stated above, it is the simple condition that revenues exceed costs. Below, I present an analysis of the revenues and costs incurred by a hypothetical company producing propellant on the Moon. This company is referred to as “the Production Company” or “the company” for short. The company is implementing a version of the technique called Thermal Mining.2,3
I first examine the revenue side of the profit equation. Revenue comes from customers agreeing to purchase propellant at a specific location for a specific price. In the mind of the customer, the value of the propellant at that location must exceed the price paid. In the Propellant Markets section, I survey markets for propellant in space, potential customers, and the rationale for prices at different locations in space.
The Propellant Production Architecture section briefly describes the Thermal Mining architecture as the basis of the cost model described in the Cost Model section. The third element in determining profitability is the time line for expenditures and revenues. Because of the cost of money and the time value of money, cash now is more valuable than cash in the future. These considerations are addressed via a set of business case scenarios discussed in the Business Case Scenarios section. The Results section examines several figures of merit that capture the relative profitability of the company as well as the potential benefits accruing to NASA or other government entities through a public/private partnership (PPP). Comparison with the Previous Studies section provides a comparison of this analysis to other published analyses of the cost of lunar propellant. Finally, the Conclusions section contains my conclusions.
Propellant Markets
The Physics and Economics of Refueling
The cost of most space activities is dominated by transportation cost. The energy to escape Earth's gravity well is enormous, and the distances between interesting or valuable destinations in space are vast. For the 60 years since the first human mission into space, all space missions have originated on Earth with all propellants brought from Earth. This situation gives rise to what is known as the tyranny of the rocket equation. The rocket equation is taught to every science or engineering freshman and is simply written as follows:
If you solve the rocket equation for propellant mass in terms of
However, if you can refuel enroute, and reuse the propulsion system through multiple refuelings, you can break the tyranny of the rocket equation. The exponential increase of propellant with
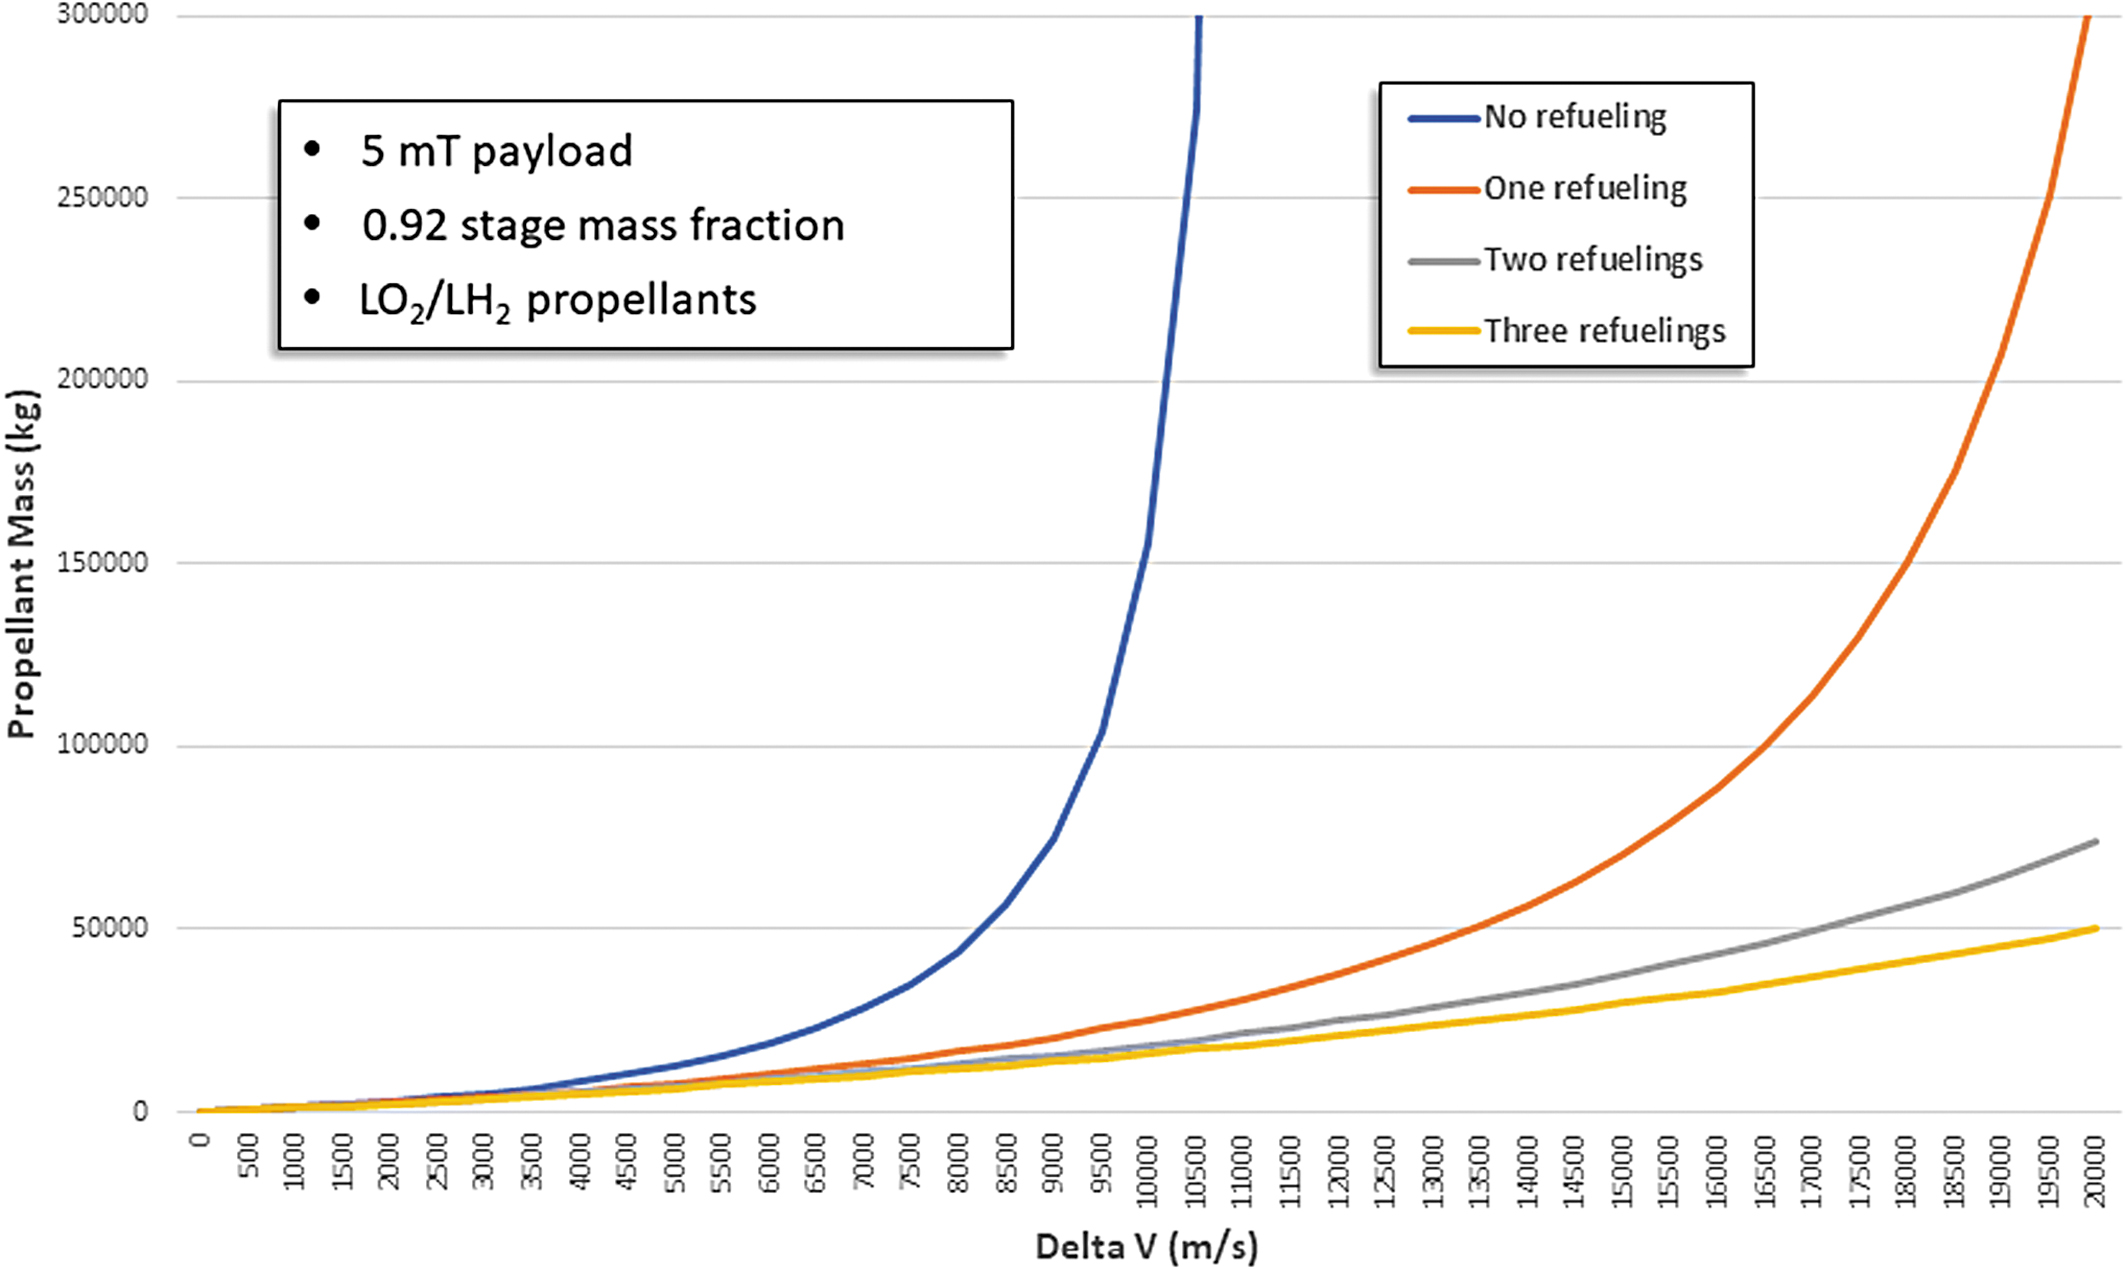
Benefits of refueling with space-sourced LO2/LH2 propellants.
Given that the Moon is a viable source of water (see the Propellant Production Architecture section) and thus LO2/LH2 propellant, it is uniquely situated to enable space activities in Cislunar space and beyond. The Moon is the closest source of resources (mostly) outside Earth's gravity well. Escaping the Moon's gravity well is far easier than Earth's. As shown in Figure 2, the

Of course, a source of fuel is not valuable unless there is a refuelable space transportation architecture able to take advantage of it. Fortunately, there are several commercial companies working on refuelable upper stages and landers, including Blue Origin, Dynetics, SpaceX, and United Launch Alliance (ULA). As the Chief Scientist of ULA, I made a public offer to buy propellant in space to support ULA's future upper stage, being designed to be refuelable.4,5 I presented prices the ULA would be willing to pay at various locations within the Cislunar space.
These prices, depicted in Figure 3, reflect both the physics discussed above and the corresponding economics of propellant in Cislunar space. The blue bars represent the transportation cost of propellant (or any mass) launched from Earth. The green bars were set by the criterion that the price of lunar propellant in LEO be less than the price of propellant launched from Earth at the same location. The LEO price chosen was $3,000/kg, lower than the $4,000/kg to launch from Earth, projected for ULA's Vulcan rocket.4,5 If this condition is met, then ULA would be able to lower the cost to launch a payload from Earth to Geosynchronous orbit (GSO) by refueling enroute, a critical piece of ULA's current market.
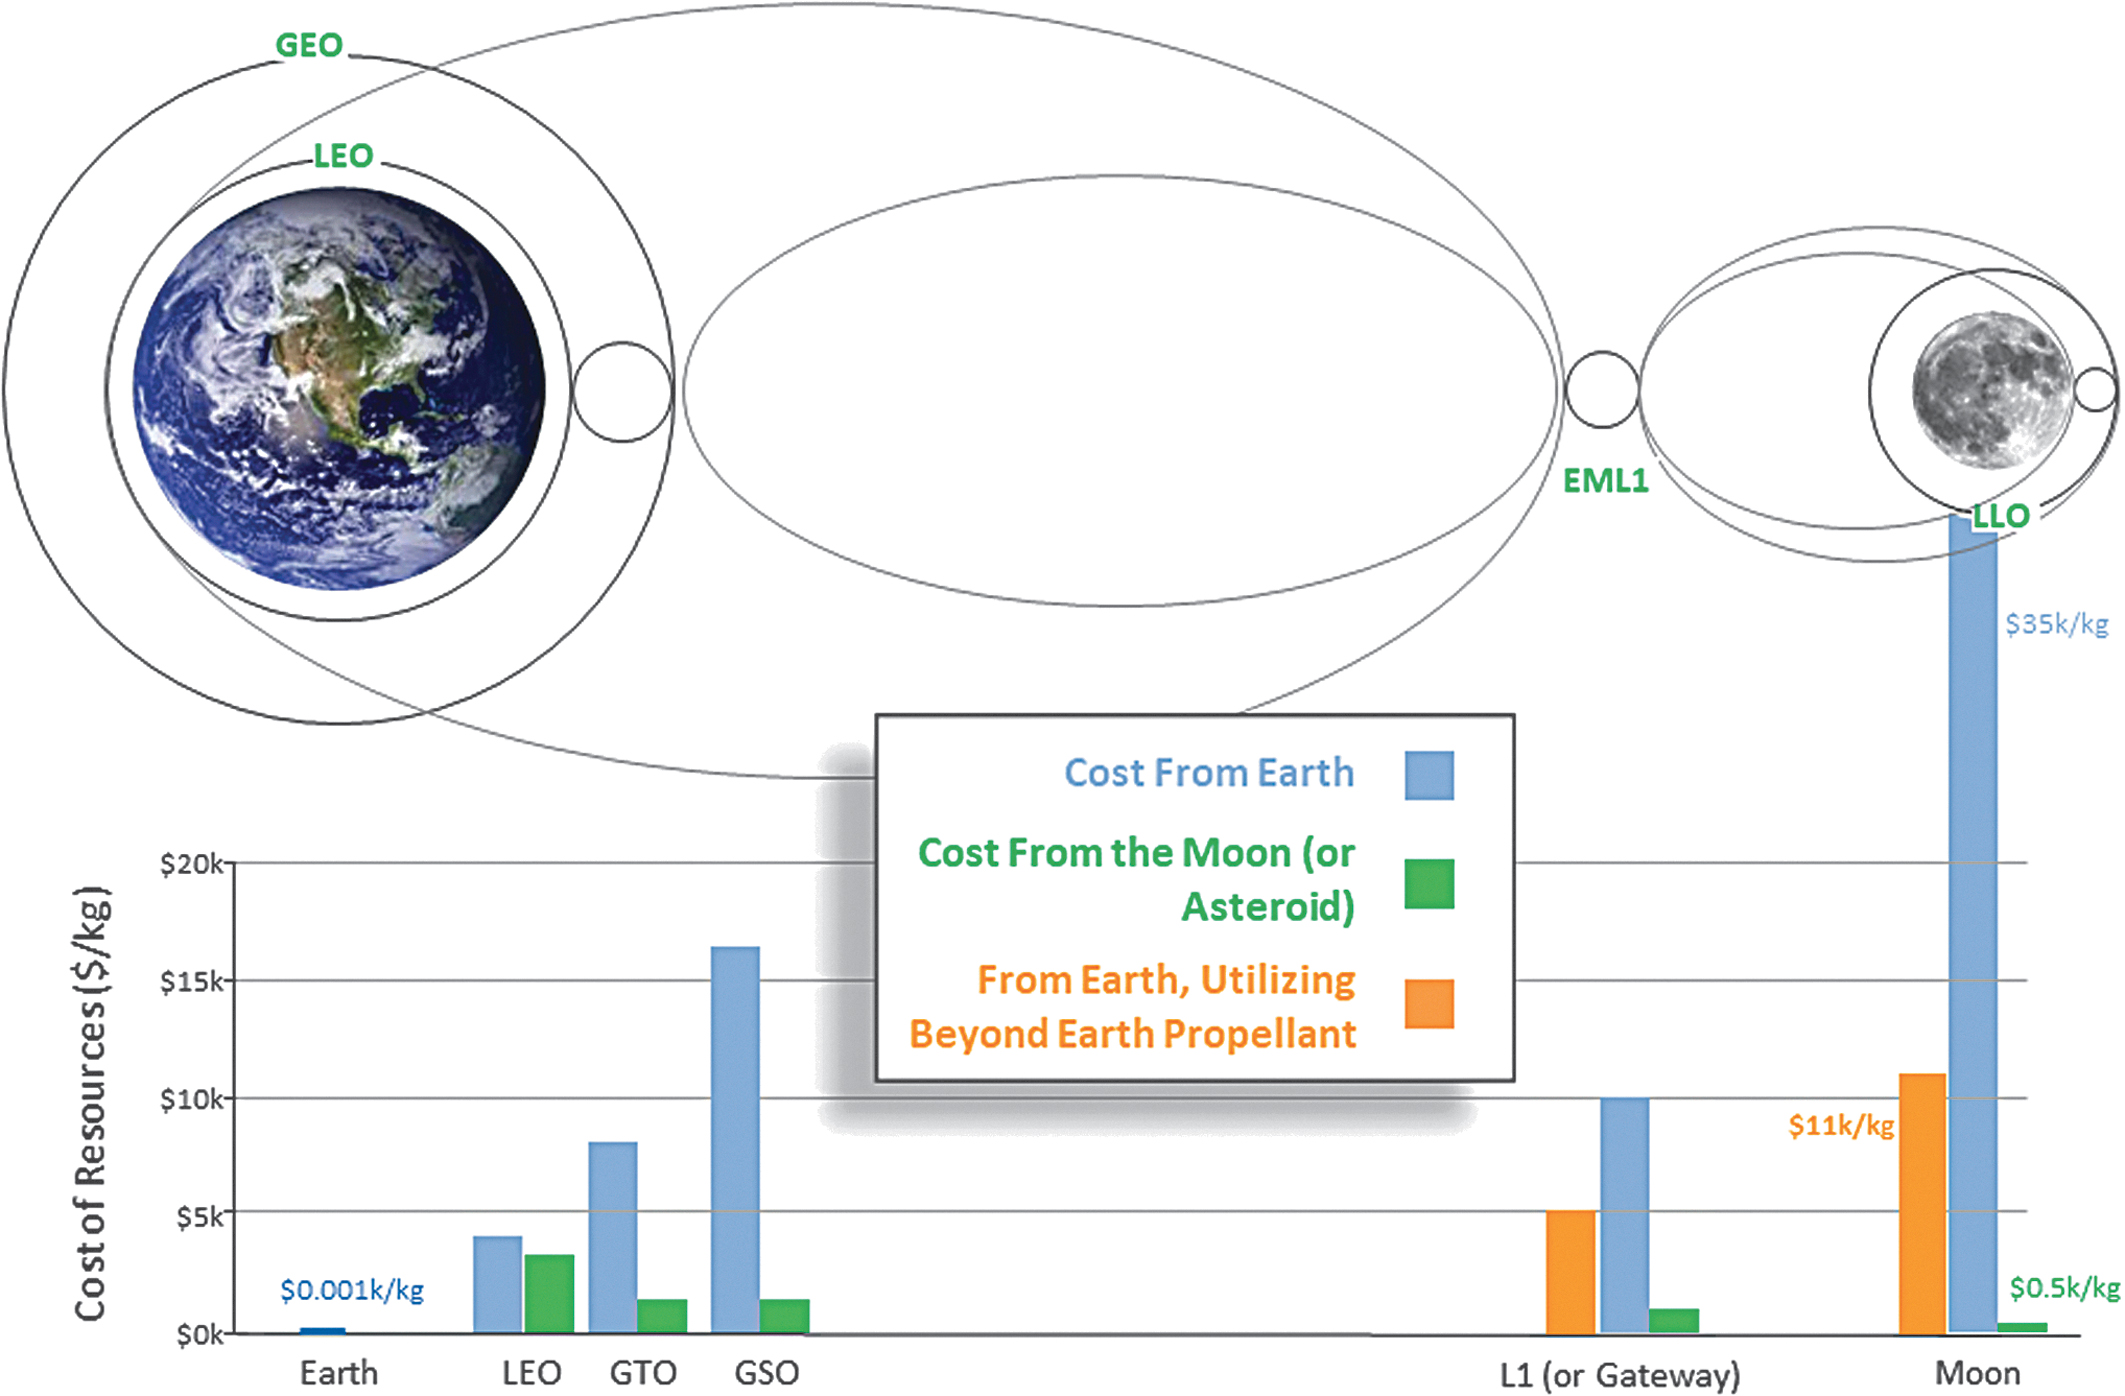
Propellant prices in Cislunar space.
The price of propellant on the lunar surface required to ensure meeting $3,000/kg in LEO is $500/kg. This depends on several assumptions regarding transport of the propellant from the Moon to LEO. First, the transportation utilizes ULA's advanced cryogenic evolved stage (ACES) upper stage and XEUS lunar lander. Second, all maneuvers are propulsive. The second assumption is very conservative given that aerobraking using Earth's atmosphere to decelerate to LEO could reduce the cost by a factor of 2. The other key location for pricing is EML1. This location is a good proxy for any location in high Earth or lunar orbit such as the orbit of NASA's proposed Lunar Gateway station. From the Earth, this price is $10,000/kg. From the Moon, the price is $1,000/kg, a factor of 10 reduction. In the business case analysis below, the latter price has been increased to $1,100/kg to provide better profitability for the transportation company, assumed to be a separate entity from the Production Company.
Finally, the orange bars represent the price to move mass from Earth to EML1 or the lunar surface, if you refuel enroute a single time using propellant from the Moon. The use of lunar propellant will reduce the cost to move mass to the Gateway by a factor of 2 and reduce the cost to move mass to the lunar surface by a factor of 3. These 2 facts alone should convince policy makers to move forward with lunar propellant production as a top priority. Table 1 summarizes the cost/benefits of using lunar propellants. The bottom line is every space mission beyond LEO will benefit from the use of refueling with lunar propellant. Space missions can be accomplished by smaller and fewer numbers of launch vehicles, saving money across the board.
Benefits of Lunar-Sourced Propellants
Propellant Markets
Given that all space missions beyond LEO benefit from refueling with lunar propellant, determining markets becomes a matter of understanding what those missions are and who are the customers. This is an easy matter for today's missions and markets, and ULA's initial pricing was firmly grounded in this reality. Looking ahead, there are 2 categories of future market growth: future programs planned assuming current nonrefueling economics and future missions enabled by the profound cost reduction entailed by refueling. I address each category in turn.
The current and forecasted launch markets are compiled by the Federal Aviation Administration (FAA) Office of Commercial Space (AST). Missions that could benefit from refueling go to GSO or beyond. The GSO satellite location has been the anchor for the launch market for many decades. That market has been remarkably steady with 15–20 launches per year worldwide. The FAA's forecast for the next decade is for that market to remain steady around 15–20 launches per year. 6 The other class of current missions that would benefit from refueling is the NASA interplanetary science missions. Historically, these have occurred roughly twice per year. Hence, the total current market for refueling is in the range of 17–22 missions per year. The original ULA business model assumed 3 of these missions, refueled in LEO as the initial, foundational demand for propellant.
Beyond current markets, many government space agencies, nongovernmental entities, and commercial companies are planning for exploration, business, and other activities beyond LEO. All of these activities require transportation, and refueling with space-sourced propellant will dramatically lower the cost of that transportation. Recently, the focus of most of this energy has been the Moon and Cislunar space. The current U.S. space policy entails a “return of humans to the Moon for long-term exploration and utilization”. 7 The European Space Agency (ESA) is also focused on the Moon as is China. As the elements of the architectures that support these goals begin to be defined, refueling with lunar propellant can play a large role in lowering cost or expanding capability or both.
For example, NASA's current plans envision a Lunar Gateway in high lunar orbit. The Gateway is a space station, occupied periodically by humans, that serves as a way station for missions to the lunar surface. Early plans envision 4 commercial missions per year to the Gateway for logistics. The same mass could be delivered in 2 missions by refueling with lunar propellant. Even more dramatically, the cost of missions to and from the lunar surface could be reduced by factors of up to 70 using lunar propellant. To fully take advantage of this potential, it is imperative that the transportation architecture be developed with refueling in mind.
Finally, there are many space missions and activities that are probably not feasible or affordable without the use of refueling with space-sourced propellants. The list of these potential space missions is limited only by imagination, but 1 stands out. It has long been a goal of humankind to visit, and then colonize another planet. Mars is the closest and most amenable target and it is a stated policy goal of the United States to eventually land humans on Mars. There have been many proposed architectures for human missions to Mars, but most of them entail aggregating large masses of hardware and propellant in Cislunar space. One recent estimate 8 shows that 163 mT of hardware consisting of a habitats and landers, as well as 103 mT of propellant, is required in Cislunar space for a Mars mission spanning 26 months. Both hardware delivery and propellant are markets for lunar propellant.
Adjacent Markets
Although the first viable market for lunar volatiles is likely to be LO2/LH2 propellant, water has many uses in space. The architecture described in the Propellant Production Architecture section produces purified water in the steps before electrolysis. Water can be diverted at this stage to satisfy other markets. Water can be used as propellant directly for low-thrust applications such as steam propulsion systems for Earth orbiting satellites. It can be used in higher thrust applications as propellant for plasma thrusters. Once we have human presence at the Gateway or on the lunar surface, water will be needed for life support and even agriculture. Water can be used as radiation shielding for the Gateway or Mars missions. Split into hydrogen and oxygen, water can be used for energy storage. Water will be the foundation of the space economy.
In addition to water, the propellant production architecture will also produce an excess of oxygen. This is because the propellant is produced in the mass ratio of 5.5:1 oxygen to hydrogen and water comes in the mass ratio of 8:1. This means that for each metric ton of propellant produced, 450 kg of excess oxygen is produced. This oxygen can be sold as oxidizer to customers using a fuel other than hydrogen or used for breathing air or some other chemical process.
Finally, there are other volatiles present at the lunar poles that must be removed from the extracted ice by the purification system. 9 Many of these substances have potential exploration or economic value, including methane and ammonia. For this analysis, none of these ancillary products was assumed. They represent an upside to the business cases discussed below.
Propellant Production Architecture
Water is ubiquitous in the inner solar system. It exists on Mercury, the Moon, many asteroids, and Mars. Although many data sets indicate the presence of ice on the Moon,10–14 recent findings 15 indicate that water ice is present on the surface of the Moon within the permanently shadowed regions (PSRs) in concentrations of up to 30% by mass. The presence of rich ice deposits on Earth's nearest extraterrestrial neighbor is a potential game changer in the exploration and development of the solar system.
Extracting volatiles from cold solar system bodies will be challenging. Traditional excavation methods require heavy machinery capable of operating in extreme cold, vacuum, and dust exposure. Small bodies entail very low gravity. Excavation approaches will be costly to build, deploy, and maintain. However, direct heating of volatile bearing materials via Thermal Mining can save the cost and mass of excavation systems as well as eliminate most of the active components of the system, enhancing reliability and maintainability. I led a trade study in 2017 that indicated a mass saving of 65% can be achieved versus more traditional excavation methods.2,3
Thermal Mining of lunar ice exists at the front end of an in-space supply chain for vehicle propellant (liquid hydrogen and liquid oxygen), purified water for life support, oxygen for life support and manufacturing, and other commodities. The supply chain architecture has hardware components on the lunar surface, in Cislunar space, and on Earth. 16
A number of options exist for this broader architecture. For example, 1 could choose to extract ice on the Moon and transport the water to Cislunar space (e.g., EML1) for processing. Or 1 could process the water into propellant on the lunar surface. Although a detailed trade study has not yet been performed, I have selected the latter option here for several reasons. First, as shown above, water contains more oxygen than is required for propellant. Transporting water would increase the required mass lifted off the Moon by 45%, a significant added cost. Second, the ultracold temperatures of the lunar PSRs aid in the liquefaction and storage of cryogenic propellants. Finally, purely passive thermal control measures can reduce hydrogen boiloff of propellants stored in Cislunar space to under 10% per year. 17
The propellant processing system is located on the lunar surface and consists of several subsystems. The propellant production system architecture is shown in Figure 4. The Thermal Mining system is a subsystem of the production facility for oxygen, water, propellant, or other commodities derived from the extracted volatiles. The Thermal Mining system is positioned on an ice-rich location identified and characterized by a resource exploration campaign. Volatile materials are extracted from the site and transported to a processing facility adjacent to a launch and landing facility to enable the processed commodity to be transported to the point of sale (POS), either on the lunar surface or in space.
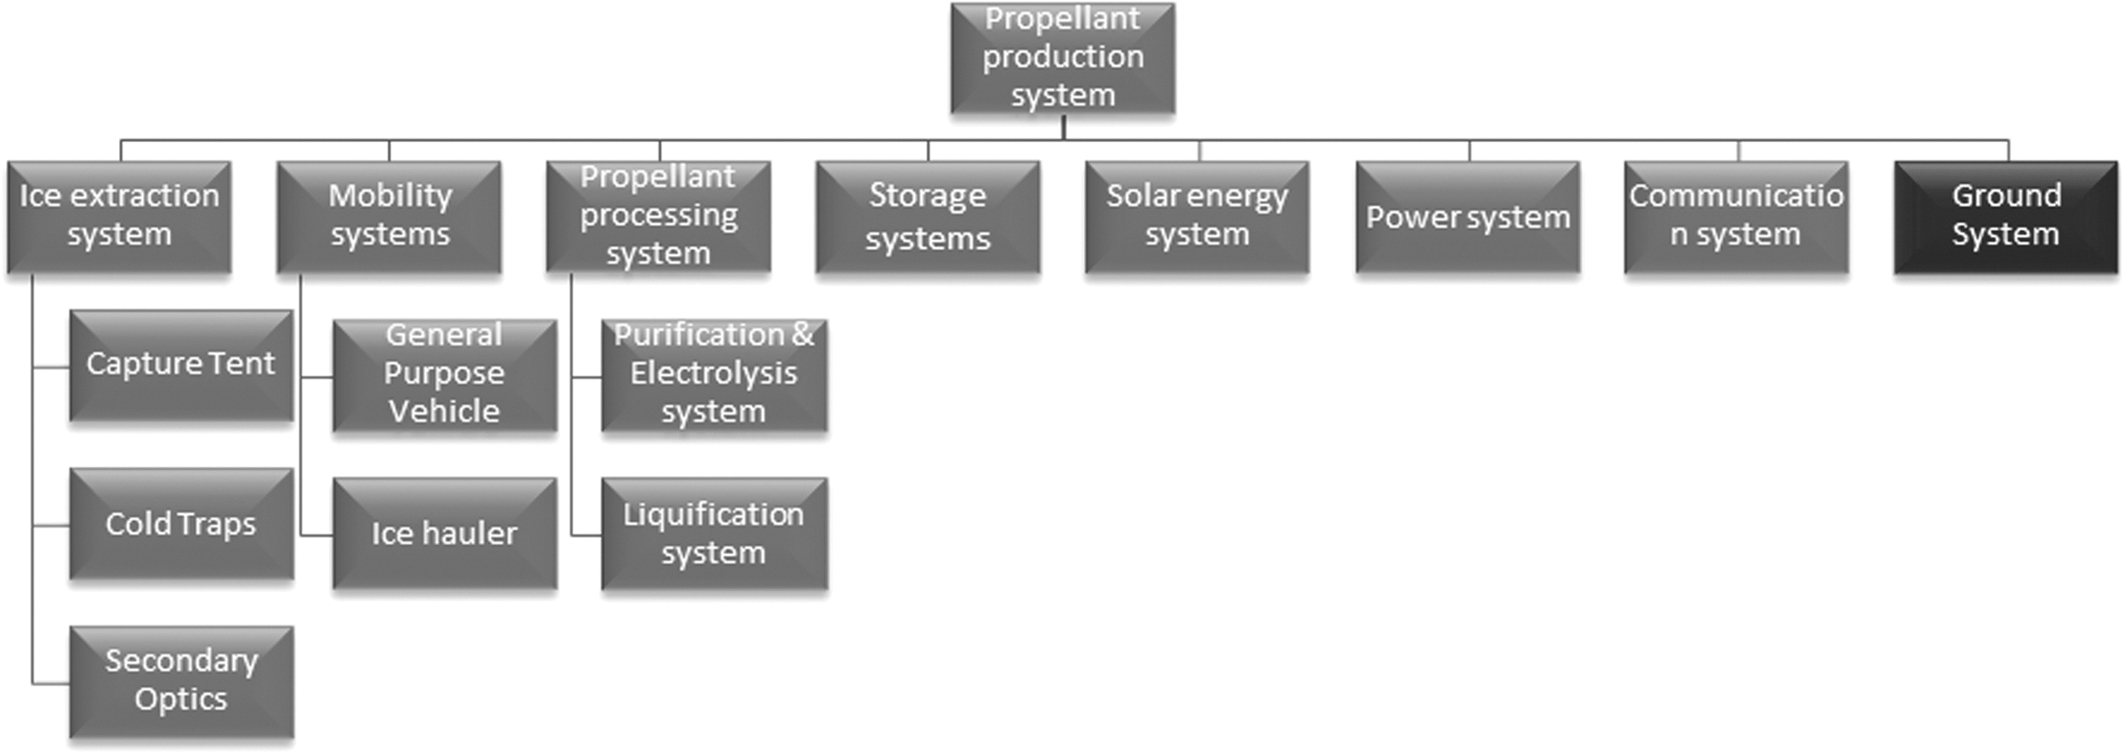
Propellant production system architecture.
The Thermal Mining ice extraction system (Fig. 5) uses heat to warm the frozen material to sublimate the ice, releasing it from the surface in the form of vapor. Heat is delivered in the form of reflected sunlight. The ice extraction system consists of a Capture Tent, secondary optics, and one or more cold traps. It is located inside a PSR of a lunar crater. Sunlight is reflected from adjustable heliostats on the rim of the crater to the crater floor to warm the surface. If surface heating is insufficient, subsurface heating can be accomplished by driving conducting rods into the first meter(s) of the material, which provides a conduction path for heat into the material and a path for the sublimated vapor to escape. The cost model discussed below assumes that only surface heating is required. The addition of conducting rods would entail a small additional cost.
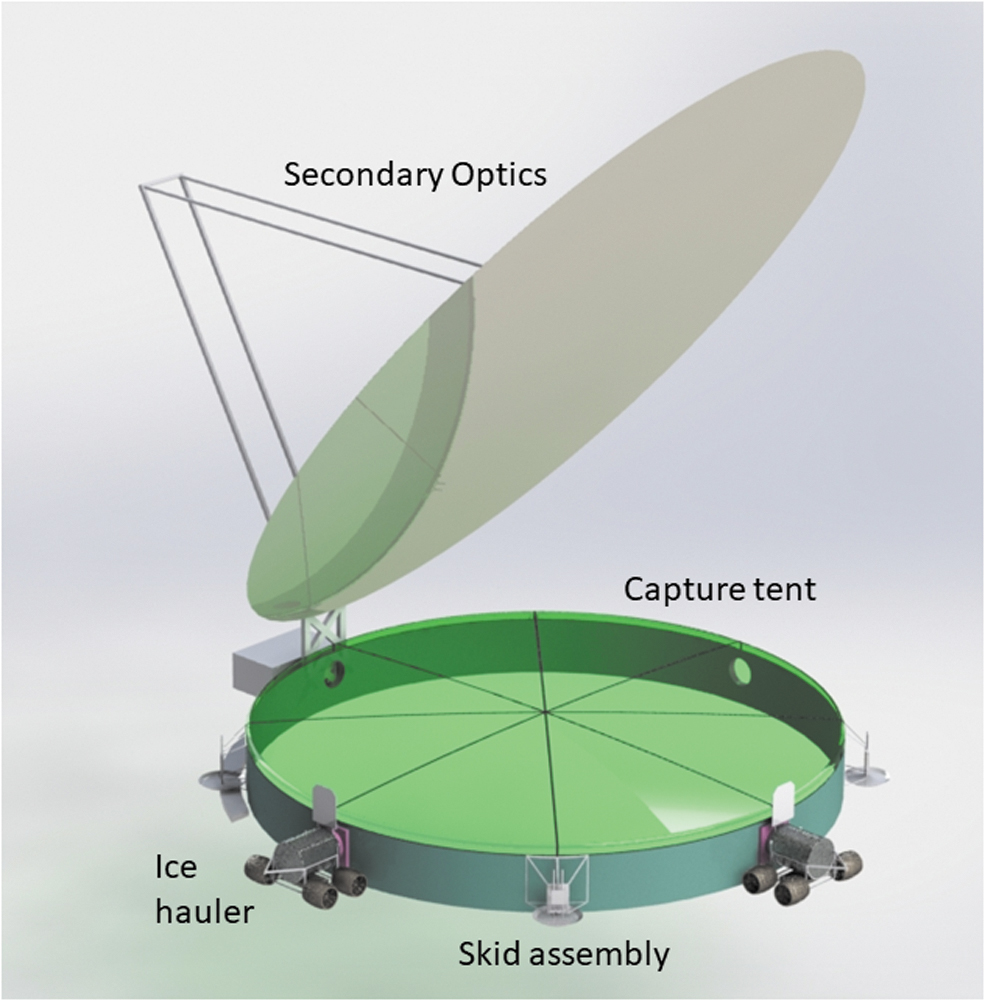
Ice extraction subsystem.
To capture the vapor produced by heating the surface or subsurface, a tent structure called the Capture Tent is placed over the surface where the heating occurs. Secondary optics are located above the tent to direct sunlight through a transparent top to the surface. The sublimation rate is controlled to keep the pressure in the tent very low, and the inner tent surface is reflective to trap as much heat as possible and to keep vapor from freezing on the inner surface. The vapor migrates from the tent interior into attached cold traps through large openings, where it then refreezes. The ice-filled cold traps are transported by ice haulers to a central facility for processing. Once the surface under the tent is depleted of volatiles, the tent is moved to a new location.
Once the frozen vapor is delivered to the processing facility, it is processed to purify and electrolyze it into H2 and O2. The purification process begins by using a membrane distillation architecture. This step removes any remaining volatiles in the vapor state, before passing the water vapor through an ammonia scrubber, water polisher and condenser, and then a transfer pump to move the liquid water into the electrolyzer. The electrolyzer then uses an electric current to decompose the water into gaseous hydrogen and oxygen, which are separated and dried. The gases are cooled to liquefy the hydrogen and oxygen, and then transferred into storage containers to await export and sale.
Cost Model
The cost model for the propellant production operation is based on mass estimates for the architecture elements shown in Figure 4. The ground system (in green) was not included in the mass estimates since it would not be launched to the Moon, but was included in the cost estimate. The detailed mass estimation methodology is described in Sowers et al. Table 2 lists all the masses as well as the location of that subsystem on the Moon: PSR or 1 of 3 crater rim locations.
Subsystem Masses by Lunar Location and Total Mass
GPV, general purpose vehicle; PSR, permanently shadowed region.
The cost estimate for each subsystem hinges on the mass estimates determined above. In general, both the development cost and the production cost for the subsystem are determined by multiplying the mass by a factor in dollars per kilogram ($/kg). These factors vary from subsystem to subsystem depending on the complexity and estimated difficulty in developing and/or producing the subsystem. All costs throughout the article are considered to be constant year 2020 dollars.
Costs are separately estimated for the development of the subsystem and the production of the system. Development cost includes all activities required to develop the system up through qualification testing. This includes technology research and development (R&D), prototype testing, design evaluation testing, detailed design, integration, and qualification testing. It also includes development of the production and supply system. Production cost is the cost to manufacture the subsystem in the quantities required by the architecture.
Development costs are estimated by a single $/kg factor for that subsystem. The value of the factor is intended to represent a commercial, for profit, development approach. In this approach, all the cost and cost risk are borne by the system developer, tending to keep costs low and time lines short. This is in distinction to a typical government-run development program where the cost and risk are borne by the government and contractors are reimbursed on a cost-plus basis. A government development approach would entail much higher costs.
The nominal cost factor used was $50,000/kg. This value corresponds to aerospace industry experience for hardware of average complexity. In contrast, the government development of a highly complex system such as the Curiosity Mars rover was a factor of 10 higher. At the other end of the spectrum, the terrestrial mining equipment is 2 to 3 orders of magnitude lower, reflecting both high mass and mature technology. This average value was adjusted up or down based on my judgment of the relative complexity of the subsystem.
The production costs for the subsystems were estimated in a similar manner with a base $/kg factor. However, some of the subsystems are produced in quantity, or have similarities. For example, the wheels, chassis, drive train, and power system are assumed to be the same for the general purpose vehicle (GPV) and the ice haulers. Hence, that component needs to be developed only once, but a total of 4 are produced (1 GPV and 3 ice haulers). When subsystems or components are produced in quantities larger than 1, a learning curve is applied. The learning curve exponent used was 0.9, a typical value in the aerospace industry.
Table 3 shows the unit mass, development cost factor, and development cost estimate for each subsystem, while Table 4 shows the production cost factors, first unit cost, number of units, and total build cost. The ground system has been added in both tables as a discrete element of cost. The total development cost is $883M, while the production cost is $613M. Figure 6 shows a comparison of both development and production costs for the subsystems.
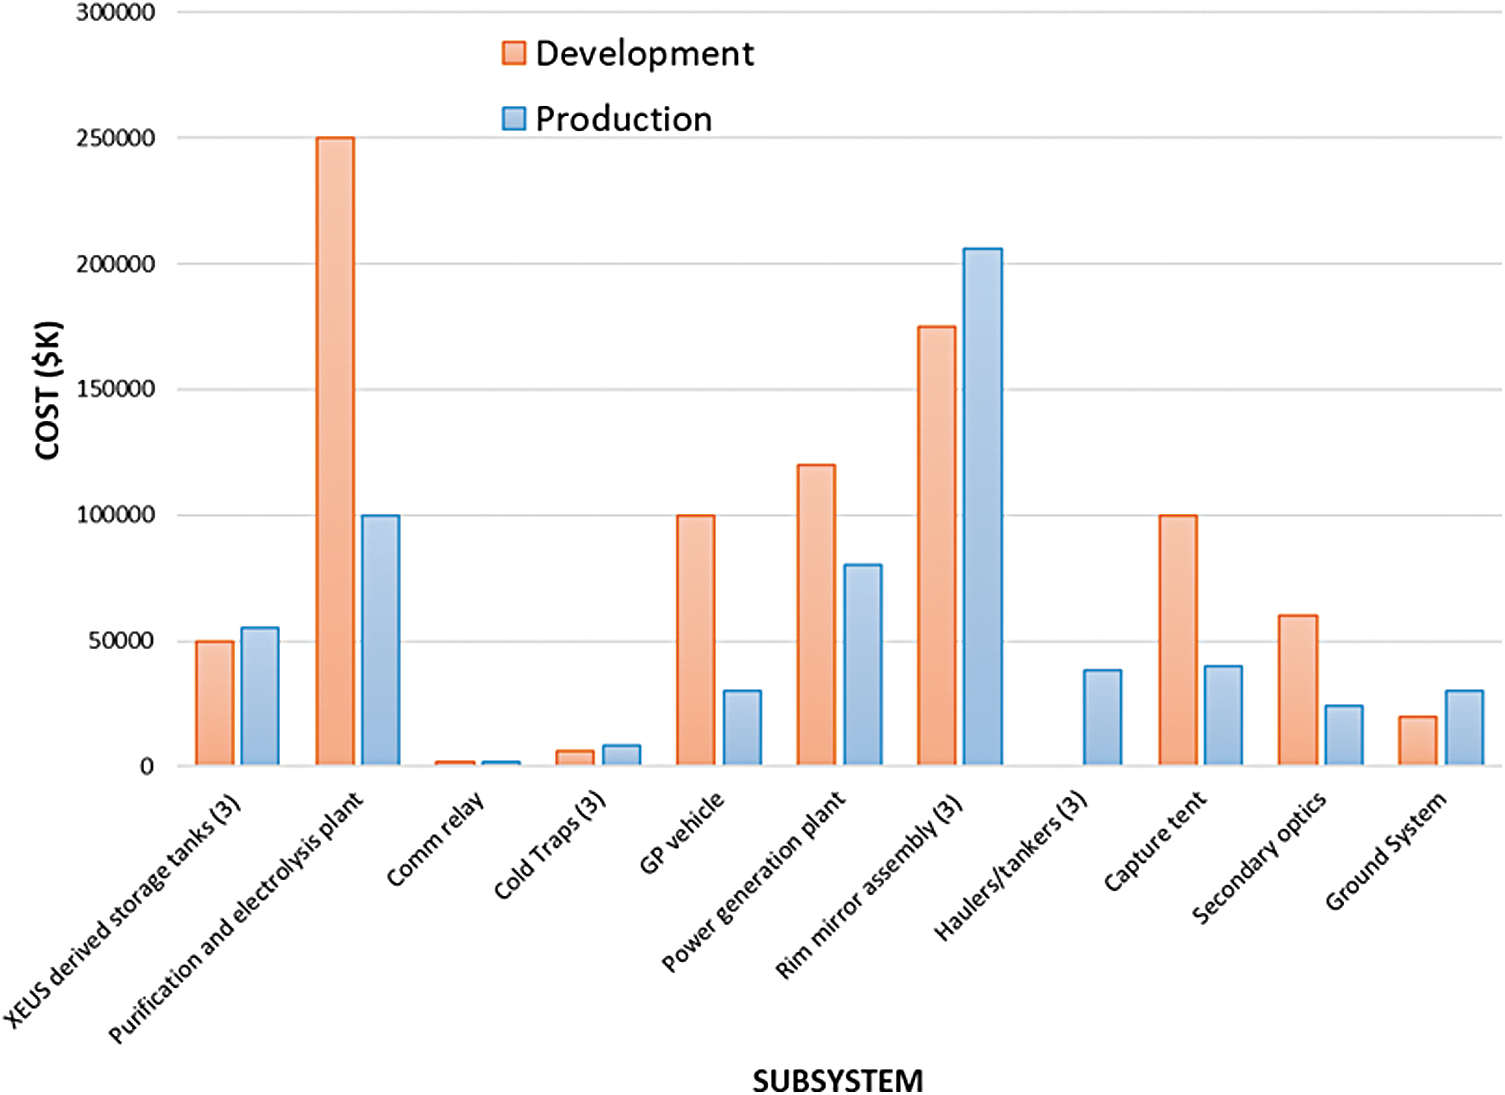
Development and production cost by subsystem.
Subsystem Development Cost Estimates
Subsystem Production Cost Estimates
The last component of nonrecurring cost to be considered is launch cost. The numbers used here are based on publicly available data published by ULA. 5 The data are based on the launch of the currently in-development Vulcan launcher with the upper stage equipped with a lunar landing kit, called XEUS. The landed capabilities of XEUS are 4,000 and 12,000 kg for single and dual launch, respectively. The dual launch scenario entails 2 launches, 1 with the lander and payload, the other with a tank of fuel. Refueling of the XEUS occurs at an optimum point in route to the Moon. The cost factor for a single XEUS launch to the lunar surface is $35,000/kg. This gives a launch cost of $140M. A 10% premium was added for a dual launch to account for the cost of refueling hardware and operations. Hence, the price of a dual launch is $308M. These data are summarized in Table 5.
Launch Data
Six landings are required to deploy the propellant production system. Three single launches are used to deploy the 3 sets of heliostat systems on the PSR rim. Three dual launches are required to land the propellant production and ice extraction systems into the PSR. However, the first PSR landing is used to deploy a landing and launch pad construction system, not assumed to be part of or chargeable to the mining operation. Presumably, this cost would be borne by the transportation company, a critical element of the overall propellant econosphere, but independent of the mining company. This landing includes 1 of the 3 liquefaction systems with a mass of 1,000 kg. Since the capability of the dual XEUS launch is 12,000 kg, one 12th of the cost of that launch is included here. Table 6 shows the cost of each launch and the total launch cost.
Launch Costs
Nonrecurring Cost
We can now combine everything into 1 grand total cost for development, production, and deployment, as shown in Table 7. This represents the capital expenditures for the project or CapEx.
Propellant Production System Nonrecurring Cost
Recurring (Operations) Cost
The final component of cost is the recurring cost. This cost represents all the effort required to operate the mining operation to generate the required propellant production rate. Elements of this cost include the labor to operate the ground system to receive data from the lunar system, process the data, determine necessary actions, and provide the necessary operational commands. These activities can be classified as routine operations, scheduled maintenance operations, and repair operations. Routine operations include teleoperating ice haulers and the GPV as they move ice, recharge, and relocate the ice extraction system, repointing the heliostats and secondary optics, operating the propellant processing system, and monitoring system health. Scheduled maintenance will include replacing rapidly wearing parts, cleaning systems, and detailed inspections. Repair operations occur when the system breaks. These operations include the production and delivery of spare parts.
For operations cost, we use a cost factor as we did for the nonrecurring costs. The operations cost factor is assumed to be $3,000/kg per year. This factor is applied to the entire mass of the system yielding an annual operations cost of 78,600$k.
Business Case Scenarios
I now describe 3 business case scenarios for the Propellant Production Company. Scenario 1 represents commercial demand only and with all investment coming from the private sector. Scenario 2 represents a PPP modeled after NASA's successful Commercial Orbital Transportation Services (COTS), Commercial Resupply Services (CRS) programs. The demand model is reduced commercial (for conservatism) plus missions to the Gateway plus a minimal surface demand for refueling 2 landers per year. Scenario 3 is the same as Scenario 2 but with the addition of demand for an ongoing Mars program, both hardware delivery and propellant to a Cislunar aggregation point.
The following ground rules are common to all 3 scenarios:
This is the very first mining operation to be established on the Moon. The cost of the resource exploration (or prospecting) campaign is borne by NASA and/or other international governments. Resource exploration is an important activity to map the locations and abundances of ice as well as characterize the chemical and geotechnical properties of the materials. This assumption is justified by the high risk of this activity, the tremendous scientific value of the data obtained, and the potential economic and strategic value of the resource. A framework for the resource exploration campaign was developed at a workshop held at the Colorado School of Mines (CSM) in the summer of 2018.
18
Some upfront technology development is funded by NASA or other governments. This is already happening via several programs within NASA's Space Technology Mission Directorate (STMD). Full-scale development and production of the ice mining facility occur over a 4-year time span. Deployment, setup, and checkout of the propellant production plant take 18 months. The operational life of the plant is 10 years. There is a separate transportation company that takes delivery of the propellant at the production plant and moves it to the point of customer delivery. Transportation costs are reflected in Figure 3 prices.
The demand models and pricing models for the 3 scenarios are shown in Table 8. Baseline pricing is as shown in Figure 3. The sensitivity of business results to pricing is shown below. The difference in demand at the POS and the lunar surface represents the cost and propellant expended moving the propellant from the lunar surface to the POS. The commercial, Gateway, and lander demand is assumed to be constant for the 10-year production life of the operation. The Mars demand begins in the third year of operations and continues through end of life. The total propellant demand on the lunar surface determines the required propellant production rate for the system. The total annual propellant demands for the 3 scenarios are 1,100, 1,158, and 1,882 mT, respectively. The cost model is based on 1,100 mT and linearly scaled for the other scenarios.
Propellant Demand and Price
EML2, second Earth-Moon Lagrange point; GTO, Geosynchronous transfer orbit; LEO, low Earth orbit; POS, point of sale.
The PPP model for Scenarios 2 and 3 is based on the COTS/CRS model with elements drawn from the Commercial Crew development program (CCDev). The program consists of 4 phases, each retiring risk, maintaining competition, and affording off ramps. The first 2 phases are modeled after CCDev, the third phase after COTS, and the 4th phase after CRS. The phases of program are as follows:
Propellant mining development 1. The purpose of this phase is to retire the risk on the critical technologies enabling ice mining and propellant production on the Moon. There would be notionally 4–6 winners receiving $5–10M each over a 2-year period of performance (POP). A cost match would be required.
Propellant mining development 2. The purpose of this phase is to further retire the risk on the critical technologies enabling ice mining and propellant production on the Moon. Lunar surface demonstrations would be included using the Commercial Lunar Payload Services (CLPS) program. There would be notionally 3–4 winners receiving $20–30M each over a 3-year POP. A cost match would be required.
Full-scale development and deployment. This phase develops, builds, and deploys the full-scale production plant. There would be 1 to 2 winners each receiving $400–800M (Scenario 2) or $800–1,200M (Scenario 3) over a 5-year POP. The contract would be milestone based with NASA's investment fixed.
Production. This phase is the production and delivery of propellant. NASA would commit to a prenegotiated annual buy of propellant. The contractors would be incentivized by business forces (recovering their investment) to seek other customers.
A roadmap for this program is shown in Figure 7. It is integrated with the resource exploration campaign 18 and leads to full propellant production within 10 years.

Propellant production program plan (Scenarios 2 and 3).
The cost model for each scenario is based on the costs developed in the Cost Model section, scaled by the relative production rates for the 3 scenarios. The scale factor for Scenario 1 is 1.0; Scenario 2 is 1.052; and Scenario 3 is 1.625. These factors are applied to the development, production, and operations costs. The launch costs for both Scenario 1 and 2 are the same since the launch campaign developed for Scenario 1 had sufficient mass margin to accommodate Scenario 2. Scenario 3 added 1 dual launch at $308M.
Results
The critical data for the 3 scenarios are summarized in Table 9 . The key figure of merit is the internal rate of return (IRR). This measures the annual rate of return of the investments into the company provided by the revenues. It is a function of the time-dependent streams of cash, either into the company in the form of revenues or out of the company in terms of costs. The acceptability of a given IRR is determined by other business factors influencing the company. These include the debt to equity ratio, risk rating, tax rate, interest rates, and inflation. The minimum acceptable IRR is often referred to as the hurdle rate. If the IRR exceeds the hurdle rate, it will generate a positive net present value and is an indicator that the business is viable. If the IRR is less than the hurdle rate, the business is not viable.
Key Business Case Parameters
IRR, internal rate of return.
Figure 8 shows the cumulative cash versus time for the 3 scenarios. Cumulative cash can be thought of as the money in the company's bank account. In each scenario, the curve drops below zero as funds are expended to develop, produce, and deploy the propellant production system. Once the system is operational and production begins, revenues are generated, and the curve begins to head upward. The break-even point (cumulative cash of 0) is not reached until year 9 or 10 for the PPP scenarios, and not until year 11 for the commercial-only scenario. However, by the end of the mine life, all scenarios are in the black, netting between $2B and $5B.
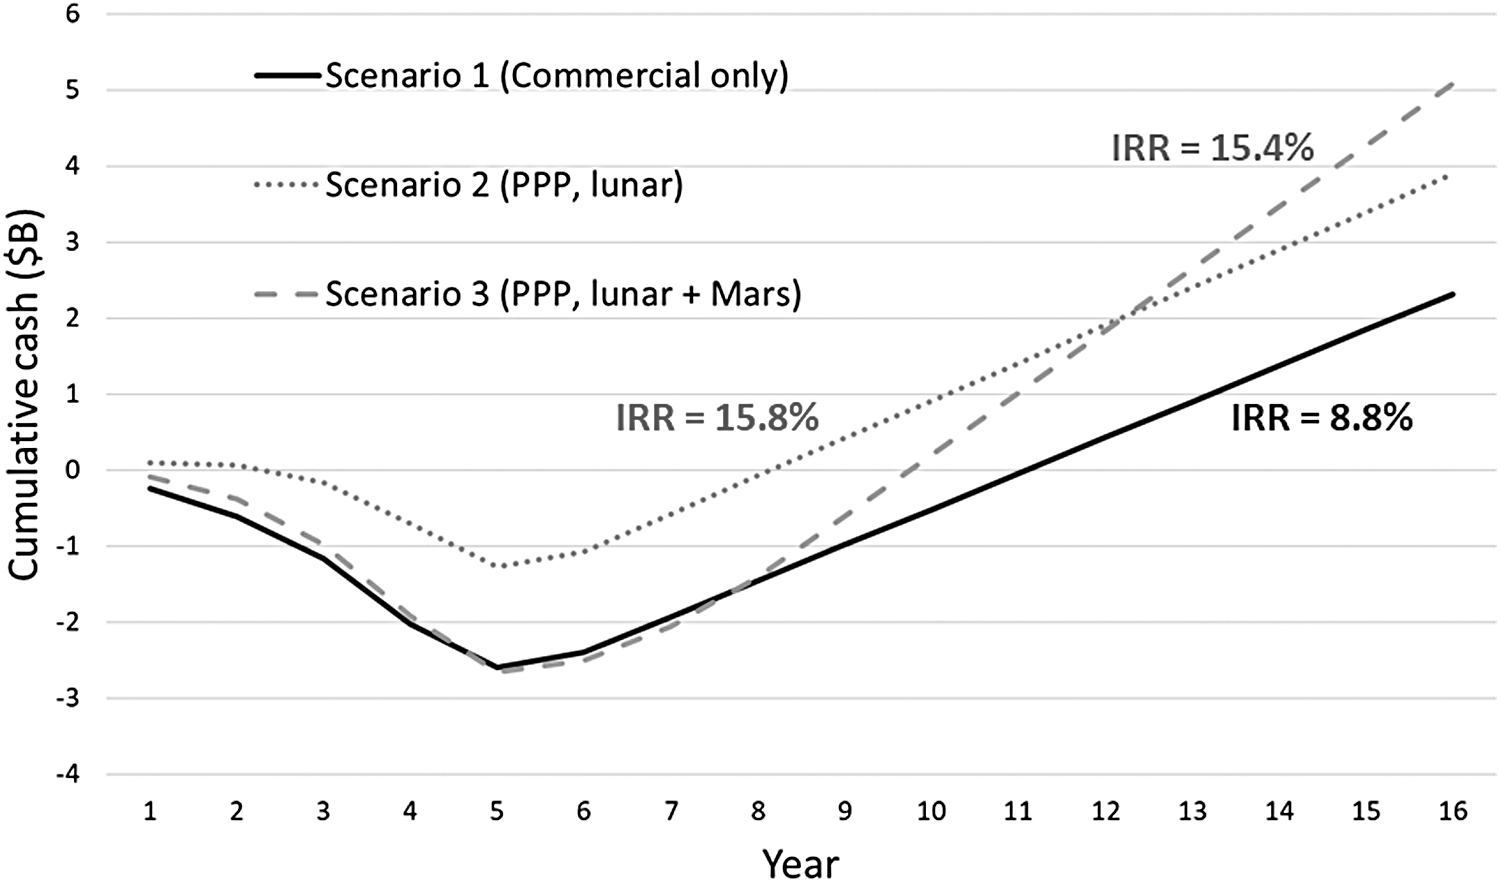
Cumulative cash for the Propellant Production Company.
Acceptable IRR values for something as new and risky as lunar mining are difficult to predict with what we know today. Sommariva et al.19,20 discuss a range of 8%–20%, while Charania and DePasquale 21 use a value of 21.7%. The value of 8.8% for Scenario 1 is clearly marginal without other business enhancing measures (e.g., government guarantees or tax incentives), but both PPP scenarios are much better. Options to increase business viability include increasing propellant price or the level of NASA investment. Figures 9–11 show sensitivities of the IRR to increased lunar surface propellant price for each of the 3 scenarios. Also included is the sensitivity with development cost for Scenario 1. A cost factor was applied to all the components of nonrecurring cost discussed in the Cost Model section. A hurdle rate of 21.7% can be readily met by a price increase or additional NASA investment or both. As shown in Figure 3, lunar propellant prices have a lot of margin relative to launching from Earth in every market except LEO. However, the price at LEO can be reduced by a factor of 2 by simply using aerobraking instead of a propulsive maneuver to move from an high Earth orbit into LEO.
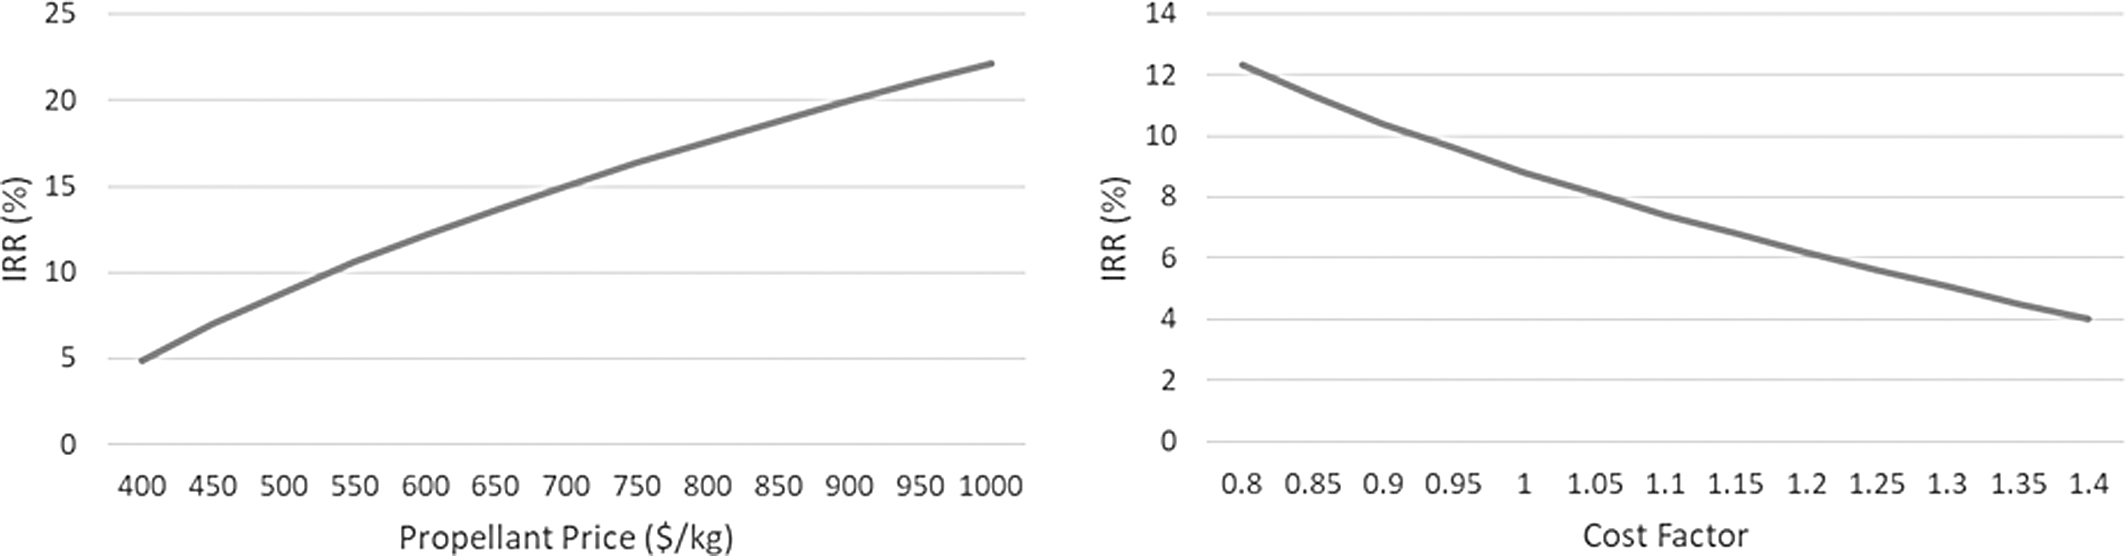
Scenario 1. IRR sensitivity with lunar surface propellant price and nonrecurring cost. IRR, internal rate of return.
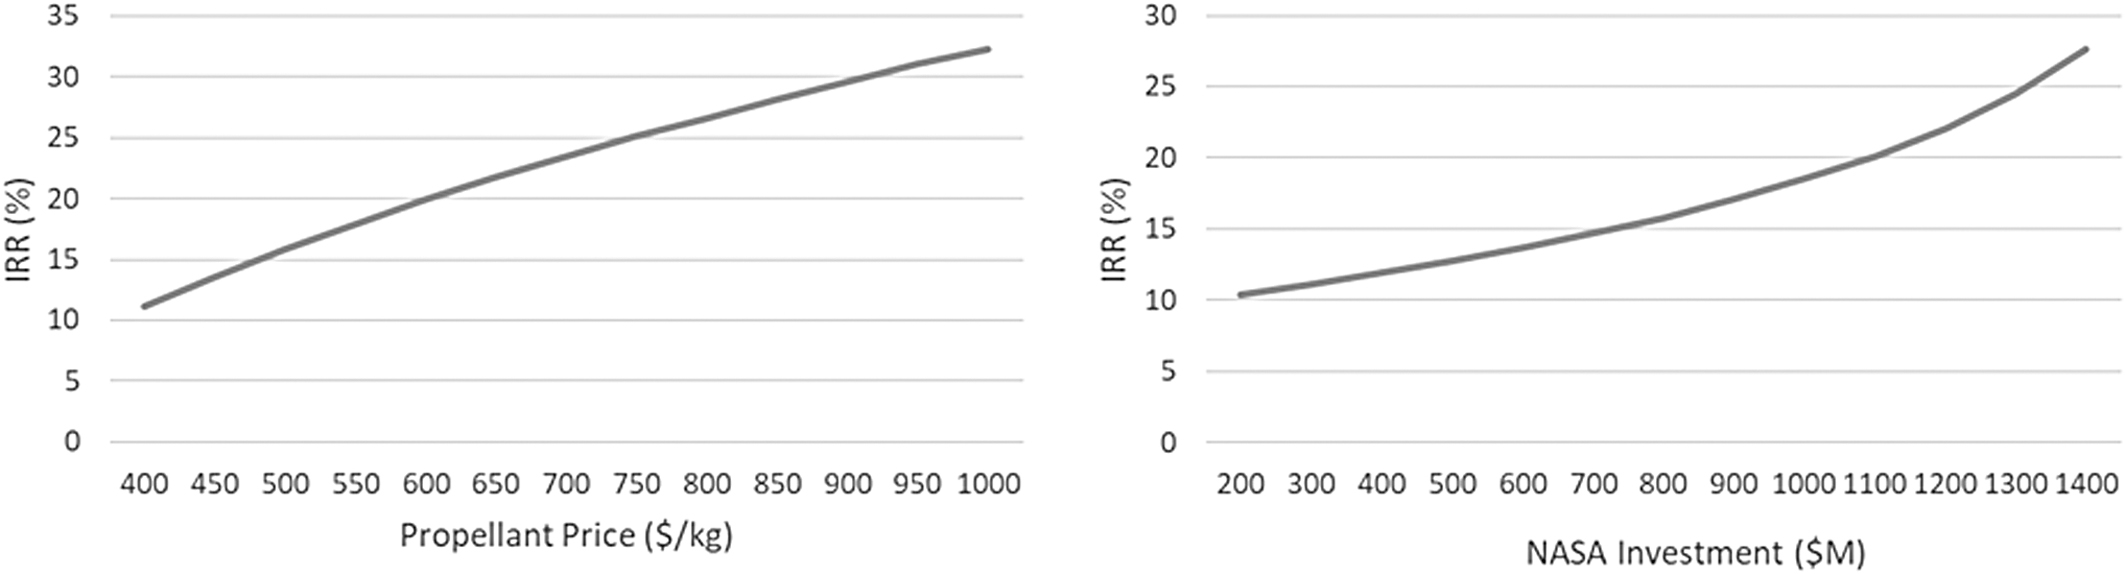
Scenario 2. IRR sensitivity with lunar surface propellant price and NASA investment.
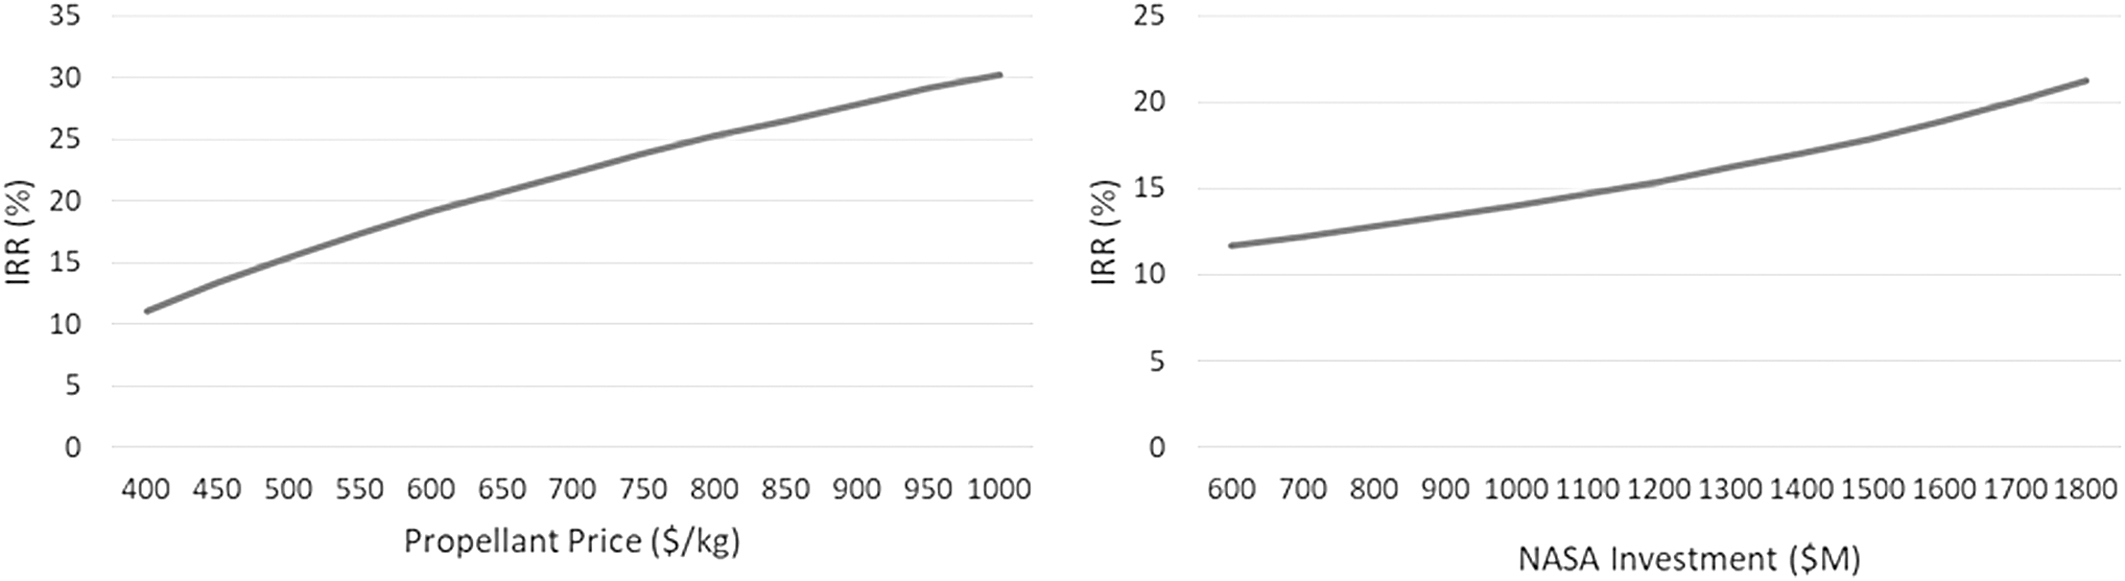
Scenario 3. IRR sensitivity with lunar surface propellant price and NASA investment.
So far, I have discussed the business scenarios from the perspective of the company. However, a good PPP should provide benefits to both the public sector and the private sector. Since the government is a not-for-profit entity, it is not appropriate to talk in terms of revenues. Instead, we calculate NASA benefits in terms of savings; in other words, savings resulting from the availability of propellant and the costs described take the place of revenues.
NASA savings in Scenario 2 accrue from the reduced cost of propellant purchased on the lunar surface and from the reduced cost of cargo missions to the Gateway. The cost of the propellant purchased on the lunar surface is $2.5M/year (5 mT/year @$500/kg). If brought from Earth, this propellant would cost $175M (5 mT/year @35,000/kg). The savings is thus $172.5M/year. As discussed above, the number of cargo missions could be reduced from 4 to 2 using lunar propellant. Assuming each mission costs $150M, the savings is $300M/year. The total savings is $472.5M/year.
The savings for Scenario 3 are even more spectacular. In addition to the $472.5M/year savings in Scenario 2, enormous savings are realized for a Mars mission. A Mars mission requires delivering both hardware and propellant to an aggregation point in Cislunar space. Derived from McVay et al., the annual mass of hardware for a Mars campaign is 75 mT and propellant is 47 mT. The cost to deliver hardware mass to Cislunar space using lunar propellant is $375M (75 mT @$5,000/kg). The cost to deliver lunar propellant to Cislunar space is $52M (47 mT @$1,100/kg). The cost to deliver all this mass to Cislunar space from Earth using the SLS can be determined using data from Jones et al. who give a cost of $46,000/kg. Delivered from Earth using SLS, the cost is $5,612M/year. The annual savings for a Mars campaign is thus $5,185M/year.
Figure 12 shows the cumulative cash flows for NASA as a function of time with savings expressed as positive cash. The IRR for Scenario 2 is a respectable 27%, while the IRR for Scenario 3 is double at 54%. The net savings for Scenario 2 is over $4B, while the savings for Scenario 3 is a whopping $47B. Clearly, the use of lunar propellant is enormously beneficial and probably enabling for any Mars program.
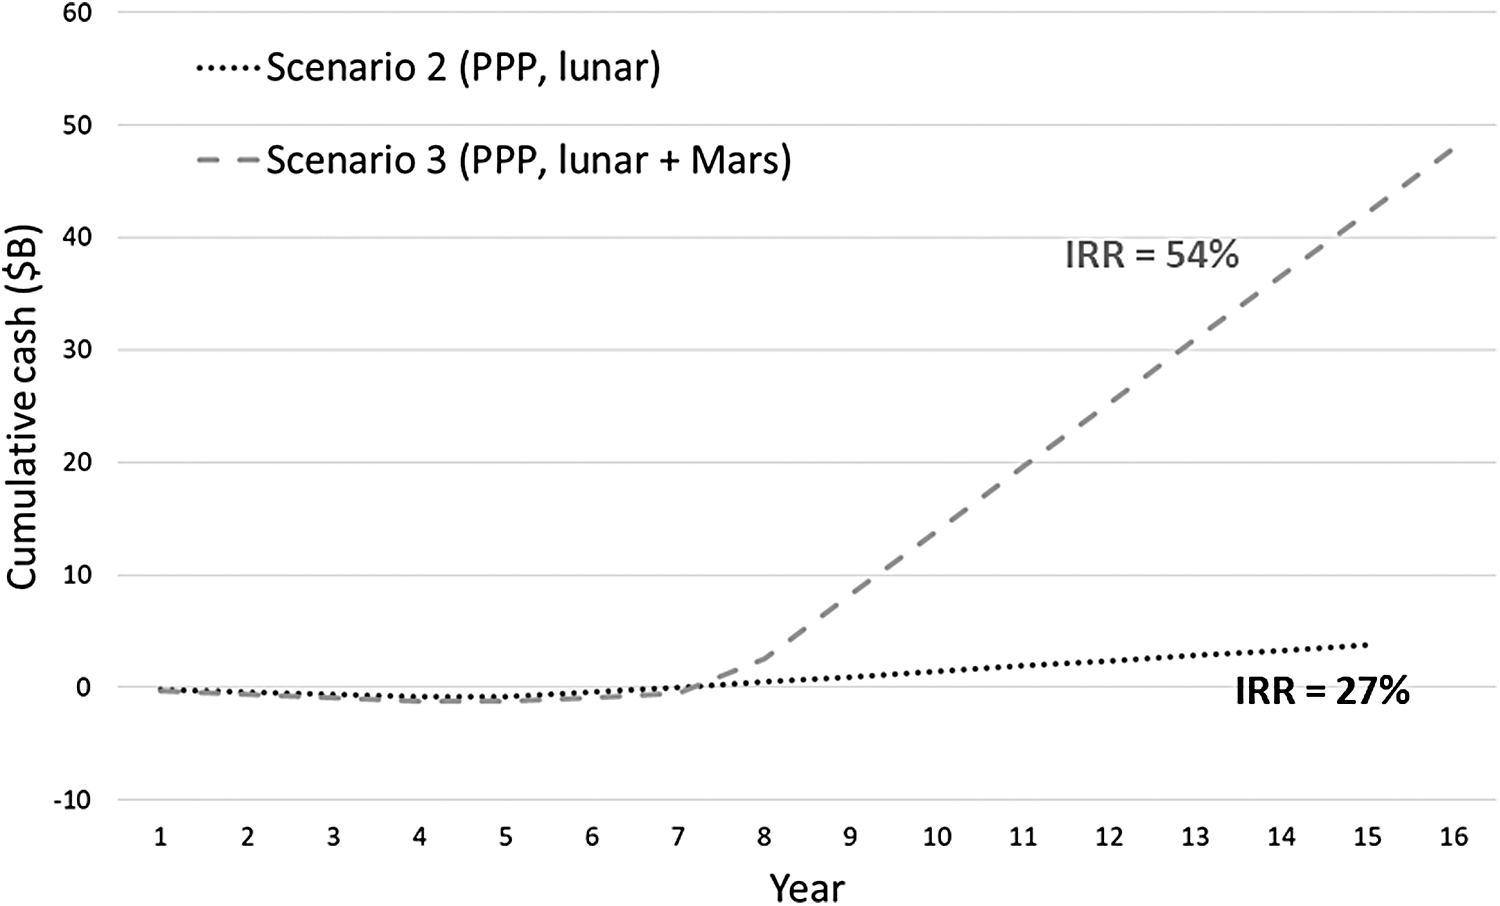
Cumulative cash for NASA.
Comparison With Previous Studies
The previous section has shown that a propellant price of $500/kg on the lunar surface or $1,100/kg in Cislunar space can support an economically viable business. A propellant price at this level also generates enormous cost savings for NASA for both Moon and Mars explorations. However, some previous studies have resulted in much higher prices. For example, Charania and DePasquale 21 derive a cost of $26,845/kg at the lunar surface. Shishko 22 escalated that price to 2019 dollars producing $35,300/kg. This is about a factor of 70 greater than the price used here. A more recent article by Jones et al. 23 gives a value of $101,000 in Cislunar space for the scenario most like my 3 scenarios, a factor of 90 higher. This section gives a summary of the major differences between my approach and other recent literature, focusing on Charania and DePasquale 21 and Jones et al. 23
It is worth restating here that the Thermal Mining architecture study is intended to be the minimal economically viable architecture. Every effort has been made to keep the architecture simple and the costs as low as possible. Making use of recent scientific findings 15 indicating surface ice in abundances up to 30wt%, our ice extraction system is 65% less mass than excavation. 2 Furthermore, I have made full use of the progress in commercial space transportation in the past few years. This has allowed me not to burden the company with the cost of developing a completely new transportation system. Finally, I have assumed a PPP model that leverages both public and private sources of capital.
The 2007 study by Charania and DePasquale 21 assumed a completely private venture. Their company was also responsible for transportation and thus had to develop 2 new in-space vehicles, a lunar tanker vehicle and an orbital transfer vehicle. The propellant production plant relied on excavation and had a mass of 20.9 mT producing 49.4 mT of propellant per year, yielding a plant efficiency of 2.3 (kg of annual propellant production per kg of plant mass). This contrasts with an efficiency of 42.0 for the Thermal Mining system. Their plant was deployed to the Moon using NASA's heavy cargo launcher, a precursor to the current SLS. Finally, as discussed above, they assumed a hurdle rate of 21.7%. Table 10 provides a summary of the key differences.
Thermal Mining Comparison with Charania and DePasquale
PPP, public/private partnership.
The hurdle rate discrepancy is easiest to reconcile using the data in Figure 9. A price increase to $1,000/kg increases the IRR to 22%. That still leaves a factor of 35 difference. The plant efficiency difference is a factor of 18 leaving another factor of 2, easily accounted for by the other factors. Clearly, the high efficiency of Thermal Mining is the critical element in achieving low prices.
The recent study by Jones et al., 23 henceforth abbreviated as “Jones,” was conducted to specifically answer the question of whether lunar propellant would be more cost effective than bringing propellant from Earth for a Mars mission. The analysis was conducted from the perspective of a completely government-run Mars program with no lunar activity other than propellant production for the Mars mission. Jones examined a number of scenarios, but his Scenario 3 is most like the Thermal Mining architecture: “Propellant delivered from the Moon using a reusable lunar lander between the Moon and cis-lunar aggregation. All-up deployment of ISRU infrastructure.”
Several significant differences exist between the assumptions of Jones and the Thermal Mining architecture, summarized in Table 11. First is the assumption of the business model. Jones' model was a full-up government program with commensurate cost assumptions. No insight was provided into the details of the cost model. The comparison point for propellant cost was Cislunar space. Thus, an assumption must be made on the means of transportation from the lunar surface to Cislunar space. Jones assumed a reusable lunar lander with mass fraction of 0.26 (inert mass to total mass). This number came from NASA studies for the Altair lander, to be used for human landings in the previous lunar program. Our study assumed a mass fraction of 0.11 for the XEUS. The XEUS mass fraction is credibly derived from the ACES mass fraction of 0.08. An early version of ACES is slated to fly next year. This difference amounts to a factor of 5 in the resulting cost.
Thermal Mining Comparison with Jones et al.
SLS, space launch system.
Next, Jones assumed SLS, and presumably the same lander, would deliver the propellant plant to the Moon. No costs for this are provided, although SLS costs for delivery to Cislunar space are quoted to be $46,000/kg. This is a factor of 4.6 higher than the commercial price shown in Figure 3. The propellant mine itself has an efficiency of 8.4 compared with 62.0 for Thermal Mining. It is important to note that Jones accounted for the mass of the power system separately, which is why this efficiency is different than cited above for the Charania study. In a private correspondence with Jones, 24 just this factor was enough to reduce the price in their model to $23,000/kg, a factor of 4.4.
Finally, Jones assumed a nuclear power source for the propellant plant and power levels based on molten regolith electrolysis. Nuclear power is a viable source for powering a propellant plant in a lunar PSR and remains an option for Thermal Mining. However, the specific power used by Jones is high based on the current state of the art. Jones used a value of 75 kg/kW versus a value of 18 kg/kW shown by the Ultra Safe Nuclear Corporation (USNC) in a recent seminar at CSM. 25 See also Eades et al. 26 Reflected sunlight using thin film mirrors is even more efficient at 5.8 kg/kW. The power demands used by Jones are derived from work on molten regolith electrolysis, a technique being developed to extract oxygen from lunar regolith. It is a very poor proxy for the energy requirements of ice mining. For 1, melting regolith requires temperatures in the range of 2,200K versus sublimating ice at 220K.
The cost effect of the 2 parameters we can quantify (lander mass fraction and plant efficiency) is enough to resolve most of the discrepancy, leaving a factor of 4. This residual can be easily explained by the other factors such as power, and nonrecurring cost including delivery from Earth. This conclusion is partially replicated by Bennett et al. 27 Bennett uses Jones as a starting point to construct other scenarios that result in much lower costs for lunar propellant. However, Bennett retained the very inefficient and inappropriate use of molten regolith electrolysis as a proxy for an actual ice mining architecture.
Conclusions
The creation of a robust economy within the inner solar system will require the emplacement of a significant quantity of infrastructure. To be sustainable, the large capital expenditures involved must be underpinned by strong business fundamentals and profitable business enterprises. In this article, I have shown that mining lunar ice for propellant production can be one of the first profitable space activities in this space economy. Although profitable with purely commercial customers, a PPP model delivers returns high enough to attract private capital while delivering enormous cost savings to NASA's exploration program. Furthermore, the availability of space-sourced propellant dramatically lowers the cost of every space activity beyond LEO. The lower barriers of entry to other potential space businesses bring them closer to or across the profitability threshold.
A comparison with previous studies highlights the advantages of the Thermal Mining approach and the philosophy of a minimum viable architecture. The efficiency of Thermal Mining far exceeds any method based on excavation. This high efficiency is gained by targeting surface ice, using reflected sunlight, and avoiding excavation. The use of commercial methods, a highly efficient commercial transportation system, and a PPP business model also results in much lower costs. Of course, much work remains to retire the risks inherent in Thermal Mining and propellant production on the Moon. However, the promise is astounding, tens of billions of dollars in savings for the Moon to Mars program and opening the Moon and Cislunar space to economic development, delivering trillions of dollars into Earth's economy.
Footnotes
Acknowledgment
Some of this work was performed under the NASA Innovative Advanced Concepts (NIAC) Phase I grant, Thermal Mining of Ices on Cold Solar System Bodies.
Author Disclosure Statement
No competing financial interests exist.
Funding Information
Partial Funding for this work was obtained from the National Aeronautics and Space Agency grant number 80NSSC19K0964.