
Abstract
Abstract
Background:
Insulin resistance and hyperglycemia are common in acutely injured patients, and associated with poor outcomes. In the era of tight glucose control, measures of insulin responsiveness (IR) may provide a better indicator of patient status than does the serum glucose concentration. We hypothesized that measures of IR during tight glycemic control protocols are associated with infection and may be more predictive than the serum glucose concentration.
Methods:
All critically injured, mechanically ventilated patients undergo protocolized tight glycemic control with the aid of a computer-based system that calculates the insulin dose using an adapting multiplier (insulin dose = [blood glucose – 60) × M). Consecutive patients on protocol were studied to identify the incidence of positive sterile-site or quantitative bronchoalveolar lavage cultures (>104 colony-forming units/mL). Patients were stratified by presence and number of positive cultures and analyzed by both serum glucose measures and measures of IR (average multiplier and average insulin infusion rate).
Results:
During the six-month study period, 356 patients were placed on the tight glycemic control protocol. Of these, 101 patients had 192 positive cultures. Patients with positive cultures required significantly more hourly insulin than those without a positive culture (3.7 vs. 2.8 units/h; p = <0.001). Logistic regression showed the insulin dose (odds ratio 2.1; 95% confidence interval 1.6, 3.0; p = <0.001) and the adapting multiplier to be independent predictors of the patient having a positive culture among other factors associated with nosocomial infection.
Conclusions:
Insulin resistance, quantified by hourly insulin dose and median multiplier, confers a higher risk of systemic nosocomial infection. Patients with positive cultures actually had lower admission and median blood glucose values over their intensive care unit stays, highlighting the decreased value of this measure as a predictor of outcome in the setting of tight glucose control. A greater insulin requirement suggesting resistance may be used as a marker of a higher risk of nosocomial infection.
Persistence of untreated hyperglycemia during the patient's hospitalization leads to adverse outcomes [5]. Unfortunately, the risk of hypoglycemia and the lack of widespread infrastructure to implement tight glucose control have limited its use in the trauma population. When instituted, protocols have used more liberal goals (80–150 mg/dL) instead of the more widely accepted glucose range (80–110 mg/dL), which have been demonstrated to be effective in other populations. A few studies have had mixed results in applying tight glucose control to the trauma population [6,7].
Although the question of whether hyperglycemia after trauma is an adaptive mechanism or a pathologic response to stress remains, an increasing body of literature suggests that the aggressive management of glucose leads to better outcomes [8–12]. These studies have been questioned because of conflicting data [13], but tight glucose control remains the standard in the intensive care setting around the world.
We sought to compare persistent hyperglycemia with escalating insulin dose as a means of identifying patients at risk for infective complications. We developed a computer-based decision support system to assist in the maintenance of euglycemia in critically patients that captures all glucose values, insulin doses, and a mathematical multiplier (M) to determine the insulin dose for each patient. We hypothesized that insulin dose and the adapting multiplier used in a tight glucose control protocol are better markers of nosocomial infection risk than are summary measures of blood glucose.
Patients and Methods
Nine hundred seventy-seven patients were admitted to the Vanderbilt University Trauma Service from October 4, 2005 to April 2, 2006. There were 356 patients who met the study criteria (mechanical ventilation and blood glucose concentration <110 mg/dL) and were treated with the tight glucose control protocol utilizing the computer order entry system. Those with fewer than five glucose values or not surviving the initial 24 h of admission were excluded (Fig. 1).

Study design. BS = blood sugar.
Insulin protocol
Vanderbilt University developed a computerized care provider order entry (CPOE) system that facilitates maintenance of euglycemia (blood glucose 80–110 mg/dL) using an intravenous insulin infusion. The adjusted insulin dose is determined by a linear equation that utilizes an adaptable multiplier based on the glucose response from the previous dosing period and is calculated every 2 h. The adaptability of M to various physiologic demands throughout a patient's hospitalization is a key characteristic of the protocol. The insulin dose (units/h) is calculated using the formula:
The M is initially set at 0.03 and can never fall below zero. The insulin dose is altered with an adapting multiplier, which is controlled by a set of rules (Fig. 2). The multiplier increases and decreases in relation to the distance from the goal range of 80–110 mg/dL; i.e., if the most recent blood glucose concentration is 58 mg/dL, the multiplier decreases by 0.02 whereas if it is 77 mg/dL, the dose would be decreased by only 0.01. The multiplier continues to be titrated until the goal range is reached and then does not change until the blood glucose concentration once again falls outside the range. The protocol titration has been shown to be effective in maintaining euglycemia [14, 15].
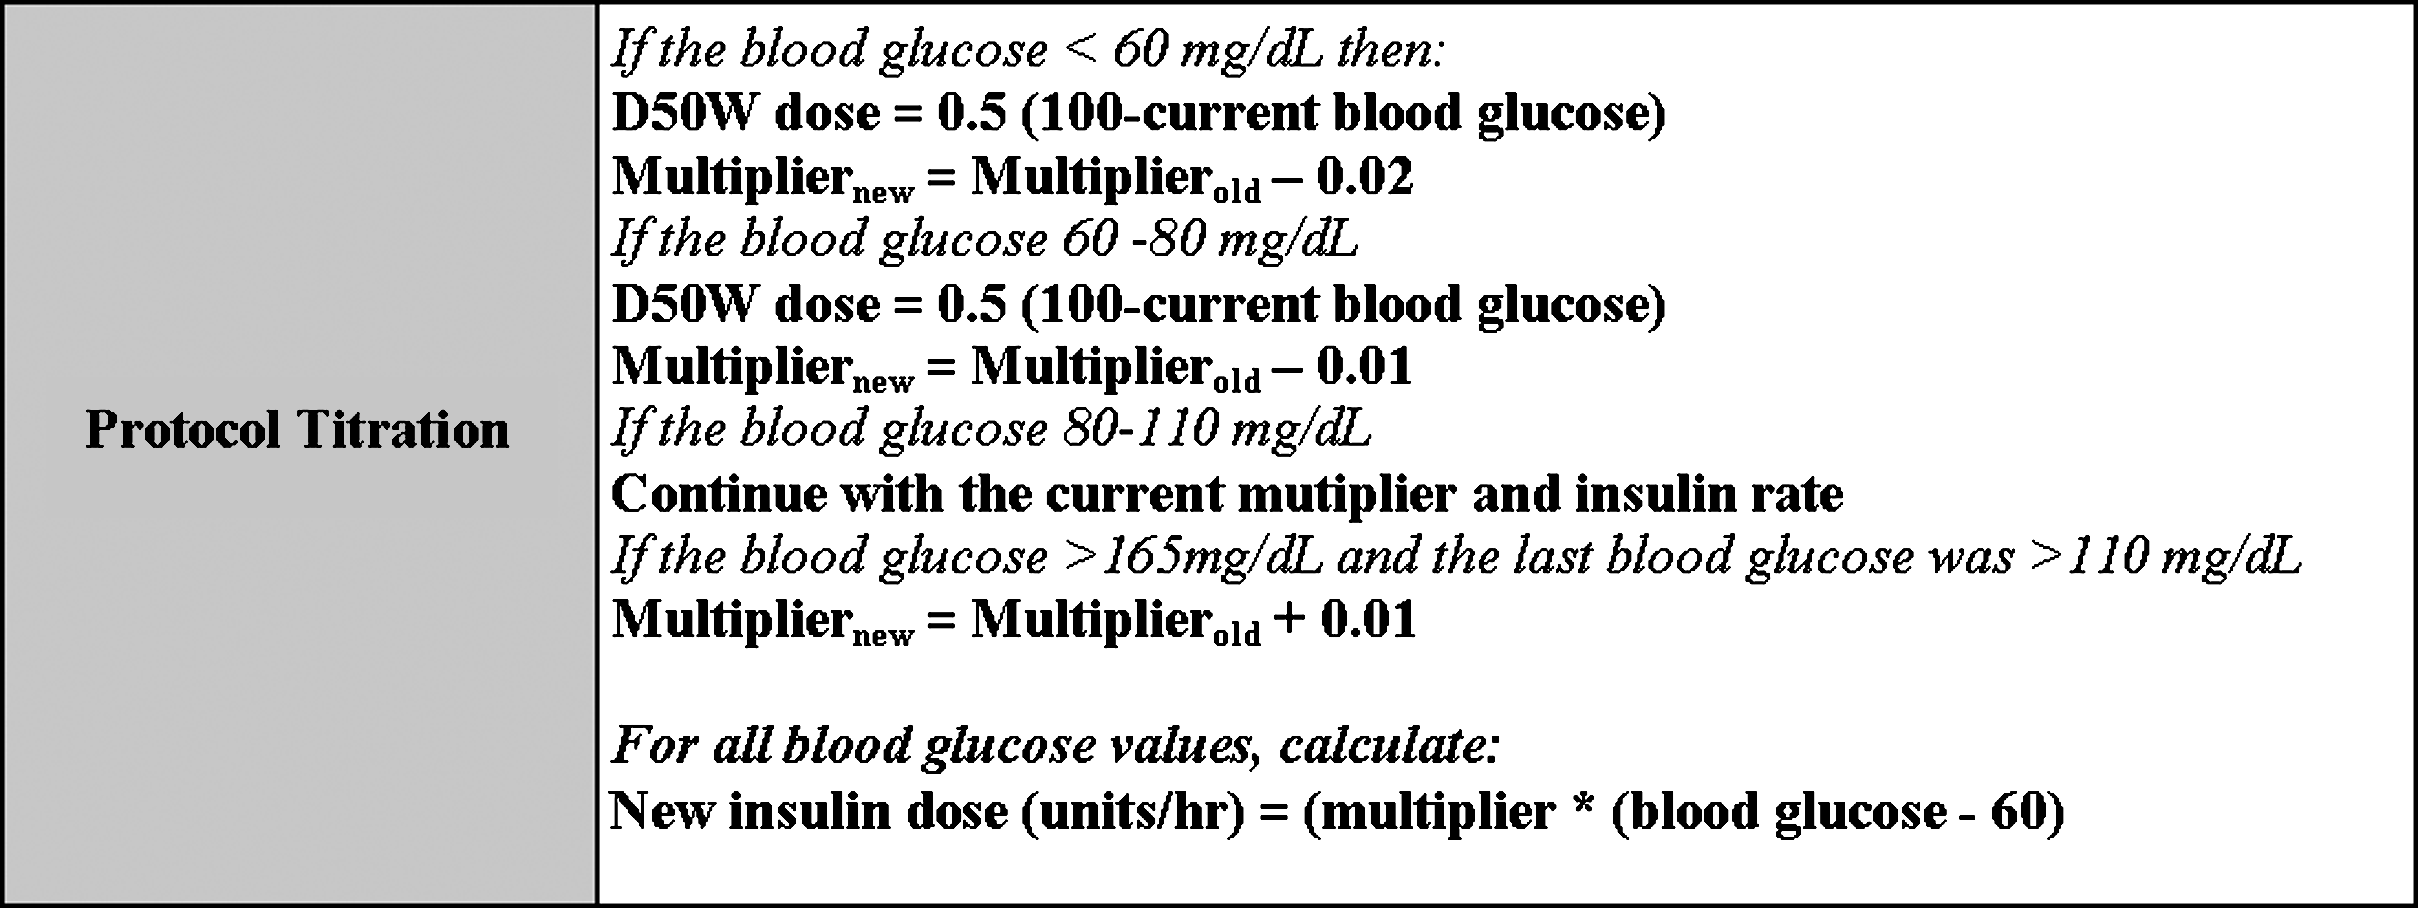
Description of the insulin protocol titration, blood glucose is checked on a q 2hr basis.
On admission, all patients are started on a glucose source consisting of intravenous dextrose (D5 or D10) to deliver partial nutritional support (5–10 g/h) unless enteral or parenteral feeding is being delivered. Enteral nutritional support is initiated as soon as the attending physician believes it to be safe. Parenteral nutritional support is initiated on day 5 of the patient's intensive care unit (ICU) stay if 70% of goal nutrition cannot be attained enterally and continued until enteral support is adequate. Nutrition goals have been established according to published standards with 20 to 24 non-protein kcal/kg of body weight per 24 h [16].
Blood glucose measurements are performed on protocol by a member of the nursing staff using the SureStep® Pro (One-Touch®) Professional Blood Glucose Monitoring System (http://www.lifescan.com/professionals/products/sspro/). Measurements were taken at 2-h intervals except after hypoglycemic events (blood glucose <60 mg/dL), which trigger a repeat measurement within 1 h. The insulin protocol produced entries that consist of a blood glucose value, multiplier value, insulin dose, glucose source, time, and date.
Data collection
Demographic, hospital outcome, and pharmacy data were obtained from electronic hospital records and databases. Information necessary to determine the severity of illness was obtained at admission and recorded in an institutional database. Scores were calculated for the simplified Injury Severity Score (ISS) [17]. Higher scores indicate more severe illness.
The study was approved by the Institutional Review Boards of Vanderbilt University Medical Center. All data are maintained in a secure, password-protected database compliant with the Health Insurance Portability and Accountability Act. All patient information is de-identified prior to analysis and reporting.
Outcome measures
Infections were classified according to the definitions of the U.S. Centers for Disease Control and Prevention. Pulmonary infection was diagnosed when a predominant organism was isolated from an appropriately obtained culture in the setting of purulent sputum production, a new or changing infiltrate on chest radiography, and systemic evidence of infection. Quantitative bronchoalveolar lavage was used exclusively (>104 organisms/mL considered positive). Blood stream infections (BSI) were diagnosed by the isolation of organisms from a blood culture from any site, with the exception of Staphylococcus epidermidis or other coagulase-negative staphylococci, which required isolation from two sites to be evidence of BSI. Criteria for urinary tract infection were isolation of >105 organisms/mL of urine or >104 organisms/mL and accompanying dysuria. Criteria for catheter-related infection included isolation of 15 or more colony-forming units from catheter tips by a semiquantitative roll plate technique in the setting of suspected infection (systemic symptoms or localized purulence). Wound infections were diagnosed clinically, and cultures were considered positive if a pathologic organism was isolated from swab cultures. Patients were stratified by the presence and number of positive cultures and analyzed by both serum glucose measures and measures of insulin resistance (IR)(average multiplier and average insulin infusion rate). Secondary outcome measures were hospital length of stay (LOS), ICU LOS, and ventilator days.
Statistical analysis
Normally distributed continuous variables were summarized by reporting the mean and standard deviation and compared using analysis of variance (ANOVA) for independent samples. Continuous variables that were not normally distributed were presented by reporting the median and interquartile ranges (IQR) and compared using the Mann-Whitney U test. Continuous matched data were compared using a Wilcoxon matched pairs test. Differences in proportions were compared using a chi-square or Fisher exact test. A two-sided p value <0.05 was considered statistically significant. The SPSS version 15.0 (S
Results
Study population
A total of 356 patients were enrolled with an overall mortality rate of 13.8% (n = 49). On admission, 39 patients (11.0%) had a medical history of diabetes mellitus, with 35 of the 39 (89.7%) being non-insulin dependent diabetics (NIDDM) and the remainder having insulin-dependent diabetes (IDDM). As a group, the mean age was 39 (IQR 24–57), the mean ISS was 29 ± 13, and the mean Revised Trauma Score (RTS) was 7.8 ± 3.7. The median glucose concentration for the entire group was 121 ± 22 mg/dL. There were 360 episodes of hypoglycemia (≤60 mg/dL) documented in 4,918 patient-days and 19,126 glucose values with corresponding insulin indices available for all (Tables 1 and 2).
Data presented as median and interquartile range (IQR) except as noted.
IQR = interquartile range.
Blood glucose control
Patients were divided into groups according to the presence or absence of a nosocomial infection during their hospitalization. The admission blood glucose concentration was significantly higher in the group not experiencing a positive culture (150 mg/dL for culture-positive patients and 163 mg/dL for those without a positive culture; p = 0.01). The median blood glucose concentration was statistically different between the groups (113 mg/dL for culture-positive and 118 mg/dL for culture-negative; p ≤ 0.001). The median insulin dose was significantly higher in the culture-positive groups (3.7 U/h vs. 2.8 U/h; p ≤ 0.001). The mean multiplier also was higher in culture-positive patients (0.071) than in survivors (0.047) (p ≤ 0.001).
Infective complications
During the six-month study period, 356 patients were placed on the tight glycemic control protocol. Of these, 101 patients had 192 positive cultures. Patients who had a positive culture had demographic characteristics similar to the patients who did not experience post-traumatic sepsis, with only the ISS being significantly different (Table 3). Analysis of the number of positive cultures and median insulin rate and glucose measures are shown in Table 4.
Data presented as mean ± standard deviation except as noted.
Data presented as median (interquartile range).
Patients were then divided into groups on the basis of the number of positive cultures. Patients with multiple positive cultures required significantly more insulin and had a higher adapting multiplier but actually had lower median glucose values than the patients experiencing none or one positive culture (Tables 5 and 6). Logistic regression showed insulin dose (odds ratio [OR] 2.1; 95% confidence interval [CI] 1.6, 3.0; p ≤ 0.001) and the adapting multiplier as independent predictors of a positive culture among other factors associated with nosocomial infection (Table 7).
Data presented as median (interquartile range) unless otherwise noted.
CI = confidence interval; OR = odds ratio.
The temporal relation of glucose control and infection was examined by taking the 149 patients having cultures and dividing them into those with a positive culture (Table 8) and those who had a negative culture (Table 9). We then examined measures of glucose control in the 24 h preceding and following culture.
Data presented as median (interquartile range).
Data presented as median (interquartile range).
Discussion
Tight glycemic control has become the gold standard in critical care settings around the world. Initial acceptance was based largely on a single-institution trial in a predominately cardiac population [18]. Despite this narrow study, the results have been applied to multiple critically ill populations, including trauma victims. Within these other studies, patients randomized to tight glucose control demonstrated fewer infective complications.
Many clinicians have observed that hyperglycemia usually precedes infections. In an era of tight glucose control where blood glucose is manipulated artificially, the ability to distinguish patients on the basis of this marker is diminished. Aggressive adoption of euglycemia protocols has resulted in infected patients having median blood glucose values similar to those of non-infected patients. As a result, additional measures of glucose control are needed to stratify patients. We sought to identify patients who are resistant to tight glucose control by requiring higher insulin doses and therefore having a higher adapting multiplier. Protocols are becoming more sophisticated and adapt rapidly to changes in a patient's physiology. Blood glucose is kept within a goal range, whereas insulin doses change significantly. We were able to document those patients with positive cultures, and patients with multiple positive cultures required significantly more insulin over their hospital stays.
The hyperglycemic state that occurs during critical illness is, to a significant degree, related to the development of insulin resistance induced by elevated stress hormone and cytokine response [19–21]. This stress response results in altered glucose metabolism in both the liver (non-reversible with insulin therapy) and the skeletal muscle (reversible with insulin therapy) [22–26]. Insulin resistance is defined as unresponsiveness to the normal effects of insulin and occurs when the metabolic features of insulin deficiency (hyperglycemia, increased lipolysis, and protein catabolism) are observed in the presence of normal or raised concentrations of plasma insulin [27].
In this study, we used the algorithm multiplier as a biomarker for insulin resistance. Reliable markers of insulin resistance have been difficult to identify, making the relation between insulin and blood glucose challenging. These markers of insulin resistance have focused on complex cytokine and genetic expression that make bedside evaluation difficult [28–30]. A higher multiplier, translating into a patient's receiving larger insulin doses to remain within the goal range, was associated with more infections. We have previously shown that a higher multiplier also is associated with death [31]. We have demonstrated also that the multiplier is highly variable across the surgically ill population, as well as during a patient's admission. This variability is a reflection of an individual's unpredictable response to tight insulin control. It also frames the view that the importance of a patient's response to the initiation of tight glucose control can be more predictive than the absolute numbers (mean blood glucose concentration) while on protocol.
In univariable analysis, the patients who did not have a positive culture during the admission actually had higher median glucose values. This likely was attributable to their shorter ICU stays and shorter time to reach the steady state of glucose control. In contrast, multivariable analysis showed that lower median glucose values over a patient's hospitalization decreased the chances of nosocomial infection. The strongest predictor of infection was the insulin dose, with every additional unit a patient required conferring more than a two-fold increase in the likelihood of a positive culture. This relation was present even when controlling for LOS and severity of injury at presentation.
We attempted to demonstrate a temporal relation between markers of insulin resistance and a positive culture. We found that the blood glucose concentration was nearly identical before and after cultures were obtained regardless of whether the culture was positive or negative. We had expected this result, given the effectiveness of the glucose protocol. Negative cultures had no significant differences between pre- and post-insulin resistance markers, as expected. We were unable to demonstrate a significant increase in the insulin dose preceding a positive culture. This may have been a by-product of the protocol, with only small changes in the insulin dose occurring every 2 h. It may also be a result of the anti-inflammatory actions of insulin itself. Finally, it may be that insulin resistance does not develop rapidly enough to be documented by examining only 24-h windows. The patients who expressed increased insulin resistance over their entire hospital course did indeed have a higher incidence of positive cultures, but we were unable to document a temporal relation between measures of glucose control in the 24 h surrounding acquisition of cultures.
Our prior work in a more diverse critical care population showed that patients' responses to tight glucose control are variable, and the degree to which a patient manifests insulin resistance may be predictive of outcome. This variability of response emphasizes the point that a protocol for tight insulin control must be able to adapt in real time to patient physiology. It also illustrates that the response to exogenous insulin is heterogeneous and likely an interaction of multiple genotypic and phenotypic factors that are still being established [31]. These data support the view that the individual patient's response to attempts to control the hyperglycemic response can itself be an important predictor of outcome.
One limitation of this study is our inability to control for the amount of glucose given to these patients except that they were all on a rigid nutritional protocol. Basic science research indicates that nondiabetic hospitalized patients who receive dextrose solutions at rates >4 g/kg/min (e.g., total parenteral nutrition [TPN] solutions) have a 50% chance of developing hyperglycemia [32]. There were 20 patients of the 356 who received TPN during their admissions. The patients with a positive culture did receive more TPN than those who never had a positive culture (16% vs. 1.6%; p ≤ 0.001). When excluding the patients on TPN from analysis, the insulin dose remains significantly elevated in the patients with a positive culture (3.5 units/h vs. 2.8 units/h; p < 0.001); this holds true for the multiplier as well (0.070 vs. 0.464; p < 0.001). This finding supports the idea that TPN use is correlated with a higher infection risk, but does not explain all the increase in risk associated with insulin resistance. We are unable to give the exact caloric input the patients received in this retrospective evaluation. This limitation is ubiquitous to this type of research, with multiple factors, including narcotics [33], anesthesia [34], and patient core temperature [35], all affecting glucose metabolism. It is challenging to perform tight glucose control in a vacuum, much less the complex environment of a functioning intensive care unit. We must rely on the fact that the patients were cared for according to a strict protocol using established goals and were exposed to a consistent practice pattern.
In this study, we have shown that infection risk is associated with resistance to the initiation of tight glucose control and a need for higher doses of insulin to maintain euglycemia. Patients in the positive-culture group required more insulin to stay within the desired range despite similar demographic factors. Although the retrospective nature of this paper does not permit establishing insulin resistance as the cause of the increase in morbidity, these data do suggest that insulin resistance is more pronounced in patients who have multiple positive cultures. Controlling hyperglycemia can decrease infection [18], but there still exists a group with a higher risk of infection. Early identification of these patients can lead to greater vigilance. These patients' expression of insulin resistance helps better define a population that has morbidity and mortality rates higher than their injuries would predict. Recognition of the patients at risk must serve as a warning until a time when augmentation of the underlying insulin resistance can be addressed pharmaceutically or with the aid of genetic manipulation.
Conclusions
In an era in which tight glucose control is considered standard, we continue to strive to evaluate how individual patients respond to attempts to maintain euglycemia. Insulin resistance quantified by hourly insulin dose and median multiplier confers a higher risk of systemic nosocomial infection. Patients with positive cultures actually had lower admission and median blood glucose values over their ICU stays, highlighting the lesser value of this measure as a predictor of outcome in the setting of tight glucose control. A greater insulin requirement suggesting insulin resistance can be used as a marker for a higher risk of nosocomial infection.
Footnotes
Author Disclosure Statement
This project was supported by departmental funds. The authors have no financial disclosures.