
Abstract
Abstract
Background:
Hyperglycemia caused by stress-induced insulin resistance is associated with both infection and mortality in critically injured patients. The onset of infection may increase stress-induced insulin resistance, leading to hyperglycemia. Hyperglycemia has been shown to precede the diagnosis of ventilator-associated pneumonia (VAP) in critically injured adults and has been suggested to have potential diagnostic importance. However, glycemic control (GC) protocols in critically ill patients limit the development of hyperglycemia despite increasing insulin resistance. Our computer-assisted GC protocol achieves excellent GC, limiting infection-related hyperglycemia while capturing prospectively all glucose values, insulin infusion rates, and the multiplier (M) used to calculate the insulin rate. We hypothesized that surrogate measures of insulin resistance, the insulin infusion rate and multiplier M, would increase prior to the clinical suspicion of VAP, even in euglycemic critically injured patients.
Methods:
All critically injured patients (2,656) on the computerized glycemic control protocol were included in the analysis and categorized by those developing VAP and those without pneumonia on days 3–10 of their intensive care unit (ICU) stay. Median blood glucose concentration (BG), insulin infusion rate (IDR), and multiplier (M) [Insulin Drip Rate=M*(BG-60)] were determined for VAP patients (n=329) and non-infected ventilated (NIV) patients (n=2,327) on each day of mechanical ventilation. The day of VAP diagnosis according to U.S. Centers for Disease Control and Prevention (CDC) criteria was defined as day zero and VAP patients matched with NIV patients according to ventilator day from −10 to +10. Comparisons were conducted using the Mann-Whitney U test.
Results:
Baseline characteristics between VAP and NIV groups did not differ. Measures of insulin resistance increased from the time of injury in both groups. Patients with VAP had significantly greater change in both measures of insulin resistance, IDR and M, in the 48 hours preceding the diagnosis of VAP. These changes occurred despite the fact that the computer-assisted GC protocol achieved lower glucose values in VAP patients for the majority of study days.
Conclusions:
Measures of insulin resistance increase in the two days prior to the clinical suspicion of VAP for critically injured patients on the GC protocol. These changes occur despite the protocol maintaining euglycemia. This data suggests that markers of insulin resistance may provide clinically useful information in the early diagnosis of VAP.
S

Mechanism of stress hyperglycemia and interaction with exogenous insulin [4]. Trauma and stress result in the release of cytokines (tumor necrosis factor [TNF-α], interleukin [IL]-1, IL-2, IL-6, IL-8) that in turn result in release of stress hormones (cortisol, epinephrine, norepinephrine, glucagon, growth hormone). Cytokines and stress hormones induce hyperglycemia via two mechanisms. First, they result in breakdown of skeletal muscle (proteolysis) and adipose tissue (lipolysis) with shuttling of amino acids (alanine and glutamine) and glycerol, respectively, to the liver for gluconeogenesis. Secondly, cytokines and stress hormones induce insulin resistance through impairment of the IRS-1 and GLUT-4 transporters and decreased levels of adiponectin; thus insulin is unable to be bound to receptors in the skeletal muscle and adipose tissue. Hyperglycemia, largely from excess gluconeogenesis, in turn contributes to further oxidative stress, resulting in a vicious cycle of further cytokine and stress hormone release. Exogenous insulin, administered as part of a glycemic control protocol, alleviates hyperglycemia; however, it is not clear to what degree administration of exogenous insulin affects insulin resistance.
Although critically injured patients manifest hyperglycemia typically, further increases in BG frequently precede infectious complications [1–3], including pneumonia. The onset of infection may increase stress-induced IR, leading to hyperglycemia. These changes have been suggested to have potential diagnostic utility in the diagnosis of ventilator-associated pneumonia (VAP) in critically injured adults [2]. However, GC protocols in critically ill patients limit the development of hyperglycemia despite increasing insulin resistance. Our institution's computer-assisted GC protocol achieves excellent GC, limiting infection-related hyperglycemia while capturing prospectively all glucose values, insulin infusion rates, and the multiplier used to calculate the insulin rate. Several studies have demonstrated that in the setting of a computer-assisted GC protocol with continuous insulin infusion, serum glucose measures no longer maintain their association with outcome whereas measures of IR do correlate with infection and mortality [11,12]. However, no studies have examined whether changes in IR precede the clinical suspicion and diagnosis of VAP in the setting of computer-assisted glycemic control. We hypothesized that surrogate measures of IR, the insulin infusion rate and multiplier M, would increase prior to the clinical suspicion of VAP despite euglycemia while on a computer-assisted GC protocol.
Patients and Methods
Patient population
All critically injured, mechanically ventilated adults admitted to our level I academic trauma center and who were placed on a computer-assisted GC protocol between January 2005 and April 2012 were included in the analysis (n=2,656). For study inclusion, patients were required to be ventilated for at least 48 h in accordance with the U.S. Centers for Disease Control and Prevention (CDC) definition of VAP [13], and patients were categorized as VAP and non-infected ventilated (NIV) patients. Continuous infection surveillance is maintained for all critically ill patients by independent infection practitioners and all mechanically ventilated patients suspected clinically of VAP undergo bronchoalveolar lavage and semi-quantitative culture. The date of bronchoalveolar lavage is defined as the date of diagnosis of the pneumonia. Standard CDC criteria were used to define VAP. All patients were also required to have been on the GC protocol for at least five episodes of glycemic data, as we have shown previously that patients require between four and five data points (10–12 hours) to achieve euglycemia consistently [3,14,15]. To determine the possible confounding effects of other infections, we recorded which patients had blood stream or urinary tract infections.
Insulin protocol
Vanderbilt University Medical Center utilizes a computer-assisted GC protocol for all critically injured, mechanically ventilated patients with hyperglycemia that utilizes continuous-infusion insulin that is adjusted based upon BG values obtained every two hours. During the period of study, the protocol targeted BG between 80 and 110 mg/d/L [1,3,5]. The insulin infusion is adjusted every two hours utilizing a linear equation:
Where IDR represents the infusion rate of intravenous insulin in U/h. The multiplier M is an adaptable multiplier that is a surrogate for the patient's innate level of IR; M is set initially at 0.03, can never fall below zero, and is adjusted based on BG (Table 1) [3,14]. As M is related to both BG and insulin infusion rate, it is believed to be a more accurate surrogate of IR than either measure alone. A more detailed discussion of how the protocol adjusts to a change in IR is presented in Figure 2. All values for BG, IDR, and M are captured by an electronic data warehouse along with date, time, nutritional supply, and any supplemental dextrose administered. The computer-assisted GC protocol improves GC over manually titrated methods with roughly 80% of all glucose values falling into the 80–150 mg/dL range and fewer than 0.2% of values being less than 40 mg/dL [1,3,15,16].
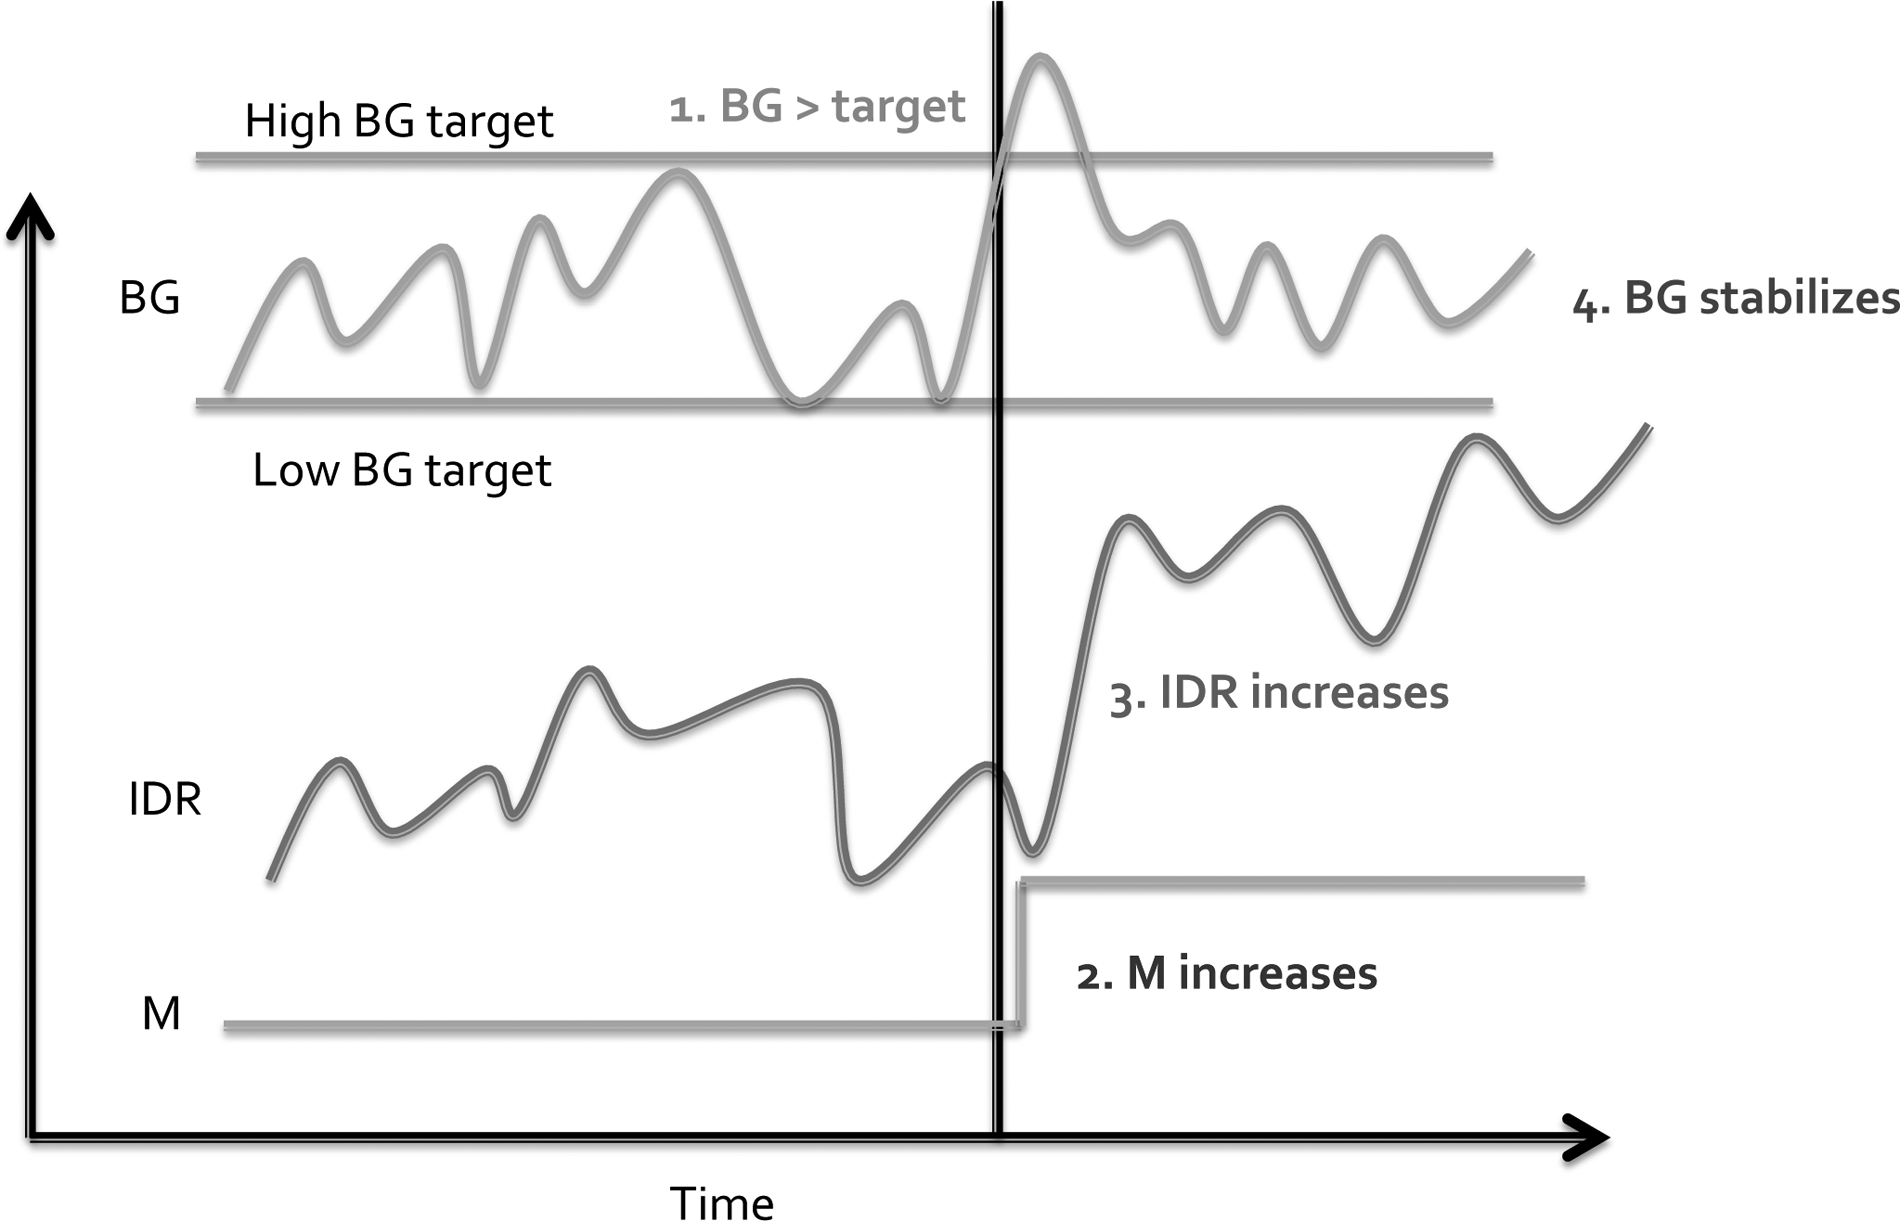
Response of the computer-assisted insulin infusion protocol to a change in insulin resistance (IR). Changes in IR for a particular patient could be caused by the onset of an infection, such as ventilator-associated pneumonia. This disturbs the steady state of glycemic metabolism that existed previously in the patient, in which blood glucose (BG) stayed within the target range in response to small changes in the insulin infusion rate with a steady value of M.
D50W=50% dextrose in water.
Analysis of blood glucose
Point-of-care BG measurements were obtained using the SureStep® Pro (One-Touch®) Professional Blood Glucose Monitoring System (Lifescan Inc., Milpitas, CA; http://www.lifescan.com/professionals/products/sspro/). Measurements are obtained every two hours except after hypoglycemic events (BG<60 mg/dL), which mandate a BG measurement after one hour.
Glucose and Nutritional Provision
Critically injured patients did not receive intravenous glucose during their acute resuscitation. After initial resuscitation, patients are started on a glucose-containing maintenance fluid until enteral nutrition can be initiated. Patients on the computer-assisted insulin infusion protocol have 10 percent dextrose solution at 30 mL/h administered until nutritional provision is initiated if their BG falls below the normal range. By protocol, enteral nutritional support is administered as soon as deemed safe by the attending physician with a goal of initiating by 48 h if no contraindication exists. In patients for whom 70% of estimated nutritional need cannot be provided enterally by the seventh day of hospitalization, parenteral nutrition is initiated. Our nutritional support protocols are in accordance with established protocols with 20–24 non-protein kCal/kg of body weight per 24 h [15,17]. These protocols do not change if an infection is suspected; however, detailed information on provision of calories and fuel mix was not available for this study.
Data collection
Vanderbilt University Medical Center is an academic level 1 adult trauma center that maintains a fully implemented electronic medical record for all patient orders, charting, and documentation. Patient factors including age, gender, body mass index, hospital and intensive care unit (ICU) admission and length of stay, ventilator use, infectious complications, and severity scoring, insulin therapy, BG values, and other data are captured in real-time and collected in a secure IRB-approved electronic data repository. We retrieved the data electronically into a password-protected, de-identified study database that was used subsequently for analysis.
Date matching
To assess whether changes in measures of IR differed in patients prior to the development of VAP versus those without infection, a time-from-event analysis was performed in which the CDC VAP diagnosis date was normalized to zero and non-infected patients were matched according to ventilator day. This approach differs from the traditional time-to-event approach, as diagrammed in the upper portion of Figure 3. Although the traditional time-to-event approach is appropriate to determine the effect of IR on the incidence of VAP, this does not fit our goal of determining what effect the development of VAP would have on IR for a particular patient. Therefore, a date-matching approach was utilized, as observed in the lower portion of Figure 3. The CDC VAP diagnosis date is normalized to zero. Glycemic control data in VAP patients are tracked from up to 10 d before to 10 d after the event. A corresponding set of VAP-negative patients with glycemic control data is created for each ventilator day from three to 10, allowing VAP and non-VAP patients to be compared on the same time scale and removing time on the ventilator as a confounding variable between the VAP and non-VAP groups.
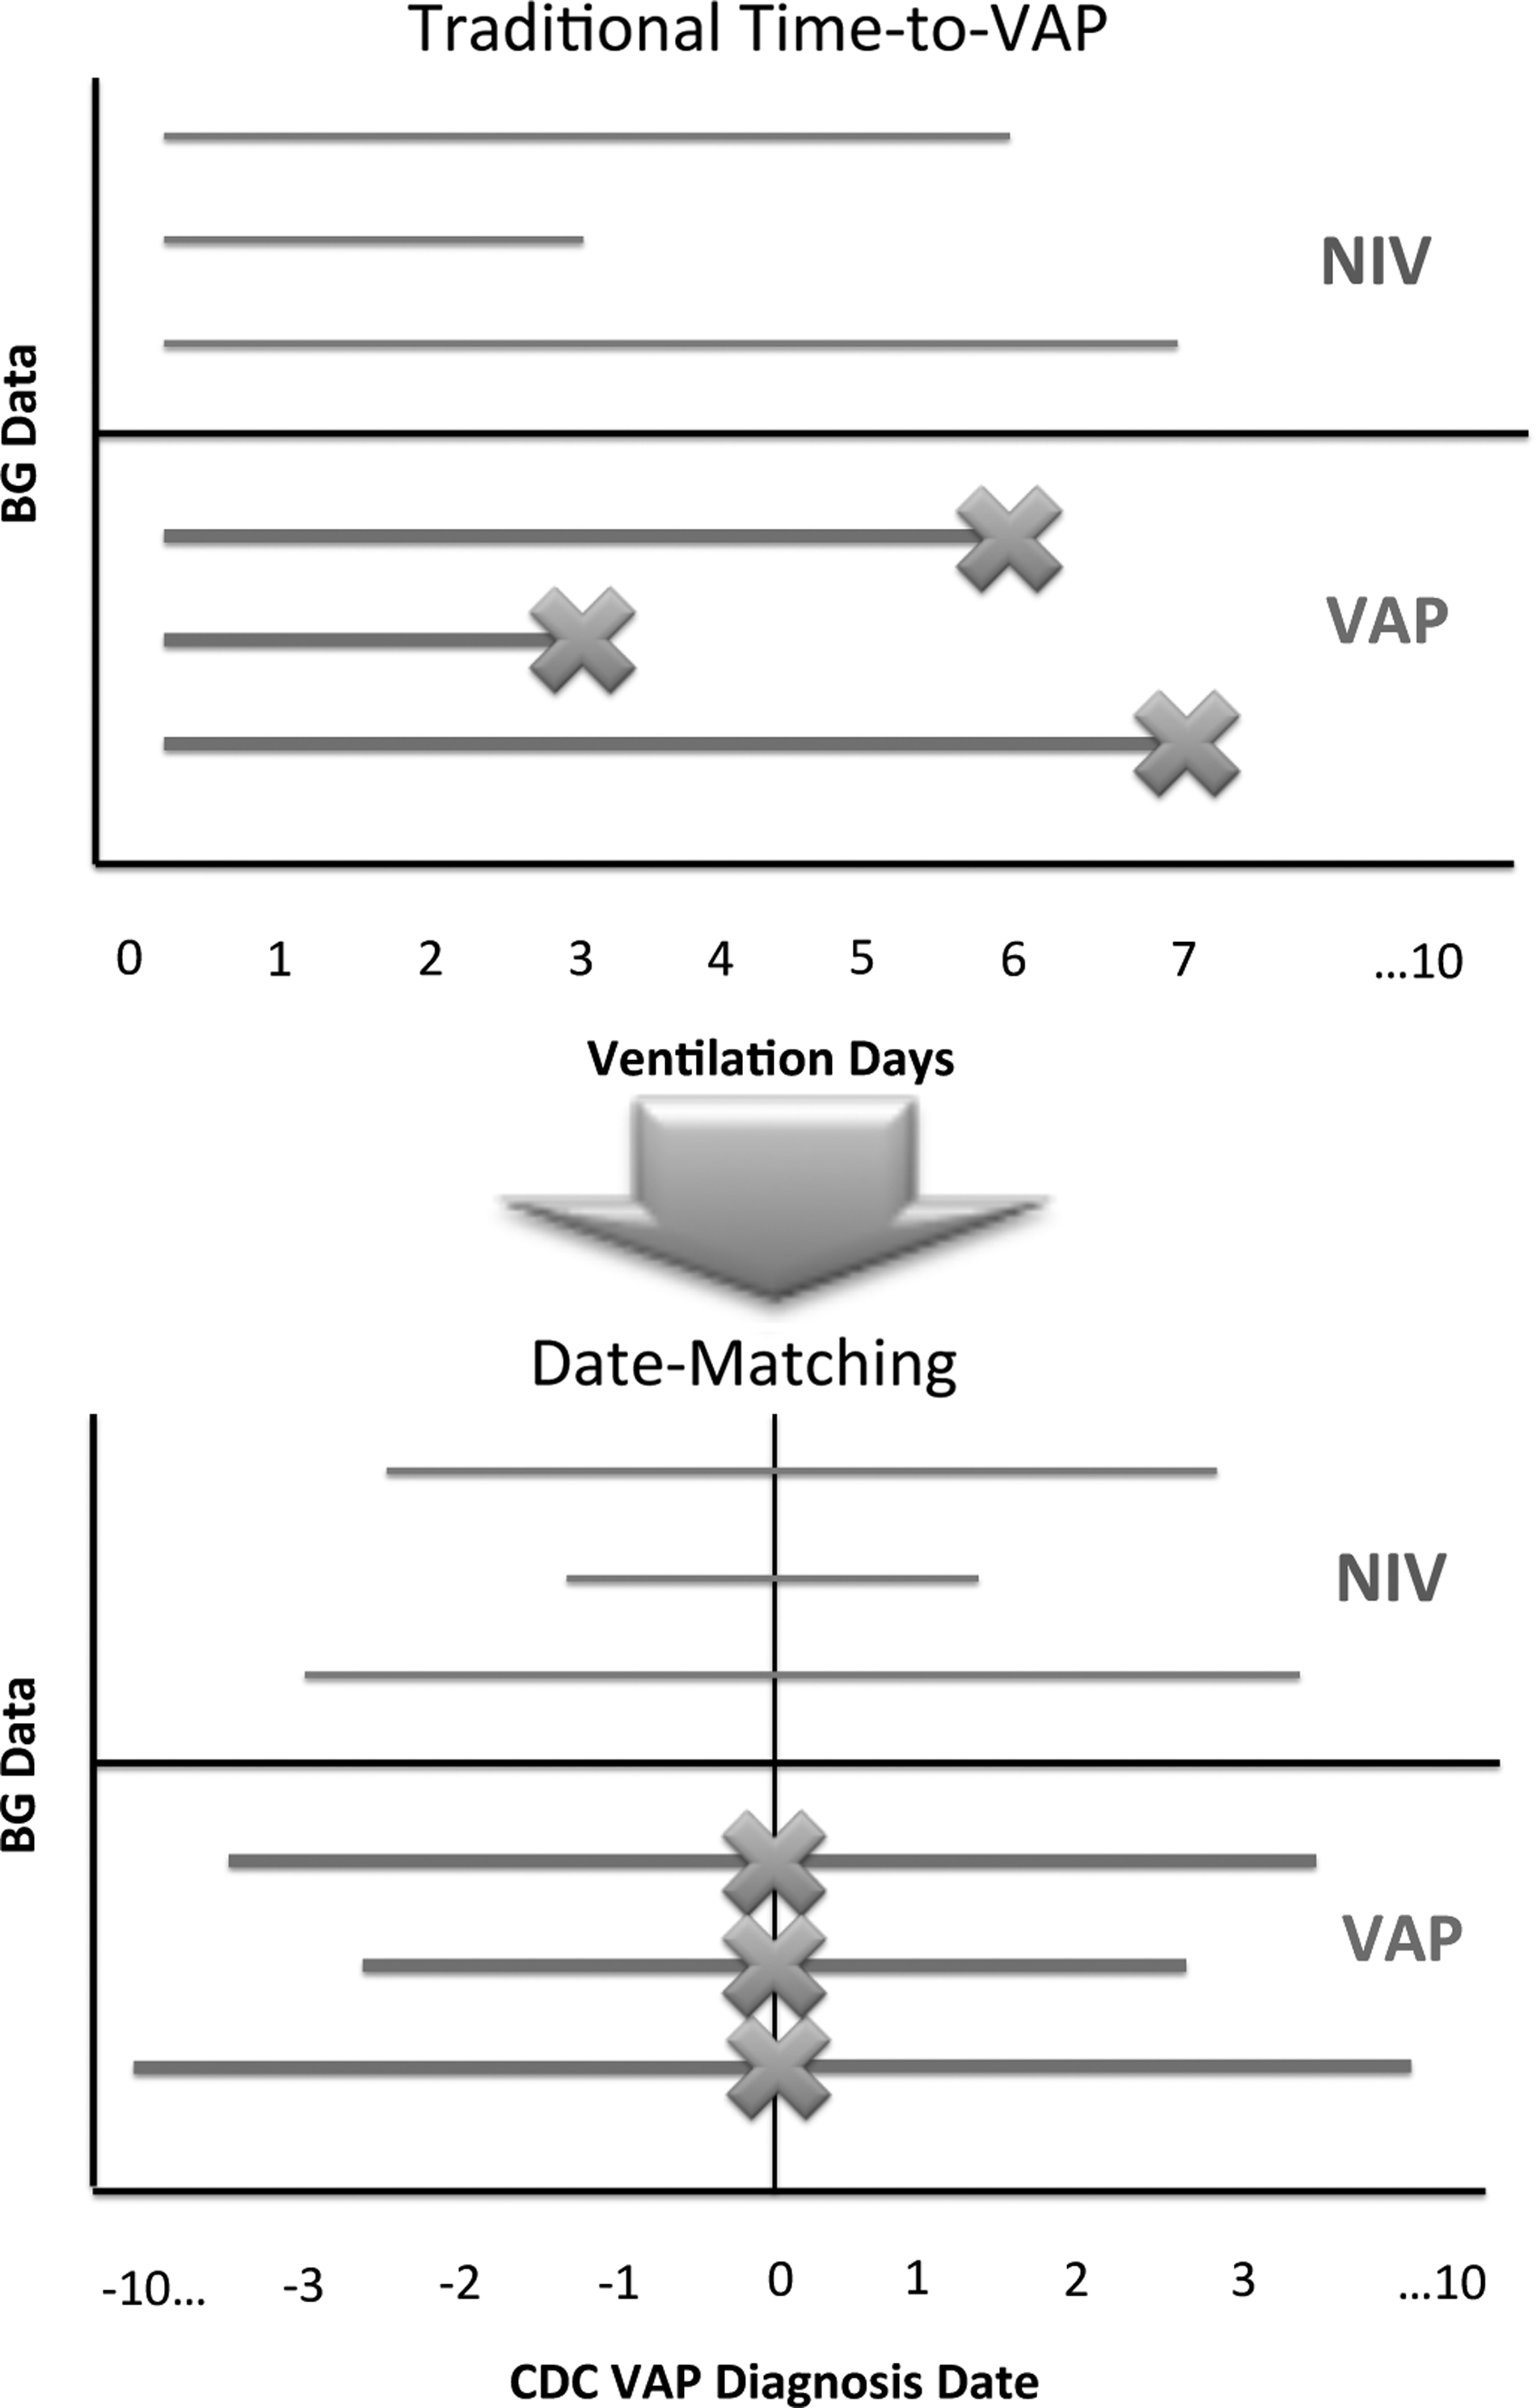
Date matching methodology. The traditional approach to studying ventilator-associated pneumonia (VAP) involves a time-to-event approach (top). This method was not helpful for our analysis as we sought to determine what effect an impending VAP had on insulin resistance. We therefore chose an alternative analysis method, which could be called time-from-event analysis (bottom). In the VAP group, the date of U.S. Centers for Disease Control and prevention (CDC) VAP diagnosis was normalized to day zero, and glycemic data was tracked from up to 10 d before to 10 d after the VAP. For non-VAP patients, a cohort of patients with glycemic control data for each ventilator day from 3 to 10 was created; this allowed the VAP and non-VAP patients to be compared on the same time scale and eliminated the number of days on the ventilator as a confounder.
Outcome measures
Ventilator-associated pneumonia was defined according to guidelines established by the CDC (Table 2) [13]. Vanderbilt University Medical Center maintains continuous infection surveillance in the ICUs by independent infection control practitioners. By protocol, all patients suspected clinically of possible VAP undergo bronchoscopic bronchoalveolar lavage (BAL) for semi-quantitative culture. The ICUs maintain their own bronchoscopic equipment and in-house faculty 24/7. Patients are begun on protocol-directed empiric antibiotic coverage and antibiotics are de-escalated when culture results are available. Cultures with >104 colony-forming units (CFU/mL) of bacteria are considered positive for pneumonia.
Per protocol all suspected VAP patients undergo bronchoscopy with quantitative culture.
CXR=chest xray; CX=culture; BAL=brachioalveolar curvage; CDC=U.S. Centers for Disease Control and Prevention.
Glycemic control measurements for individual patients studied included daily median BG in mg/dL, daily median IR rate in U/h, and daily median value of the multiplier M (dimensionless).
Statistical and power analyses
Continuous variables were described by their median with (bracketed) interquartile range and compared using the Mann-Whitney U test. A two-sided p value <0.05 was considered to be statistically significant. SPSS version 20.0 (IBM Corporation, Armonk, NY) was utilized for statistical analysis and for management of data obtained from the electronic repository after transfer from Excel (Microsoft Corporation, Redmond, WA). Categorical data were analyzed using the Pearson chi-square test.
A post-hoc power analysis was performed to determine the statistical power available based on the extant number of patients in the study. For insulin infusion rate, previous data indicated that the standard deviation is 3.55 mL/h, and we anticipated that a difference in insulin infusion rate of 0.75 mL/h was clinically meaningful. This reveals a statistical power of 92.2% to detect the above difference at the α level of 0.05. For the insulin multiplier M, the daily standard deviation of M was 0.056 based on previous data. We considered a difference in M of 0.03 to be clinically meaningful. This revealed a statistical power of>99% to detect the above difference at the α level of 0.05.
Study design and regulatory approval
Our study was approved by the Vanderbilt University Medical Center Institutional Review Board (IRB) under an exempt protocol that waived any further review, as well as the need for informed consent, based on perceived minimal patient risk (IRB# 121002, approved July 3, 2012.). This study, as a large risk-controlled retrospective study in a homogenous population with a significant effect and less than 20% rate of missing data, qualifies as Level II evidence.
Results
Comparison of baseline demographic data for patients with and without VAP
During the study period, 2,656 critically ill, mechanically ventilated patients were placed on the insulin protocol and included in the analysis. Baseline demographic data for patients with and without ventilator-associated pneumonia were compared statistically due to the non-randomized retrospective nature of the study, as shown in Table 3. VAP (n=329) and NIV (n=2,327) patients had no statistically significant differences in age, race, weight, body mass index (BMI), or concomitant blood stream and urinary infection rates. As expected, patients with VAP had longer hospital and ICU lengths of stay and longer durations of ventilator and inotropic support.
p value is determined using the Mann-Whitney U test for continuous variables, Fisher exact test for categorical variables filling a 2 x 2 matrix, and Pearson chi-square test for other categorical variables. Bracketed values represent the interquartile range (IQR) for the median values.
Distribution of raw data for serum blood glucose
To examine whether glycemic control differed between VAP and NIV patients, we looked at the proportion of BG values in each group that is within the ideal BG range of 80–150 mg/dL. Surprisingly, VAP patients had lower BG concentration than NIV patients. Median admission blood glucose values were nearly identical (156 mg/dL [129,200] for NIV versus 155 mg/dL [123,203] for VAP, p=0.663). The distribution of the BG values for patients with and without VAP is displayed in Table 4. patients in the NIV group (top line) show a broader distribution of serum BG values than VAP patients, whereas VAP patients had a higher proportion of BG values less than 80 mg/dL (7.7% vs. 6.6%), a higher proportion of values between 80 and 150 mg/dL (80.7% vs. 78.6%), and a lower proportion of values>150 mg/dL (11.6% vs. 14.8%) (bottom line). The proportions were significantly different by Pearson chi-square test (p<0.001).
p value represents a Pearson Chi-square test. Glucose values included are from the entirety of the ICU stay for all patients in both groups.
NIV=non-infected ventilated patients; VAP=ventilator-associated pneumonia.
Glycemic parameters in patients with and without VAP
To examine whether median daily BG, insulin drip rate, and the modifier differed between VAP and NIV patients, we assessed these parameters in both groups after matching for days of ventilation. Patients with VAP (n=329) were date-matched, as diagrammed in Figure 3, to NIV patients (n=2,327). Patients with VAP had lower median BG concentrations than date-matched NIV patients for 15 of 21 d during the study period, indicating a paucity of hyperglycemia in the VAP patients (Fig. 4A) and corroborating the data obtained from the scatterplots. The inset chart shows the p values obtained by the Mann-Whitney U test for selected days, indicating a high degree of statistical significance. The VAP patients had lower insulin infusion rates than NIV patients on days −7 to −3 and days +3 to +4, but higher infusion rates on day +1, indicating a more rapid increase in insulin infusion rates for VAP patients during this period (Figure 4B). Patients with VAP also had higher median insulin multiplier values, corresponding to higher IR, on days −2 to +2 and days +6 to +7. There was a more rapid increase in insulin multiplier around the time of the CDC VAP diagnosis (days −2 to +2) (Fig. 4C); again these data are corroborated by the inset chart, showing an increase in the excess M in the VAP group.
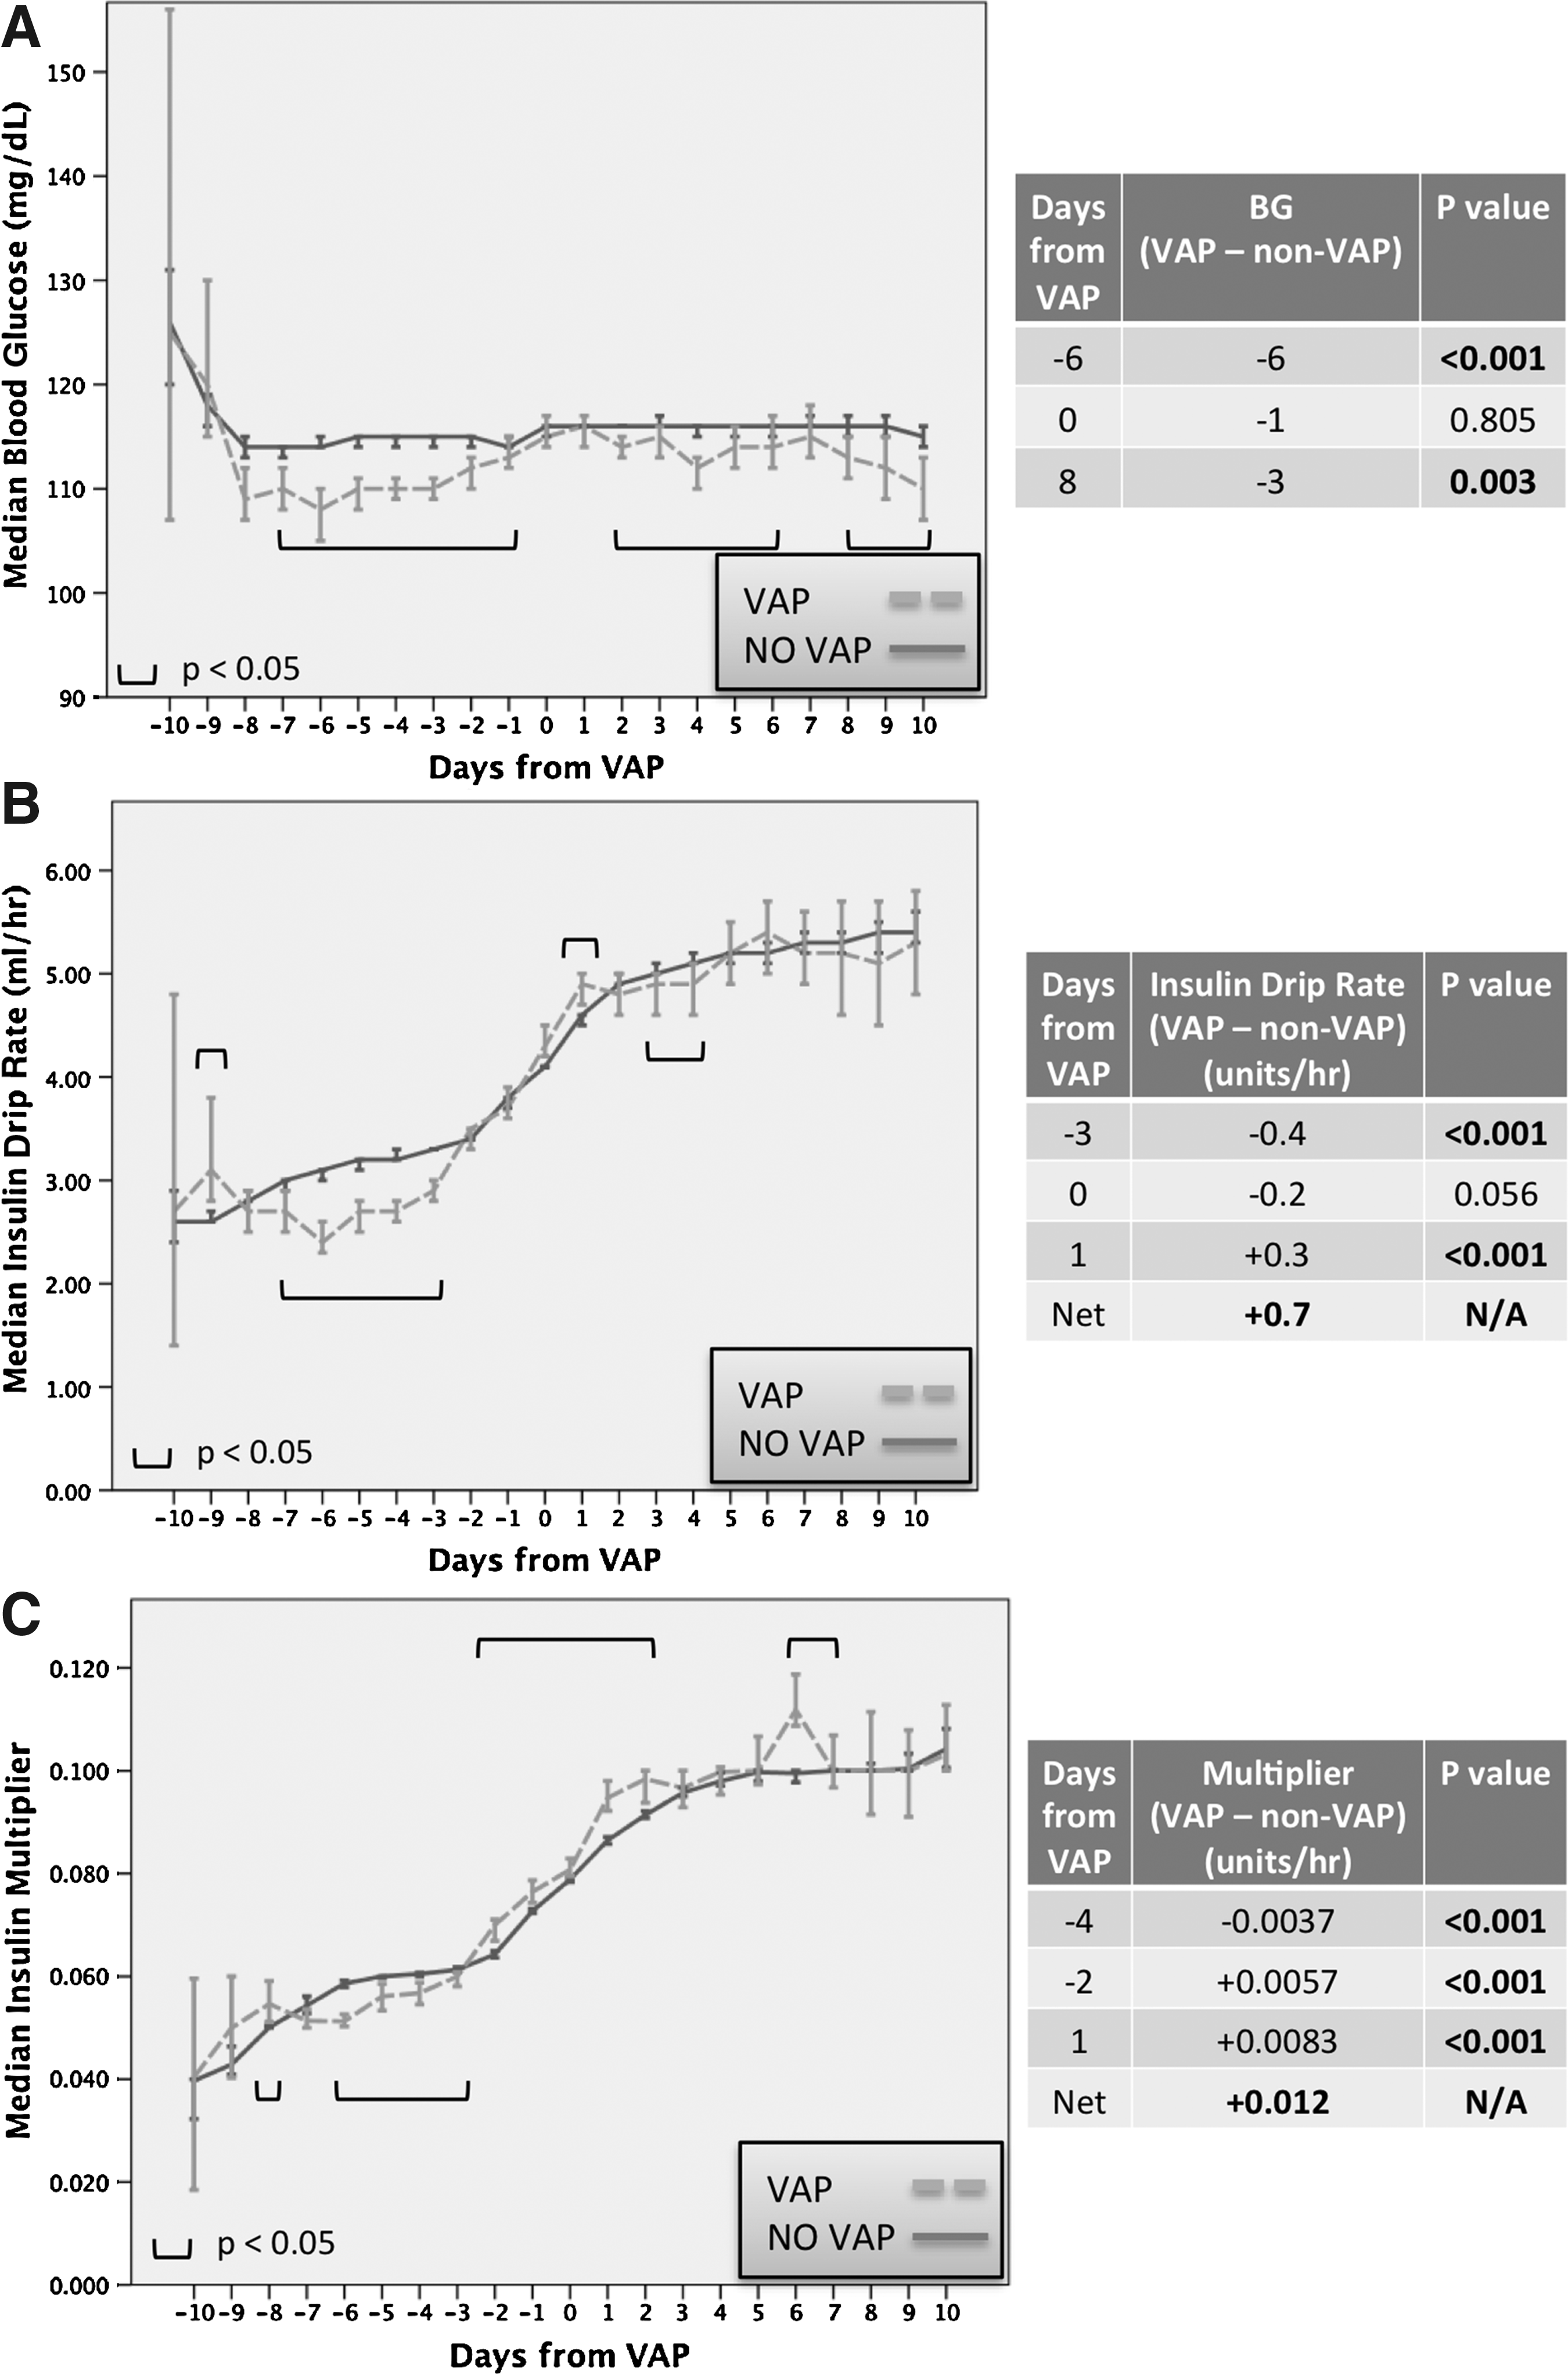
Differences in glycemic parameters between ventilator-associated pneumonia (VAP)+and non-infected ventilated (NIV) patients. Patients with U.S. Centers for Disease Control and Prevention (CDC) VAP diagnosis date on d 3 to 10 of mechanical ventilation (n=329) were matched by date to patients without a VAP who had glycemic data from d 3 to 10 of mechanical ventilation (n=2,327) (
Discussion
This study validates our hypothesis. First, there is a measure of IR, in our case the M multiplier, that increases as much as 2 d prior to the signs and symptoms of VAP as based on CDC criteria and 3 d prior to a significant increase in the insulin infusion rate. Moreover, the M multiplier changed despite tight glycemic control and without significant hyperglycemia. Therefore, a computer-assisted screening algorithm, based on the M multiplier, may be developed for early detection of VAP and other infections. If validated prospectively, after controlling for nutrition, baseline diabetes mellitus, and other comorbidities, this would create a powerful tool to enable earlier detection of infections. Furthermore, an early screening test for VAP or other infections would allow for earlier antibiotic therapy and resultant improved survival.
There were no significant baseline differences between VAP and NIV patients. Rates of concomitant infections are similar; thus it is unlikely that observed differences in IR are correlated with an infection other than VAP. Patients with VAP required longer hospital and ICU stays and longer duration of mechanical ventilation and inotropic support, as would be expected.
Our scatterplot data show that hyperglycemia and IR are not synonymous. Interestingly, more hyperglycemia exists in NIV patients, even though VAP patients are more insulin-resistant. Patients with higher IR are more dependent on external insulin to maintain their glycemic control; thus, one might actually expect them to be easier to control with exogenous insulin. Studies of obese patients undergoing weight-loss operations with euglycemic hyperinsulinemic clamp experiments to test their IR have noted similar effects [18,19]. Thus, in the era of strict (or even moderately strict) BG control, the relation between IR and hyperglycemia is no longer correlated directly. Certainly, patients who are persistently hyperglycemic in the face of aggressive insulin therapy are at high risk of complications [14], but patients may also display euglycemic IR (E-IR), particularly if their BG concentration is being controlled tightly.
Validating this point further, the VAP group actually had lower BG than NIV patients, but both VAP and NIV patients had progressively higher values of M with more time on the glycemic control protocol. In the past we have associated time on intensive insulin therapy with glycemic abnormalities such as hypoglycemia [20], so it is possible that the duration of insulin therapy could contribute to IR as well. The rate of increase in insulin requirement is higher in VAP patients. Our future work will focus on studying these rates of change in parameters of IR while simultaneously controlling for other variables, including nutrition, time on the insulin protocol, and the onset of infection.
Nutritional provision would also contribute to the increase. Although we did not control for caloric intake, in this study our protocol includes prompt enteral feeding or initiation of parenteral nutrition by day seven of admission if enteral feeds are contraindicated. Therefore, differences in caloric provision between the VAP and NIV patients are unlikely unless there was a systematic bias in our feeding protocols or a systematic intolerance of feeding associated with VAP. These two possibilities would have opposite effects.
The multiplier M is actually the best measure of IR, as it considers the current BG and the insulin requirement together in its measurement. Patients with varied degrees of IR may have the same BG (if their insulin infusion rates are different) or the same insulin infusion rates (if their BG concentrations are different); but in both cases the value of M in the patient with greater IR would be elevated. Although our M value is specific to our glycemic control protocol, it would certainly be possible to extend it to insulin protocols utilized at different institutions.
Additional limitations of this study include its retrospective, single-center analysis. We are utilizing this study as a basis for future prospective work at our institution. Multi-center work is also possible, although this would require a standardized glycemic control protocol across all study institutions.
The strengths of this study include the dense glycemic data capture provided by our electronic data repository and the large population of patients, thus conferring additional statistical power. The date-matching algorithm used to generate a day-by-day control group for the patients who developed VAP eliminated the number of ventilator days as a confounder. Our experience with the computer-assisted glycemic control protocol at our institution [1,3] was also crucial.
The relations among trauma, BG, muscle, liver, adipose tissues, and oxidative stress is complex. In the acute post-injury period, IR may come directly from the stress of the injury itself. Additional causes of IR may include administration of nutrition or development of infection. Exogenous insulin reduces hyperglycemia dramatically, potentially reducing oxidative stress that results in a vicious cycle of stress, cytokine release, and hyperglycemia. However, it remains unclear how the administration of insulin affects the conditions that initiate IR, including inherent traumatic stress, prolonged duration in the ICU, catecholamine effects resulting from multiple surgical procedures, effects of prolonged ventilation on the bacterial milieu of the lungs, and other infectious etiologies. Future studies involving euglycemic hyperinsulinemic clamp experiments in critically injured patients may expand our knowledge of the underpinnings of stress hyperglycemia and euglycemic IR.
Conclusions
In this era of glycemic control as ICU standard-of-practice, it is imperative to examine the resulting glycemic profile changes in critically ill patients. Due to aggressive glycemic control protocols, hyperglycemia may be more rare than reported previously. Therefore, there is a need to identify and monitor markers of IR, such as the M multiplier, as they adjust for changes in a particular patient's IR. We anticipate future prospective trials validating prediction tools for early diagnosis of infection or other events that promote IR. These prediction tools would prompt earlier intervention and therapy, ultimately reducing morbidity and mortality and improving patient outcomes.
Footnotes
Author Disclosure Statement
No authors had any conflicts of interest to disclose. Two authors (KM and KJS) were funded by a research grant from the Surgical Infection Society Foundation for Education and Research.