
Abstract
Background:
Post-operative infections have many negative consequences for patients' health and the healthcare system. Among other things, they increase the recovery time and the risk of re-admission. Also, infection results in penalties for hospitals and decreases the quality performance measures. Surgeons can take preventive actions if they can identify high-risk patients. The purpose of this study was to develop a model to help predict those patients at risk for post-operative infection.
Methods:
A retrospective analysis was conducted on patients with colorectal post-operative infections. Univariable analysis was used to identify the features associated with post-operative infection. Then, a support vector classification-based method was employed to select the right features and build prediction models. Decision tree, support vector machine (SVM), logistic regression, naïve Bayes, neural network, and random forest algorithms were implemented and compared to determine the performance algorithm that best predicted high-risk patients.
Results:
From 2016 to the first quarter of 2017, 208 patients who underwent colorectal resection were analyzed. The factors with a statistically significant association (p < 0.05) with post-operative infections were elective surgery, origin status, steroid or immunosuppressant use, >10% loss of body weight in the prior six months, serum creatinine concentration, length of stay, unplanned return to the operating room, administration of steroids or immunosuppressants for inflammatory bowel disease, use of a mechanical bowel preparation, various Current Procedural Terminology (CPT) codes, and discharge destination. However, accurate prediction models can be developed with seven factors: age, serum sodium concentration, blood urea nitrogen, hematocrit, platelet count, surgical procedure time, and length of stay. Logistic regression and SVM were stable models for predicting infections.
Conclusion:
The models developed using the pre-operative features along with the full list of features helped us interpret the results and determine the significant factors contributing to infections. These factors present opportunities for proper interventions to mitigate infection risks and their consequences.
Surgical site infections (SSI) have become a focal point for evaluating outcomes after colorectal surgery. They are a significant cause of morbidity and increased healthcare costs as they prolong hospital stays, increase re-admission rates, and can mandate additional procedures [1,2]. Every SSI occurrence adds at least $17,000 to an individual's bill, which results in approximately $1.6 billion in direct costs yearly in the United States [1,3]. Estimated rates of infections after colectomy range from 3% to 25% [4,5].
Multiple risk factors have been linked to high incidences of SSIs in colorectal operations. However, there is wide variation between studies when looking at specific variables, and not one single intervention has been shown to decrease SSI rates definitely [6,7].
Data mining, a concept that originated in the middle of the 1990s, is the process of finding patterns, clustering, and classifying data to obtain insights and knowledge and build models to predict outcomes [8]. These techniques are used widely in many areas outside healthcare. In healthcare systems, data mining is applied increasingly because of the power of its techniques to analyze complex and voluminous data. Data mining can facilitate decision making by identifying hidden patterns and trends in complex data. The analysis can help hospitals and healthcare systems reduce costs, increase revenue, and enhance operating efficiency.
Data mining applications in healthcare include identification and classification of at-risk populations and the discovery of patterns in the treatment of diseases. There is an extensive application of mining algorithms in clinical decision making (diagnosis, choice of treatment, and prognosis prediction) and administrative decision making (staff estimation, market trends analysis, process improvement, and insurance payments management) [9].
The purpose of this study was to develop and compare various prediction models using data mining techniques and determine the best-performing model in identifying those patients who are more likely to develop SSI after colectomy.
Patients and Methods
After approval was obtained from the Institutional Review Board, data were collected from a tertiary referral hospital in Georgia using the electronic medical records. Patients admitted from 2016 through the first quarter of 2017 who underwent colorectal resection were included in the study. We observed that 18 of the 208 patients having colorectal surgery during that period developed post-operative infections. The data were used to develop models to predict such infections. Table 1 lists the 38 patient characteristics examined and compares these features in the infected and non-infected patients. Continuous variables are reported as median values and categorical variables as the number and percentage of patients. Significant differences between infected and non-infected patients were evaluated with a t-test for continuous features and a χ2 test for categorical features.
Patient Characteristics
BMI = body mass index; BUN = blood urea nitrogen; CPT = current procedural terminology; SIRS = systemic inflammatory response syndrome; SSI = surgical site infection; WBC = white blood cells.
Dummy variables
For a qualitative attribute that has two or more categories, representing each level by a number (1, 2, 3, and so on) does not make sense because these numbers are used to indicate various categories of that attribute and do not have intrinsic meaning of their own. Thus, artificial variables are created that take values of 0 or 1 to indicate whether the sample does or does not belong to the specific category of the attribute. These artificial variables are called “dummy” variables, and the technique is widely used in regression, logistic regression, and other data mining algorithms [10]. For instance, to identify various categories of incision classification (clean, clean/contaminated, contaminated, and dirty/infected), three dummy variables are created as substitutes for the original variable in the dataset. These dummy variables are binary, so 1 indicates membership in the class; 0 means the class does not apply. The dummy variables used for incision are incision_clean/contaminated, incision_contaminated, and incision_dirty/infected. The original dataset's category of clean was eliminated because if all three of the dummy variables have a value of 0, the incision is regarded as clean.
There are 38 characteristics in the dataset that are continuous (e.g., age) or categorical (e.g., incision type). Applying the dummy variable technique, the total number of features is 83.
Feature Selection
Usually, not all the features are relevant and useful for application in prediction models. Feature selection or variable selection is a technique that tries to choose the best features that contain the most useful information to predict the dependent variable [11]. Feature selection removes irrelevant and redundant features and can improve the performance of prediction algorithms [12]. Feature selection techniques reduce the complexity of generated models and result in more cost-effective predictors; because the techniques hunt for the most valuable features, they provide a better understanding of the importance of the features [13].
There are three classes of feature selection techniques: filter, wrapper, and embedded. Filter methods select a variable for inclusion in the subset of best predictors based on some scores and independent of any prediction algorithms; for instance, the correlation between the independent variables and the dependent variable. In wrapper methods, the prediction model evaluates the interaction between variables and selects the combination that has the best predictive power. Embedded methods perform feature selection as part of a training procedure and add a penalty to an objective function to eliminate the insignificant variables [13].
In this study, an L1_based feature selection technique, linear support vector classification [14], was applied to select the non-zero coefficient and reduce the dimensionality of the data for various prediction algorithms. This technique can be classified as a wrapper method that not only considers the impact of the individual factors on the dependent variable but also the relation between selected variables. So, a set of factors will be selected that can classify the dependent variable efficiently.
Imbalanced data
In general, most prediction algorithms perform better if the dataset is balanced; i.e., the ratios of the positive and negative cases are almost equal [15]. However, in the current dataset, only 8.7% (18 of 208) of the cases were positive (i.e., infected). The class that has the most members is considered the dominant class.
Many techniques have been used in data mining to deal with imbalanced data. The random under-sampling technique tries to eliminate samples randomly from the dominant set to obtain balanced classes [16]. The disadvantage of this technique is that important information can be lost by eliminating the majority of cases. On the contrary, in the random over-sampling technique [16], random cases of the minority class are replicated to balance class distribution. This can increase the risk of overfitting, as it generates exact copies of the minority examples. Thus, in this study, a heuristic method, the synthetic minority over-sampling technique (SMOTE) [17], was used to over-sample the minority cases by generating a new sample between two adjacent minority samples. Thus, SMOTE can prevent overfitting of the trained model and help the prediction algorithm perform better in learning from a dataset.
Performance measurements
Each prediction model produces a discrete output that indicates the class label of the predicted instance. When there are two classes (infected and not infected or positive and negative), we have four possible outcomes: if the patient is a positive case and is predicted to be positive, it is counted as true positive (TP) and if predicted as negative, it is counted as false positive (FP). Also, if the patient is a negative instance and is predicted to be negative by the model, we have a true negative (TN) case, and if predicted to be positive, it is counted as false negative (FN). A two-by-two matrix, called a confusion matrix, can be constructed from the four outcomes that will demonstrate how well the model predicts the class of the instances (Fig. 1).
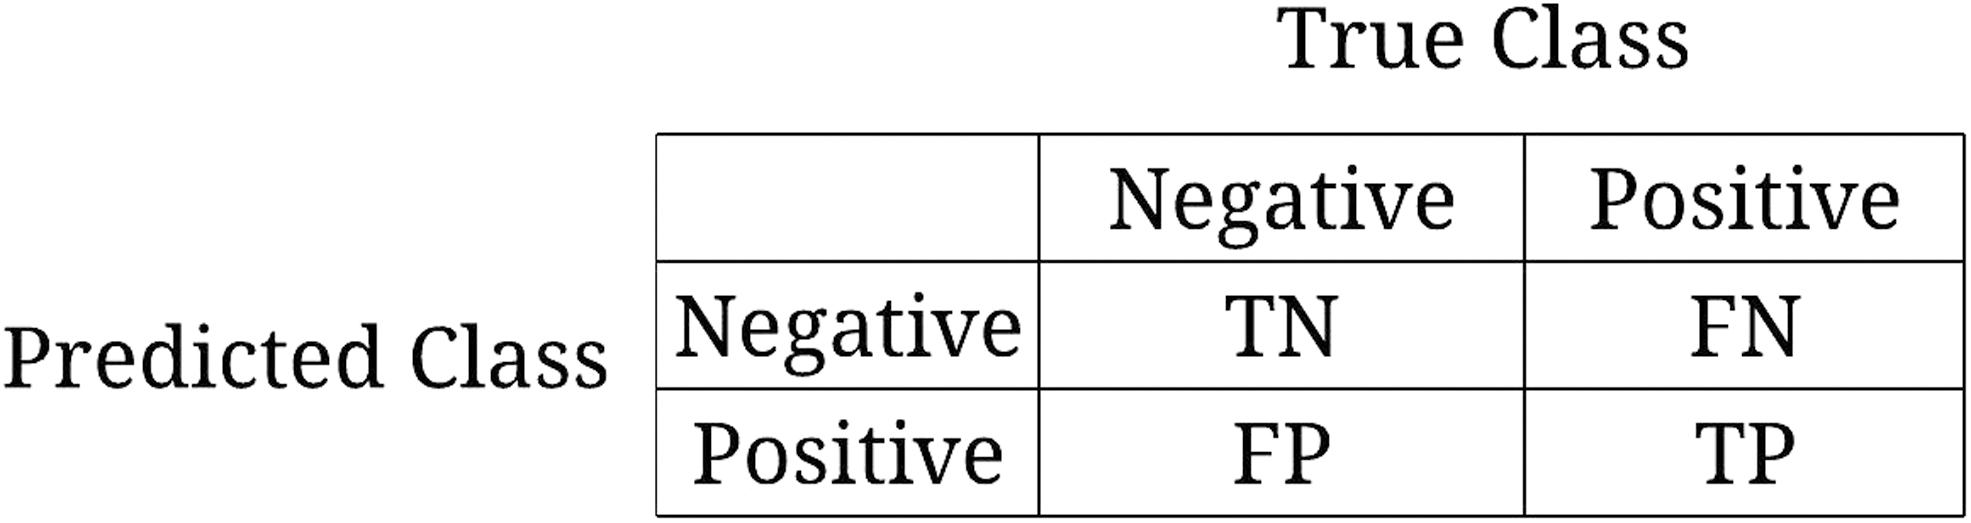
Confusion matrix. TN = true negative; FN = false negative; TP = true positive; FP = false positive.
The measures used to assess the algorithms' performances in predicting the class of the instances are accuracy, sensitivity, specificity, and precision.
Accuracy shows the percentage of patients whose infection status is predicted correctly:
Sensitivity shows the proportion of infected cases that are correctly predicted to be positive:
Specificity represents the percentage of the not-infected cases that are correctly predicted as negative:
Precision illustrates the percentage of cases that are predicted to be positive and actually develop infections:
Another important measurement is the receiver operating curve (ROC), which illustrates the true positive rate (TPR) on the Y axis against the false-positive rate (FPR) on the X axis. A powerful prediction model would score near the upper left-hand corner (higher TPR, lower FPR). This diagram can be used to compare various prediction models' performances with each other. In fact, any model that has a larger area under curve (AUC) of ROC (closer to 1) is a better method for predicting the class of the instances [18].
Six prediction algorithms were used to predict the class (infected or not infected) of the patients. These are naïve Bayes (NB) [19], decision tree (DT) [19], logistic regression (LR) [19], SVM [18], artificial neural network (ANN) [20], and random forest (RF) [21]. The dataset is split into 80% training data to apply SMOTE and build the prediction models and 20% testing data to investigate the models' performance in predicting the class of the data.
Internal validation
A small-sample dataset has a higher chance of overfitting in predictive modeling. However, some techniques, such as bootstrap and cross-validation, can eliminate overfitting. This research used a bootstrap resampling technique to generate random samples with replacement from the original data set [22] to train the prediction model. The model's calculated performance measures subtracted from the bootstrap samples mean performance measures generate optimism-corrected model performance. This study used 100 bootstrap samples of the size of the original dataset and employed AUC as the performance measurement.
Figure 2 summarizes the various steps of the techniques implemented to analyze the data. This analysis used the python 2.7 and scikit-learn packages [14] to implement codes for various prediction models.
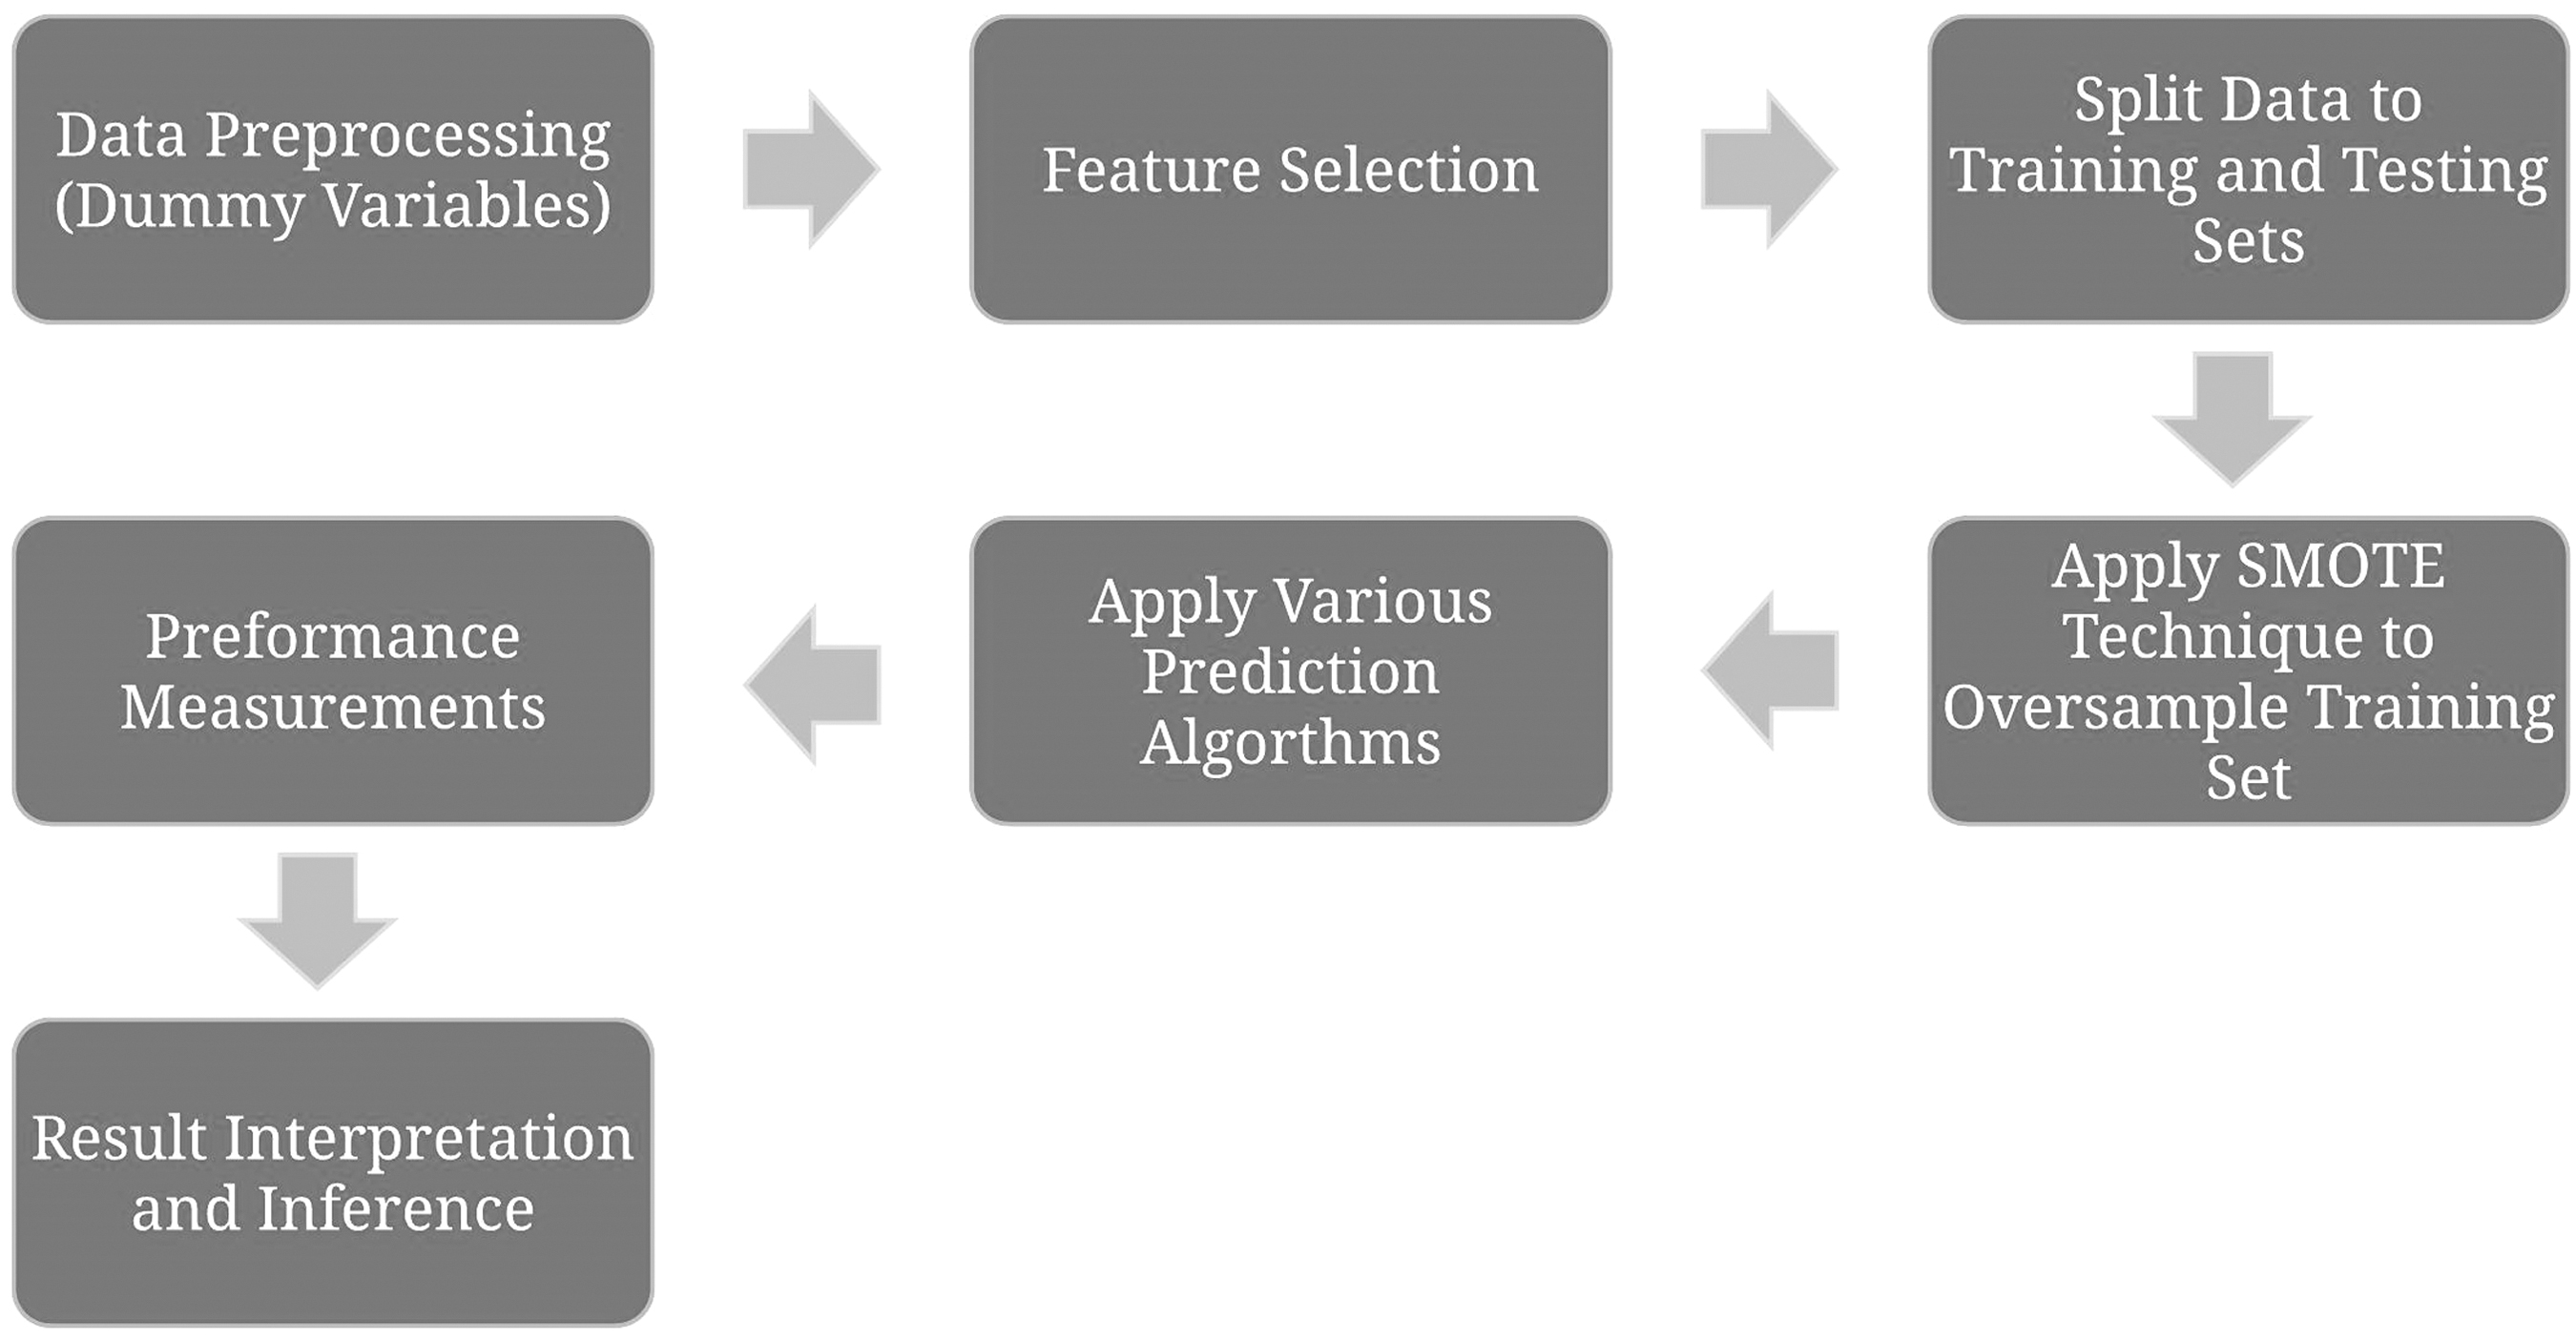
Flow diagram of various steps of the analysis. SMOTE = synthetic minority over-sampling technique.
We developed the prediction models based on all 83 features listed in Table 1 and identified the significant factors. Furthermore, the models were built again using only pre-operative features (i.e., Nos. 1–18, 27–31, and 33 and 34 in Table 1) to investigate the likelihood at the time of admission of developing a post-operative infection when only pre-operative features were collected. The results of both of the set of prediction models developed are presented below.
Results
There were 208 patients who underwent colorectal resection during the time; 18 developed post-operative infections. When examining patient characteristics, the following factors resulted in a statistically significant difference (p value <0.05): Elective surgery, whether the patient was transferred in from another hospital, steroid or immunosuppressant use, use of same agents for inflammatory bowel disease, >10% loss of body weight in the prior six months, serum creatinine concentration, length of stay (LOS), unplanned return to the operating room, use of a mechanical bowel preparation, various CPT codes, and discharge destination. There was no association between age, BMI, smoking status, surgical procedure length, oral antibiotic bowel preparation, diabetes mellitus, wound classification, or American Society of Anesthesiologists (ASA) score and SSI.
To select important factors, the SVC-base feature selection technique was utilized. The list features selected by the technique were age, serum sodium concentration, BUN concentration, hematocrit, platelet count, surgical procedure time, and LOS. These factors contributed most in predicting the likelihood of developing infections after colorectal surgery. By collecting the record of the significant factors, the probability of infection could be calculated, and high-risk patients could be identified for interventions and further care. We produced good performing prediction models by selecting just seven features.
Confusion matrices for various classifiers are depicted in Table 2.
Confusion Matrix for Various Algorithms
FN = false negative; FP = false positive; TN = true negative; TP = true positive.
The values of the performance measurement are shown in Table 3. Clearly, all algorithms have good performance in predicting true positive cases, which are the patients who actually developed an infection, and the models predicted them as positive cases.
Performance Measurements for Various Classifiers (Full Features)
The AUC of various methods based on full features is shown in Figure 3. These measurements were obtained for seven selected features based on the SVC feature-selection method using all features.
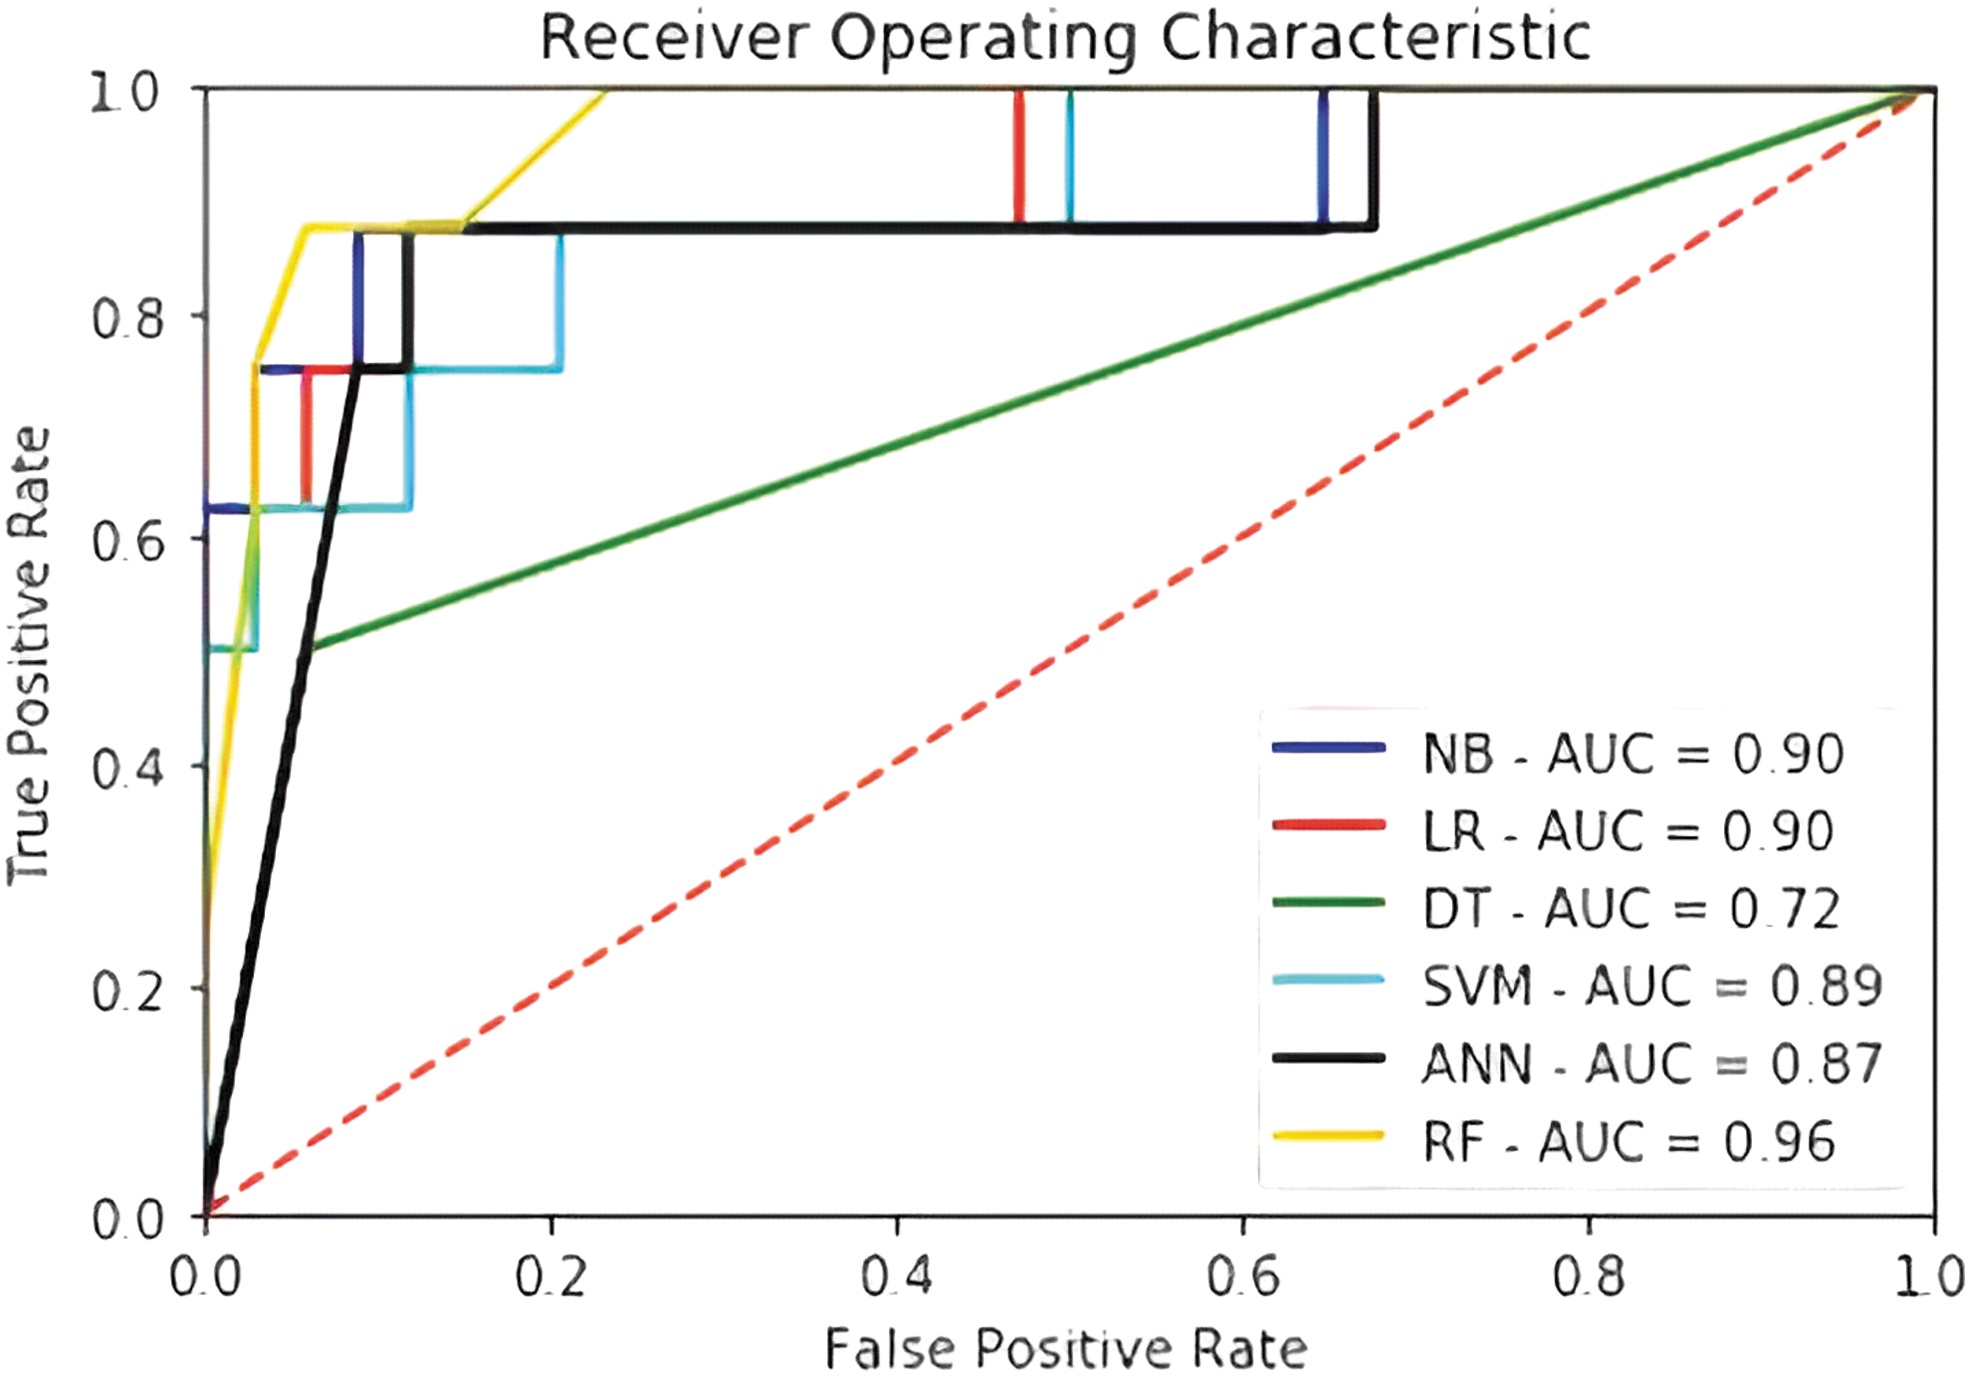
Area under the curve (AUC) for various techniques (full features). NB = naïve Bayes; LR = logistic regression; DT = decision tree; SVM = support vector machine, ANN = artificial neural network; RF = random forest.
The results from developing prediction models based on pre-surgery features only are shown in Table 4 and Figure 4. In this case, 14 features were selected by the feature selection algorithm for building the prediction model (age, gender, elective surgery, BMI, steroid/immunosuppressant use for chronic condition, body weight loss, serum sodium, BUN concentration, serum creatinine concentration, WBC count, hematocrit, platelet count, pre-colectomy mechanical bowel preparation, CPT Code_8). Generally, the performance of algorithms worsens when a smaller number of features is used to develop the prediction models. Naïve Bayes and SVM perform best in classifying data in terms of AUC, although SVM has a greater accuracy, and naïve Bayes works better as judged by sensitivity.
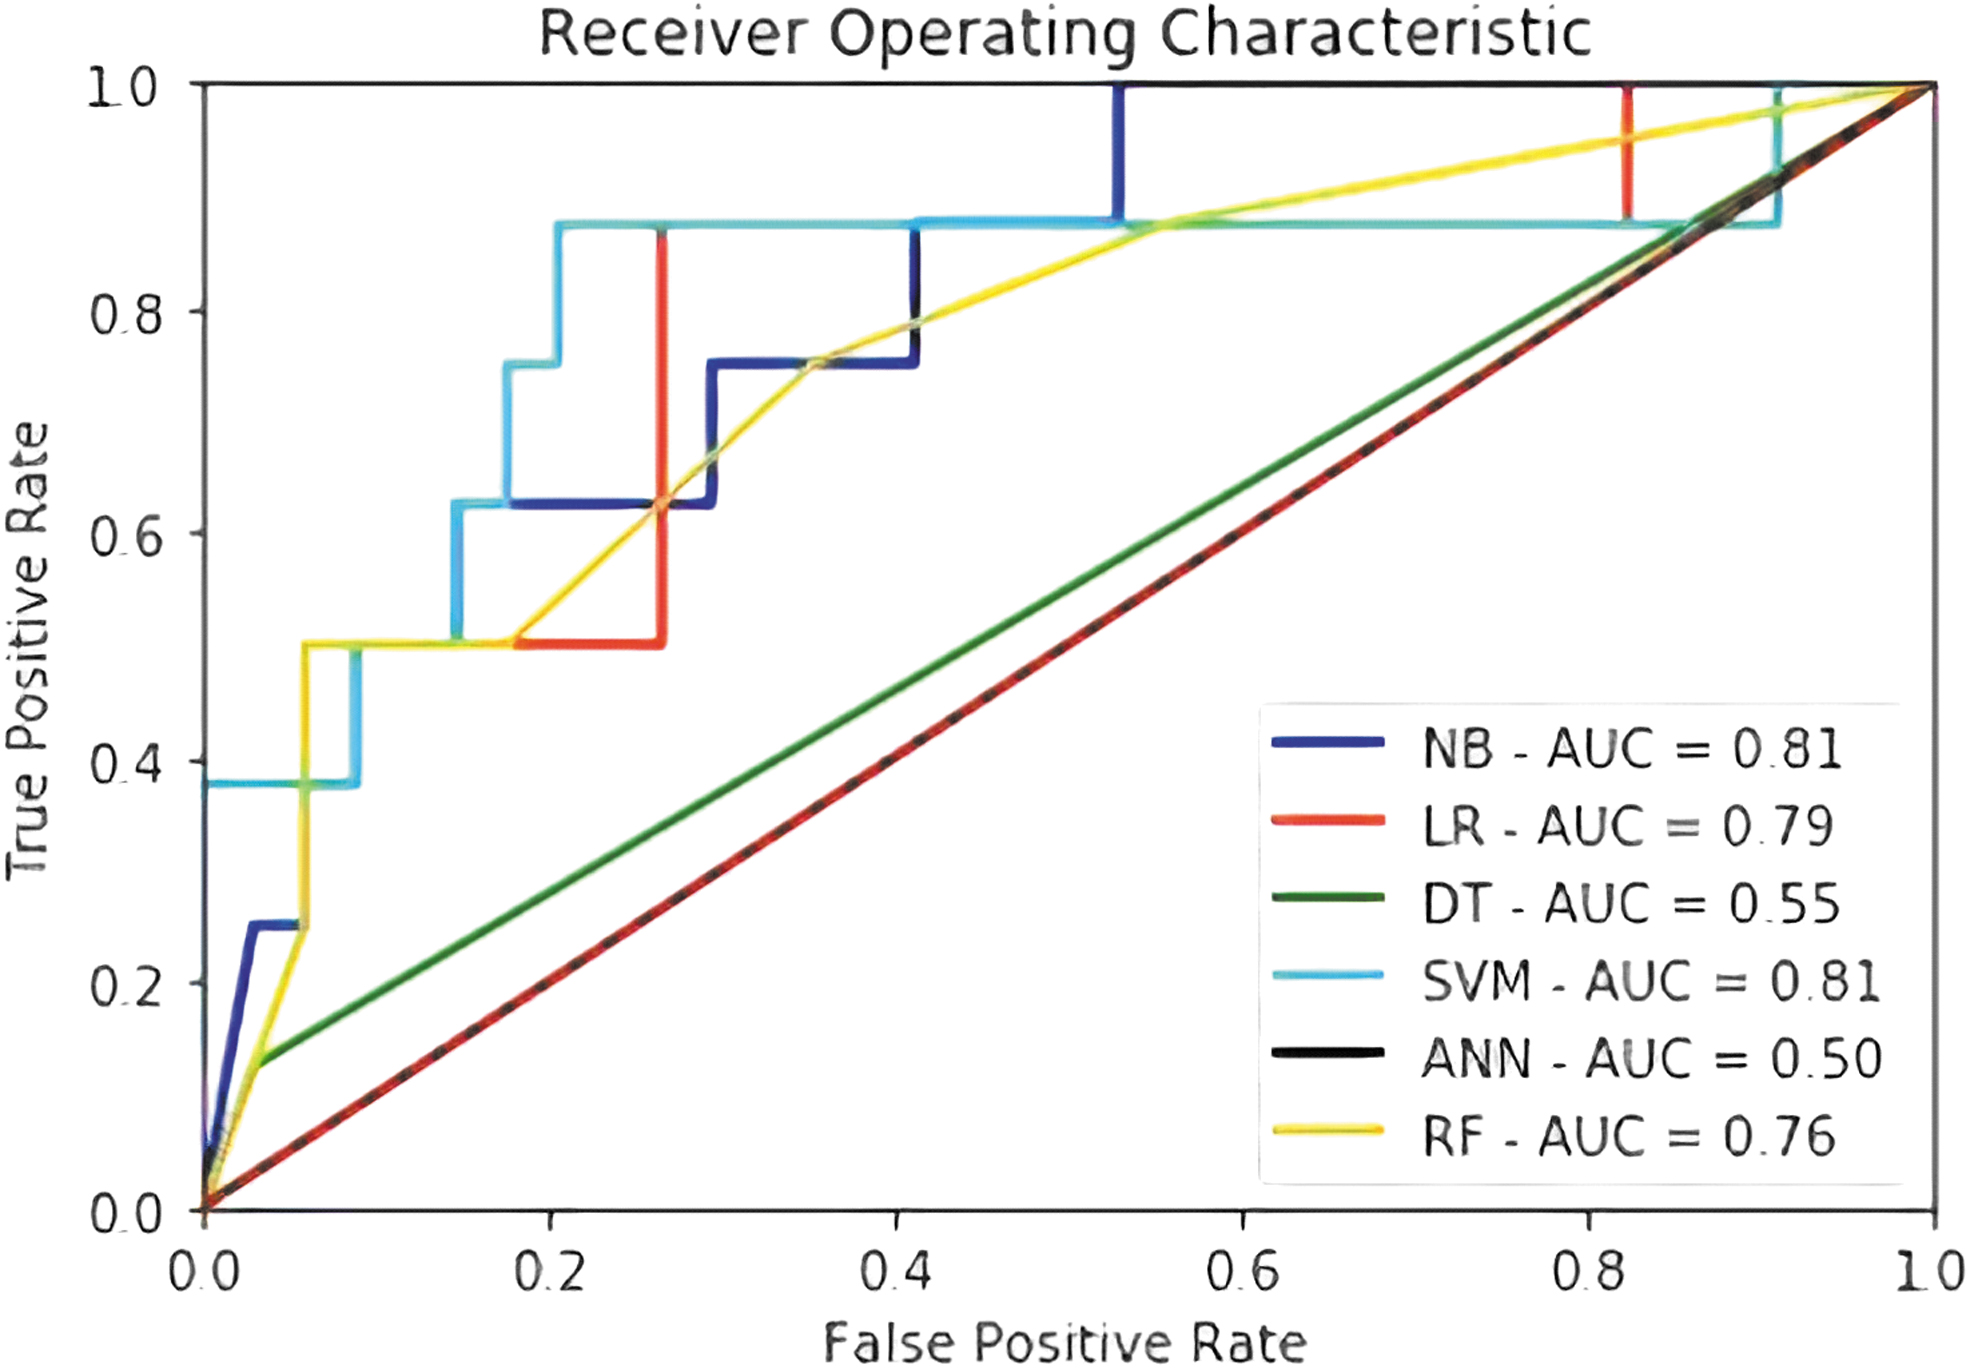
Area under the curve (AUC) for various techniques (pre-operative features). NB = naïve Bayes; LR = logistic regression; DT = decision tree; SVM = support vector machine, ANN = artificial neural network; RF = random forest.
Performance Measurements for Various Classifiers (Pre-Operative Features)
For internal validation, we considered the AUC measure, as it best represents the various algorithms' performance in predicting the dependent variable among all other measures. The mean AUC of the various methods after bootstrapping for full-feature models is presented in Table 5. It can be seen that although random forest has the highest AUC in the original dataset, considering the bootstrap samples and the optimism values, logistic regression and SVM have a more stable performance in predicting the result.
Area under the Curve Measure of Various Algorithms for Original and Bootstrap Data Sets
Discussion
As SSIs continue to gain attention, ways of predicting and preventing them become more important. They are a significant cause of morbidity and result in nearly one million excess hospital days over a one-year time in addition to increasing hospital costs significantly [1,2].
Our results indicated that elective surgery, transfer from another institution, steroid or immunosuppressant use, >10% reduction in body weight in the prior six months, serum creatinine level, LOS, unplanned return to the operating room, inflammatory bowel disease, undergoing a mechanical bowel preparation, CPT code, and discharge destination all were significant factors in whether a patient developed a post-operative infection. Although some of the above factors correlate with the patient's health status (emergency surgery, steroid use, body mass loss, unplanned return to the operating room, inflammatory bowel disease, discharge destination) and therefore can explain the difference in SSI rates, others (such as the type of procedure, CPT code, or transfer in from another facility) do not. Interestingly, age, BMI, smoking status, surgical procedure length, oral antibiotic bowel preparation, diabetes mellitus, wound classification, and ASA score did not correlate with the SSI rate. These are factors that have been shown in various studies to increase the SSI rate; and therefore further show the complexity and variability in predicting SSIs after colorectal operations [2,3,23]. Although from a prediction performance perspective, using age, serum sodium, BUN concentration, hematocrit, platelet count, surgical procedure time, and length of stay features can result in the most powerful prediction models to identify high-risk patients.
The above prediction models, when used appropriately, can identify those patients at higher risk of post-operative infections and therefore help the clinician better control the modifiable factors that are known from the literature to be significant in decreasing the risk of post-operative infectious complications. These factors include optimizing nutrition and performance status pre-operatively [24–26], following an enhance recovery after surgery (ERAS) pathway [27–30], using sterile intra-operative techniques such as a separate closing tray [31], changing gown and gloves prior to closing [32, 33], and implementing minimally invasion techniques [34,35].
Pedroso-Fernandez et al. [36] tried to predict SSI after colorectal surgery by identifying the surgical predictors. They conducted univariable and multivariable analysis on 911 patients undergoing colorectal surgery, of whom 221 developed SSI. They found that being female, having open surgery, being subject to a more than 72 hours pre-operative stay, and dirty or contaminated surgery were significant predictors of SSI.
Fusco et al. [37] conducted a retrospective cohort study for 115 patients who underwent colon surgery from January 2010 to December 2013. They investigated the risk factors associated with SSI by univariable analysis. Also, they performed logistic regression analysis with stepwise backward variable selection and identified the significant factors. Male sex, Charlson index, and mechanical bowel preparation were among the significant predictors in both univariable and multivariable analysis.
Paulson, Thompson, and Mahmoud [38] analyzed the prospectively collected data of 787 patients who underwent colorectal procedures between 2011 and 2015. They identified incision length, body mass index, surgical indication, and surgical approach as the significant factors associated with SSI. The risk factors were identified by the multivariable logistic regression method.
A limitation of this study is that it was conducted within one healthcare facility; thus, it may not include the variation in the patient groups or different types of hospitals. Also, the sample is relatively small, and using data of a broader timeframe or further experimentation on large and diverse datasets can improve the validation of the results. We conducted bootstrap analysis as internal validation to avoid overfitting and investigated the stability of the prediction models' performance. However, applying the proposed techniques on a larger dataset could help obtain more reliable results. All in all, we can claim that the developed prediction models can help surgeons identify patients at risk of a post-operative infection in a similar hospital with similar patient population characteristics.
Conclusion
Colorectal post-operative infections remain a large burden on healthcare systems, with studies and efforts aimed at trying to identify factors associated with the complications and ways to prevent them. Data mining classification methods provide a great tool to predict the probability of infection after colorectal surgery. Prediction models developed using pre-operative features enable physicians to estimate the risk of an infection at the time of a patient's admission. Our study showed that logistic regression and SVM algorithms performed better than the other classification methods using all features in the model. However, when only pre-operative characteristics were examined, SVM had the best performance. These models can help identify patients at high risk of SSIs and aid clinician in decreasing this risk. Future studies could aim to collect more detailed data and develop models to help predict specific events such as anastomotic leaks, cardiopulmonary complications, etc. in pre-operative patients.
Footnotes
Author Disclosure Statement
No competing financial interests exist. No funding was received for the preparation of this manuscript.