
Abstract
Background:
Previous estimates of the incidence of necrotizing soft tissue infections (NSTI) in the United States have substantial limitations and underestimate its occurrence. Improvements in hospital mortality after NSTI have increased the number of survivors at risk for long-term sequelae. This study estimates the incidence of NSTI and the burden of re-admission and associated healthcare spending in patients who survived admission for NSTI.
Methods:
Index admissions for NSTI were identified using International Classification of Diseases, Ninth Revision, Clinical Modification (ICD-9-CM) codes combined with either Current Procedural Technology (CPT) or diagnosis-related group codes to increase specificity. Two separate datasets were used to provide primary and secondary estimates of the annual incidence of NSTIs in the United States: the National Inpatient Sample (NIS) for the years 2012–2016 and the Watson Health dataset for 2009–2013, respectively, and extrapolated to estimate the incidence for 2018. The Nationwide Readmissions Database (NRD) from 2013–2015 was used to estimate of the risk for re-admission, cost of re-admissions, and to compare 90-day re-admission rates for NSTI to common medical conditions.
Results:
National Inpatient Sample and Watson Health datasets demonstrated an increasing annual incidence and estimated 33,600 and 28,500 cases in 2018, respectively. The estimated annual incidences in the United States in 2018 were 10.3 and 8.7 per 100,000 persons, respectively. Risk of 90-day re-admission ranged from 24%–29% over the 3 years, 89% of which were unplanned. Of those re-admitted, 90% had one or more comorbidities, the most common diagnoses associated with re-admission were infection in 65%, acute kidney injury in 22%, and shock in 10%. The median re-admission length of stay was seven days (interquartile range [IQR]: 4–13 days) with a median cost of re-admission of $13,590 (IQR: $7186–$27440).
Conclusion:
The incidence of NSTI is more common than generally reported. Re-admission within 90 days is common, occurring in more than one in four survivors resulting in high healthcare costs.
Necrotizing soft tissue infections (NSTIs) are a diverse group of life-threatening infections that involve soft tissue layers alone or in combination, and include necrotizing cellulitis, fasciitis, and myositis [1]. The microbiologic etiologies and clinical presentations of NSTIs are diverse, contributing to the variety of terms used to describe these conditions. Fournier gangrene is used to describe NSTIs that originate within the perineal area or genitalia. Gas gangrene describes infections in which a prominent feature is gas within tissues on imaging or on physical examination. Necrotizing fasciitis is the diagnostic term used most commonly for NSTIs, although this term implies the involvement of the fascial plane and poorly captures NSTIs involving the skin, subcutaneous tissue, or muscle without fascial involvement.
The relative infrequency, the diverse pathogenesis and clinical presentation, and the traditionally high mortality have limited a complete picture of the impact of NSTIs on healthcare resource utilization outcomes and quality of life. In particular, the true incidence of NSTIs has been evaluated inadequately. Prior studies likely underestimate the incidence because they are extrapolated either from the U.S. Centers for Disease Control and Prevention (CDC) surveillance data for group A streptococcal infections or examine deaths related to necrotizing fasciitis [2–4]. High mortality historically associated with these infections also focused attention primarily on improving short-term survival, with limited analysis of long-term outcomes and cost. Recent enhancements in access to national data combined with reductions in short-term mortality provide an opportunity to define the overall burden and implications of this disease more accurately.
The goals of this study are to estimate the incidence of NSTIs within the United States accurately, estimate the 90-day re-admission rate, a common quality measure used by the Centers for Medicare and Medicaid Services (CMS), and to calculate healthcare costs associated with re-admissions.
Methods
Study design and cohorts
Estimating NSTI incidence
An observational cohort design was used and retrospective analyses of two nationally representative databases (National Inpatient Sample [NIS] and Watson Health) conducted. Necrotizing soft tissue infection cases were identified using the International Classification of Diseases, Ninth Revision, Clinical Modification (ICD-9-CM) codes for the three most common codes representing NSTI (necrotizing fasciitis, gas gangrene, and Fournier gangrene). The ICD-9 codes used to capture cases of Fournier gangrene are used broadly for recording multiple urogenital diagnoses. Therefore, a combination of Current Procedural Terminology (CPT) and ICD-9 codes were used to include patients with surgical debridement of necrotic tissue (Supplementary Table S1). To allow consistency in case definition between the databases utilized for the proposed analyses, 2016 was the latest year used before the switch from ICD-9 to ICD-10 codes. To estimate the incidence of NSTI, the ICD-9 codes alone or the combination of ICD-9 and CPT codes in any discharge diagnoses fields, regardless of age, were identified in both databases. When multiple admissions occurred for the same individual, only the first unique admission was included.
For a primary estimate of the incidence within the United States, the NIS from the Healthcare Cost and Utilization Project (HCUP) from 2012–2016 was used. The NIS was chosen because it is the largest publicly available, all-payer, inpatient database in the United States (includes data from more than 7 million hospital stays each year and represents approximately 20% of the discharges in the United States). The sample is drawn from 48 states (excluding Alabama and Idaho) and the District of Columbia and includes more than 4,500 hospitals.
To strengthen the validity of this incidence estimate, a secondary estimate using the Watson Health dataset from 2009 through 2013 was performed. Watson Health uses the MedPAR data, statewide hospital data that are available for purchase from publicly reporting states as well as data from its Watson Health's proprietary hospital datasets to create a dataset that has approximately 73% of short-term, general, acute care, non-federal hospital data for the United States. The MedPAR data provide the Medicare volume per hospital. Watson Health creates a linear regression model that uses hospital characteristics such as bed size, teaching status, region of the country, urban/non-urban setting, and presence of a cardiac catheterization laboratory to predict the non-Medicare volume at each hospital from the Medicare volume in situations where the actual non-Medicare distribution is not available for external reporting. Neither the NIS nor Watson Health databases include patients admitted to Veteran's Affairs Hospitals.
Estimating re-admissions and associated costs
An observational cohort design was used with a retrospective analysis of the National Readmissions Database (NRD) from 2013–2015 to estimate 90-day re-admissions. The NRD was selected because it includes data for all re-admissions during a calendar year and it includes 49% of hospitalizations in the United States. A limitation of NRD is that it does not include CPT codes, thus the review of the NRD focused only on cases defined by the ICD-9 code for necrotizing fasciitis. However, to strengthen the case definition for necrotizing fasciitis, diagnosis-related group (DRG) codes that were known to be highly associated with the disease course of NSTI were used (Supplementary Table S1).
To estimate re-admissions and associated costs, our primary analysis included ICD-9 codes in the first 10 discharge diagnoses fields and DRG codes (10 ICD + DRG), and our secondary analyses used the same ICD-9 codes within the first 3 (3 ICD + DRG) and 5 (5 ICD + DRG) discharge diagnoses fields with DRG codes. Cases were limited to patients who did not die during hospitalization; age at admission was at least 18 years because causes of re-admission may vary in pediatric patients; the subject was not discharged against medical advice; and, the month of discharge was January to September of each year (January to June was used for 2015) to allow 90-day follow-up.
All-cause re-admissions at 30, 60, and 90 days after admission for necrotizing fasciitis were identified using previously described methods by CMS [5]. To determine whether infection was the cause of these re-admissions, ICD-9 codes that were validated previously to identify infection were used and we also identified the 10 leading ICD-9 codes in the primary discharge diagnosis fields for the first re-admission(6).
To provide appropriate context for NSTI re-admissions, re-admission rates for several medical conditions reported as a quality metric (e.g., acute myocardial infarction [MI], pneumonia, chronic obstructive pulmonary disease [COPD], sepsis, and heart failure) and burn injuries are also reported. Burn injuries were chosen because they are a potentially life-threatening, emergent surgical condition involving soft tissue structures, and management for burn injuries may be similar to NSTI, requiring multiple debridements. Centers for Medicare and Medicaid Services guidelines were used to identify acute MI, pneumonia, COPD, heart failure [5]. Code 240 of the Clinical Classifications Software (CCS), developed by HCUP, was used to identify burn injuries, and a combination of ICD-9 codes, as previously reported, to identify sepsis [6,7]. This study was considered exempt by the University of Pittsburgh Institutional Review Board.
Statistical analysis
Analysis of the NIS data through 2016 yielded trends in the growth of the incidence of each of the aforementioned diagnoses. These trends were extrapolated forward to generate the NSTI incidence estimates for 2018, the most recent estimate that can be reliably forecasted from available data. The extrapolation to the 2018 inpatient figure for Watson Health NSTI data is performed using a population-based forecasting method. This method applies the rate of inpatient admissions for the most current year of hospital data and the estimated age and payer type (Medicare Medicaid, commercial insurance, other payers) distribution of the total U.S. population for the most recent year of data to create an age and payer type incidence rate. The forecast then applies that rate to the estimated age and payer type distribution for the U.S. population in the target forecast year to generate the forecasted figures for the year 2018.
For re-admissions, patient-level and hospital-level characteristics of the unique index admissions in NRD were characterized. This included patient age, gender, comorbidities and organ dysfunction, severity of illness, hospital type, planned admission status, transfer status, evidence of emergency department stay, and length of hospital stay. Re-admissions after the initial index admission up to 30, 60, and 90 days were identified in separate analyses. Re-admission rates were calculated within each timeframe as was the distribution of the number of re-admissions per patient within each timeframe, reasons for the first re-admission, and cost of re-admissions. All statistical analyses were performed using SAS, version 9.3 (SAS Institute, Cary, NC) and Stata, version 13.1 (StataCorp, College Station, TX).
Results
Estimation of NSTI incidence
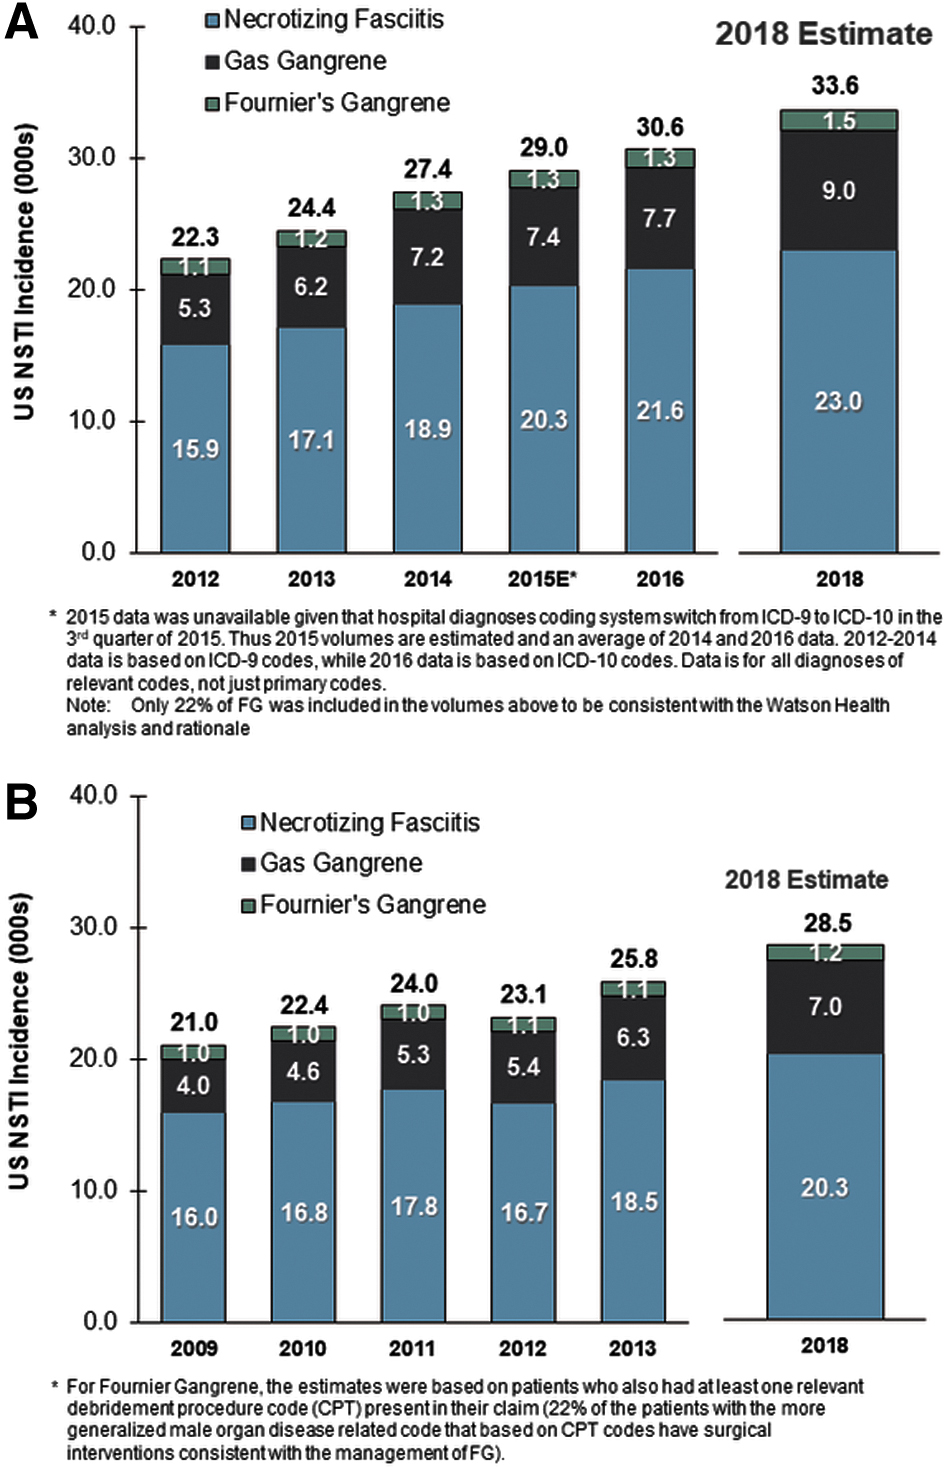
Necrotizing soft tissue infections cases in the NIS datasets averaged 22,300–30,600 annually during 2012–2016 (Fig. 1), with the highest number of cases in 2016. Based on these estimates for the five-year period, 33,600 cases were projected to have occurred in 2018. Most cases of NSTI in the dataset were coded as necrotizing fasciitis and gas gangrene, whereas Fournier gangrene accounted for a small proportion of cases. For example, of the 30,600 cases of NSTI in 2016, 21,600 and 7,700 were necrotizing fasciitis and gas gangrene, respectively, whereas 1,300 cases were caused by Fournier gangrene.
(
To provide some validation for the primary NIS analysis, a secondary analysis using the Watson Health dataset for the years 2009–2013 (Fig. 1B) was conducted. A similar rise in annual cases as seen in the NIS set was also present in the Watson Health dataset. The proportion of cases coded as necrotizing fasciitis, gas gangrene, and Fournier gangrene was similar to the NIS dataset. Of note, the number of cases were similar in 2013 when estimates were available for both NIS and Watson Health databases (24,400 and 25,800 cases, respectively). Using the Watson Health dataset, we estimated that 28,500 cases occurred in 2018.
Using the estimated number of NSTI cases from the NIS and Watson Health datasets for 2018, along with the estimated US population for that same year (http://worldpopulationreview.com/countries/united-states-population/), the NSTI incidence rate was 10.3 and 8.7 per 100,000 persons, respectively. Extrapolation methodology is described in greater detail in Supplementary Appendix A1.
Re-admissions
Annual NSTI re-admissions between January and September in the NRD (except for 2015 where the cases were captured only from January to June) were 2,935, 3,134, and 2,047 in 2013, 2014, and 2015, respectively. These cases included only patients who were 18 years of age or older, did not leave the hospital against medical advice, and survived the hospitalization. The clinical characteristics of these patients are included in Supplementary Table S2.
In 2015, the 30-, 60-, and 90-day re-admission risk was 17% (n = 357), 24% (n = 486), and 28% (n = 568), respectively (Table 1). The risk of re-admission at 30, 60, and 90 days were similar in 2013 and 2014, and in sensitivity analyses using alternate approaches (3 and 5 ICD codes) to identify necrotizing fasciitis patients across the three years (Table 1). Finally, the 90-day re-admissions after NSTI were similar to common medical conditions, including acute MI (23%), pneumonia (28%), COPD (33%), sepsis (32%), but higher than in burns (19%) in 2015 (Supplementary Table S3).
Frequency of at Least One Re-Admission after Index Admissions Involving NSTI According to Different NSTI Definitions
DRG = diagnosis-related group; ICD-9-CM = International Classification of Diseases, Ninth Revision, Clinical Modification; NSTI = necrotizing soft tissue infection.
For 2013 and 2014, index admissions were only considered between the months of January to September. For 2015, index admissions were further restricted to January to June because ICD-9 was transitioned to ICD-10 in July. Number of unique index admissions was specific to the year and NSTI definition.
All index admissions were restricted in the same way: age> = 18, did not die in hospital, not discharged against medical advice, and discharge before October*. Index admissions were permitted to be planned or unplanned, as well as to have medical or surgical DRG.
Among patients who were re-admitted, most were re-admitted once and a small proportion were re-admitted more frequently (Supplementary Table S4). For example, of the patients with a NSTI admission in 2015 (2,047) who were re-admitted within 90 days, 20% (n = 405) were re-admitted once, 6% (n = 121) twice, and 2% (n = 42) more than twice within 90 days (Supplementary Table S4). The median duration of these re-admissions in 2015 was seven days (interquartile range [IQR], 4–13 days) and the duration of re-admission was similar in 2013 and 2014 to 2015 and using alternate approaches to identify NSTI patients (i.e., 3 and 5 ICD codes) (Supplementary Table S5).
Most of the 2015 re-admissions (81%) were not for planned procedures. Infections and sepsis were common during these re-admissions (Table 2). An ICD-9 code for infection was recorded in the first discharge diagnosis field in 32.7% (n = 186) and in any discharge diagnosis field in 66% (n = 375) of patients in 2015, and the proportion of patients re-admitted with an infection were similar in 2013 and 2014 (Table 2). Infections were also the leading diagnoses in the top 10 ICD-9 codes. In 2015, 4% of patients died during their first re-admission and the risk of death was similar in 2013 and 2014. Planned re-admissions, presumably for reconstructions, accounted for 11.5% to 14.3%, and a surgical DRG was coded in 37.5% to 42.4% of re-admissions from 2013 to 2015 (Table 2).
Causes of First Re-Admission within Ninety Days after NSTI (NSTI; 10 ICD + DRG Codes Used to Identify NSTI Cases) for 2013–2015
ICD-9-CM = International Classification of Diseases, Ninth Revision, Clinical Modification; DRG = diagnosis-related group; NSTI = necrotizing soft tissue infection.
Identified using the set of ICD-9 codes for infection used as part of the Angus criteria for sepsis [6].
The top 10 ICD-9 codes for each year were identified, and their frequencies (and percent of occurrence among all first readmissions) are reported here.
Except for one with missing DRG, the rest were medical DRGs (∼58%).
Risk factors associated with re-admission
To assess risk factors associated with re-admission, we compared the baseline clinical characteristics available in the dataset of patients requiring re-admission in 2015 with those of patients who were not re-admitted. The complete comparison may be viewed in Supplementary Table S6. Those factors more frequently associated with patients requiring re-admission with a p value of <0.01 are shown in Table 3 and include age greater than 65, substantial comorbidities, and high severity of illness.
Clinical Factors Associated with Re-Admission*
APR-DRG = all patient refined diagnosis-related group; COPD = chronic obstructive pulmonary disease.
Derived from Supplementary Table S# from those comparative factors with p value of <0.01.
Cost
In 2015, the mean and the median cost for re-admission over 90 days after NSTI was $23,610 (standard deviation [SD] = $35,603) and $13,590 (IQR, $7,186-$27,440) (Supplementary Table S7). The median costs were similarly high in sensitivity analyses using different criteria to identify NSTI and analyzing 2013 and 2014 data (Supplementary Table S7). In comparison the mean and median cost for the index admission for NSTI in 2015 of $45,510 (SD = $56,272) and $28,131, respectively (Supplementary Table S8). The costs presented were not adjusted for inflation. For the sake of comparison, mean charges for re-admission calculated form the Watson Health database for the year 2013 were approximately $212,000, with charges of $312,000 for patients with hospital stays of ≥14 days.
Discussion
Necrotizing soft tissue infections are life-threatening infections, associated with significant mortality and disability [1,8]. Necrotizing soft tissue infection is incompletely understood, but two advances used in this study now provide both opportunity and rationale to form a more complete picture of NSTIs. Improvements in recognition and management have substantially reduced mortality and enhancements in data capture and aggregation provide new avenues to obtain a more accurate estimate of the overall healthcare burden of the disease.
Prior to the year 2000, the great majority of series reported mortality from NSTI to be above 20%. In 30 publications involving 945 patients between 1980 and 1999, the average mortality was 28% [1]. Advances in recognition, time to intervention, and therapy have reduced the in-hospital mortality in more recent series. In seven published series between 2007 and 2018 involving 252 patients in whom surgery was within 24 hours from admission (frequently less than 12 hours), the average mortality was 9% [1,9–16]. This reduction of in-hospital mortality from NSTIs increases the number of survivors at risk of long-term sequelae and the relative importance of assessing and understanding other outcome and quality measures beyond mortality that will contribute to the overall healthcare burden of NSTIs.
Establishing the true incidence of NSTIs remains challenging, however, improvements in data capture and access to national datasets for in-patient admissions provide mechanisms to estimate the incidence more accurately than historically used. Many reviews of NSTI cite an incidence of 0.4 cases per 100,000 population, extrapolated from CDC surveillance data for group A streptococcal infections [3,4,17,18]. At the current U.S. population (329,000,000; http://worldpopulationreview.com/countries/united-states-population/) this incidence would equate to between 1,000 and 1,500 cases annually. This estimate dramatically underestimates all cases of NSTI because group A streptococcal infections constitute only a minority of NSTIs and surveillance data itself underestimating frequency, requiring active reporting to the CDC.
Using an insurance claims database with medical claims submitted from 1997–2002, Simonsen et al. [19] estimated the incidence to be 0.04 cases per 1,000 person-years (or 4 per 100,000), an estimate 10 times higher than the CDC rate. However, this study's primary objective was to estimate cellulitis and determine the rate of necrotizing fasciitis complicating cellulitis. Thus, cases coded as necrotizing fasciitis without cellulitis would be missed. Similar rates, using codes only for necrotizing fasciitis, were obtained (4.5 per 100,000 persons in 2005) through an analysis of the CDC's National Hospital Discharge Survey data [20].
In this current analysis, the NIS was used for primary analysis with the slightly older Watson Health dataset used for secondary analysis to provide validation of our estimates. In both analyses, the three codes most commonly used for NSTIs were included, namely, those for necrotizing fasciitis, gas gangrene, and Fournier gangrene. To avoid issues introduced by the recent migration from ICD-9 to ICD-10, we limited our analysis to dates prior to this transition and then extrapolated the rate. Both analyses provide substantially higher rates of NSTIs than historically quoted. The two sets provided estimates of between 28,500 and 33,600 cases in 2018. Using the estimated U.S. population for 2018, the incidence would range from 8.7–10.3 per 100,000 persons. The number of Fournier gangrene cases, however, may be underestimated given the non-specific nature of the ICD-9 code used that includes many urogenital diagnoses thus leading to conservatively correlating the ICD-9 code with CPT codes that would indicate debridement of necrotic tissue. It is also possible that cases of Fournier gangrene could have been coded under necrotizing fasciitis. With the increasing incidence of obesity and diabetes in the United States, both risk factors for Fournier gangrene, it will be important to monitor the incidence of Fournier gangrene in subsequent years. This should be facilitated by the use of a new ICD-10 code that is specific for Fournier gangrene.
As mortality from NSTI declines, other quality measures will assume more importance. Such quality measures may include long-term survival, functional outcome (discharge status), hospital re-admission, cost, and organ system function. Access to data remains limited for both functional outcomes and organ system function [21–23]. In the context of increasing survival rates from NSTI, a recent retrospective review used the Texas Inpatient Public Use Data File and multivariable regression to assess predictors of discharge to home among survivors. Over a 10-year period from 2001–2010 the overall survival rate was 90.7%. Of the 10,724 hospitalizations surviving to discharge, 62.5% were discharged to home. Characteristics that adversely affected odds of home discharge, requiring alternate settings included increasing age, comorbid conditions, and organ failure during hospitalization (24). Although this analysis involving patients in Texas who were discharged home did not assess the risk of re-admission, these characteristics impacting discharge to home are consistent with our own analysis of potential risk factors for hospital re-admission including older age, and substantial comorbidities when we compared those patients who experienced at least one re-admission with those without a history of re-admission.
Because limited data are available to assess the burden of long-term sequelae from NSTIs, this study seeks to estimate the risk of hospital re-admissions and their associated healthcare costs for this population. Re-admissions add substantially to hospital utilization and cost and have been associated with poorer long-term outcomes [25].
Our analysis demonstrates that the risk of re-admission is substantial for patients recovering from NSTI (approaching 30% at 90 days). Given the potential for multiple surgical debridements involved in management of NSTIs, one might assume that re-admissions for planned reconstructive surgery are common. However, only 11%–14% of the re-admissions observed across the three years of our analyses were considered pre-planned whereas most re-admissions were unplanned and appear to be infection related. This re-admission rate is similar to re-admission rates from other serious infection diagnoses (pneumonia and sepsis) and may be higher than those for MI and burns. That the 90-day re-admission for NSTI is similar to sepsis is not surprising, given the serious life-threatening nature of NSTI. In the sepsis population, risk of re-admission, especially for infection-related diagnoses, has been linked to the development of chronic critical illness, a state observed in up to one-third of surgical sepsis survivors, in which patients have a chronic debilitating course punctuated by persistent organ dysfunction leading to increased long-term mortality [26]. Although the NRD does not allow an evaluation of the status of persistent organ dysfunction the high re-admission rate and the predominance of infection related re-admission diagnoses would provide a plausible explanation for the observations made in our analysis of NSTI patients.
Limitations of our study include the retrospective nature and the use of large datasets that may not represent all patient populations accurately. The possibility that patients identified by ICD-9 codes for NSTI alone without surgical confirmation may have another serious but non-necrotizing infection that may not lead to need for multiple surgical debridements or critical care support, but this would more likely reduce the re-admission rate rather than inflate it. The use of the NRD, by its nature is designed to evaluate re-admissions but does not offer the capacity to elucidate fully the risk factors leading to re-admission in patients with NSTI or the other medical diagnoses to which the NSTI re-admission rate was compared. The NRD only allows us to report these comparisons descriptively rather than through formal statistical methods. Additionally, as already noted, analyses derived from the NRD do not have the capacity to determine whether hospitals re-admissions contribute to less favorable outcomes in this particular patient population, although it does provide insight into the reasons for re-admission that can define future risk to this patient population.
Our analysis has demonstrated that hospital re-admissions in patients with NSTI, a serious invasive disease that is increasing in incidence, are both common and costly and add to the healthcare burden of this disease. Our data should help to stimulate further analyses into the long-term outcomes associated with NSTI and interventions that may improve such outcomes in terms of the increasing survival of patients with this disease.
Footnotes
Funding Information
Funding for datasets and data analysis provided by Atox Bio. No grants or federal funding was provided.
Author Disclosure Statement
Addison May, Eileen Bulger, Andrew Bernard have received consulting fees as consultants from Atox Bio; Victor Talisa and Sachen Yende received consulting fees for data analytics from Atox Bio; Wayne Dankner and David Wilfret are employees of Atox Bio.
References
Supplementary Material
Please find the following supplemental material available below.
For Open Access articles published under a Creative Commons License, all supplemental material carries the same license as the article it is associated with.
For non-Open Access articles published, all supplemental material carries a non-exclusive license, and permission requests for re-use of supplemental material or any part of supplemental material shall be sent directly to the copyright owner as specified in the copyright notice associated with the article.