




Abstract
Background:
In recent years, several studies have identified closed correlations between the coagulation cascade and inflammatory mechanisms in infective diseases. Fibrinogen (PF) is emerging as promising biomarker for the diagnosis of peri-prosthetic joint infection (PJI). This study aims to investigate the diagnostic value of PF in diagnosing PJI and to explore potential causes influencing the diagnostic value of PF.
Materials and Methods:
PubMed, Embase, and Cochrane Library were searched regarding the role of fibrinogen as a biomarker in the diagnosis of PJI. Studies in English were included in the meta-analysis if they determined the diagnostic value of fibrinogen for PJI detection after hip or knee arthroplasty, applying the recognized diagnostic criteria for PJI. A quality evaluation of the studies included was performed. The pooled sensitivity, specificity, likelihood ratios and diagnostic odds ratio (DOR) and the area under the receiver operating characteristic curve (AUROC) were obtained using the statistical software STATA, version 17 (StataCorp, College Station, TX).
Results:
Ten studies (9 retrospective) were included in the study. Low publication bias was detected, but with high heterogeneity among them. Plasma fibrinogen showed a good diagnostic accuracy and clinical utility in PJI (sensitivity, 0.81 [95% confidence interval {CI}, 0.75–0.86]; specificity, 0.82 [95% CI, 0.76–0.86]; AUROC, 0.88 [95% CI, 0.85–0.91]; DOR, 19 [95% CI, 14–26]).
Conclusions:
The attempt to find an “ideal” biomarker is crucial to improve the sensitivity and specificity of the current diagnostic algorithms for PJI. The analysis performed in the current study indicates that plasma fibrinogen test is a valid biomarker for PJI diagnosis.
Peri-prosthetic joint infection (PJI) after total joint replacement is a rare but potentially catastrophic complication, associated with increased morbidity and mortality.1–3 The incidence of PJI is reported to range from 0.7% to 2.4%1,2, with a five-year mortality rate higher than that of breast cancer, melanoma, Hodgkin lymphoma, and other common malignancies. 2
Currently, PJI determines 15% of all hip, and 25% of all knee revision procedures. The total number of revisions for PJI is destined to increase, given that the prevalence of hip and knee total joint arthroplasty (TJA) surgeries is projected to double by 2030,2,4 with an incredible societal cost. Premkumar et al. 5 estimated that the combined annual hospital costs related to PJI of the hip and knee will be $1.85 billion by 2030: $753.4 million for total hip arthroplasty (THA) PJI and $1.1 billion for total knee arthroplasty (TKA) PJI, in that year. Increases in PJI costs was found to be mainly attributable to increases in volume.
Signs and symptoms of PJI are not frequently specific and easy to recognize, although an early diagnosis of PJI is important to guide medical and surgical strategies, preserving implants and achieving the longest preservation of joint function.6–8
The gold standard test for diagnosis of PJI is still lacking. The Musculoskeletal Infection Society (MSIS) criteria for PJI, defined in 2011 and modified in 2013, include blood and synovial biomarkers with microbiologic culture, clinical, histologic, and intra-operative findings.6,7 These definitions have become widely accepted and have dramatically improved diagnostic accuracy. Moreover, in 2018 Parvizi et al.,
8
with the goal of increasing the sensitivity of the previous PJI definition, proposed a modification of MSIS criteria, including several biomarkers. In particular,
Several studies published in the last years identified PF as a possible reliable and accurate biomarker in detecting PJI.13–22 However being that PJI is a rare disease and the sample sizes of the reported studies are often limited, the diagnostic accuracy of PF in detecting PJI remains widely variable among studies. Therefore, we decided to conduct a systematic review and meta-analysis of the existing studies to: investigate the diagnostic value of PF as a biomarker in diagnosing PJI; and explore potential causes influencing the diagnostic value of PF.
Materials and Methods
We performed this systematic review and meta-analysis in accordance with the Preferred Reporting Items for Systematic Reviews and Meta-Analysis (PRISMA) guidelines. 23
Search strategy
PubMed, Embase, and the Cochrane Library were systematically searched in December 2021 regarding the role of PF as a biomarker in the diagnosis of PJI. The search strategies are reported in Table 1. Additional studies were eventually identified from the references of the retrieved papers.
Search Strategy on MEDLINE, Embase, and Cochrane Library
Eligibility criteria
The retrieved studies were included in the meta-analysis if they: determined the diagnostic value of PF for PJI detection after hip or knee arthroplasty; provided sufficient data to calculate the true-positive (TP), false-negative (FN), false-positive (FP), and true-negative (TN) values; applied clear and well-recognized diagnostic criteria for PJI; and were written in English. Studies only reporting PF as a biomarker for persistent infection during two-stage revision for PJI were excluded from the review.
Data extraction
Two reviewers (S.G., M.S.) performed the data extraction independently. In case of disagreement, the first author (V.C.) was sought to resolve the divergences. Data extracted from the eligible studies included: author names, year of publication, study location (country), sample size, number of infected patients, mean age of PJI cohort, study design, site of surgery, whether the authors excluded patients with coagulation disorders of inflammation diseases, cutoff values, method to identify the cutoff value, total number of TP, FP, FN, and TN, sensitivity, specificity, whether the samples were collected pre-operatively or post-operatively, and the reference standard of PJI diagnosis. If more than one cutoff was determined in one study, the cutoff with the best diagnostic value was chosen for further analysis.
Quality evaluation
Two reviewers (S.G., M.S.) performed the quality evaluation of the studies independently. In case of disagreement, the first author (V.C.) was sought to resolve the disagreements. To assess the potential risk of bias and the applicability of the evidence found in the primary studies to the review, the Quality Assessment of Diagnostic Accuracy Version 2 (QUADAS-2) tool was used. 24 The MSIS criteria for PJI were considered the reference standard during the quality assessment process.6–8
Statistical analysis
The statistical analysis of this meta-analysis was performed by using the program “Midas” 25 in STATA, version 17 (StataCorp, College Station, TX) and Review Manager 5.4 (New York, NY). The bivariable random-effect model was used to pool data and estimate the diagnostic accuracy. The model focuses on determining the average sensitivity and specificity, estimating the unexplained variation in these parameters, and the correlation between them. Summary estimates of sensitivity and specificity and their 95% confidence intervals (CIs) were calculated after anti-logit transformation of the mean logit sensitivity and logit specificity and respective standard errors. These intervals take into account the heterogeneity beyond chance among studies (random effect models).25,26 Poole values of sensitivity, specificity, positive and negative likelihood ratios, diagnostic odds ratios (DORs) and their respective 95% CIs were calculated. Forest plots were used to display sensitivity paired with specificity for each study, displaying heterogeneity statistics as well.
The derived logit estimates of sensitivity, specificity respective variances were used to construct a hierarchical summary receiver operating characteristics (SROC) curve. The area under the curve receiver operating characteristics curve (AUROC) indicates the test performance. The AUROC values can be interpretated as low (0.5 to 0.7), moderate (0.7 to 0.9), or high (0.9 to 1) accuracy. 27
The heterogeneity among studies was evaluated using the I2 statistics, where an I2 value >0.5 (or 50%) indicates high heterogeneity. The potential sources of heterogeneity were investigated as follows: measuring the influence and entity of the threshold effect through the Spearman correlation coefficient of the logarithm of sensitivity and 1-specificity; realizing a bivariable box plot to identify the sources of heterogeneity among studies (i.e., the studies out of the 95% CI) and exclude them from the further analysis; performing a meta-regression and subgroup analysis to identify the independent factors that may affect the diagnostic value of the fibrinogen test for PJI detection and reduce the potential cause of heterogeneity; and investigating the publication bias (PB) by Deek's funnel plots (when the p value was <0.05, the test for PB were considered statistically significant). 28
Finally, the clinical utility of the fibrinogen test for PJI detection was investigated using a Fagan nomogram. The nomogram represents the likelihood of a patient having PJI when the index test is positive or negative through likelihood ratio and post-test probabilities. Considering the low incidence of PJI, we used the 25% pre-test probabilities for calculation of the post-test probability. 25
Results
Search results, study characteristics, and quality assessment
The initial search provided 65 studies. After the screening process, only 10 studies were found to meet the eligibility criteria and were included in the study (Fig. 1).13–22
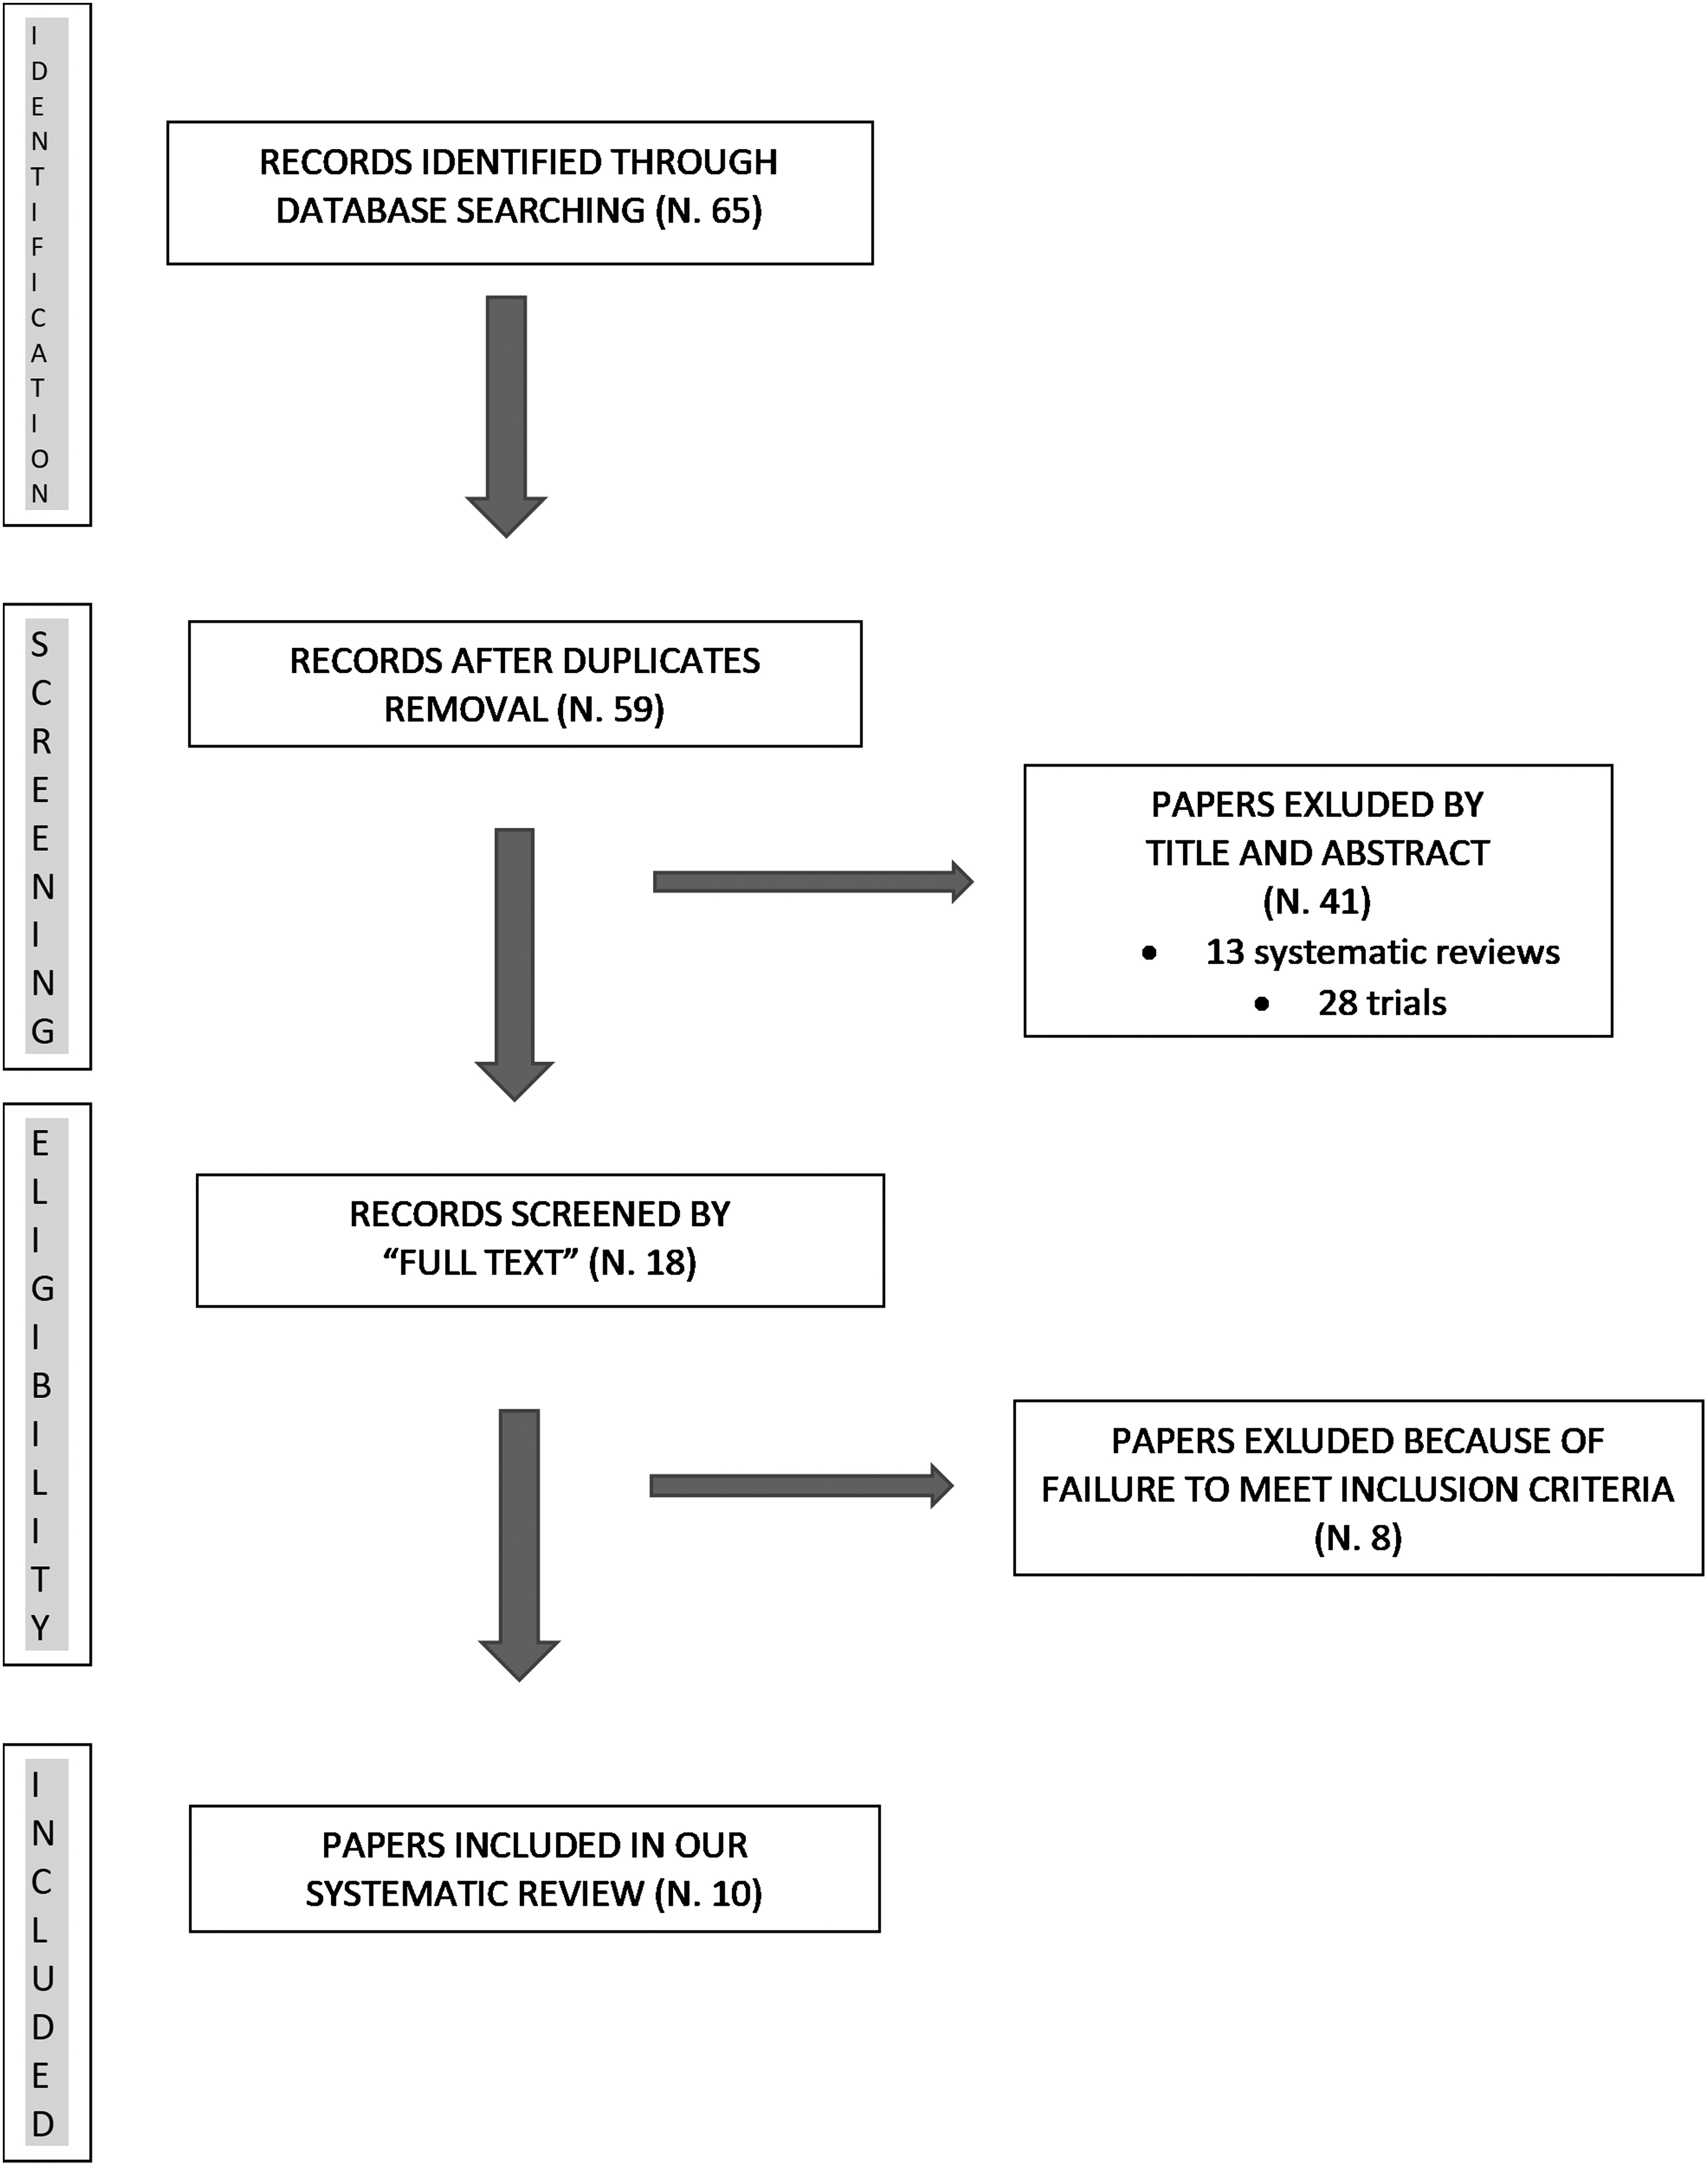
Flow diagram for study selection.
The detailed characteristics of the included studies are presented in Table 2. All the included studies, except one, 13 had retrospective design. In nine studies,13–18,20–22 the MSIS criteria6-8 were used as a reference standard for the PJI diagnosis. Chen et al. 19 considered as affected by PJI the patients of whom hip and knee revision surgery intra-operative samples yielded to positive cultures. Sample sizes in the included studies ranged from 75 to 565 and the cutoff for fibrinogen test varied from 3.57 g/L to 5.19 g/L. In all the included studies the venous blood samples were collected preoperatively. Eight studies13–15,17,18,20–22 applied clear exclusion criteria to rule out patients with hypercoagulation and inflammatory disorders, which may influence the interpretation of the fibrinogen test value. The quality assessment of the included study was performed using the QUADAS-2 tool 24 (Supplementary Figure S1 and S2).
Included Studies Characteristics
MSIS = Musculoskeletal Infection Society; PJI = peri-prosthetic joint infection; NR = not reported; P = prospective; R = retrospective; Youden = Youden J Index.
The main risk of bias was found in the index test domain, because all studies except one 18 had not pre-specified the threshold value, but determined the optimal threshold for each marker as a diagnostic tool for PJI using the Youden J index. No substantial applicability concerns are present.
Diagnostic accuracy and clinical utility of fibrinogen in detecting PJI
Ten studies13–22 were included in our analysis, in which there were 615 PJI patients of 1,928 total cases. The pooled sensitivity for PF was 0.81 (95% CI, 0.75–0.86) and the pooled specificity was 0.82 (95% CI, 0.76–0.86) (Fig. 2). The AUROC was 0.88 (95% CI, 0.85–0.91) (Fig. 3). The DOR for PF was 19 (95% CI, 14–26). The PLR and NLR of the fibrinogen test for PJI detection were 4.4 (95% CI, 3.5–5.6) and 0.23 (95% CI, 0.18–0.30). The post-test probability was calculated using the 25% pre-test probabilities due to the relatively low incidence of PJI. The positive likelihood ratio was 4 and the negative likelihood ratio was 0.23. The post-test probabilities positive and negative of PJI were respectively 59% and 7% (Supplementary Figure S3).

Forest plot of the accuracy of fibrinogen in the diagnosis of prosthetic joint infection.

Summary receiver operating characteristic (SROC) area under the curve for the diagnostic value of fibrinogen in prosthetic joint infection.
Heterogeneity analysis
The analysis showed significative heterogeneity among studies with an I2 = 88 (95% CI, 75–100), in particular, I2 was 54.95 (95% CI, 22.92–86.98) for sensitivity and 81.77 (95% CI, 71.30–92.23) for specificity. The correlation (mixed model) was −0.86 and the proportion of heterogeneity likely due to the threshold effect was 0.74. These results indicate that threshold effect could be a relevant source of heterogeneity.
The bivariable box plot showed that only one study 17 was outside the 95% CI for heterogeneity (Supplementary Figure S4). We repeated the sensitivity analysis by excluding the source of heterogeneity identified, obtaining: sensitivity, 0.82 (95% CI, 0.78–0.86); specificity, 0.81 (95% CI, 0.75–0.86); PLR, 4.4 (95% CI, 3.3–5.7); NLR, 0.22 (95% CI, 0.18–0.27); DOR, 20 (95% CI, 14–28); AUROC, 0.88 (95% CI, 0.84–0.90); I2 = 81 (95% CI, 60–100). The results obtained were consistent with previous analysis, but, interestingly, the proportion of heterogeneity likely due to threshold effect increased to 1.00.
Meta-regression
A univariable meta-regression was performed to individuate further potential sources of heterogeneity. The covariates included in the analysis were: sample size >100, PJI cases >50, the exclusion of coagulation disorders and inflammatory arthritis from the sample, and the threshold included in the interquartile range for the thresholds used in all the studies (median, 3.735 g/L; 25% percentile, 3.61 g/L; 75% percentile, 4.01 g/L; studies were included in the subgroup if the cutoff was ≥3.61 g/L and ≤4.01 g/L). The last covariate was introduced with the aim to reduce the amount of heterogeneity due to the wide variability of the cutoff among the included studies.
The covariate sample size >100 deeply impacts the heterogeneity for sensitivity (p < 0.001); the presence of 50 or more patients with PJI and the threshold included in the interquartile range (IQR) significantly influenced heterogeneity for both sensitivity and specificity (p < 0.01). Finally, the exclusion of patients with coagulation or inflammatory disorders significantly impacts the heterogeneity for specificity (p < 0.01) (Supplementary Figures S5). On the basis of these findings, a subgroup analysis was performed.
Subgroup analysis
In the subgroup of sample size >10014–18,20–22 the pooled sensitivity and specificity were 0.78 (95% CI, 0.73–0.83) and 0.83 (95% CI, 0.78–0.88), respectively; in the subgroup of patients with PJI >5013,14,17,20–22 the pooled sensitivity and specificity were 0.80 (95% CI, 0.73–0.86) and 0.82 (95% CI, 0.76–0.88), respectively; in the subgroup of coagulative- or inflammatory disorders-excluded patients13–15,17,18,20–22 the pooled sensitivity and specificity were 0.81 (95% CI, 0.75–0.87) and 0.81 (95% CI, 0.75–0.86), respectively; in the subgroup of the IQR thresholds14–16,18,19,22 the pooled sensitivity and specificity were 0.81 (95% CI, 0.74–0.88) and 0.82 (95% CI, 0.76–0.88), respectively (Table 3).
Subgroup Analysis
CI = confidence interval; PJI = peri-prosthetic joint infection; IQR = interquartile range.
Statistically significant.
Publication bias
The Deeks' funnel plot asymmetry test for DOR had not highlighted significant asymmetry (p = 0.26) (Supplementary Figure S6). The risk of publication bias is low.
Plasma d- dimer sensitivity analysis
Seven studies14–16,18,19,21,22 were included in our analysis, in which there were 350 patients with PJI of 1,328 total cases. The pooled sensitivity for plasma
Discussion
The diagnosis of PJI can be challenging, signs and symptoms are often tricky, and there is no test showing absolute accuracy. 8 Several potential biomarkers have been evaluated, but the gold standard for detecting PJI has not yet been identified.8,29 However, the attempt to find an ideal biomarker is crucial to improve the sensitivity and specificity of the current diagnostic algorithms. Compared with synovial biomarkers, circulating blood biomarkers play a more important role in screening suspected patients.
Plasma PF was reported to be a reliable markers in several infective diseases.9,10,30,31 PF is a homodimeric soluble glycoprotein of 340 kDa, composed of three polypeptide chains (Aα, Bβ, and γ) and synthesized by hepatocytes. 32 PF, as well known, plays a crucial role in the coagulation process, being converted into fibrin to stabilize blood clots. PF, however, is also associated with the activation and mediation of inflammatory process and its production can be upregulated by infective events.9,10 The mechanisms involved are multiple and not all well-defined. Platelets and PF, for example, play important roles in mediating neutrophil–endothelial cell adherence in septic shock 30 and neutrophil a-defensins induced the formation of PF and thrombospondin-1 amyloid-like structures, entrapping bacteria and fungi. 31
Several authors have recently shown how plasma PF could be an accurate and reliable biomarker in diagnosing PJI.13–22 The analysis performed in the current study indicates that plasma fibrinogen test is a promising biomarker for PJI diagnosis, with a pooled sensitivity of 81% and a pooled specificity of 82%. Interestingly, the DOR is 19, indicating a high diagnostic value (the diagnostic value increases as DOR increases when DOR >1).
Our results are consistent with those reported by the meta-analysis of Zhang et al. 33 (sensitivity, 0.84 [95% CI, 0.78–0.98]; specificity, 0.80 [95% CI, 0.76–0.84]; DOR, 12.4 [95% CI, 5.85–26.28]; AUROC, 0.87 [95% CI, 0.85–0.89]) and slightly better than those reported by Xu et al. 34 (sensitivity, 0.79 [95% CI, 0.70–0.85]; specificity, 0.73 [95% CI, 0.57–0.85]; DOR, 10.14 [95% CI, 6.16–16.70]; AUROC, 0.83 [95% CI, 0.79 – 0.86]).
To further investigate the clinical or patient-relevant utility of the test, we used the likelihood ratios to calculate post-test probability based on Bayes theorem and visually presented the results through a Fagan nomogram (Supplementary Figure S6). Given the pre-test probabilities of 25%, the post-test probabilities of a positive result were 59% and the probabilities of a negative result was only 7%, indicating that a negative test result could be very helpful to exclude PJI. The positive likelihood ratio of four indicates that a patient with PJI is four times more likely to have a positive test result, than a patient without PJI.
In 2018 Parvizi et al.
8
revised the MSIS criteria for PJI diagnosis, including
A recent systematic review and meta-analysis investigating the role of
Higher values of sensitivity and specificity are actually reported for serum
However, in our meta-analysis, the exclusion of coagulative or inflammatory diseases influenced the heterogeneity for specificity, the subgroup analysis did not show variations in sensitivity or specificity, indicating that PF could preserve its validity in that group of patients. These data suggest that PF may be a preferable biomarker for diagnosing PJI in patients with coagulation diseases or inflammatory arthritis, where
The ideal cutoff for PF test in PJI diagnosis is still unclear. The diagnostic threshold varied widely among studies (from 3.57 g/L to 5.19 g/L) and this influences the heterogeneity in the meta-analysis. To identify an appropriate threshold is mandatory because its value has an important impact on the diagnostic value of the test. Additional large-scale prospective studies are desirable to confirm the optimal cutoff values for the PF in diagnosing PJI. In our study we have tried to reduce the amplitude of the threshold range by performing a subgroup analysis excluding reports with a threshold not included in the IQR of all the threshold used. Interestingly, although this expedient impacts heterogeneity, it did not change the values of sensitivity and specificity.
Our meta-analysis presents some limitations. First, only one of the included studies was performed on a European population, 13 the remaining nine are based on a Chinese population and this could be a source of bias. A second limitation is the high heterogeneity among studies. One of the main sources of heterogeneity was the threshold variability. The results of the PF test were interpreted as negative or positive with different cutoff values and the level of PF could vary on the base of the severity of the infection. Third, only one 13 of the 10 included studies is prospective and only six13,14,36,20–22 reported a number of patients with PJI major than 50. The latter parameter influenced heterogeneity in our analysis.
The strengths of our study are multiple: this is, in our knowledge, the first meta-analysis about PF in diagnosing PJI with a sample size of patients large enough to allow to perform a proper meta-regression and subgroup analysis and to rule out publication bias. PJI is a low-incidence complication and the sample sizes in this kind of study are often reduced. Second, by investigating the potential factors able to influence the diagnostic accuracy of the test, we have found that PF could perform better than other biomarkers in diagnosing PJI in patients with coagulation diseases or inflammatory arthritis, conditions widely present in patients undergoing prosthetic surgery.
Conclusions
Plasma PF is a promising marker in diagnosing PJI. The pooled data of sensitivity and specificity presented good clinical validity and, interestingly, apparently are able to maintain their diagnostic power in patients with coagulative or inflammatory disease. Further studies are needed to confirm these findings.
Footnotes

References
Supplementary Material
Please find the following supplemental material available below.
For Open Access articles published under a Creative Commons License, all supplemental material carries the same license as the article it is associated with.
For non-Open Access articles published, all supplemental material carries a non-exclusive license, and permission requests for re-use of supplemental material or any part of supplemental material shall be sent directly to the copyright owner as specified in the copyright notice associated with the article.
