
Abstract
Abstract
Understanding the process of ex vivo embryonic stem (ES) cell differentiation is important for generating higher yields of desirable cell types or lineages and for understanding fundamental aspects of ES differentiation. We used DNA microarray analysis to investigate the differentiation of mouse ES cells cultured under three differentiation conditions. Embryoid body (EB) formation was compared to differentiation on surfaces coated with either gelatin (GEL) or matrigel (MAT). Based on the transcriptional patterns of a list of literature-based “stemness” genes, ES cell differentiation on the two coated surfaces appeared similar but not identical to EB differentiation. A notable difference was the GEL and MAT upregulation but EB downregulation of nine such stemness genes, which are related to cell adhesion and epithelial differentiation. Further, GEL and MAT differentiation showed higher expression of bone formation–related genes (Spp1, Csf1, Gsn, Bmp8b, Crlf1). Gene ontology analysis shows an increase in the expression of genes related to migration and cell structure in all three conditions. Overall, GEL and MAT conditions resulted in a more similar to each other transcriptional profile than to the EB condition, and such differences are apparently related to higher nutrient and metabolite gradients and limitations in the EB versus the GEL or MAT cultures.
Introduction
A standard approach in ES cell differentiation is the formation of embryoid bodies (EBs), which are cell aggregates derived from ES cells. This approach carries some limitations: notably, that of nutrient and metabolite transport limitations from/to the core of the EB to/from the culture medium. This may result in necrotic cells in the core of the EB during the first 5 days prior to vascularization. 20 Another limitation is the lack of control over the concentration of growth factors/differentiation agents inside EBs. The latter would result in production of a more heterogeneous cell population as a culture output. Thus, using surface differentiation protocol, whereby all cells can be exposed to similar concentrations of nutrients and differentiation agents, would likely result in a more homogeneous culture outcome.
Here, using DNA microarray analysis, we characterize and compare three differentiation conditions: the standard EB differentiation protocol and two surface differentiation protocols, one using gelatin-coated plates (GEL) and the other Matrigel-coated plates (MAT). Previous studies have shown the ability to differentiate ES cells into hematopoietic and endothelial lineages using a surface (gelatin- or collagen-coated plates) differentiation protocol, whereby formation of EBs is avoided. 21 Other studies have shown that when using ECM components such as Matrigel, differentiation outputs include cells of the endothelial, 22 pancreatic, 23 vascular, and endothelial 24 lineages. None of these studies used global gene expression analysis to examine the transcriptional programs underlying differentiation.
Materials and Methods
Chemicals and materials
High-glucose DMEM, gelatin, and penicillin/streptomycin were purchased from Sigma (St. Louis, MO); nonessential amino acids, sodium pyruvate, and fetal calf serum from Gibco-Invitrogen (Carlsbad, CA); and LIF from Chemicon Int. (Temecula, CA). Matrigel matrix Growth Factor Reduced (MATGFR) was purchased from BD Biosciences (San Diego, CA). Total RNA isolation mini kit, Low RNA input fluorescent linear amplification kit, mouse oligo microarrays (G4121A), and hybridization kits were purchased from Agilent Technologies (Wilmington, DE).
Embryonic cell cultures
Murine ES R1 cells 25 (a gift from Dr. Peter Zandstra, University of Toronto) were cultured on gelatin-coated flasks in ES-MEM medium (DMEM high glucose, 0.1 mM nonessential amino acids, 1 mM sodium pyruvate, 100 mM 2-ME, 2 mM L-glutamine, 15% fetal bovine serum [FBS], penicillin/streptomycin 50 mg/mL each, and 1000 U LIF/mL). Cultures were carried out in a humidified incubator at 37ºC with 5% carbon dioxide. For the differentiation protocols, the medium used was ES-Diff (same as ES-MEM but without sodium pyruvate and without LIF). Three conditions were used for cell differentiation: EB formation, where the cells were cultured in nonadherent plastic dishes; GEL plates; and MAT plates. GEL plates were coated with a solution at 0.1% gelatin, the standard gelatin concentration for undifferentiated state maintenance of ES cells. Gelatin coating was used after trying to differentiate the cells on tissue culture–treated plates with no success (the cells still formed some EBs). MAT plates were treated with a 0.1% Matrigel protein (MATGFR). This concentration was chosen to achieve the same protein concentration as the GEL plates. Since cell growth is fast during the first day of differentiation, seeding densities were adjusted to obtain sufficient cell numbers for cell counting and RNA extraction at the day of harvest and to avoid cell replating for plates processed on days 5 and 7. The medium was changed every other day. Cell samples from days 0, 3, 5, and 7 were flash frozen in liquid nitrogen for subsequent RNA isolation. Three independent biological replicate experiments were carried out.
DNA microarray analysis
Total RNA was extracted using Agilent's Total RNA isolation mini kit. RNA integrity was evaluated using a Bioanalyzer 2100 (Agilent, Palo Alto, CA). Microarray analysis was based on the reference design, 26 whereby all samples are hybridized against a common reference RNA (see below). This allows for any desirable comparative analyses (here, time course analysis or comparison between differentiation conditions) by examining appropriate expression ratios. The reference RNA, which is meant to contain as many possible transcripts as possible such that meaningful expression ratios can be measured, was a pool of RNA from one experiment, whereby samples were taken daily from an EB experiment for 7 days. Total RNA was extracted and equal amounts from each day were pooled together. Reference RNA was labeled with Cy5 and samples with Cy3 using Agilent's Low RNA input fluorescent linear amplification kit. Agilent microarrays were used according to manufacturer's instructions. Slides were scanned using the Agilent Microarray Scanner G2565BA. Agilent's Feature Extraction software (G2567AA, version 7.2) was used to identify spot and feature outliers. Spot quality was assessed, and if not discarded, multiple spots of the same gene were averaged (geometric mean). The SNNLERM algorithm 27 was used to calculate normalized signal intensity ratios and confidence levels. Calculations of expression ratios for the various comparisons (time course or between conditions) were performed with Microsoft Excel. Differentially expressed genes were determined using ANOVA 28 considering three biological replicates. After the selection of differentially expressed genes, the biological replicates were averaged and were analyzed using hierarchical clustering 29 and Gene Ontology (GO) analysis tools of MultiExperiment Viewer (MeV) 30 (The Institute for Genomic Research [http://www.tigr.org/software/tm4/menu/TM4_Biotechniques_2003.pdf]). GO analysis is based on the Expression Analysis Systematic Explorer (EASE) program (version 1.21) (http://david.niaid.nih.gov/david/ease.htm), which identifies overrepresented gene groups within a set of genes using the EASE score. 31 The Self-Organizing Tree Algorithm (SOTA)32,33 implemented in MeV was used to cluster groups of genes judged as statistically significant by ANOVA analysis. Raw and normalized data were deposited in the Gene Expression Omnibus (GEO; GSE8574; http://www.ncbi.nlm.nih.gov/geo/).
Quantitative reverse transcription PCRs (Q-RT-PCRs)
Total RNA was reverse transcribed to cDNA using the High Capacity cDNA Archive Kit (Applied Biosystems [ABI], Foster City, CA). PCR reactions were based on the ABI Assay on Demand kit for each gene. Ten μg of RNA of each sample was processed according to manufacturer's directions. Primers (ABI) for the following functionally diverse set of genes were used: GATA binding protein 4 (Gata4), Fibroblast Growth Factor 5 (Fgf5), POU domain, class 5, transcription factor 1 (Pou5f1/Oct-4), and Brachyury (T). Genes were chosen to reflect differentially expressed genes between culture conditions and time points of a wide range of microarray signal intensities and as representatives of each of the germ layers: Gata4 (primitive endoderm 34 ), Fgf5 (ectoderm 35 ), and Brachyury (mesoderm 36 ). We used Gapdh as a normalization (housekeeping) gene. 37 PCR reactions were carried out 26 using the TaqMan Universal PCR Master Mix (ABI) in 96-well plates on a Bio-Rad iCycler (Bio-Rad, Hercules, CA). Q-RT-PCR assays for the four selected genes were carried out for four time points for each of the three culture conditions. Microarray data are available for almost all of the conditions and time points. Triplicate reactions for each sample were carried out, and the results averaged. Further processing was performed with the iCycler software to obtain Ct values. A dilution curve prepared with reference RNA used in the microarray experiments was used to calibrate the resulting values to correct for variations in RNA amounts used.
Flow cytometry analysis
Tie-2 and its secondary antibody (FITC) were purchased from Chemicon; Ter119 (FITC), CD45 (PerCP), CD31 (PE), CD34 (PE), and ACE (FITC) were purchased from BD Biosciences. Flow cytometry was carried out as described. 38 Briefly, cells were dissociated by incubating for 2 min in a PBS buffer with 7.5 mM EDTA, and then the cells were washed twice in a PBS buffer with 4% FBS. Incubation with antibodies was carried out for 30 min at 4°C in the dark. Afterward, cells were washed twice with PBS with 4% FBS and resuspended in the same buffer. The 10,000-gated events from each tube were acquired using a FACScan cytometer (BD Biosciences) and analyzed using CellQuest (BD Biosciences).
Results
Characteristics and reproducibility of ES differentiation protocols and the associated global transcriptional patterns
Three differentiation protocols were used to examine the transcriptional profile of differentiating ES cells. One of the differentiation protocols was the standard EB formation, and the other two employed two different coated surfaces (GEL, MAT) without formation of three dimensional cell structures. The surface-coated differentiation protocols were chosen as a means for better control of the concentration of metabolites, nutrients, and growth factors, or signals produced by the differentiating cells. The expectation was that they would provide as an output a more homogeneous cell population. Three biological replicates were carried out for each condition. For each condition, growth rates, glucose consumption rates, and gene expression profiles for each of the replicate cultures were similar, and thus the cultures and conditions were deemed as very reproducible (data not shown).
Transcriptional patterns of stemness genes
Several studies have examined the stemness genes that define the pluripotency in different stem cell types, from ES cells to adult hematopoietic, neural, and other stem cells.12–15,39,40 Among these, three studies have carried out microarray analysis in order to identify gene candidates for stemness: Ivanova et al. (2002), Ramalho-Santos et al. (2002), and Fortunel et al. (2003). Based on these three studies, only one gene was common to all different stem cells. However, for murine ES cells, that number increases to 320 genes. Two hundred and fourteen of those genes (Supplemental Table 1 and Supplemental Fig. 1, available online at www.liebertonline.com/ten) are present on the Agilent microarrays used here. If the aforementioned genes correspond to the stemness state, their expression profile should show a decrease as differentiation progresses. In our study, most of these 214 genes show a decreasing profile over time, in particular, Nanog and Oct-4, which are the genes identified as characterizing the undifferentiated state in mouse ES cells (we will revisit these two genes later). However, there is a group of 31 genes whose expression increases during the 7 days of differentiation examined in our study. These genes were split into two groups: one made up of those whose expression increased in all differentiation conditions (21 genes; group 1 in Supplemental Table 2, available online at www.liebertonline.com/ten), and the other made up of genes whose expression decreased in the EB condition but increased in the other two differentiation conditions (9 genes; group 2 of Supplemental Table 2). The expression pattern of group 1 would disqualify them from being classified as stemness genes. Consistent with that assessment, in vivo, expression of most of the genes in this first group reaches a peak around Theiler stages 10 to 20.41,42 There is no in vivo expression data for two of the 31 genes with profiles increasing over time, Ercc5 and Sca10 (Atxn10). We observed a common functional theme in the genes of the second group (marked in yellow in Supplemental Fig. 1, and listed as group 2 in Supplemental Table 2), whose expression increases in conditions GEL and MAT but decreases in EB. This theme is related to cell adhesion and epithelial differentiation: Perp has a potential function in epithelial structures and development. 43 Lamc2 codes for an ECM glycoprotein that participates in differentiation and cell migration, 44 and facilitates the basal membrane assembly; expression of Sprr2a has been described to play a role in epithelial differentiation45,46; Igfbp2 induces the expression of integrin a5, 47 and its interaction is essential for its function in cellular migration 48 ; Tjp1 is part of the “Tight junctions” and forms a scaffold with F-actin; Spint1(Hai-1) expression is correlated with the expression of epithelial cell markers 49 as well as with a function in branching during embryonic development and morphogenesis 50 ; Cldn6 is present in tight junctions and has a function in epitheliazation, 51 while its overexpression causes a defect in the “epidermal permeability barrier” 52 ; when the expression levels of Csrp2 decrease, cell migration increases 53 ; Ddit4 (Redd1) is activated by Hif-1 and was shown to be essential for prostatic cancer invasiveness. 54
It is worth noting the subtleties of the decreasing expression patterns of the two genes widely accepted as stemness genes, Pou5f1 (Oct-4) and Nanog. The Nanog expression patterns and levels are quite comparable between the three conditions. The Pou5f1 (Oct-4) profiles are somewhat different however. In EB, the expression decreases much faster between days 3 and 5, while the decrease in its expression in GEL and MAT is accelerated between days 5 and 7, but in all three conditions, the final levels of expression were similar (Fig. 1). Such expression differences could be explained by the known mode of function of Oct-4 in differentiation. Niwa et al. (2000) reported that depending on the level of expression of Oct-4, stem cells' fate was different. A small increase in its expression promotes differentiation toward primitive endoderm and mesoderm, repression of Oct-4 results in loss of pluripotency and differentiation toward trophectoderm, and midlevel expression allows the maintenance of pluripotency. 55
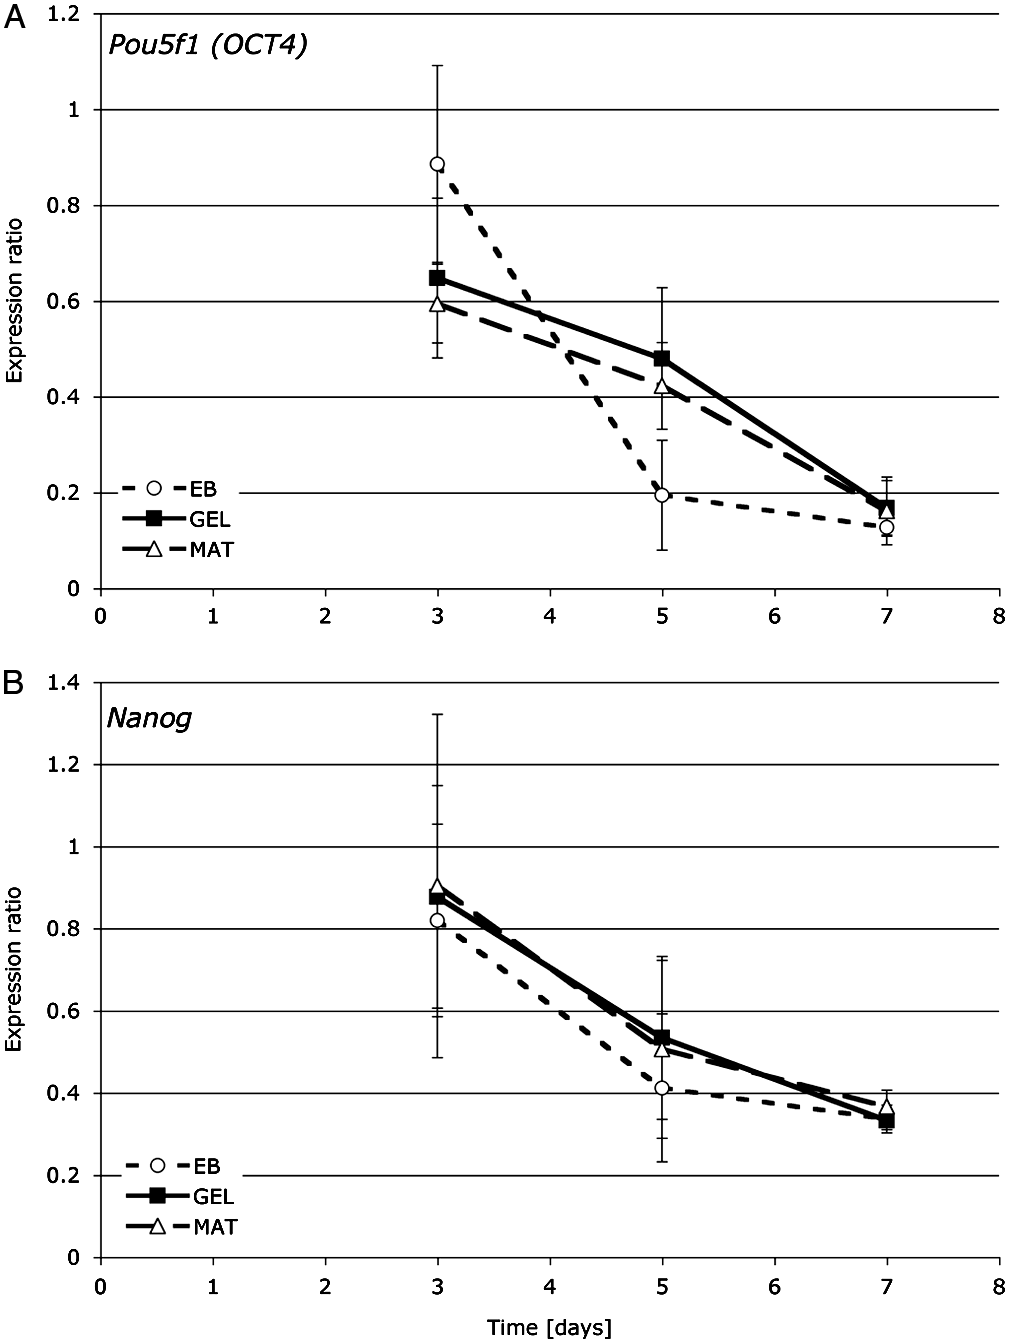
Expression profiles of Pou5f1 (Oct-4) (
Q-RT-PCR versus microarray data
Q-RT-PCR analysis was carried out on samples of different conditions and time points. The selected genes for this analysis were Oct-4, the standard differentiation indicator, Gata4, Brachyury, and Fgf5 as representatives of differentiation of each germ layer, endoderm, mesoderm, and ectoderm, respectively. We used Gapdh as a housekeeping gene. 37 Ratios between each gene and Gapdh were used to compare the expression values with the microarray data. Data were normalized to day 0 to better assess differences between the three culture conditions. While we find directional agreement (which is the crucial point here) between the Q-RT-PCR and microarray data for all four genes (Supplemental Fig. 2, available online at www.liebertonline.com/ten), we observe substantial quantitative differences for a few time points, whereby Q-RT-PCR ratios are typically higher than microarray expression ratios (a rather typical finding26,56), with a few exceptions for Oct-4 and Gata4. Gapdh data from microarrays corresponding to day3 in EB condition and day 5 for MAT condition were flagged and were not considered for the analysis. The Q-RT-PCR data showed large intrasample variability (data not shown), and generally, Q-RT-PCR data cannot be assumed to be any more accurate than good microarray data.
ANOVA analysis of gene expression
A two-factor ANOVA analysis was performed on the averaged gene expression data on days 3, 5, and 7, which were normalized by the corresponding value on day 0. Each factor had three levels: the “Time” factor (days 3, 5, and 7) (Supplemental Fig. 3, available online at www.liebertonline.com/ten), and the “Condition” factor (EB, GEL, and MAT) (Supplemental Fig. 4, available online at www.liebertonline.com/ten). Subsequently, SOTA clustering was applied to the genes judged as significant by ANOVA analysis for each factor. Two main clusters were identified in the Time factor ANOVA analysis, one with genes whose expression increased over time and the other with expression decreasing over time, marked in yellow and blue, respectively (Supplemental Fig. 3).
During differentiation, the downregulated gene cluster is highly enriched in genes related to metabolism, DNA binding, biosynthesis, cell cycle, and DNA replication
Seven hundred twenty three genes identified by ANOVA Time factor analysis show a decrease in expression over time, while 842 genes show increased expression (Supplemental Fig. 3). These patterns suggest that as they differentiate, cells abandon certain cellular programs and capabilities downregulating a large number of genes, and acquire new specialized functions by expressing an even larger number of genes. In order to obtain a global picture as to which programs and functions are abandoned by the differentiating cells, we carried GO analysis. The main categories with EASE scores between 6.37 × 10⁻⁷ and 9.3 × 10⁻⁵ are related to metabolism, biosynthesis, cell cycle, and proliferation (Table 1). Differentiation is typically associated with reduced metabolism and cycling, so these findings make sense and strengthen the validity and value of our microarray analysis. Some genes are worth noting. Dppa5 (Esg1) expression has been correlated with Oct-4 and Nanog expression, suggesting that Dppa5 is important in the maintenance of the pluripotential state of ES cells 57 ; yet, it has been shown that said Dppa5 is dispensable in embryonic development. 58 Another interesting gene is Gdf3, a member of the transforming growth factor β/bone morphogenetic protein (TGF β/BMP) pathway that works by inhibiting the signaling cascade through BMP and is able to modulate, depending on its level of expression, the pluripotency state or the start of a differentiation process. 59 Several genes coding for DNA-binding proteins clustered together: Gdf3, Phf17 (Jade-1), Sycp3, Slc7a3, Pipox, Dppa5, Cbr3, Plekha4 (Pepp1), Ndg2, transcription factors Nr5a2 and Zfp40, and many Riken sequences (mouse full cDNA clone sequences from the Riken Institute, Japan, http://fantom2.gsc.riken.go.jp/). Many of these genes code for zinc finger proteins typically localized in the nucleus. Many of the Riken sequences also correspond to zinc finger and metal ion–binding proteins in the nucleus. For example, Phf17 codes for a protein that has two zinc fingers and stabilizes von Hippel-Lindau protein (pVHL), a tumor suppressor in renal cancer,60,61 and the Sycp3 protein is involved in the meiosis process. 62 Slc7a3 codes for a specific cationic amino acid transporter in the brain, 63 and Zfp40 for a zinc finger protein expressed in germ cells in neuronal embryonic tissue. 64 In summary, GO analysis suggests that the genes whose expression decreases are associated with cell metabolism and cycling, and that many of these genes code for proteins that are localized in the nucleus and contain zinc fingers.
Increased expression of genes related to regulation of transcription and also to cell migration and cell structure–related functions
Upon GO analysis, genes with an increasing expression profile (Supplemental Fig. 3) show enrichment in genes related to negative regulation of transcription (EASE score 3.6 × 10⁻⁴), kinase activity (8 × 10⁻⁴), and protein binding (3.05 × 10⁻³) (Table 1). For example, in the category “regulation of transcription,” Zmynd11 (BS69) codes for a zinc finger protein that has been postulated as a tumor suppressor. 65 Stat3 codes for a widely recognized transcription factor in different signaling functions being activated by a variety of growth factors and interleukins. It is involved in the Jak/Stat signaling cascade through gp130, 66 which is also used by Lif. Irf2 is induced by IFNγ and is implicated in epithelial organization. 67 Hipk2 is implicated in UV-dependent apoptosis and participates in the Wnt/Nlk signaling cascade. 68 Snai2 is involved in the formation of the neural crest 69 and has also an important role in metastasis of melanoma cells. 70 Many of the genes in this category (regulation of transcription) are related to cell migration and structure maintenance.
Bone formation–related genes present higher expression in surface differentiation protocols compared to EB formation
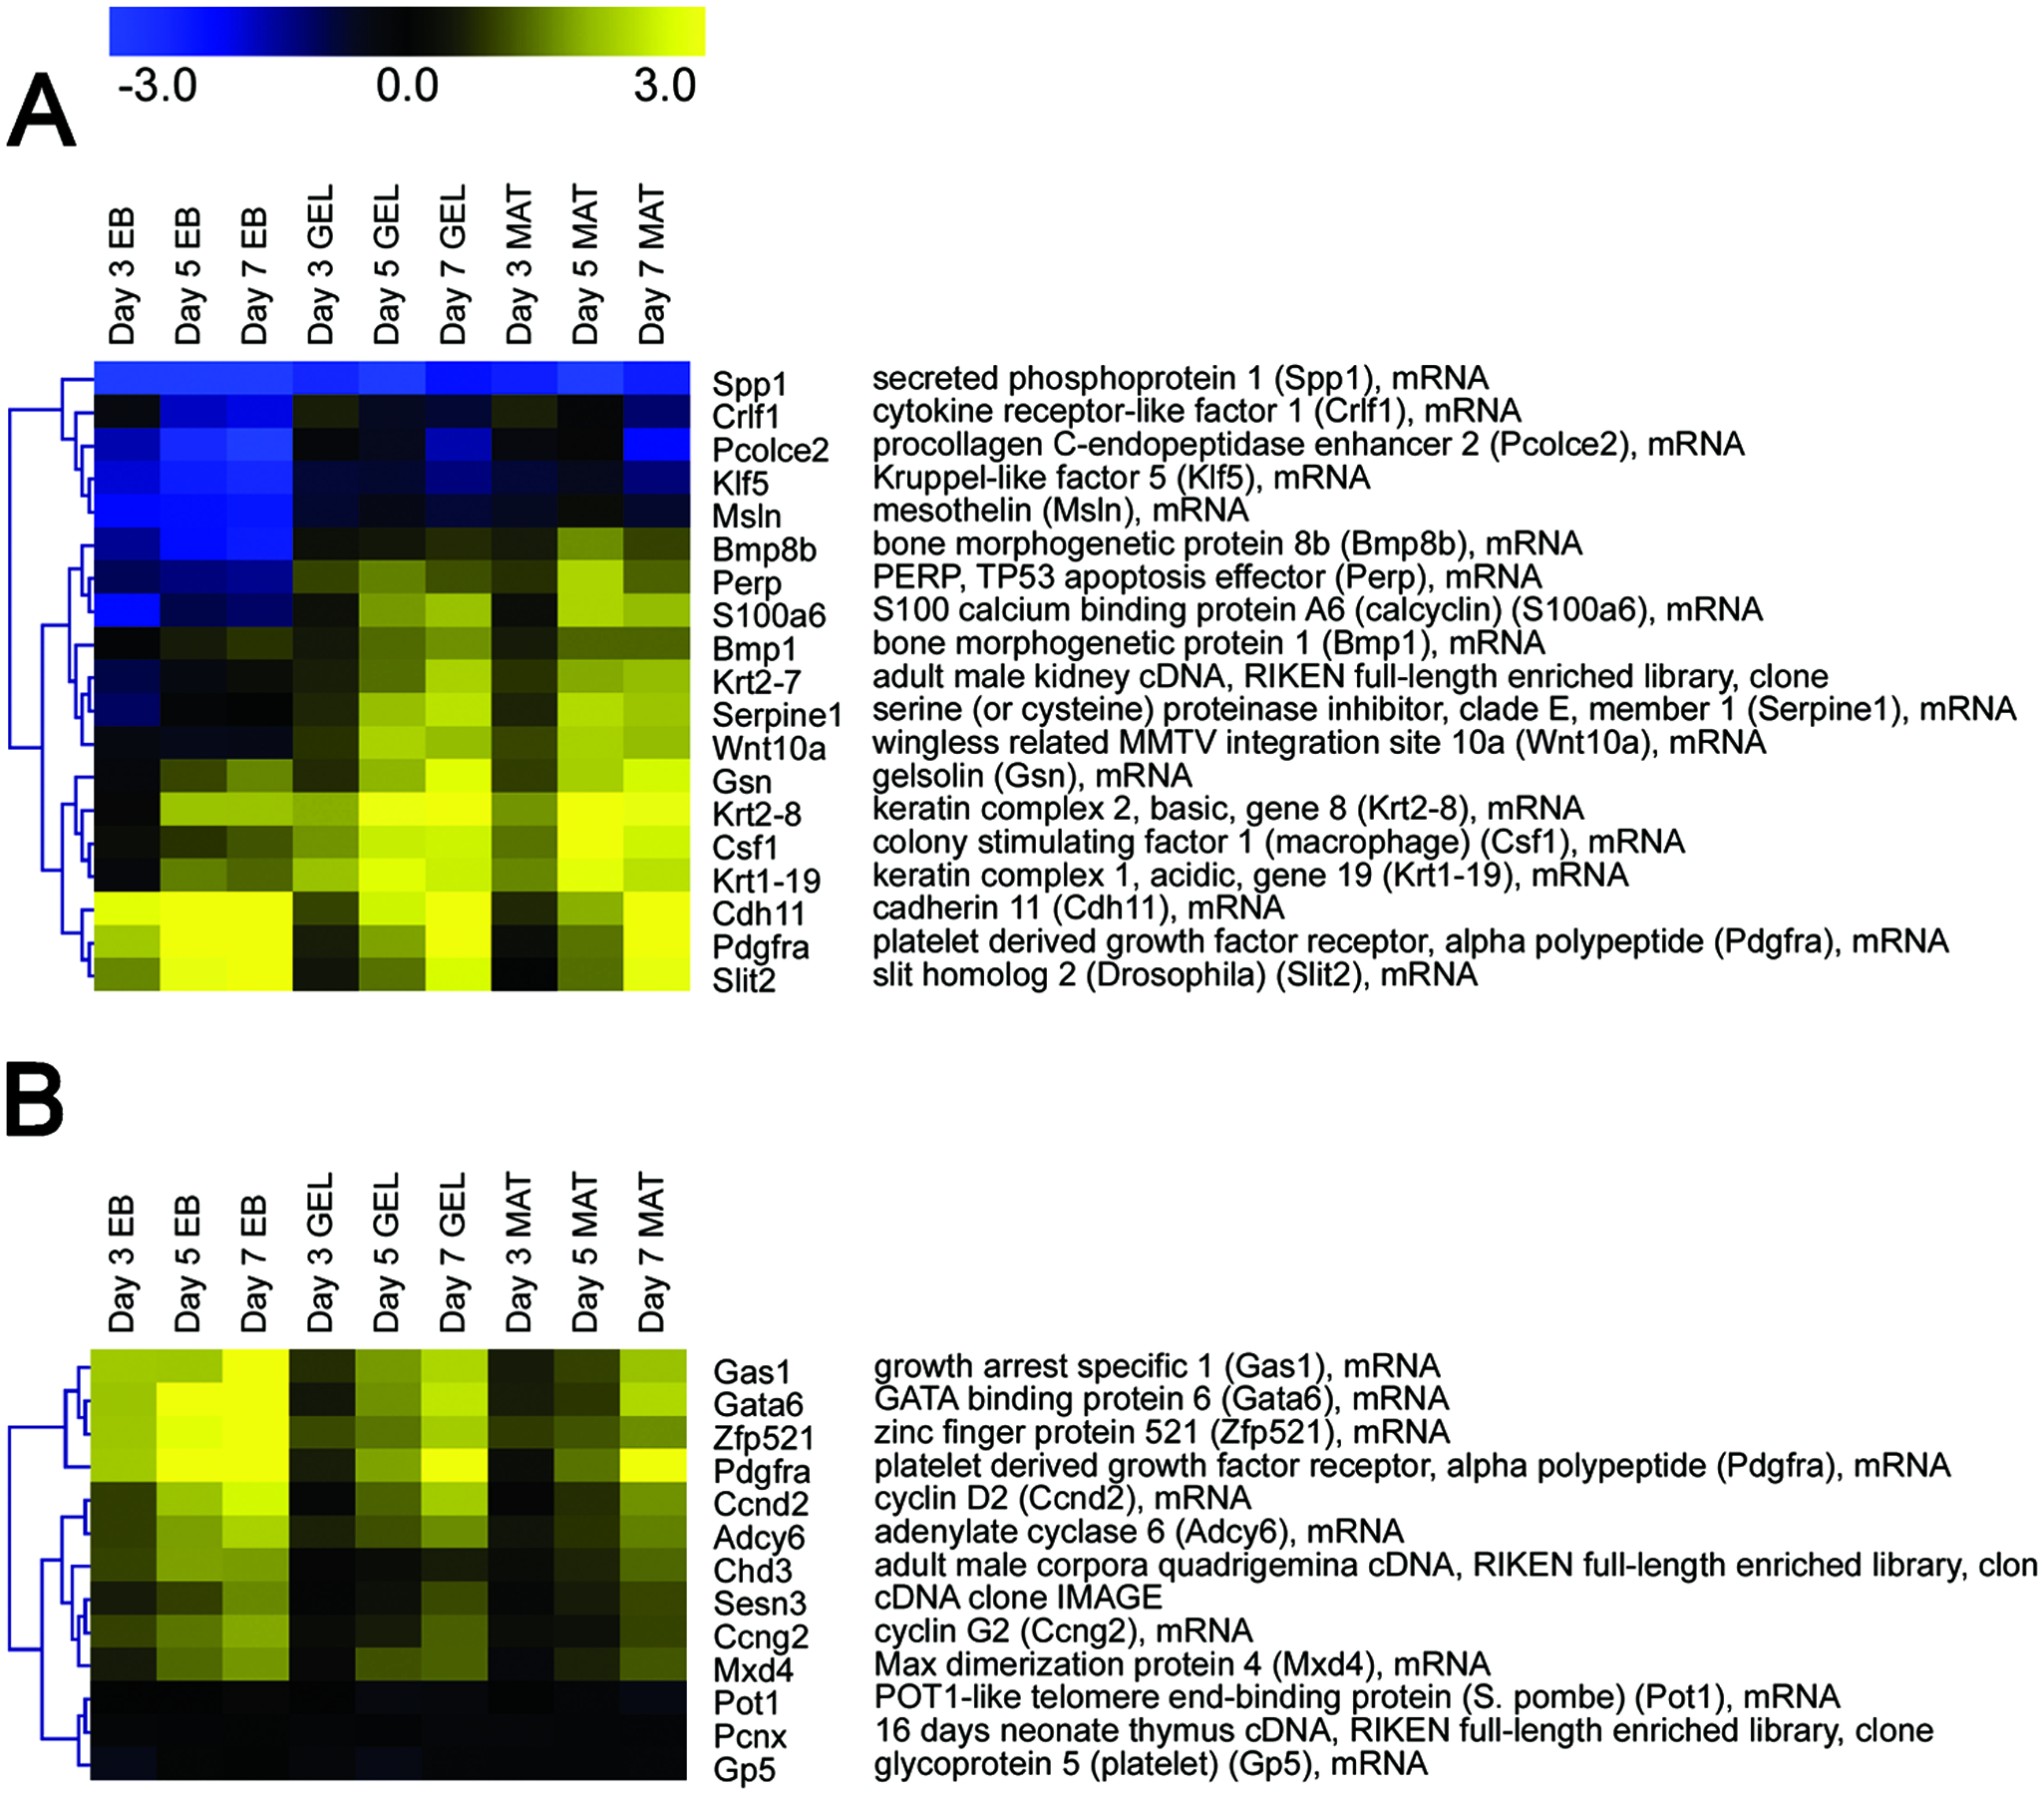
SOTA clustering was performed on the list that was significant for the Condition factor in ANOVA analysis. One of those clusters showed a mostly higher expression in surface differentiation protocols compared to EB differentiation. This cluster (Fig. 2A) includes Pdgfrα (coding for the platelet-derived growth factor receptor alpha, PDGFRα) which is expressed during the G0 phase of the cell cycle. 71 In embryo development, the PDGFR system is essential for the development of lung and connective tissues, the kidney, cardiovascular system, and brain. 72 Generally, the PDGFR system is located primarily on mesenchymal cells and transduces signals for cell survival, proliferation, and chemotaxis. 73 Also of some interest are the genes Spp1, Csf1, Gsn, Bmp8b, and Crlf1, which display higher levels of expression in GEL and MAT compared to EB. These genes are related with the differentiation and formation of bone, by osteoclastogenesis and bone marrow maintenance (Csf1 74 ), cartilage and bone formation (Bmp8b/Osteogenic protein 3), osteoblast organization (Gsn 75 ), or expression in osteosarcomas and osteoclasts (Spp1/Osteopontin 76 ).
(
Based on these results we examined the possibility of confirming by immunostaining techniques the bone differentiation characteristic cartilage and mineral deposition. However, based on the literature, these events occur at more advanced stages during development.77,78 Hence, we decided this would not add useful information. Thus, we sought if more general characteristics, namely, endothelial and hematopoietic markers, would provide other means to discriminate among the three culture conditions, since bone formation, endothelium development, and hematopoiesis are all related as they are part of mesoderm development. We performed flow cytometry assays with CD45, Ter119 (hematopoietic markers), Tie2, ACE (endothelial markers), CD31, and CD34 (hematopoietic and endothelial markers). CD31 dynamics on GEL and MAT followed a similar trend, reaching a peak on day 7 (Table 2). CD31 expression was significantly higher (especially in the first 7 days) in EB cells compared to the GEL and MAT. With respect to Tie-2, all three conditions show a low and decreasing level of expression, although the EB condition shows an increase around days 10–12 (Table 2).
CD45 and Ter119 were not detected until day 6, when a substantial increase was detected for EB and a more modest increase for the other two conditions (Table 3), although all levels were in the low single digits. This behavior is consistent with previous reports to the effect that CD45 and Ter119 expression is detected later in development.41,42 CD34 and ACE were not detected during the time period of this study in any of the conditions, which is consistent with the reported late expression for ACE.41,42 These data suggest that endothelium development is higher under the EB versus the GEL and MAT conditions, that hematopoietic development is delayed compared to endothelial development, and that the various markers capture endothelial or hematopoietic development by different expression patterns.
Another interesting group of genes (Fig. 2A) with higher expression levels in GEL and MAT is related with the maintenance/remodeling of intracellular or extracellular structure. Spp1 is involved in formation of cell aggregates; the product of Pcolce2 improves the procollagen I processing through Bmp1, Krt2-8, and Krt2-7; the Krt1-19 protein forms intracellular filaments and participates in differentiation. The Gsn protein organizes the nucleation during different stages of cell division, and Klf5 participates in tissue remodeling at the angiogenesis level. The Serpine1 protein inhibits the degradation of ECM and participates in the remodeling of tissue, Msln participates in cell shape changes, Perp participates in functions of cell adhesion to the extracellular matrix, S100a6 participates in metastasis processes in some cancer, and Wnt10a has been associated to ECM.
Among the genes expressed at higher levels in EB compared to surface GEL or MAT, only Cdh11 and Slit2 (Fig. 2A) are related with structure and tissue remodeling. Cdh11 is mainly expressed in EB: its function is in cell–cell adhesion, is involved in metastasis of some human tumors, 79 and has some function in osteoblast development 80 and in differentiation of hippocampus neurons. 81 Slit2 participates in the definition of neuronal patterns. Nevertheless, the number of genes related to osteogenesis is higher in surface differentiation conditions compared to EB formation.
Genes related with negative regulation of cell cycle are expressed higher in EBs compared to surface differentiation
By GO analysis, the best represented categories among genes expressed higher in EB are nucleotide metabolism, cell cycle regulation, transcription, metabolism, and cell proliferation. Genes with higher expression in surface differentiation protocols are enriched in GO categories such as structural activity molecules, receptor binding, cytoskeleton constituents, and cytokine and chemoattractant activities.
By SOTA clustering of genes identified as significant for the Condition factor in the ANOVA analysis, a group of genes expressed higher in EB was identified to be associated with negative regulation of the cell cycle (Fig. 2B). In this group of genes, Gas1, Ccnd2, and Sesn3 block the entrance to S, while Ccng2 and Pot1 are negative regulators of proliferation and cell cycle progression. This overall upregulation of cell cycle–negative regulators could be connected with the downregulation of cell cycle–related genes we described above. A second group of genes with higher expression in EBs is related with organ formation (Fig. 2B). Such genes represent organ differentiation from the three different germ layers: heart (Gata6, Gas1, Chd3, Adcy6, and Pcnx), nervous system (Zfp521, Mxd4, and Adcy6), and various internal organs (Chd3, Pdgfrα, and Gas1). This contrasts with the surface differentiation protocols since GEL and MAT conditions show higher expression of genes related to bone formation primarily, which is derived from the mesoderm germ layer.
The two surface differentiation conditions (GEL and MAT) display a more similar pattern of gene expression to each other than to EB differentiation
Among the 571 genes identified by ANOVA analysis as being significant for the Condition factor, about half (green cluster) were expressed overall higher in EB than in GEL or MAT, and the other half the other way around (Supplemental Fig. 4). It is notable that the expression patterns among the two surface differentiation conditions (GEL and MAT) were more similar to each other than to EB differentiation. The obvious interpretation is that these differences derive from the presumed differences between the EB and the surface differentiation protocols in the gradients of nutrients (including oxygen),82,83 metabolites, and extracellular signaling molecules as already discussed. Such differences likely result in substantial direct and indirect changes in gene expression patterns as clearly displayed in Supplemental Figure 4 (available online at www.liebertonline.com/ten).
We also assessed the similarity and differences of the three protocols by the distribution properties of cell size (forward scatter, FSC) and inner complexity/granularity (side scatter, SSC) characteristics using flow cytometry. As shown in Supplemental Figure 5 (available online at www.liebertonline.com/ten), the population from the EB condition shows a broader distribution in terms of SSC on day 12 compared to the other two conditions (GEL and MAT), which show only a slight change in SSC and a more pronounced change in FSC. These data show a reduction in cell size in all three conditions but with a more pronounced reduction in EB. The broader distribution of SSC properties in the EB condition indicates a more heterogeneous population in terms of inner organelles and cellular granularity, in contrast to the more homogeneous population in the case of GEL and MAT. Again, based on the FSC and SSC properties, the GEL and MAT cells appear quite similar and very distinct from the EB cells, which is identical to the conclusion drawn from the microarray analysis.
Discussion and Conclusions
A practical aim of ES cell culture is to achieve lineage specific differentiation. To achieve this goal, efforts have focused on identifying genes that make this possible, in order to design protocols for directing differentiation toward a particular cell lineage. In this study we used microarray analysis to compare three different differentiation protocols. The first and frequently used one, formation of EBs, was compared to two surface differentiation (GEL and MAT) protocols. In the past, microarray analysis had been used mainly with pure or isolated cell types, that is, specific cells expressing certain surface markers. Our approach is based on analyzing the whole differentiating population, and the analysis is done by examining the enrichment of genes associated with a cell lineage or program or stemness genes. This approach has the advantage of examining a particular differentiation protocol in terms of enrichment for genes of both expected and unexpected lineages or cellular programs and functions. Here we assessed the impact of the three protocols on the maintenance of stemness, and found similarities but also differences, thus suggesting that each protocol impacts differentiation in a complex multigenic manner that cannot be easily captured by traditional low-throughput methods.
We found that expression of many genes related ontologically to cell metabolism decreases over time for all three protocols. This is consistent with the decrease in the proliferation rate present in all three conditions. It is also worth noting that many of the proteins coded by genes whose expression decreased over time have a nuclear localization and that many of them are DNA-binding proteins containing a zinc finger.
A notable category of upregulated genes for all three differentiation protocols is related to cell migration and structure, and includes genes coding for proteins participating in forming junctional plaques or tight junctions. Genes displaying higher expression in the surface differentiation protocols compared to EB in the stemness category, and upregulated genes of the “negative regulation of transcription” and “bone formation” are also related to cell migration and structure maintenance/organization, suggesting a balance between cell migration and cellular reorganization during differentiation.
While genes with higher expression in the GEL and MAT protocols are related to relatively few strongly overrepresented cellular categories (e.g., bone formation), genes with higher expression in the EB condition are enriched for multiple categories (heart, nervous system, and various internal organs). These differences in expression patterns (displayed in Supplemental Fig. 4) are most likely due to differences in concentration gradients of nutrients and metabolites: EB cultures have more and higher such gradients versus the surface protocols.
During development, bone is formed from cells originating from distinct embryonic lineages. Cranial neural crest cells, paraxial mesoderm, and lateral plate mesodermal cells migrate to the place where bone will be formed, form mesenchymal condensations, and finally differentiate into osteoclasts or chondrocytes. 84 From this point, bone development can follow one of the two paths: direct differentiation to intramembranous bone or differentiation to chondrocytes that will form cartilage. 84 Finally, cartilage will undergo endochondral ossification that will result in functional bone tissue. 84 The osteogenesis-related genes we identified as expressed higher under the GEL and MAT conditions, namely, Csf1, Gsn, Spp1, Bmp8b, and Crlf1, all code for proteins that apparently participate in the endochondral pathway of osteogenesis or in migration. For example, the proteins coded by Spp1 and Gsn participate in the assembly of podosomes binding to α4 β3 integrin. 75 Together they provide a mobility function to osteoclasts. The Csf1 protein has been described as a osteoclast growth factor providing differentiation of mononuclear hematocytes to osteoclast. 85 Also worth noting is Crlf1, which is expressed in all precartilagenous tissues and is known to participate in endochondral differentiation 86 and Bmp8b, which has been described as a cartilage marker.41,42
The way bone is developed presents multiple challenges to tissue engineering, both in terms of coordination of signaling and of the supporting structure. The first point requires complex mixtures of growth factors and cytokines in order to provide cells with osteogenic potential. Our data show that the surface differentiation approaches, the MAT condition in particular, give rise to cells expressing bone-related genes. Significantly, such genes are expressed in differentiating cells even in the absence of a three-dimensional structure. This could be further investigated and refined to obtain specialized cell types such as osteoblasts or osteoclasts. The second point to consider in terms of tissue-engineering challenges is the matrix-supporting cells. This requires use of an appropriate biodegradable matrix. Recent studies 87 show the use of a new approach called micromass technology. This technology considers cell reaggregation in cellular spheres. Such spheres are cultured until an extracellular-supporting matrix is developed allowing manipulation of the generated microtissue. This technology requires a source of cells with osteogenic potential. It is likely that our protocols can be further extended to provide cells for this new technology.
Footnotes
Acknowledgments
We acknowledge the financial support from a Fulbright fellowship (D.E.S.), the Millennium Scientific Initiative (Institute grant P-05-001-F), Fondecyt 1061119, the National Institutes of Health (USA) (grant R01-GM065476), and the Northwestern University Lurie Cancer Center toward the purchase of the Agilent microarray scanner, and the use of the Keck Biophysics facilities.
Work was carried out at the Department of Chemical and Biological Engineering at Northwestern University, Evanston, Illinois, and at the University of Chile and University of Delaware at the addresses above.
References
Supplementary Material
Please find the following supplemental material available below.
For Open Access articles published under a Creative Commons License, all supplemental material carries the same license as the article it is associated with.
For non-Open Access articles published, all supplemental material carries a non-exclusive license, and permission requests for re-use of supplemental material or any part of supplemental material shall be sent directly to the copyright owner as specified in the copyright notice associated with the article.