




Abstract
Abstract
The osteoconductive property of titanium (Ti) surfaces is important in orthopedic and dental implant devices. Surface modifications of Ti have been proposed to further improve osseointegration. In this study, three different materials, silicon (Si), silicon oxide (SiO2), and titanium oxide (TiO2), were used to construct nanofibers for surface coating of Ti alloy Ti-6Al-4 V (Ti alloy). MC3T3-E1 osteoprogenitor cells were seeded on nanofiber-coated discs and cultured for 42 days. DNA, alkaline phosphatase, osteocalcin, and mineralization nodules were measured using PicoGreen, enzyme-linked immunosorbent assay, and calcein blue staining to detect the attachment, proliferation, differentiation, and mineralization of MC3T3-E1 cells, respectively. The results demonstrated that the initial cell attachments on nanofiber-coated discs were significantly lower, although cell proliferation on Si and SiO2 nanofiber-coated discs was better than on Ti alloy surfaces. TiO2 nanofibers facilitated a higher cellular differentiation capacity than Ti alloy and tissue culture–treated polystyrene surfaces. Thus, surface modification using nanofibers of various materials can alter the attachment, proliferation, and differentiation of osteoprogenitor cells in vitro.
Introduction
Ti alloys are commonly used for implants because of their biocompatibility, high strength, low weight, and high corrosion resistance. Ti alloy facilitates new bone formation 5 and provides long-lasting bone-implant stability. 6 In addition to being bio-inert and nontoxic, requirements for the next generation of materials include enhancing cell attachment and differentiation to accelerate osseointegration of implants. 7
Modified or coated Ti and its alloys have become candidates for next-generation implants. One popular modification is coating with inorganic materials. Barth et al. found that the shearing force of cp-Ti was greater than that of similar implants coated with glass ceramic.8,9 Ti coated with calcium ions had better bone conduction than cp-Ti in rats.10,11 Bisphosphonates, immobilized on Ti, also stimulated the osteogenesis of bone marrow cells in humans and mice.12,13 Fluoride ion coating has also been shown to improve osteoblastic differentiation.14–16 Hall et al. coated the growth factor bone morphogenetic protein-2 to the surface of titanium oxide (TiO2) and observed better bone formation.17,18
Oxidation is a common modification of Ti surfaces. Xiropaidis et al. found that Ti surfaces (TiO2) stimulated bone formation to a greater degree than Ti coated with HA,19,20 although neither TiO2- nor titanium-silicon (TiSi)-coated Ti showed any differences in bone formation in mice from cp-Ti alone. 21
Another strategy to enhance osteoconduction is the use of a nanofiber-coated surface (NF). Xiao et al. used gold nanoparticles to link a redox enzyme with its cofactor and found that nanoparticles can work like metal wires to transfer electrons between enzyme, cofactor, and substrate. 22 A metalized enzyme was shown to transfer electrons faster than the original enzyme. 23 In current applications, the rational use of nanofibers considers the surface roughness effect and potential physiological interactions. A nanofiber coating on Ti constructs a rough surface, which may stimulate bone formation by triggering specific cell responses to spatial cues. 24 Therefore, physiological interactions may occur between nanoparticles in nanofiber surfaces and nanometer-scale molecules such as collagen, osteocalcin (OC), ALP, osteopontin (OPN), bone sialoprotein (BSP), and HA, which are involved in cell attachment, proliferation, differentiation, and HA deposition from osteoprogenitor cells to bone cells. Ultimately, one of the main goals is to attract and induce the osteoprogenitor cells to differentiate into bone cells.
We hypothesized that coating surfaces with nanofibers would affect the proliferation and differentiation of osteoprogenitors to osteoblasts. In the present study, we used a nanotechnology-enabled approach to construct nanofibers on the surface of Ti alloy (Ti-6A1–4 V, referred to as Ti alloy). Three different materials, silicon (Si—which has a role in cross-linking collagen and proteoglycans during bone formation 25 ), silicon dioxide (SiO2)-coated Si nanofibers,21,26 and TiO2-coated Si nanofibers,20,21,26 were chosen to construct the nanofibers. Ti alloy without nanofibers and tissue culture polystyrene (TCPS) culture plates were used as controls. Mouse MC3T3-E1 osteoprogenitor cells were seeded on all surfaces and cultured for 42 days. Cell number, released OC, ALP activity, and mineralization nodules were quantified to evaluate the effect of NF on MC3T3-E1 cells.
Materials and Methods
Coating of Ti alloy discs with nanofibers
In this study, we used surface-deposited gold colloid of defined diameter (40 nm) as the growth catalyst for a vapor-liquid-solid–based method to fabricate a Si NF.27,28 This method of growing a Si NF is flexible and allows control of multiple growth parameters such as length, diameter, and density, as well as being adaptable to a variety of substrates, including Si, glass, ceramics, and metals. For this study, we deposited the gold colloid onto poly l-lysine–coated Ti alloy discs (diameter: 8 mm, thickness: 1.5 mm). The poly l-lysine provides a positively charged surface that enhances colloid adhesion. After removing solvents and organic residue, the substrate was placed in a growth furnace to grow Si nanofibers. Silicon tetrahydride, a silane, was used as the growing gas at a temperature of 480°C. The silane decomposes on the gold particles, and the resulting Si precipitates from the molten eutectic to form a Si nanofiber, the diameter of which the initial colloid diameter defines. The length of time the reaction was allowed to continue controlled the length of the fiber. The nanofiber density was controlled by varying the density of catalyst deposited on the growth surface. All NFs were grown at Nanosys, Inc. (Palo Alto, CA) to approximately 20 to 30 μm (±5 μm) in length. The NF catalyst seeding density is approximately 15 particles per μm2. The diameters of the plain Si NF are 40 nm, oxidized Si NFs are approximately 40 nm, and the TiO2-coated Si NFs are approximately 60 nm. The TiO2 coating was applied using atomic layer deposition by Planar Systems, Inc. (Beaverton, OR). Atomic layer deposition allows conformal coating at the monolayer level. Approximately 12 nm of TiO2 was deposited onto the Si NF. The morphology of all the NF structures is a random “birds nest” structure (Fig. 1). The morphology and structure of the nanofibers was evaluated using scanning electron microscopy (JSM-6500F from JEOL, Tokyo, Japan) and transmission electron microscopy (TEM TECNAI 12, Phillips, Eindhoven, The Netherlands).

Image of a MC3T3-E1 cell growing on a titanium oxide nanofiber-coated surface (TiO2 NF) disc. Image was taken using a field-emission scanning electron microscope (JEOL JSM-6500F) with magnification 2,000×. The arrow indicates the MC3T3-E1 cell. The insert in the upper right corner shows a transmission electron microscopy (Phillips TECNAI 12) image of one TiO2-coated silicon (Si) nanofiber with magnification 110,000×, showing the composite structure of the TiO2 NF.
MC3T3-E1 seeding and culturing
MC3T3-E1 subclone 14 cell line (ATCC CRL-2594) was purchased from ATCC (Manassas, VA). Ti alloy discs with nanofiber-coated surfaces (Si, SiO2, TiO2, and control) were placed in 48-well cell culture plates with the nanofiber surface facing upward. A 48-well cell culture plate without discs was used as another control (TCPS group). Cells were seeded on Ti alloy discs at a density of 2 × 10⁵ cells/cm2 (total 1.5 × 10⁵) in 500 μL of nonosteogenic medium (alpha minimal essential media(α-MEM)) minus ascorbic acid with 10% fetal bovine serum, 100 of IU/mL penicillin, and 100 μg/mL of streptomycin (Invitrogen Inc., Grand Island, NY). Cells were allowed to expand for 3 days in 37ºC in a 5% carbon dioxide (CO2) incubator. At the end of the third day, the cells on five Ti alloy discs of each group were lifted with 0.25% trypsin/ethylenediaminetetraacetic acid (Invitrogen, Inc.) and a cell scraper to measure all outcome variables at day 0. Another five discs of each group were allocated for calcein blue staining. The remaining Ti alloy discs were placed into new 48-well plates with 500 μL of osteogenic media (α-MEM containing 10% fetal bovine serum, 100 IU/mL of penicillin, 100 μg/mL of streptomycin, 50 μg/mL of ascorbic acid, and 10 mM of β-glycerophosphate) per well. Medium was renewed every 4 days. Spent medium was collected and stored at −80ºC at each medium change. Cultures were maintained for 42 days in 37ºC in a 5% CO2 incubator, after which the quantity of mineralized matrix, DNA, and alkaline phosphatase were assessed.
Calcein blue staining
A modified protocol was used for calcein blue staining. 13 Briefly, calcein blue solution (0.1% calcein blue (Sigma Aldrich, Saint Louis, MO) in 25 mM of potassium hydroxide was added to culture medium at a final concentration of 3.1 × 10⁻⁵ M. After 1 h of incubation at 37ºC with 5% CO2, the discs with cells were washed three times with phosphate buffered saline (PBS) and then fixed in 4% formaldehyde for 10 min. After the formaldehyde was removed, the discs were washed three times with PBS and dried in air. Images were taken by exposing for 20 s with the top ultraviolet light (wavelength 365 nm) and gold filter (485–655 nm) in BioSpectrumAC (UVP, Upland, CA). The images were quantified using MetaVue v6.2 (Molecular Devices, Downingtown, PA). The calcein blue–stained discs were also confirmed according to Von Kossa staining.
DNA quantification and ALP activity assay
Cells were resuspended in PBS with 0.2% Triton X-100 (Sigma Aldrich) and vortexed vigorously for 20 min in a cold room. The lysate was used directly for ALP activity assay and DNA quantification. Fifty μL of cell lysate was used to measure the activities of ALP using QuantiChrom Alkaline Phosphatase Assay Kit from Bioassay Systems (Hayward, CA). Ten to 50 μL of cell lysate was used to measure the DNA concentration using a picogreen double strand DNA quantization assay kit (Invitrogen, Inc.). The ALP activity assay and DNA quantification were conducted by following the protocol from the manufacturer and adjusted according to cell numbers. The absorbance and fluorescence were read in a Spectra M2 microplate reader (Molecular Devices) at 405 nm and 480/520 nm, respectively. The same cells with a known amount of DNA were used to generate a standard curve to determine cell numbers.
Quantification of OC in medium
The OC enzyme-linked immunosorbent assay kit was purchased from Biomedical Technologies Inc. (Stoughton, MA). Manufacturers' protocols were followed carefully. The optical densities were determined using a Spectra M2 (Molecular Devices) microplate reader set at 450 nm.
Statistical analysis
One-way analysis of variance (post hoc multicomparisons with Tukey) was conducted using SPSS 14.0 (SPSS, Inc., Chicago, IL). Data were reported as mean ±standard error. A P-value of 0.05 was chosen as the threshold of significance.
Results
MC3T3-E1 cells attached poorly on the surface of NF discs
Each disk was seeded with 1.5 × 10⁵ cells. After 3 days of expansion in nonosteogenic medium, (day 0), cells on the cell culture–treated plastic surface (TCPS) reached confluence, with cell numbers averaging 2.3 × 10⁵ (50% more than seeding amount), followed by Ti alloy (1.47 × 10⁵). MC3T3-E1 cells attached poorly on all three NF discs. Si NF (1.8 × 10⁴) and TiO2 NF (1.8 × 10⁴) had 10% of the original seeded cells, whereas SiO2 NF (1.48 × 10³) had only 1% remaining (Table 1).
Fold is the increase from day 0 to day 42, unit: 1000, n = 4∼5. For day 0, * and @p < 0.05 vs all remaining groups, one-way analysis of variance (ANOVA). For day 42, * and @p < 0.05 vs all remaining groups, #p < 0.05 vs the silicon dioxide (SiO2) and titanium oxide nanofiber-coated surface (TiO2 NF) groups, one-way ANOVA. For fold, *p < 0.05 comparing day 0 and 42 of itself, Student T-test.
After 42-days culture in osteogenic medium, TCPS surfaces (8.6 × 10⁵) still had the most cells, followed by Ti alloy (4.6 × 10⁵) and Si NF (2.5 × 10⁵). SiO2 NF (0.14 × 10⁵) and TiO2 NF (0.20 × 10⁵) had few cells (∼2% of those on the TCPS surface). Regarding proliferation capacity after 42 days of culture, Si and SiO2 NF (13.97 and 9.77 times greater, respectively) were much higher than Ti alloy and TCPS (3.15 and 3.69 times greater, respectively). The cell population on TiO2 NF did not increase after the 6-week cell culture (Table 1).
The statistical results of all groups before and after 42 days of cell culture are summarized in Table 1.
TiO2 NF had high ALP activity
ALP activity of MC3T3-E1 cells in nonosteogenic medium was low (Fig. 2, day 0) but increased greatly when exposed to osteogenic medium (Fig. 2, day 42). ALP activity per cell from the TiO2 NF group was the highest of all groups (almost double the number of cells growing on TCPS alone), whereas ALP activity in the Ti, Si NF, SiO2 NF, and TCPS groups was similar. (Fig. 2).
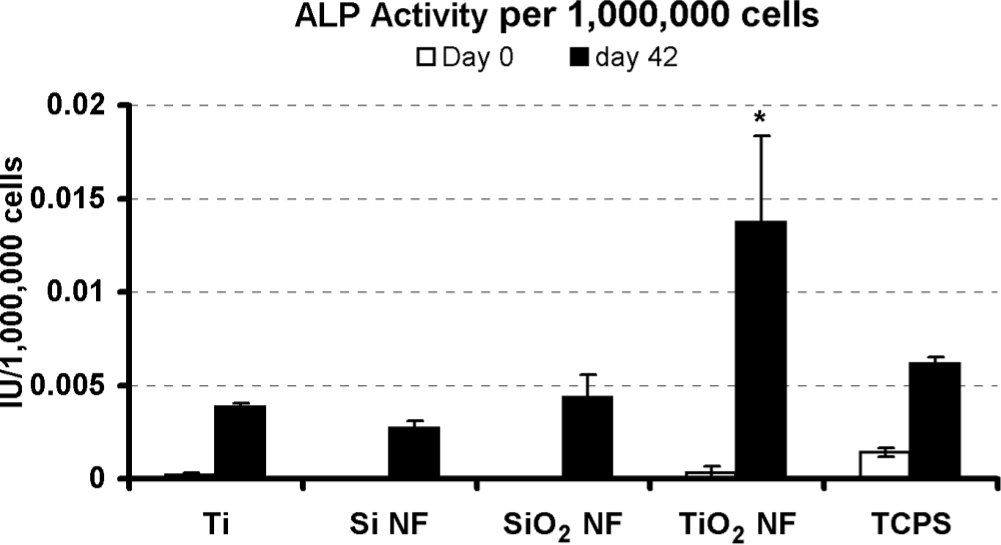
Alkaline phospohtase activity of MC3T3-E1 cells on various surfaces. N = 4–5. *P < 0.05 versus titanium (Ti) alloy, silicon nanofiber-coated surface (Si NF), and silicon dioxide (SiO2) NF groups, one-way analysis of variance. TCPS, tissue culture polystyrene.
TiO2 NF had high OC production per cell
At day 42, after adjustment for cell numbers, OC per cell in the TiO2 NF group was 25 times as high as in the other groups (p < 0.05), which corresponds with the high ALP activity. The OC levels per cell in the Ti, Si NF, and TCPS group were low, and there was no OC detected in the SiO2 NF group (Fig. 3A).
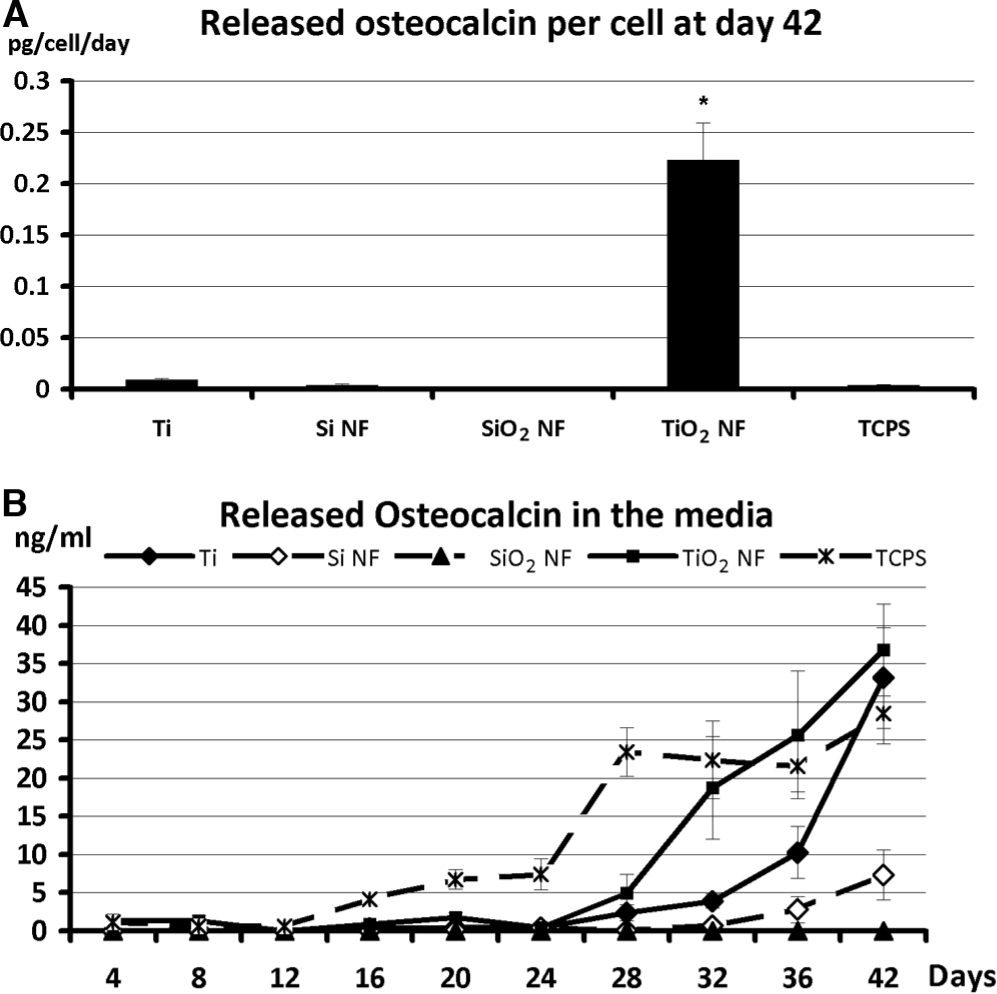
Released osteocalcin (OC) in the medium. (
The dynamic releasing profiles of OC were also plotted (Fig. 3B). OC expression in the TCPS group became evident at day 12 and increased quickly thereafter. The release of OC in the Ti alloy, Si NF, and TiO2 NF groups was much later (∼day 24). To evaluate the release profiles of the five groups, the slope of the curve and the area under the curve were used to describe the rate and amount of OC release (Table 2). The Ti alloy, TiO2 NF, and TCPS groups showed similar release rates, whereas the Si NF group was much slower (p < 0.05). Considering the area under curve, the TiO2 NF and TCPS groups released similar amounts of OC, which were much higher than with Ti alloy and Si NF (p < 0.05).
For slope, *p < 0.05 vs the titanium oxide nanofiber-coated surface (TiO2 NF) and polystyrene group, #p < 0.05 vs the titanium (Ti) alloy, TiO2 NF, and polystyrene groups. For area under the curve, *p < 0.05 vs PS group, #p < 0.05 vs the TiO2 NF group. One-way analysis of variance, n = 4∼5.
Mineralization was observed only in the Ti alloy and TCPS groups
Because of the difficulties in quantifying Von Kossa staining on Ti discs, a fluorescence-labeling method, calcein blue staining, was used to detect mineralization. In the cell culture–treated polystyrene surface controls (TCPS) (Fig. 4), mineralization nodules covered approximately 20% of the total area. For the metal surfaces, only Ti alloy showed the formation of mineralized nodules, which covered only approximately 2% of the total area. No nodules were detected on the surfaces of the Si NF, SiO2 NF, and TiO2 NF groups. The difference between the Ti alloy group and TCPS was statistically significant (p < 0.05). The nodules were confirmed using Von Kossa staining.
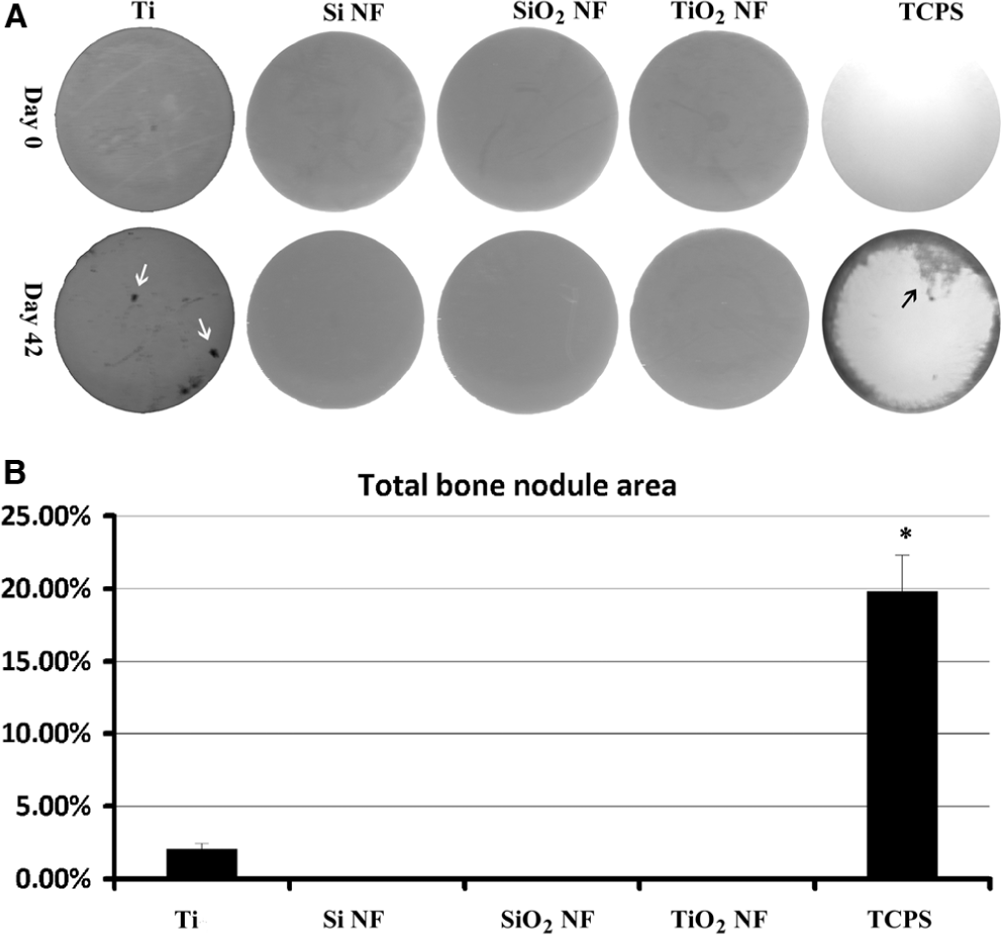
Calcein blue staining of all groups. (
Discussion
Cell attachment on nanofiber-coated surfaces is not as extensive as on Ti alloy and polystyrene
Popat et al. reported that Si nanofiber coating greatly improved cell attachment of the fetal osteoblast cell line (hFOB 1.19); 29 this was not observed in our experiments using the MC3T3-E1 preosteoblast cell line. This difference could be a result of variations in the nanofiber coating or because this study used a less-differentiated cell line (mouse osteoprogenitors cells instead of human virus–infected osteoblasts). In our experiments, cell attachment on nanofiber surfaces (Si, SiO2, and TiO2) was much lower than on Ti alloy surfaces without modification. Zhao et al. 30 also found fewer cells on Ti surfaces after submicron-scale modification. There are several possible reasons for the low retention. First, the size of nanofibers used for coating may not be optimal for MC3T3-E1 cells. Second, the bulk physical surface of nanofiber-coated coupons may not be conducive to cell adhesion due to the complex “birds nest” topography making it difficult for the cells to establish firm adhesive interactions. Third, the surface chemistry of the nanofibers may not be optimal. For example, it was reported that arginine-glycine-aspartic acid (RGD)-coated Ti disks greatly promoted attachment and decreased apoptosis of MC3T3-E1 osteoprogenitor cells. 31 Therefore, coating the nanofibers with RGD or another positively charged molecule, such as calcium ion or poly lysine, may promote the attachment of cells.
Cell proliferation on Si and SiO2 nanofiber surfaces is better than on Ti alloy
For Si and SiO2 nanofiber-coated substrates, the proliferation of MC3T3-E1 cells (∼10 fold) is greater than with Ti alloy (∼3 fold). One possible explanation is that the initial low density of cells on Si and SiO2 nanofiber surfaces provided the opportunity for greater proliferation than on the Ti alloy or TCPS, which already had a high density of cells. It is surprising that the cells on TiO2 nanofibers did not increase after 42 days in culture. This result may be due to inhibition of proliferation or the balance between proliferation and apoptosis. TiO2 has not previously been found to be toxic to cells;19,20 therefore, it is unlikely that TiO2 increased the rate of cell death. The most plausible explanation is lower cell proliferation on TiO2 nanofiber surface. Scanning electron microscopy or fluorescence imaging of cell morphology may be useful to further determine the adhesive and proliferative characteristics of bone marrow cells on these surfaces.
Markers of differentiation on TiO2 nanofiber-coated surfaces are greater than on Ti alloy
Both differentiation markers (ALP and OC) showed much higher values for cells on TiO2 nanofiber discs than all other groups, including plastic surface. TiO2 has previously been shown to stimulate differentiation of bone cells,19–21 although the present study is the first to demonstrate that differentiation on TiO2 nanofiber surfaces was much greater than on polystyrene surfaces.
Although microroughness may contribute to cell formation in other model systems, 30 it may not be the main factor in explaining the results for TiO2 NF coating because all NF discs had a similar roughness (length and density), although the TiO2 nanofibers were of slightly larger diameter because of the deposition of approximately 10 nm of TiO2 over the Si core. It is possible that this contributed to the differences in proliferation. In the current study, cells cultured on TiO2 surfaces did not reach confluence by the end of the cell culture period (42 days), although the cells had already begun to differentiate by day 24. The exact signaling mechanisms that initiate differentiation of osteoprogenitor cells on TiO2 surfaces in the present culture conditions are unknown and would be of great interest in future studies.
Hydroxyapatite nucleation on nanofiber-coated surfaces is lower
The microroughness of Ti surfaces may directly affect the nucleation of HA, which contributes to the formation of mineralization nodules. 32 Garhardt et al. reported that Ti nanoparticles increased HA deposition on poly(D,L-lactic acid) film while immersed in simulated body fluid.33,34
We were not able to detect mineralization nodules on Si, SiO2, and TiO2 nanofiber-coated surfaces. Even on Ti alloy without NF surfaces, the nodule area was much less than on polystyrene surfaces. One explanation is the low cell density on the disc, which directly affects the imaging of mineralization nodules. Another reason may be the smaller surface area of the Ti discs (diameter: 8 mm) than of larger culture plates. In previous unpublished experiments, we found that mineralization nodules can form more easily on a larger culture surface (e.g., on 6-well plates) than on a smaller surface area (96-well plates). Goto et al. 13 used larger-diameter Ti discs (diameter: 30 mm) and found similar mineralization areas were formed on Ti surfaces as on polystyrene surfaces. The culture period is also related to the degree of mineralization. On Ti surfaces, cells began to differentiate at day 28, much later than on polystyrene surfaces (day 16). Thus there would be a longer period of time for differentiation, maturation, and mineralization on Ti surfaces than on TCPS.
In the culture conditions employed in this study, all three nanofiber surfaces showed low capacities for cell attachment. However, Ti nanofibers promoted the production of key markers of differentiation of osteoprogenitor cells more strongly than nanofibers composed of Si and SiO2. Future studies will focus on the molecular mechanisms of these biological processes and methods for improving initial cell attachment and HA nucleation. It is hoped that optimizing these processes will improve the initial osseointegration of orthopedic implants.
Footnotes
Acknowledgments
We would like to express our appreciation to Dr. Robert Lane Smith, Dr. Pei-General Ren, Dr. Pergen Ren, Dr. Ting Ma, and Richard Chiu for technical advice.