
Abstract
Better quantitative understanding of human mesenchymal stem cells (hMSCs) metabolism is needed to identify, understand, and subsequently optimize the processes in expansion of hMSCs in vitro. For this purpose, we analyzed growth of hMSCs in vitro with a mathematical model based on the mass balances for viable cell numbers, glucose, lactate, glutamine, and glutamate. The mathematical modeling had two aims: (1) to estimate kinetic parameters of important metabolites for hMSC monolayer cultures, and (2) to quantitatively assess assumptions on growth of hMSCs. Two cell seeding densities were used to investigate growth and metabolism kinetics of MSCs from three human donors. We analyzed growth up to confluency and used metabolic assumptions described in literature. Results showed a longer initial phase, a slower growth rate, and a higher glucose, lactate, glutamine, and glutamate metabolic rates at the lower cell seeding density. Higher metabolic rates could be induced by a lower contact inhibition effect when seeding at 100 cells/cm2 than when seeding at 1000 cells/cm2. In addition, parameter estimation describing kinetics of hMSCs in culture, depending on the seeding density, showed doubling times in the order of 17–32 h, specific glucose consumption in the order of 1.25 × 10⁻¹ to 3.77 × 10⁻¹pmol/cell/h, specific lactate production in the order of 2.48 × 10⁻¹ to 7.67 × 10⁻¹ pmol/cell/h, specific glutamine production in the order of 7.04 × 10⁻³ to 2.27 pmol/cell/h, and specific glutamate production in the order of 4.87 × 10⁻¹ to 23.4 pmol/cell/h. Lactate-to-glucose yield ratios confirmed that hMSCs use glucose via anaerobic glycolysis. In addition, glutamine and glutamate metabolic shifts were identified that could be important for understanding growth of hMSCs in vitro. This study showed that the mathematical modeling approach supports quantitative analysis of important mechanisms in proliferation of hMSCs in vitro.
Introduction
Currently, growth of hMSCs continues to be the focus of not only qualitative but also quantitative studies.5,6 Due to the high complexity of biological systems, mathematical modeling in the scope of systems biology will be useful in analyzing growth of hMSCs quantitatively as shown in other cell cultures.7,8 MacArthur and Oreffo 1 have suggested that the integration of mathematical modeling with experimentation in an iterative framework may prove crucial in taking tissue engineering from concept to reality, where integration of mathematical modeling and experimentation would be practical for channeling knowledge from different fields of expertise toward a common goal.
The use of mathematical models is common for simulation, optimization, and control purposes. Mathematical models can also aid in the understanding and elucidation of underlying mechanisms, and highlight the accuracy or descriptive ability in parts of the mathematical model where experimental and simulated data cannot be reconciled. 9 Two notable examples of mathematical modeling of growth and metabolism of hMSCs are found in the literature. The first is from Zhao et al., who investigated growth kinetics and metabolism of hMSCs under static and perfusion conditions on poly (ethylene) terephthalate constructs. This study focused on the oxygen transport equations across the construct with respect to static and perfusion conditions and a kinetic description of cell growth in this constructs from offline measurements of cell numbers. 10 In the other example, Lemon et al. developed a mathematical model that describes how the quantity of undifferentiated and differentiated hMSCs and the amount of extracellular matrix evolve with time under both hypoxic and normoxic conditions inside fibrous poly (ethylene) terephthalate scaffolds. 11 Literature did not address the dynamic role of metabolites. Therefore, we have designed a study where a mathematical model is used to investigate the dynamics of components of the citric acid (TCA) cycle and amino acid metabolism in the cultivation of hMSCs.
Because of their importance in mammalian cultures, glucose, lactate, glutamine, and glutamate were considered in this work to assess growth quantitatively. Figure 1 shows the main compounds involved in the metabolism of glucose, lactate, glutamine, and glutamate. The latest studies estimate that complete aerobic oxidation of glucose yields a maximum of 30 mol adenine triphosphate (ATP) per mol glucose, 12 whereas glucose catabolism by anaerobic glycolysis yields 2 mol of ATP and 2 mol of lactate per mol of glucose. 13 Therefore, the stoichiometry of glycolysis can provide information on hMSCs' energy production efficiency under different conditions.
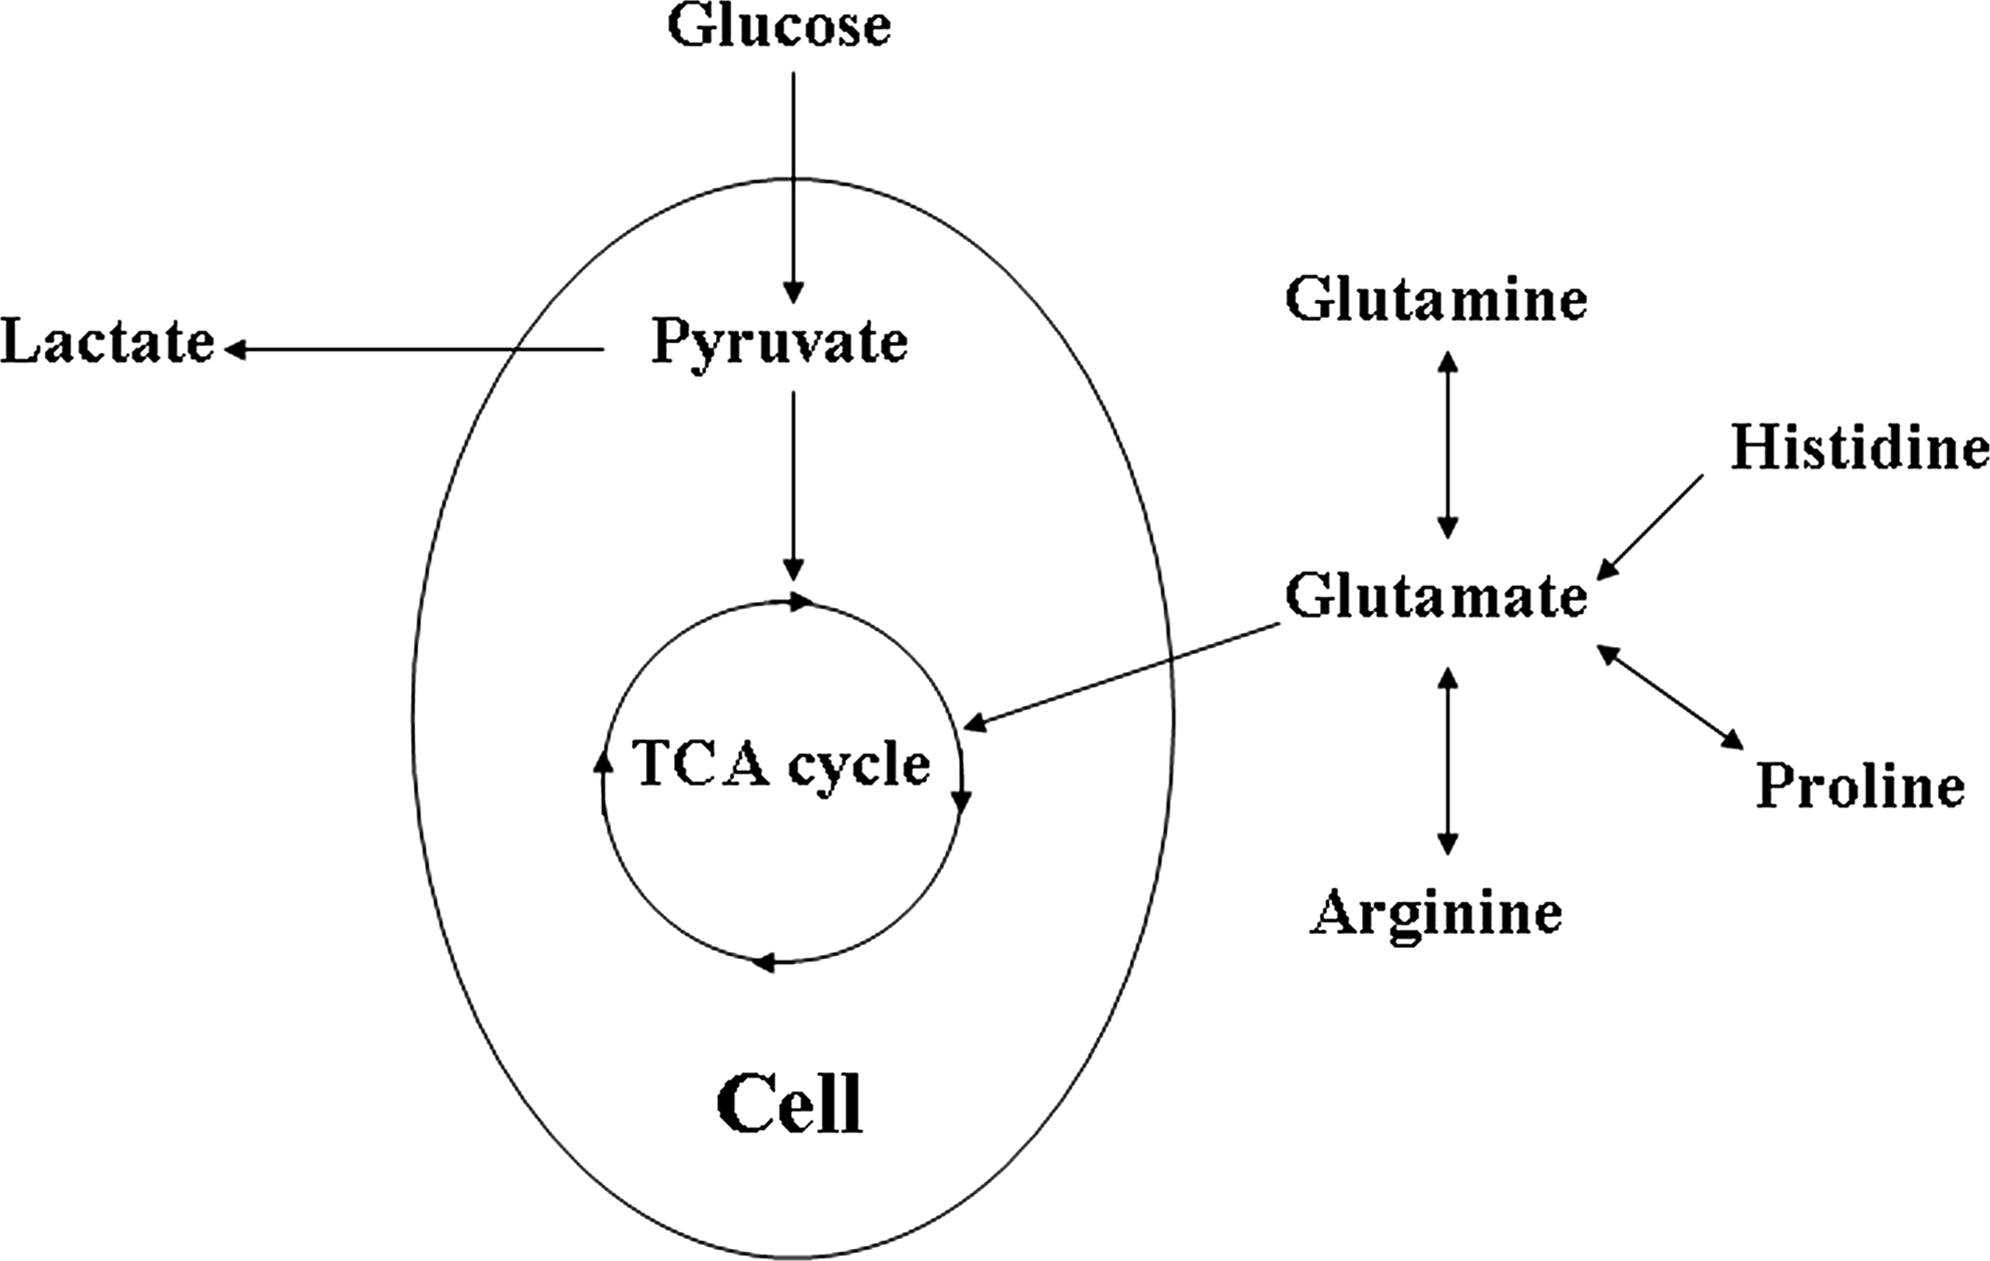
Overview of pathways investigated. Amounts of glucose, lactate, glutamine, and glutamate were measured in the experimental work.
Glutaminolysis (i.e., the conversion of glutamine into glutamate via the citric acid cycle) yields about 27 mol of ATP and 2 mol of ammonia. Glutamine metabolism can either yield 2 mol of lactate, 1 mol of ammonia, and 9 mol of ATP, or 1 mol of alanine, 1 mol of ammonia, and 9 mol of ATP. 14 In addition to glutamine, the carbon skeletons of three five-carbon amino acids (proline, arginine, and histidine) enter the TCA cycle at α-ketoglutarate. These amino acids are first converted into glutamate 13 and then fed into the TCA cycle. Thus, glutamine and glutamate profiles can indicate changes on the amino acid metabolic status of hMSCs.
In this work, we used a mathematical model for the analysis and understanding of growth processes with two aims: (1) to estimate kinetic parameters from measurements of glucose, lactate, glutamine, and glutamate, and (2) to quantitatively assess assumptions on growth of hMSCs in two-dimensional cultures. For the latter aim, we investigated different cell seeding densities (100 and 1000 cells/cm2), because studies show that low cell seeding densities favor hMSCs' expansion and longer doubling times.15–19 Medium samples and hMSCs were harvested every day up to confluency. For every time point, measurements for viable cells, dead cells, glucose, lactate, glutamine, and glutamate were obtained.
Sidoli et al. explained that mathematical models can be classified as structured or unstructured, segregated or unsegregated, and deterministic or stochastic. 9 First, a structured mathematical model includes a detailed description of the intracellular processes in either the physical or the biochemical sense; in unstructured models, these processes are only partially considered. Second, an unsegregated mathematical model assumes an average cell so that the cell population can be considered homogeneous. Deterministic models assume that the cells are not subject to random variability, which is taken into account by stochastic models.
In the mathematical model described here, it is assumed that an hMSC population is a homogeneous population whose behavior can be described by an average cell. The mathematical model is represented by differential equations describing the mass balance for each metabolite. Thus, the mathematical model we used can be classified as unstructured, unsegregated, and deterministic.
We chose this approach to clarify and identify the metabolic processes that occur during the growth of hMSCs in standard hMSC cultivation. From data and mathematical model, kinetic parameters were identified that characterize growth quantitatively in a closed two-dimensional batch system, such as the tissue culture flask (T-flask). These parameters can be used for comparing the metabolic status of hMSCs in different two-dimensional and three-dimensional expansion systems.
Notation
Xm Total moles of a metabolite in total volume (mol)
m Metabolite: referring to either glucose, lactate, glutamine, or glutamate.
Xv Total cell number in total volume (cells)
Xd Total dead cell number in total volume (cells)
Xg Total moles of glucose in total volume (mol)
Xl Total moles of lactate in total volume (mol)
Xq Total moles of glutamine in total volume (mol)
Xe Total moles of glutamate in total volume (mol)
μmax Maximum specific growth rate (h−1)
μ Specific growth rate (h−1)
μd Death rate (h−1)
td Doubling time (h)
qm Specific metabolite reaction rate (mol/cell/h)
qg Specific consumption rate of glucose (mol/cell/h)
ql Specific production rate of lactate (mol/cell/h)
qq Specific production rate of glutamine (mol/cell/h)
qe Specific production rate of glutamate (mol/cell/h)
Yl/g Ratio of lactate to glucose (mol/mol)
Kg Monod constant of glucose (mol)
kmd Degradation rate constant of the metabolite (h−1)
kqd Degradation rate constant of glutamine (h−1)
ked Degradation rate constant of glutamate (h−1)
Materials and Methods
Isolation, culture, and cryopreservation of hMSCs
We isolated, cultured, and cryopreserved hMSCs as described by Both et al. 19 We obtained hMSCs from three donors (Table 1) who were undergoing total hip replacement surgery and gave informed consent for bone marrow biopsy, approved by the local medical ethics committee. Mono-nucleated cells were counted in the aspirate and plated at a density of 500,000 cells/cm2 in T-flasks (Nunc; Thermo Fischer Scientific, Roskilde, Denmark). After the addition of α-minimal essential medium (αMEM) proliferation medium, cells were cultured for 4–5 days. The αMEM proliferation medium contained minimal essential medium (Gibco, Carlsbad, CA), 10% fetal bovine serum of a selected batch (FBS; South American Origin; Biowhittaker, lot:4SB0010; Lonza, Verviers, Belgium), 0.2 mM l-ascorbic-acid-2-phosphate (Sigma, St. Louis, MO), penicillin G (100 units/mL; Invitrogen, Carlsbad, CA), streptomycin (100 μg/mL; Invitrogen), 2 mM l-glutamine (Sigma), and 1 ng/mL basic fibroblast growth factor (Instruchemie, Delfzijl, The Netherlands). Cells were cultured at 37°C in a humidified atmosphere of 5% carbon dioxide.
After the 4–5-day culture period, nonadherent cells and αMEM proliferation medium were discarded. Adherent cells were thoroughly washed twice with phosphate buffered saline (PBS; Sigma), and αMEM proliferation medium was refreshed. We proliferated adherent cells for two passages and cryopreserved them. The passage number was defined by every harvest with 0.25% trypsin–EDTA (Gibco).
Culture density and proliferation
Cryopreserved cells were thawed, and hMSCs (passage 2) were recounted and plated at 100 and 1000 cells/cm2 in 25 cm2 T-flasks (T-25 flasks) in αMEM proliferation medium. hMSCs were cultured in Sanyo incubators. αMEM proliferation medium was not refreshed to maintain a batch culture configuration. Every day, for each seeding density, three T-25 flasks were sacrificed per seeding density to obtain cell numbers and their metabolic profile. The medium was analyzed on the same day of harvest. To harvest cells, the T-25 flasks were washed with PBS before hMSCs were enzymatically detached with 0.25% trypsin–EDTA.
Viable and dead hMSCs
After harvest, viable cell numbers were obtained with the Bürker-Türk method by discriminating viable and dead hMSCs with trypan blue (Sigma). Cell death was quantified with both trypan blue and medium analysis of lactate dehydrogenase (LDH) signal with the Cytotox-one Homogeneous Membrane Integrity Assay (Promega Corporation, Madison, WI). LDH signal was calibrated for every hMSC donor by measuring the LDH signal three times (n = 3) for each of five cell concentrations from 2 × 10³ to 2.5 × 10⁵ cells/mL. The slope estimated from linear regression corresponded to the LDH signal/cell ratio (donor 1: 6.5 × 10⁻³; donor 2: 8.1 × 10⁻³; donor 3: 5.6 × 10⁻³). From three runs per donor, that is, three T-25 flasks sacrificed per day, four medium samples per run (n = 12) were obtained, and its LDH signal was measured in time. Dead cell numbers for every donor were obtained by dividing the signal in time by their respective LDH signal/cell ratio.
Metabolic profile and volume
Daily measurements were performed for every donor from independent T-25 flasks (n = 3). Glucose and lactate were measured in the Vitros DT60 II chemistry system (Ortho-Clinical Diagnostics, Tilburg, The Netherlands). In addition, glutamine and glutamate were measured with the Glutamine/Glutamate determination kit (Sigma). Volume change of 2.1 × 10⁻³ mL/h (with 2.1 × 10⁻⁴ as a standard deviation for n = 3) was measured in a Sanyo incubator at 37°C with 60% relative humidity. Concentrations measured were normalized to the volume changes.
Estimation of degradation kinetics
All degradation experiments included medium incubated without cells at 37°C and 5% CO2, where metabolites were measured with their respective methods. LDH signal for dead cell numbers degraded linearly in time (Supplemental Fig. S1, available online at www.liebertonline.com/ten) at a rate of 2.8 ± 0.36 × 10⁻¹ LDH signal/h from three replicates (n = 3) per data point. For every donor, LDH signals were measured from four medium samples per run (Runs per donor = 3; n = 12). Then, these were normalized to their degradation in time before dead cell numbers were calculated. Glutamine degradation obeys first-order kinetics. 20 The degradation rate constant for glutamine (kqd) was estimated experimentally to be 6.37 ± 0.85 × 10⁻³ h−1. Also, the first-order degradation constant for glutamate (ked) was estimated experimentally to be 7.3 ± 1.4 × 10⁻³ h−1. Further, degradation of glucose and lactate was measured experimentally to be negligible; thus, we considered kgd = kld = 0 in Equation (4).
Statistical analysis
For every donor, all data points for cell number, glucose, lactate, glutamine, and glutamate are based on replicates for each of three parallel runs, that is, three T-25 flasks sacrificed per day. Error bars in graphs with experimental data represent the standard deviation of measurements.
Analysis of growth and metabolism characteristics was performed by parameter estimation, and the obtained parameter values were evaluated on the basis of their 95% confidence intervals.
Mathematical model description
The principles to model were chosen based on literature on mammalian cell cultures.7–9,21 A T-flask is considered as a batch system, where cells grow on their metabolites. The system can be described with the set of mass-balance Equations (1) through (4). The viable biomass is given by
Equation (1) describes the change of the total number of viable cells with time in a differential equation form and includes both viable cell growth (μXv) and cell death (μdXv). The specific growth rate for the cells is given by
with μ is specific growth rate that is based on Monod-type kinetics for glucose. The Monod Equation (2) indicates that for glucose concentrations around the Monod constant (Kg), the specific growth rate (μ) is half the maximum specific growth rate (μmax). If Kg is much smaller than the glucose concentration, μ equals μmax. The value of Kg, 0.4 mM (i.e., 2 × 10⁻⁶ mol in 5 mL volume), is taken from the literature. 22 With total glucose amounts in 5 mL ranging from 1.5 to 2.25 × 10⁻⁵ mol, μ is 90 ± 2% of μmax.
The amount of dead cells is given by the mass balance:
With Xd is the total dead cell number produced from the lysis of the cell membrane with μd defined as the death rate (h−1) of viable cells (Xv).
The mass balances of metabolites are given by
where the subscript m refers to the metabolites (glucose, lactate, glutamine, or glutamate). qm refers to the specific metabolite (m) reaction rate per average cell per hour, qm is constant and may be positive or negative (±) depending on whether the metabolite is produced or consumed, respectively. kmd represents the first-order degradation rate constant for the metabolites.
We expect that throughout cultivation glucose and glutamine are consumed, while lactate and glutamate are produced. Maintenance coefficients are the minimum amounts of a substrate that a cell needs for its survival. However, because of a high parameter correlation, maintenance coefficients cannot be estimated from batch experiments. Consequently, qg and qq on Equation (4) include both an unknown maintenance coefficient and the consumption toward biomass production.
Mathematical modeling and parameter estimation
The mathematical model Equations (1) through (4) comprise a set of ordinary differential equations (ODEs) that were solved with a standard differential equation solver in Matlab (ode45 in version 7.0.4 release 2007a; Mathworks, Natick, MA) on a Windows-based system. The initial values for solving the differential equation were set to the seeding density and the experimentally determined composition (glucose, lactate, glutamine and glutamate) in fresh αMEM proliferation medium from three medium samples. Mathematical model parameter values for the three donors were obtained by nonlinear least squares regression, which minimizes the sum of the quadratic error over an experiment (Matlab function nlinfit). Next, the 95% confidence intervals for the parameters were calculated (Matlab function nlparci).
The experimentally obtained initial values had a low variation and were not considered as parameters to be estimated by nonlinear least squares regression.
Results
This study used a mass-balance-based mathematical model to analyze in vitro growth and metabolism kinetics of hMSCs seeded at 100 and 1000 cells/cm2. Viable cell numbers, dead cell numbers, glucose, lactate, glutamine, and glutamate were experimentally measured and analyzed at both cell seeding densities. The results of the analysis are described below.
Cell growth
Figure 2 shows the counted viable cell numbers and the mathematical model results for three donors. The cell numbers increased in time up to 130 h when seeded at 1000cells/cm2 and up to 230 h when seeded at 100 cells/cm2. When seeding at 1000 cells/cm2, cell counting repeatedly showed larger standard deviations after 130 h. The three donors showed high dispersion in cell numbers after 130 h. This result lead us to set limits for the mathematical model based on reliable cell number measurements. Dead cell numbers (Supplemental Fig. S1) showed on average (n = 3 donors) as high as 0.035% dead cells from total cells (dead and viable). Visual inspection with trypan blue also confirmed the presence of only a few dead cells. Thus, cell death was assumed negligible and μd in Equations (1) and (3) was equal to zero. In addition, pH remained within physiological values throughout the culture period (7.2–7.3).
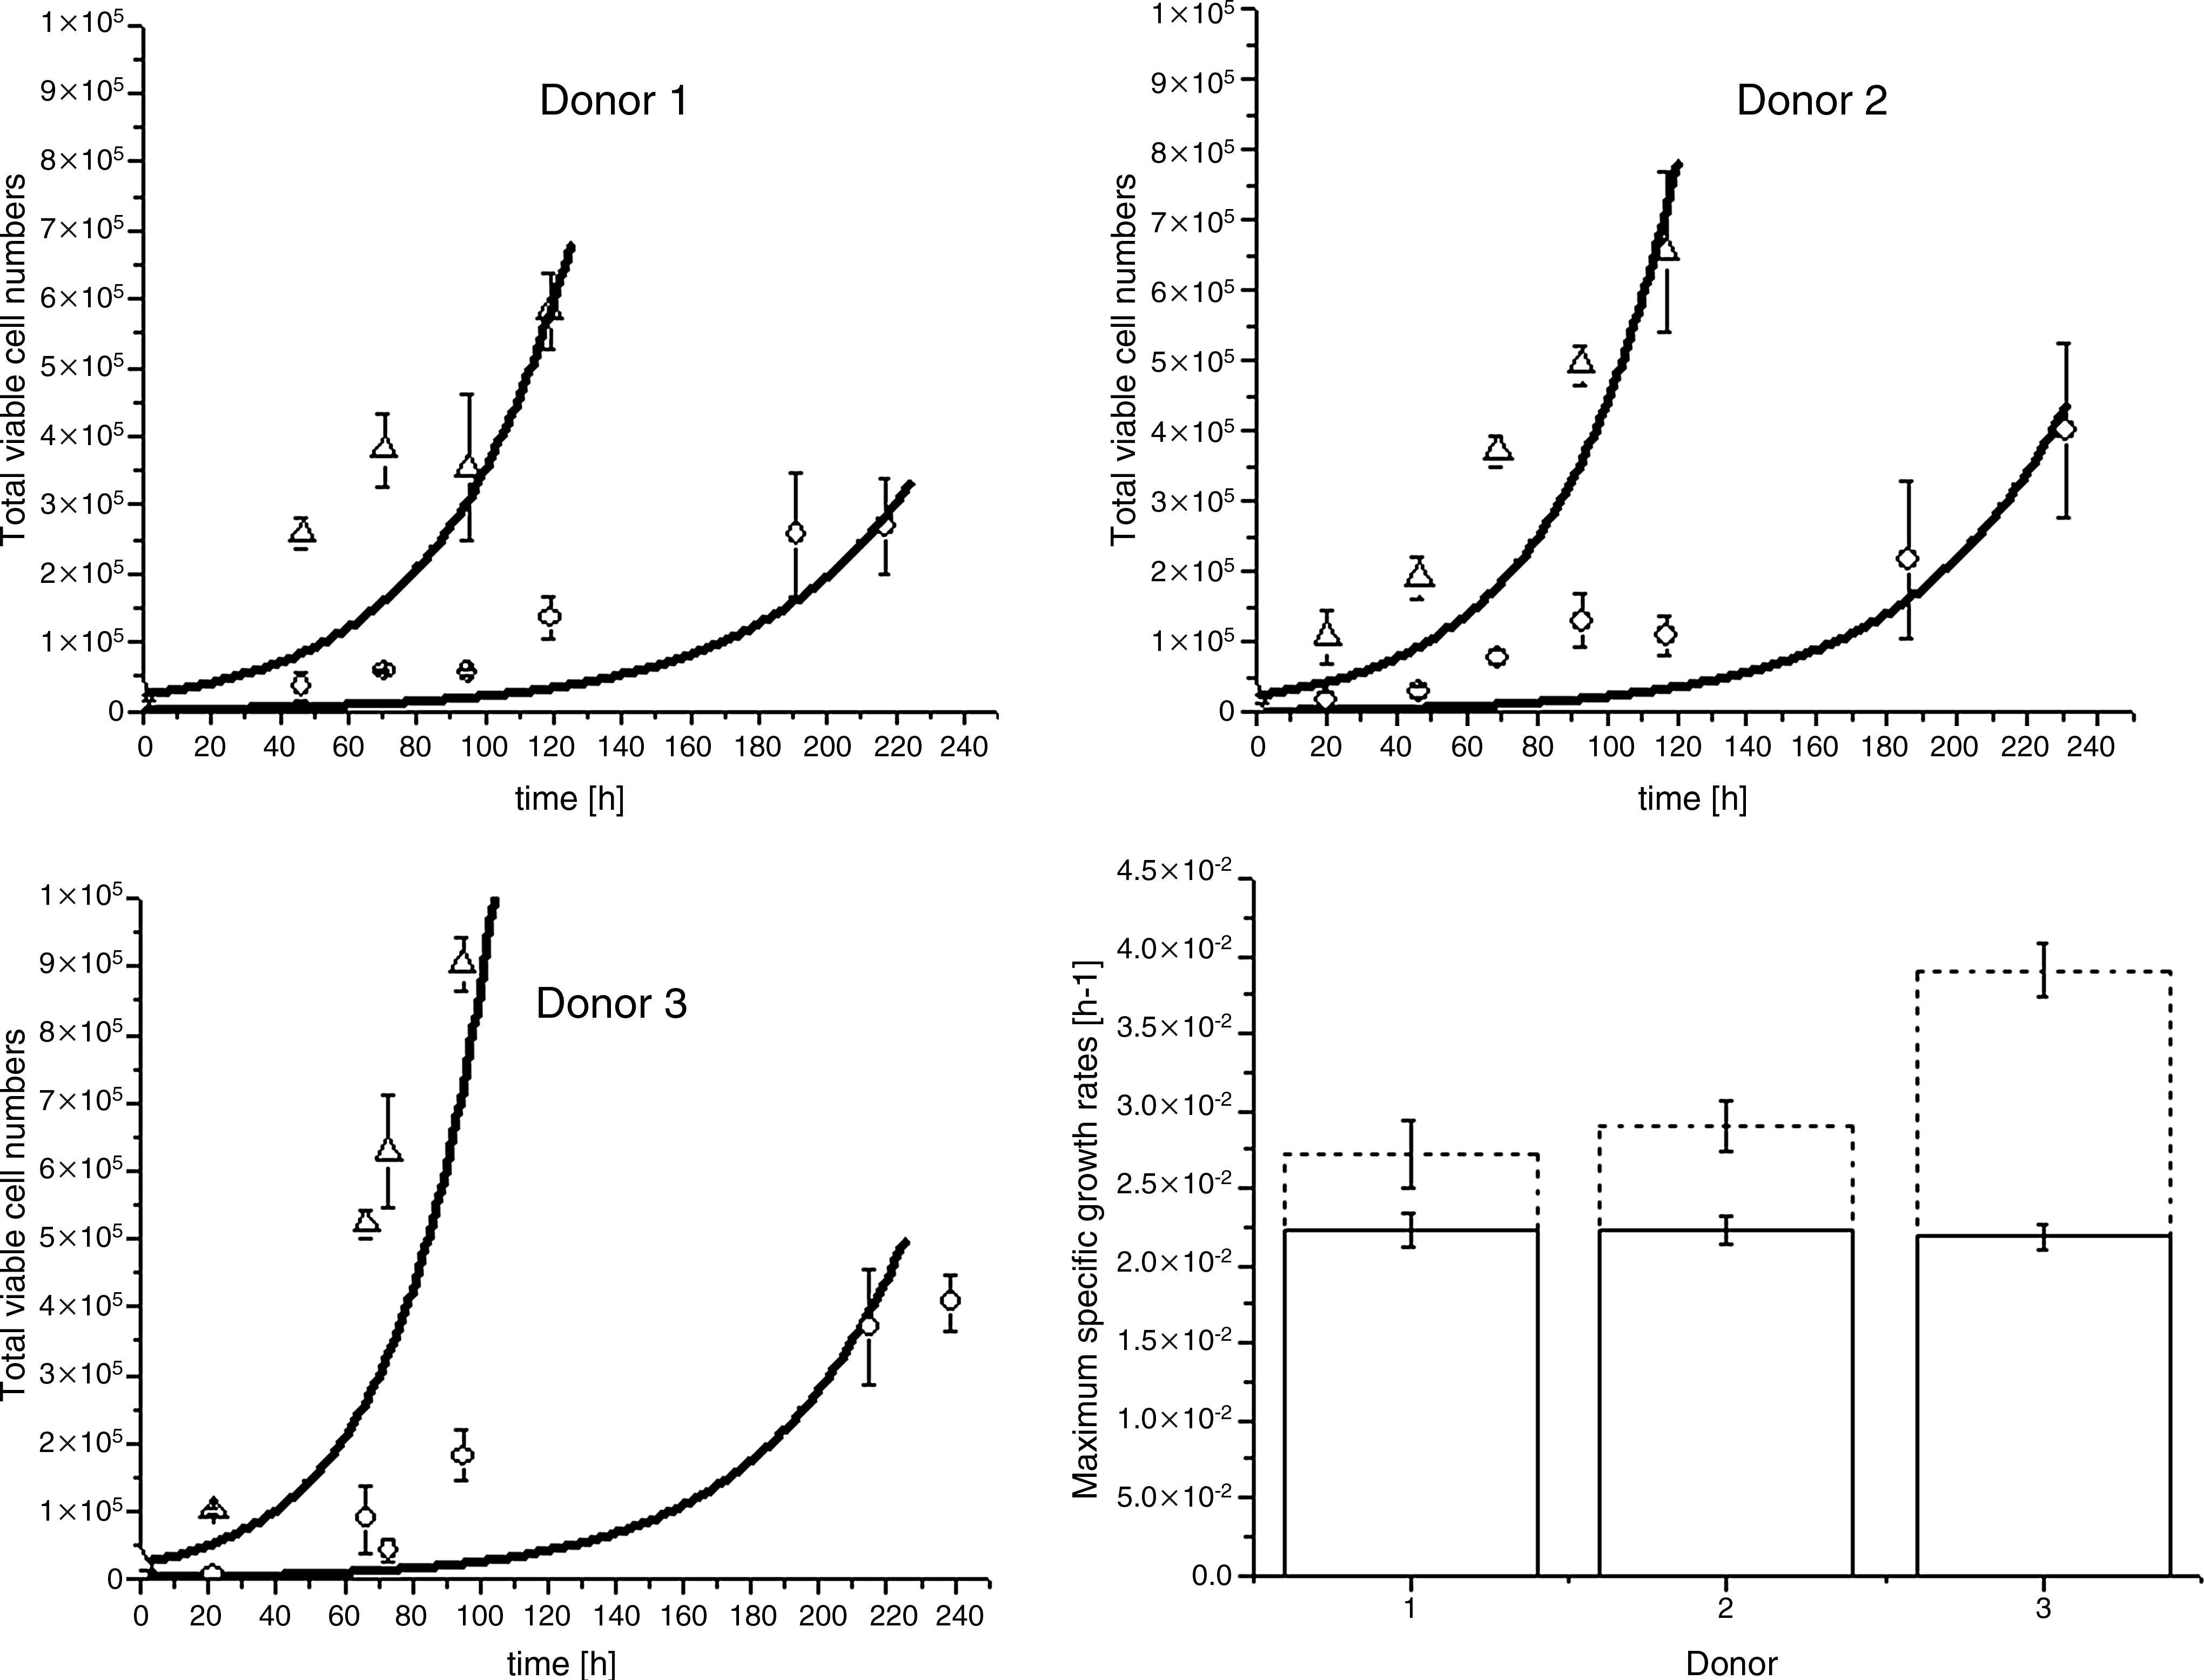
Total hMSC viable cell numbers for the three donors. Viable cell numbers for seeding densities 100 cells/cm2 (○) and 1000 cells/cm2 (Δ). Mathematical modeling results (—) for both seeding densities. Bar plot (bottom right) shows for the three donors the estimated specific growth rates and their 95% confidence interval when seeding at 100 cells/cm2 (—) or at 1000 cells/cm2 (---).
In this work, we present the growth regions as initial and exponential phases to describe the growth differences relative to the seeding densities. The initial phase is the period where cell growth is still close to the seeding density and where growth is difficult to detect. The exponential phase is the region where the cell growth can be detected and where the cell numbers increase exponentially according to mathematical modeling results. The mathematical model results showed that for the investigated hMSC seeding densities, the initial phase was 35–45 h long at 100 cells/cm2, and negligible at 1000 cells/cm2. In addition, mathematical modeling viable-cell numbers were below experimental values during the time interval (40–100 h).
By fitting Equations (1) and (2) to the data, the maximum growth rates for the three donors (μmax) were estimated. Results of μmax are shown in Figure 2 (bottom right) and Supplemental Table S1 (available online at www.liebertonline.com/ten). The 95% confidence intervals in Figure 3 show that for the three donors μmax is significantly lower at 100 cells/cm2. In addition, μmax values did not differ significantly between donors at 100 cells/cm2, whereas at 1000 cells/cm2 a significant variation between the donors was found. Solving Equation (1) and rewriting leads to the doubling time (td = ln(2)/μmax). Doubling times ranged from 31.1 to 31.7 h when cells were seeded at 100 cells/cm2, and from 17.7 to 25.5 h when cells were seeded at 1000 cells/cm2 (Supplemental Table S1).

Total moles of glucose and lactate in medium for the three donors. Moles of glucose at seeding densities 100 cells/cm2 (○) and 1000 cells/cm2 (Δ). Moles of lactate at seeding densities 100 cells/cm2 (••) and 1000 cells/cm2 (▴). Mathematical modeling results (—) for both seeding densities. Parameter values are given in Supplemental Table S1.
Glucose and lactate metabolism
Figure 3 shows the mathematical modeling results for both glucose and lactate throughout the culture period of cells seeded at 100 and 1000 cells/cm2. Experimental measurements showed that glucose was consumed and lactate was produced in both cell seeding densities. In addition, experimental results showed that proliferation-inhibiting concentrations for lactate of 25 mM23 were not reached during the culture period. Mathematical model results for glucose and lactate were close to the experimental values in both cell seeding densities.
The estimated specific reaction rates under these conditions are shown in Figure 4. From the 95% confidence intervals follows that the estimated values for qg and ql were significantly higher at the lower cell seeding density for donors 2 and 3. In addition, the results showed that qg and ql vary within donors. The lactate to glucose ratio (Yl/g) is defined as the ratio of ql to qg. Yl/g describes the efficiency of the anaerobic glycolysis reaction. Yl/g values for each donor and seeding density are found on Supplemental Table S2 (available online at www.liebertonline.com/ten).
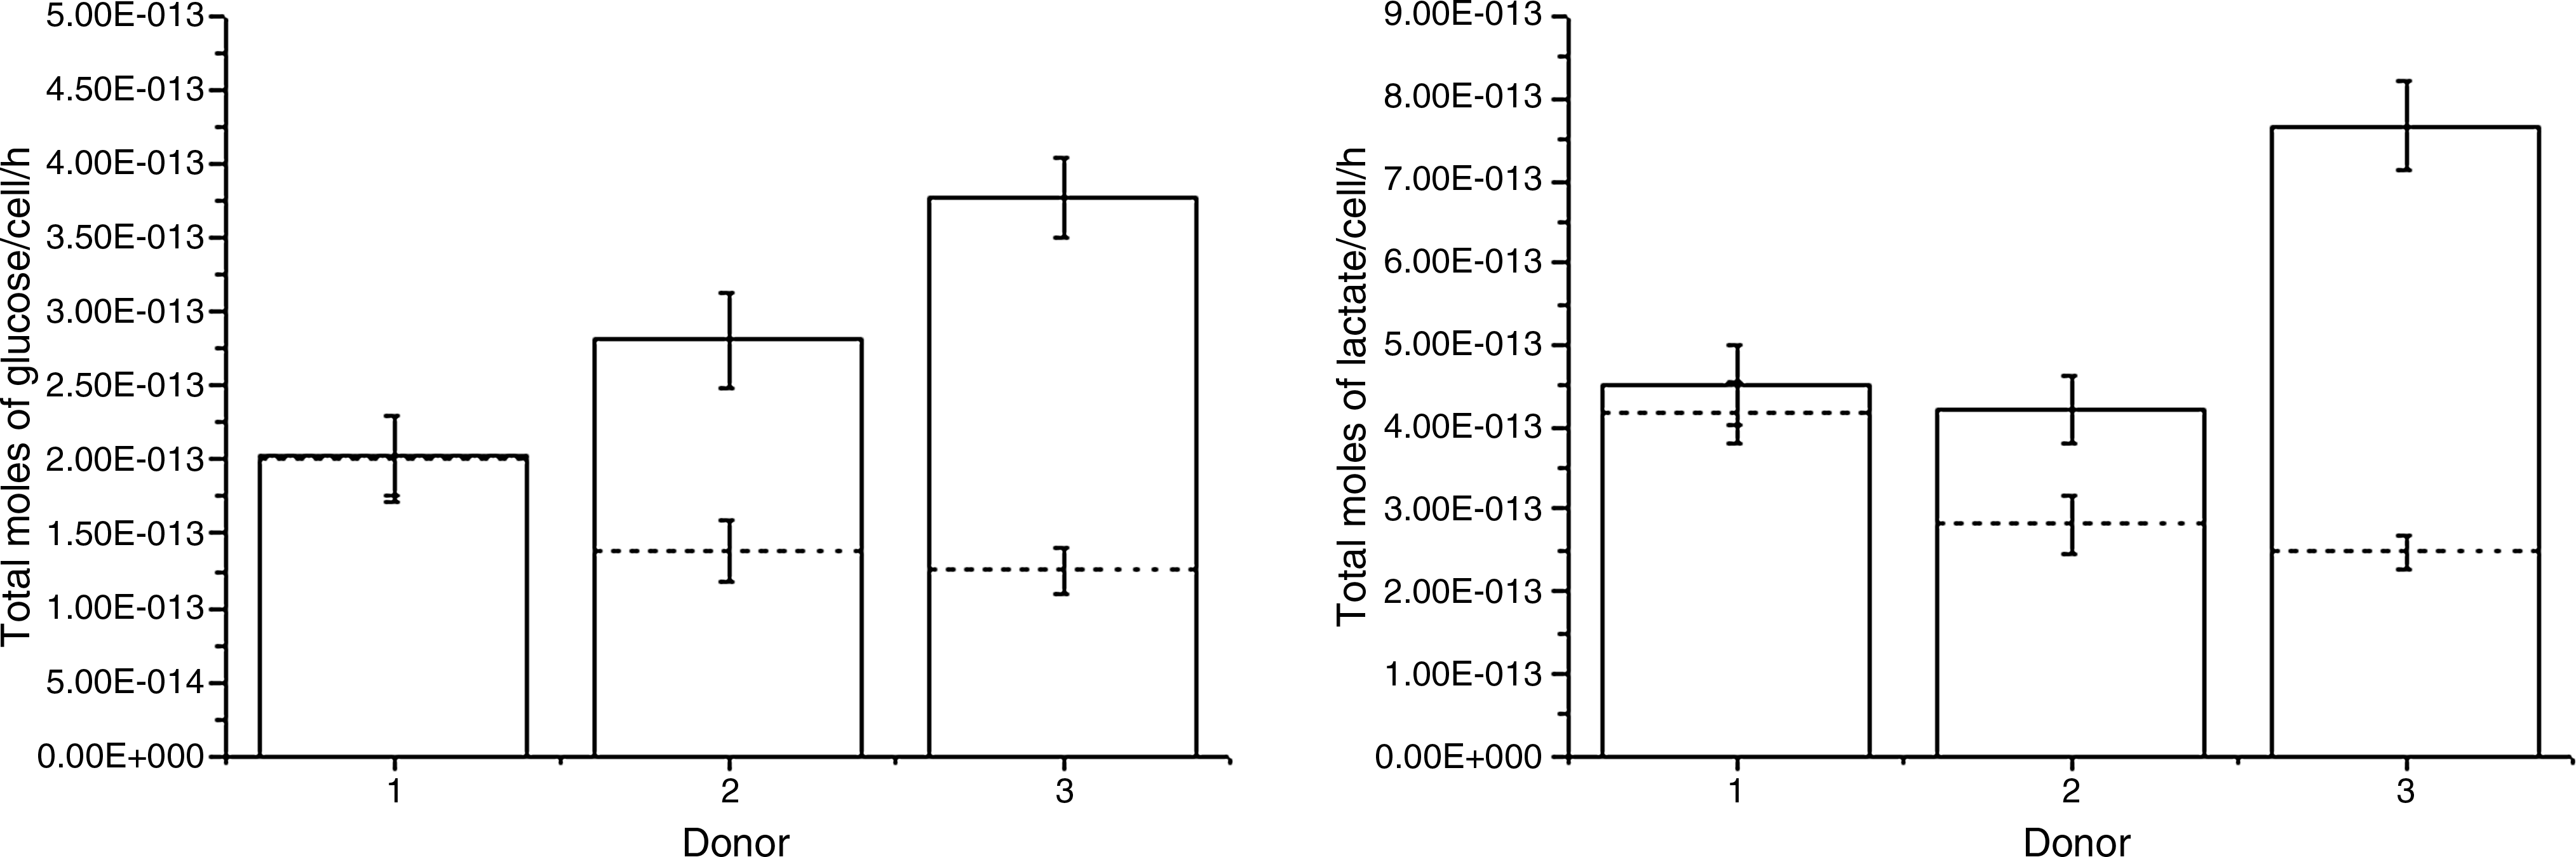
Specific glucose consumption rates qg (left) and lactate production rates ql (right) for the three donors. Seeding densities 100 cells/cm2 (—) and 1000 cells/cm2 (---). Estimated values through nonlinear least squares regression and 95% confidence intervals are given. Parameter values are listed in Supplemental Table S2.
Glutamine and glutamate metabolism
Figure 5 shows experimental glutamine and glutamate measurements and their respective mathematical model values. Figure 5 shows that there is a net decrease of the amount of glutamine throughout culture at both cell seeding densities. However, for all donors, the measured values and the mathematical model results are above the line for spontaneous degradation of glutamine. This leads, surprisingly, to the conclusion that hMSCs are glutamine producers instead of consumers. This result is reflected by model fitting results up to 130 h, which give the specific production rates of glutamine (Fig. 6).
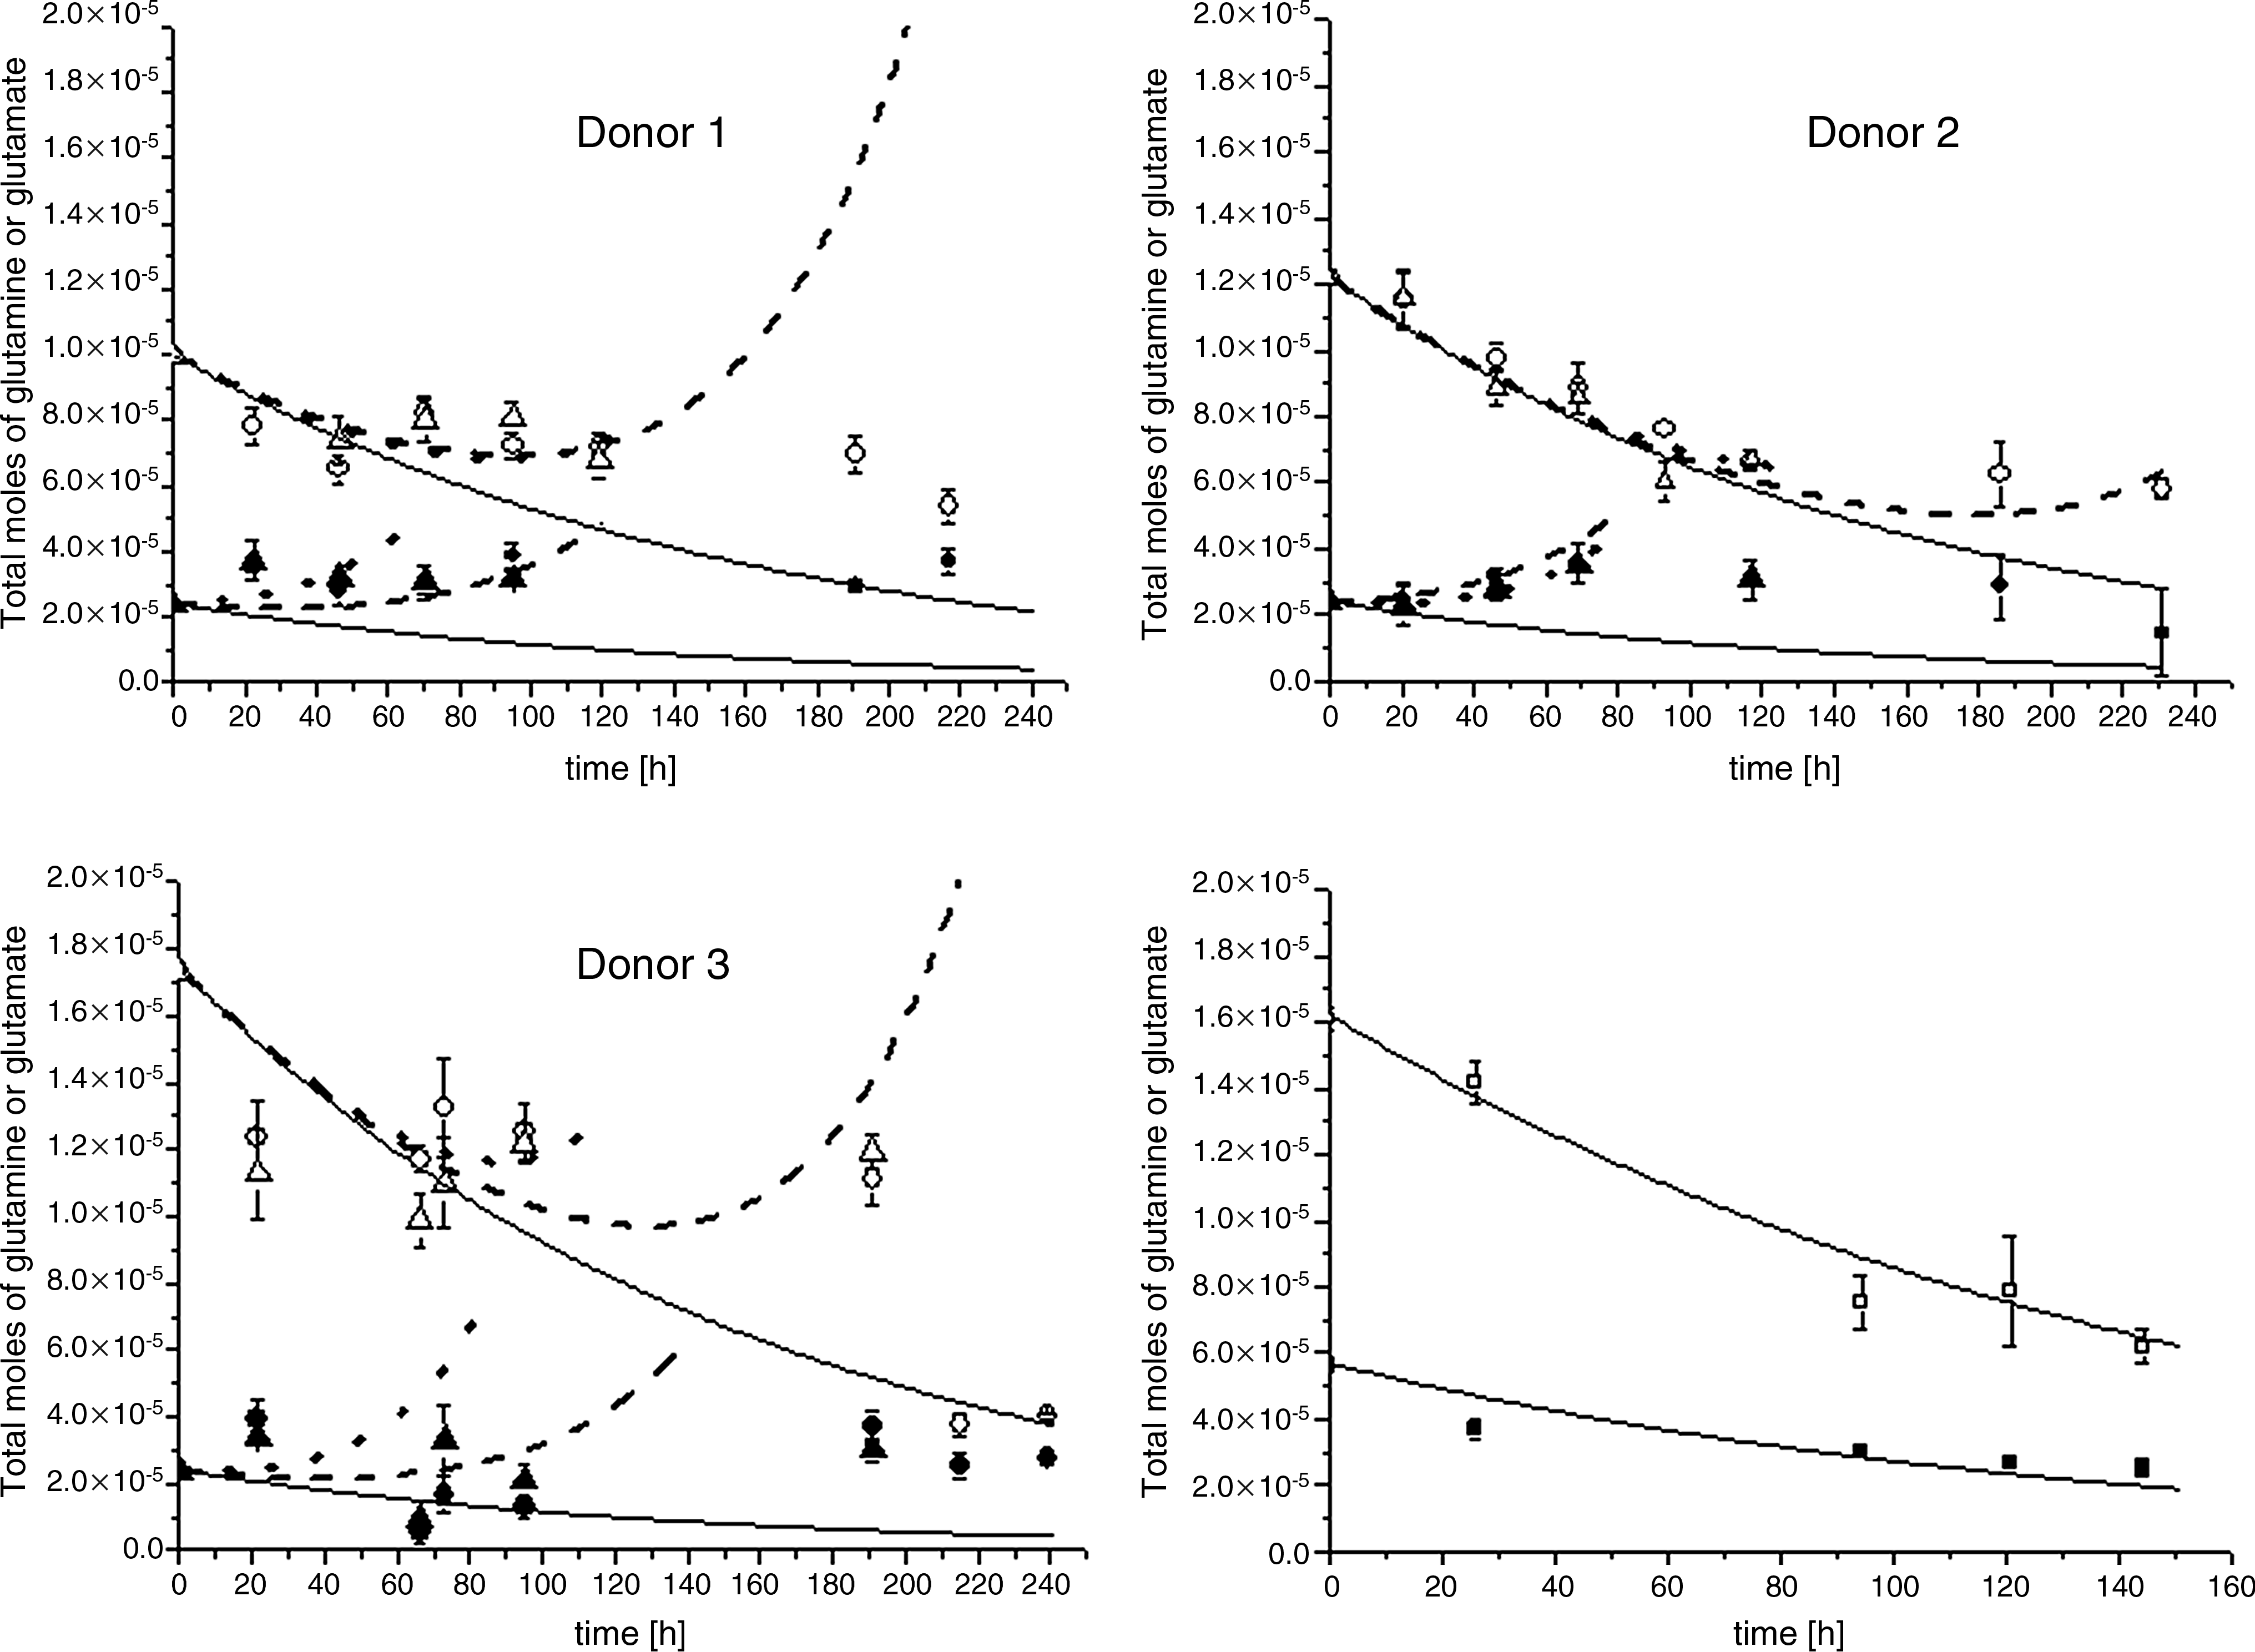
Total moles of glutamine or glutamate for the three donors. Moles of glutamine at seeding densities 100 cells/cm2 (○) and 1000 cells/cm2 (Δ). Moles of glutamate at seeding densities 100 cells/cm2 (•) and 1000 cells/cm2 (▴). Degradation in cell-free medium of glutamine (□) (bottom right) and glutamate (▪) (bottom right). Mathematical modeling results for glutamine and glutamate at seeding densities 100 cells/cm2 (∼∼) and 1000 cells/cm2 (- -). Spontaneous degradation in cell-free medium of glutamine and glutamate is plotted in the graphs (—) for each donor and for experimental values (bottom right).

Estimated specific glutamine qq (top) and glutamate qe (bottom) production rates and their 95% confidence intervals for the three donors. qq and qe when seeding at 100 cells/cm2 (—, left) and 1000 cells/cm2 (---, right). The scale on the y-axis varies depending on the seeding density.
The mathematical model tracked experimental data on production of glutamate qe for the first 30–70 h of culture, depending on the donor (Fig. 5). The assumption by Equation (4) of glutamate hMSC production only holds for the beginning of the culture in all donors. Thereafter, different trends depending on the donor were observed. For all donors, the measured values and the mathematical model results are above the line for spontaneous degradation of glutamate.
Figure 6 and Table S3 (available online at www.liebertonline.com/ten) shows the specific production rates of glutamine (qq) and glutamate (qe) when seeding at 100 and 1000 cells/cm2 for three donors. The 95% confidence intervals show that the production values for glutamine and glutamate were significantly higher at 100 cells/cm2. Further, production values for glutamine and glutamate varied within donors at both cell seeding densities.
Discussion
The mathematical model Equations (1) through (4) can be used to analyze quantitatively growth and metabolite profiles of hMSCs (i.e., glucose, lactate, glutamine and glutamate) in time in a T-flask. To our best knowledge, currently there are no mathematical models used to understand cell growth and metabolic activity of hMSCs in a T-flask.
Cell growth
In a typical batch process the number of living cells varies with time. After a lag phase, with only a small increase of cell numbers, a period of rapid growth ensues. 24 It is a challenge to evaluate the extent of the lag phase from hMSCs cultured in vitro because of two reasons: first, cells in an hMSC population are at different stages of the cell cycle; second, the error from cell counting methods is large. In addition, mathematical modeling needs expressions that account for the lag phase as a period where growth rates are approximately zero; in this work, μ is not equal to zero. Thus, we use initial phase as a more generic term to describe the region where a small increase of cell numbers is seen. Additionally, we defined the region where growth numbers increased drastically as the exponential phase.
The growth model presented by Mohler et al. on microcarrier cultures shows that anchorage-dependent cells have a lag phase mainly determined by the attachment process; 8 here, it was assumed that the initial phase is determined by levels of growth factors 25 and nutrients. Further, the mathematical model results identified differences in the initial-phase duration depending on the seeding density. Mathematical modeling results confirmed that at the lower cell seeding densities, hMSCs present a longer initial phase and slower growth rates.15–19 Gregory et al. showed that the mechanism controlling growth rates and phases depends on the levels of secreted factors such as dickkopf-1 (Dkk-1), an inhibitor of the canonical Wnt signaling pathway. 25
Distinctively, the viable cell number data did not suggest that a stationary phase followed. Cell cultures close to confluency (>130 h at 100 cells/cm2 and >220 h at 1000cells/cm2) showed cell aggregates. This suggested multilayer growth and showed cell number data with larger standard deviations. Due to these results, the mathematical modeling analysis focused on the initial and exponential phases.
In this work, we define the growth rate in Equation (2). This definition showed discrepancies of mathematical modeling and experimental hMSC numbers during the exponential phase. The growth rate could also be defined as a function of both glucose and glutamine as assumed in mathematical models of MDCK cells, 8 CHO, and HEK-293 cells, 7 among others. However, extension of Equation (2) with this assumption did not affect the fit of the mathematical model of viable hMSCs. To define the growth process, an alternative option is to assume a zero-order expression for growth (in that case Equation [1] is replaced by dXv/dt = k). Although the zero-order expression gives a somewhat better correlation for viable cell numbers, the mathematical model results for the other variables (glucose, lactate, glutamine, and glutamate, which are linked with the biomass in Equation [4]) were deteriorated.
Another assumption would be to consider a changing growth rate. Lemon et al. showed that under the assumption of a changing growth rate in time dependant upon the amount of extracellular matrix present, and the competition for space, the total cell volume fraction model fit was acceptable, whereas the undifferentiated cell volume fraction model fit was poorer. 11 In addition, an empirical mathematical model for density-dependant growth of anchorage-dependent mammalian cells, 21 based on a tunable constant, showed good results with experimental data. However, the biological significance of a tunable constant to define the growth rate needs further assessment with respect to metabolism. Literature and growth rate assumptions in this work suggest that hMSCs' growth-rate-limiting metabolites are not yet clearly identified.
The analysis leads us to conclude that the growth rate needs to be addressed experimentally in future studies by investigating both rate-limiting substrates and rate-limiting concentrations to obtain a clearer understanding on the mechanisms involved in growth of hMSCs in vitro.
Glucose and lactate metabolism
Yl/g showed glucose catabolism through anaerobic glycolysis as has been shown by hMSCs in other two-dimensional and three-dimensional culture systems.10,23 The mathematical modeling results confirm that hMSCs use glucose by anaerobic glycolysis independently of the donor or cell seeding density as shown by a value around two of the lactate to glucose stoichiometric ratio Yl/g with the exception of donor 2 at 100 cells/cm2 (Supplemental Table S2). Further, at 100 cells/cm2, both qg and ql are higher than the respective values at 1000 cells/cm2 with the exception of donor 1 at 100 cells/cm2 (Fig. 4).
Slower growth rates and higher metabolite rates when seeding at 100 cells/cm2 are counterintuitive. An interpretation of this result could be that contact inhibition, defined as the ability of a cell to deplete the medium around itself of extracellular mitogens, thereby depriving its neighbours, 26 gradually causes the differences in metabolic rates during the exponential phase in hMSC cultures. Thus, the less readily available substrates are, the lower metabolic rate of consumption and production are when seeding at 1000 cells/cm2. The higher availability of nutrients around a cell could also explain the higher fold increase of cells (Table 1) when seeding at 100 cells/cm2 as also observed by Sekiya et al. 17 The quantitative effect of contact inhibition on hMSCs could be useful in understanding growth of hMSCs and designing two-dimensional and three-dimensional expansion systems.
Glucose and lactate mathematical model fits were acceptable regardless of the seeding density. This indicates that either mechanisms expressed on Equation (4) are representative for both substrates' kinetics or that the concentrations do not change as drastically for the mathematical model to deviate. More insight into glucose and lactate kinetics can be obtained from longer culture runs where hMSC numbers can be analyzed with respect to metabolite depletion. In continuous cultures, evaluation of metabolites should be pursued with respect to rate-limiting concentrations and the maintenance coefficients.
Glutamine and glutamate metabolism
Glutamine serves as an essential metabolic precursor in nucleotide, glucose, and amino-sugar biosynthesis; glutathione homeostasis; and protein synthesis. 27 The growth of proliferating cells such as fibroblasts, lymphocytes, and enterocytes relies heavily on glutamine as an oxidative energy source. 28 However, most tissue culture media contain large amounts of glucose, and consequently the addition of L-glutamine may not be necessary for many cell lines. 29
In hMSC cultivation, glutamine decreases mostly due to spontaneous degradation. In addition, the estimated specific glutamine reaction rate resulted in production of glutamine instead of consumption by hMSCs. This, however, does not mean that hMSCs do not consume any glutamine at all; it means that the net effect for the investigated period can best be described by glutamine production by hMSCs. One possibility is that glutamate production at the beginning of culture is the result of glutamine consumed significantly during the initial phase, but produced thereafter. The results suggest that there is little contribution of glutamine to the production of lactate as reflected by the ratio Yl/g and glutamine dynamics qq (except for donor 1 when seeded at 100 cells/cm2). In future studies, glutamine metabolism in hMSC cultures should become clearer by obtaining experimental data of, for example, growth of hMSCs in glutamine-free medium.
At 100 cells/cm2, both qq and qe were higher than the respective values at 1000 cells/cm2 with the exception of donor 1 (Fig. 6). This suggested a higher metabolic rate for these amino acids when seeding at 100 cells/cm2. As described in the subsection above, we speculate that this result is related to the gradual onset of contact inhibition and identifiable via the 10-fold seeding density difference.
The glutamine and glutamate mathematical models showed that amino acid metabolism needs to be studied in far more detail. The mathematical model suggests that production of glutamine and glutamate fluctuates during the culture period. This suggests faster reaction kinetics than glucose kinetics and metabolic shifts that could be important for understanding growth of hMSCs in vitro.
During cultivation, glutamate production occurred possibly due to its role as an intermediate in not only glutamine, but also proline, histidine, and arginine metabolism. 13 After initial glutamate production, measurements showed that changes in amino acid metabolism could not be described with the mathematical model assumptions on Equation (4). It is known that hMSC gene expression varies from proliferation on day 2 to development on day 7 in culture. 30 In addition, evidence suggests that glutamate is a signaling molecule in many tissues: central nervous system, spleen, bone, pancreas, lung, heart, liver, kidney, stomach, intestine, and testis. 31 Therefore, we think that glutamine and glutamate kinetics shifts could be linked to hMSCs' change of phenotype in culture. Because kinetic mathematical models require information from the stoichiometry of the reactions, 32 more quantitative amino acid data are needed to explore the mechanisms involved in growth and amino acid metabolism of hMSCs.
Mathematical model
The mathematical model was based on mass balances and produces the course of the cell number and concentrations as a function in time. The estimation of biomass and amino acid metabolism was not optimal. However, the fit or lack thereof of the mathematical model allowed us to identify growth and metabolism characteristics not identified before. To cope with systematic deviations, an extension of the mathematical model could be considered. Extension of the mathematical model, however, implies the introduction of extra parameters. This in turn results in larger confidence intervals and less meaningful parameters. Due to the challenge ahead of using or developing a systems approach to understand hMSCs biology, we extended the model as much as the experimental data allowed. Herewith we agree with the iterative nature of mathematical modeling as stated by MacArthur and Oreffo. 1
Conclusions
We have used a mathematical model to quantitatively investigate mechanisms for growth and metabolism of hMSCs in a T-25 flask when seeding at 100 and 1000 cells/cm2. With the mathematical model, growth rates were estimated for three donors; however, the mathematical modeling results showed that rate-limiting substrates and concentrations need to be addressed to obtain a clearer understanding on the mechanisms involved in growth of hMSCs in vitro. On the other hand, glucose and lactate mathematical model results showed consistent results in the three donors, suggesting anaerobic glycolysis and a higher rate of reaction at 100 cells/cm2. Further, glutamine could be produced instead of consumed by hMSCs during part of the culture period. Glutamine and glutamate rates of production were higher at 100 cells/cm2. Higher metabolic rates could be induced by a lower contact inhibition effect when seeding at 100 cells/cm2 than when seeding at 1000 cells/cm2. Further, glutamine and glutamate kinetics were partially described and significant metabolic shifts were identified. Data on other amino acids are necessary to investigate these metabolic shifts. This work is an example of the use of mathematical models for investigating the mechanisms behind growth and metabolism of hMSCs.
Footnotes
Acknowledgments
We thank associate professors Marcel Karperien and Jan de Boer for their comments and suggestions. This work was financially supported by SenterNovem research Grant 15044112.
Disclosure Statement
No competing financial interests exist.