
Abstract
Adult mesenchymal stem cells (MSCs) are considered promising candidate cells for therapeutic cartilage and bone regeneration. Because tissue regeneration and embryonic development may involve similar pathways, understanding common pathways may lead to advances in regenerative medicine. In embryonic limb development, fibroblast growth factor receptors (FGFRs) play a role in chondrogenic differentiation. The aim of this study was to investigate and compare FGFR expression in in vivo embryonic limb development and in vitro chondrogenesis of MSCs. Our study showed that in in vitro chondrogenesis of MSCs three sequential stages can be found, as in embryonic limb development. A mesenchymal condensation (indicated by N-cadherin) is followed by chondrogenic differentiation (indicated by collagen II), and hypertrophy (indicated by collagen X). FGFR1–3 are expressed in a stage-dependent pattern during in vitro differentiation and in vivo embryonic limb development. In both models FGFR2 is clearly expressed by cells in the condensation phase. No FGFR expression was observed in differentiating and mature hyaline chondrocytes, whereas hypertrophic chondrocytes stained strongly for all FGFRs. To evaluate whether stage-specific modulation of chondrogenic differentiation in MSCs is possible with different subtypes of FGF, FGF2 and FGF9 were added to the chondrogenic medium during different stages in the culture process (early or late). FGF2 and FGF9 differentially affected the amount of cartilage formed by MSCs depending on the stage in which they were added. These results will help us understand the role of FGF signaling in chondrogenesis and find new tools to monitor and control chondrogenic differentiation.
Introduction
High-cell-density culture systems are helpful in the differentiation of MSCs toward the chondrogenic lineage. For that reason, pellet culture is an accepted model to induce chondrogenic differentiation. However, MSCs display signs of chondrocyte hypertrophy, such as production of collagen X and matrix mineralization, during an in vitro pellet culture period of several weeks.6,7 Therefore, pellet culture of MSCs has been claimed to be an in vitro model for endochondral ossification. 6 For cartilage regeneration, the consistent terminal hypertrophic differentiation of in vitro–differentiated MSCs represents a lack of external control over their differentiation. 6
In embryology research, the development of the skeleton is a popular model to study chondrogenesis and endochondral ossification. The first stage of embryonic limb development is the formation of a mesenchymal condensation, characterized by the expression of cell adhesion molecules, such as N-cadherin. As the cells in this condensation differentiate to chondrocytes, expression of the cell adhesion molecules is downregulated, whereas collagen II and SOX9 expression is upregulated, and a cartilage template is formed that consists of a proteoglycan-rich and collagen II–rich matrix. Next, this cartilage becomes hypertrophic, characterized by a collagen X production, and ultimately it ossifies.8,9 In embryonic limb development, fibroblast growth factor receptors (FGFRs) 1–3 have been extensively studied since it was discovered that mutations in these receptors cause syndromes with abnormal skeletal development. 10 Thus, studies have demonstrated that mRNA levels of FGFR2 are upregulated in the mesenchymal condensation, whereas FGFR3 is expressed during differentiation and FGFR1 during hypertrophy.10–12
We hypothesize that the chondrogenic differentiation of MSCs in pellet culture takes place in a similar fashion to embryonic endochondral ossification. The high-cell density that is used in this model suggests that the chondrogenesis in this in vitro model starts with cell condensation, as in embryonic chondrogenesis. This may then be followed by chondrocyte differentiation and terminal hypertrophic differentiation. Moreover, similar signaling cues may be involved in in vitro differentiation and embryonic development. As FGFR activation is associated with endochondral ossification during development, it is likely that FGFR activation is related to the consistent terminal hypertrophic differentiation seen in MSCs in culture. Although studies on mRNA level indicate an important role for FGFRs in embryonic endochondral ossification, data on protein level are lacking. Moreover, FGFR expression has never been studied extensively in in vitro chondrogenesis of MSCs.
We therefore analyzed the developmental stages (condensation, differentiation, and hypertrophy) of in vivo embryonic endochondral ossification of the limbs and in vitro chondrogenic differentiation of bone marrow–derived MSCs. We studied the expression of FGFR1–3 in these different developmental stages, and compared the expression patterns in both models. Finally, we added FGF2 and FGF9 to modulate FGF signaling during specific stages in chondrogenesis. Our ultimate goal is to learn from embryonic principles to find new tools to monitor and control chondrogenic differentiation in vitro.
Materials and Methods
Embryonic chondrogenesis
C57/BL6 female mice were intercrossed with CBA males (Charles River Laboratories, Wilmington, MA). Gestational age was estimated by the vaginal plug method, with the day of plug occurrence designated as day 1 (E1). After gravid female mice had been killed by isoflurane inhalation, embryos were excised following cervical dilatation on E12, E13, E14, E16, and E18 and immediately placed into Dulbecco's phosphate-buffered saline (PBS; Gibco, Carlsbad, CA). Embryonic age was determined by a combination of external features and somite count.
Cell isolation and expansion
Bone marrow–derived MSCs were isolated from femoral shaft biopsies of five patients (four women and one man, age 32–60) undergoing total hip replacement, after informed consent had been obtained in accordance with the local ethics committee (MEC 2004-142). The heparinized aspirate was seeded at a density of 2–5 × 10⁵ cells/cm2 in the expansion medium Dulbecco's modified Eagle medium (DMEM)–low glucose (LG) [Gibco], supplemented with 10% fetal calf serum [Gibco], 1 ng/mL FGF2 [AbD Serotec, Kidlington, United Kingdom], 25 μg/mL ascorbic acid-2-phosphate [Sigma-Aldrich, St. Louis, MO], 1.5 μg/mL fungizone [Gibco], and 50 μg/mL gentamicin [Gibco]). After 24 h, nonadherent cells were washed off, and adherent cells were further expanded. At subconfluency, MSCs were trypsinized, seeded at a density of 2300 cells/cm2, and further expanded. MSCs from passage 4 were used for the in vitro differentiation experiment.
To examine FGFR expression during expansion, MSCs from passage 4 were expanded in monolayer for another 4 days, followed by immunohistochemistry for FGFR1–3. To evaluate the effect of added FGF2 on FGFR expression, MSCs from passage 3 were expanded either in a medium containing FGF2 or in a medium without FGF2, until 4 days into passage 4, when immunohistochemistry for FGFR1–3 was performed.
In vitro differentiation
After expansion, MSCs were cultured in pellets, formed by centrifuging aliquots of 2 × 10⁵ cells in a 0.5 mL medium at 200 g for 8 min in a polypropylene tube. Pellets were differentiated in a humidified 37°C/5% CO2 incubator in Dulbecco's modified Eagle medium containing Glutamax (Gibco), ITS + 1 (B&D Bioscience, Bedford, MA), 40 μg/mL L-proline (Sigma-Aldrich), 1 mM sodium pyruvate (Gibco), 5 μg/mL fungizone and 50 μg/mL gentamicin, 25 μg/mL ascorbic acid-2-phosphate, 10 ng/mL transforming growth factor (TGF)-β2 (R&D Systems, Minneapolis, MN), and 10−7 M dexamethasone (Sigma-Aldrich).
FGFR expression during chondrogenesis was examined with cells from four different donors. Pellets were sequentially harvested on different culture days in triplicate for immunohistochemistry. Pellets from one donor were harvested in duplicate only, because of shortage in cell number. Pellets of donor 1 were used for additional gene expression analysis.
To study whether FGFR expression in our in vitro model was regulated by culture conditions independent of chondrogenic differentiation, we used pellets from one donor at all experimental time points as a control cell population. These pellets were cultured without dexamethasone and did not undergo chondrogenic differentiation as was demonstrated with a negative collagen II staining after 35 days of culture. The absence of dexamethasone in the culture medium was the only difference with the experimental condition; the rest of the medium (including TGF-β) was the same.
Modulation of FGF signaling
To study whether stage-specific modulation of chondrogenesis is feasible with FGFs, we used MSCs from two donors: donor 1, who was extensively studied in the previous experiment, and a new donor. Pellets were chondrogenically differentiated in the medium mentioned above (including TGF-β2); 5 nM FGF2 or FGF9 (both from Peprotech, Rocky Hill, NJ) was added to this medium throughout the culture, during early differentiation (days 3–14), or during late differentiation (days 21–35). As a control, pellets were differentiated in the chondrogenic medium without FGF. Pellets were harvested in triplicate at day 35 for immunohistochemistry and biochemistry. Three control pellets were also harvested on day 21 to analyze the amount of matrix produced before FGF was added during late differentiation.
Immunohistochemistry
Embryonic limb specimens and pellets were fixed in 4% formalin in PBS. Both pellets and limb specimens were embedded in paraffin after pellets were set in 2% agar. MSCs in monolayer were fixed for 15 min in 4% formalin. To reduce variability in histochemical results, all pellets were fixed overnight and stained in the same procedure.
To allow the use of monoclonal mouse antibodies on murine specimens, an earlier described method 13 was used to link the antibody with anti-mouse antiserum before immunohistochemistry. Antigen retrieval for collagen II was performed through incubation with 0.1% pronase (Sigma-Aldrich) in PBS for 30 min, whereas antigen retrieval for collagen X required 0.1% pepsin (Sigma-Aldrich) in 0.5 M acetic acid (pH 2.0) for 2 h. Both staining continued with incubation with 1% hyaluronidase (Sigma-Aldrich) in PBS. A heat-induced epitope retrieval was performed for N-cadherin with Target Retrieval Solution (Dako, Glostrup, Denmark), according to the manufacturer's guideline. No enzymatic steps were performed for FGFR1–3.
Nonspecific binding sites were blocked with 10% goat serum in PBS, and sections were incubated overnight with primary antibodies. Monoclonal antibodies directed against both murine and human antigens were available for N-cadherin (M3613; Dako), collagen II (II/II6B3; Developmental Studies Hybridoma Bank, Iowa City, IA), and collagen X (2031501005; Quartett, Berlin, Germany). For FGFR1–3, only polyclonal antibodies were available that were directed to both murine and human tissues (sc-121, sc-122, and sc-123; Santa Cruz Biotechnology, Santa Cruz, CA). To study the reliability of the use of these polyclonal antibodies, we immunohistochemically stained pellets (of human MSCs) with both these polyclonal antibodies and with monoclonal antibodies against FGFR1 (ab829; Abcam, Cambridge, United Kingdom) and FGFR2 (MAB6843; R&D Systems). The staining produced by these polyclonal antibodies showed the same specificity as the staining produced by these monoclonal antibodies, suggesting that the use of polyclonal antibodies (necessary for directly comparing the human and murine model) did not affect the observed FGFR expression pattern. An alkaline phosphatase–conjugated secondary antibody was used, followed by incubation with Neu Fuchsin substrate (Chroma, Köngen, Germany) to demonstrate alkaline phosphatase activity with a red stain.
In each staining procedure, a mouse monoclonal negative control antibody (Dako) was used as an isotype control for the murine antibodies (N-cadherin, collagen II, collagen X, and the monoclonal FGFR1–2 antibodies). Rabbit immunoglobulin fraction (normal) (Dako) was used as a negative control for the polyclonal rabbit antibodies (polyclonal FGFR1–3 antibodies). Negative controls were subject to the same antigen retrieval methods as the corresponding antibody. A staining was considered successful and used for analysis only if the control was negative. Slides were counterstained with hematoxylin.
To count the percentage of positive cells for FGFR1–3, the largest section of each pellet (section from the middle of the pellet) was selected. On this section the center (∼50% of the total diameter) and periphery of the pellet were analyzed separately. A cell was considered positive when the cytoplasm stained red. To express a difference in staining intensity, the percentage of positive cells was multiplied by a score of 1–3, which represented an increasing intensity of the staining. This resulted in a maximum score of 300 per pellet, meaning that all cells were strongly stained.
N-cadherin was scored by counting the percentage of positive cells in the center of the pellet, as condensation takes place there.
Scoring for collagen II and collagen X was done by calculating the percentage of the positive-staining surface in at least three different sections throughout a pellet, using a grid of 0.1 × 0.1 mm at 10 × magnification. To express a difference in staining intensity, this percentage was multiplied by a score of 1–3, representing increasing intensity. This resulted in a maximum score of 300, representing the whole pellet stained intensively.
All scorings were performed blindly by two independent observers, and per pellet their scores were averaged.
Gene expression analysis
For total RNA isolation, pellets were manually homogenized in RNA-BeeTM (TEL-TEST, Friendswood, TX). RNA was extracted with chloroform and purified from the supernatant using the RNAeasy Micro Kit (Qiagen, Hilden, Germany), according to the manufacturer's guidelines with on-column DNA digestion.
RNA concentration and purity were assessed on a spectrophotometer (NanoDrop® ND-1000 UV-Vis Spectrophotometer; Isogen Life Science B.V., De Meern, The Netherlands). Complementary DNA (cDNA) was made using RevertAid™ First Strand cDNA Synthesis Kit (MBI Fermentas, St. Leon-Rot, Germany), and polymerase chain reactions (PCRs) were performed using TaqMan® Universal PCR MasterMix (Applied Biosystems, Capelle a/d Ijssel, The Netherlands), as described earlier, 14 but on an ABI PRISM® 7000 (Applied Biosystems, Foster City, CA). Real-time PCRs for collagen II and collagen X are reported by de Mos et al. 15 Oligonucleotide primers for FGFR assays were designed using PrimerExpress 2.0 software (Applied Biosystems, Foster City, CA) to meet SYBRGreen I requirements; gene specificity was ensured by basic local alignment search tool (BLASTN) search.
Primer sequences for the FGFRs were FGFR1_FwX2 (5′-GTCTGCTGACTCCAGTGCAT-3′) and FGFR1_RvX2 (5′-GGTCTTCGGGAAGCTCATAC-3′); FGFR2_Fw (5′-AGCGTTGCCATTCAAGTGACT-3′) and FGFR2_Rv (5′-CTACGCGCAATGCCTTCA-3′); and FGFR3_FwX (5′-GCTGCCCGTGAAGTGGAT-3′) and FGFR3-RvX (5′-AGAGCAGGACCCCAAAGGA-3′). Primers for FGFR2 and FGFR3 were designed to detect all currently known isoforms. This was not possible for FGFR1 in a single assay, and our primer set for FGFR1 detects all currently known splice variants except isoforms 5 and 6. This includes, but not discriminates between, the so-called isoforms IIIb and IIIc.
Amplification efficiencies of all assays were between 90% and 98% (data not shown). Data were normalized to GAPDH, which was stably expressed across all harvest days (data not shown), and presented as relative expression. 16
Biochemistry
Cartilage constructs were digested overnight at 56°C in 1 mg/mL proteinase K (Sigma-Aldrich) in Tris/ethylene-diaminetetraacetic acid buffer (pH 7.6) containing 185 μg/mL iodoacetamide and 1 μg/mL pepstatin A (Sigma-Aldrich). Glycosaminoglycan (GAG) content was quantified using dimethylmethylene blue assay. 17 The metachromatic reaction of GAG with dimethylmethylene blue was monitored with a spectrophotometer, and the ratio A530:A590 was used to determine the GAG amount, using chondroitin sulfate C (Sigma-Aldrich) as a standard. To determine the amount of DNA, each proteinase K–digested sample was treated with 100 μL heparin (8.3 IU/mL in PBS) and 50 μL ribonuclease A (50 μg/mL in PBS) for 30 min at 37°C. This was followed by adding 50 μL ethidium bromide solution (25 μg/mL in PBS). Samples were analyzed on the Wallac 1420 victor2 (Perkin-Elmer, Wellesley, MA) using an extinction filter of 340 nm and an emission filter of 590 nm. For standards, calf thymus DNA (Sigma-Aldrich) was used.
Statistical analysis
Statistical analysis was conducted using the GraphPad Prism 5 (San Diego, CA) software for Windows. Values are represented as mean ± standard error of the mean. To compare histological scores and gene expression of FGFRs of the different culture days, statistical analysis was performed using one-way analysis of variance, followed by a Newman–Keuls test for multiple comparisons. To compare the histological score for the center of the pellets with that in the periphery on a specific culture day, an unpaired t-test was performed. The same test was used to compare GAG content. The level of significance was set at a p-value of <0.05.
Results
Embryonic chondrogenesis
Condensation (E12)
On embryonic day 12 (E12), N-cadherin was observed in the mesenchymal condensation in the center of the limb bud. Collagen II stained only very weakly in the mesenchymal condensation on E12. No collagen X was seen at this stage (data not shown). On E12, expression of FGFR1 was lower in the mesenchymal condensation than in the surrounding loose mesenchyme. In contrast, FGFR2 and FGFR3 expression was seen only in the mesenchymal condensation, although the staining for FGFR3 was not very strong (Fig. 1A–C).
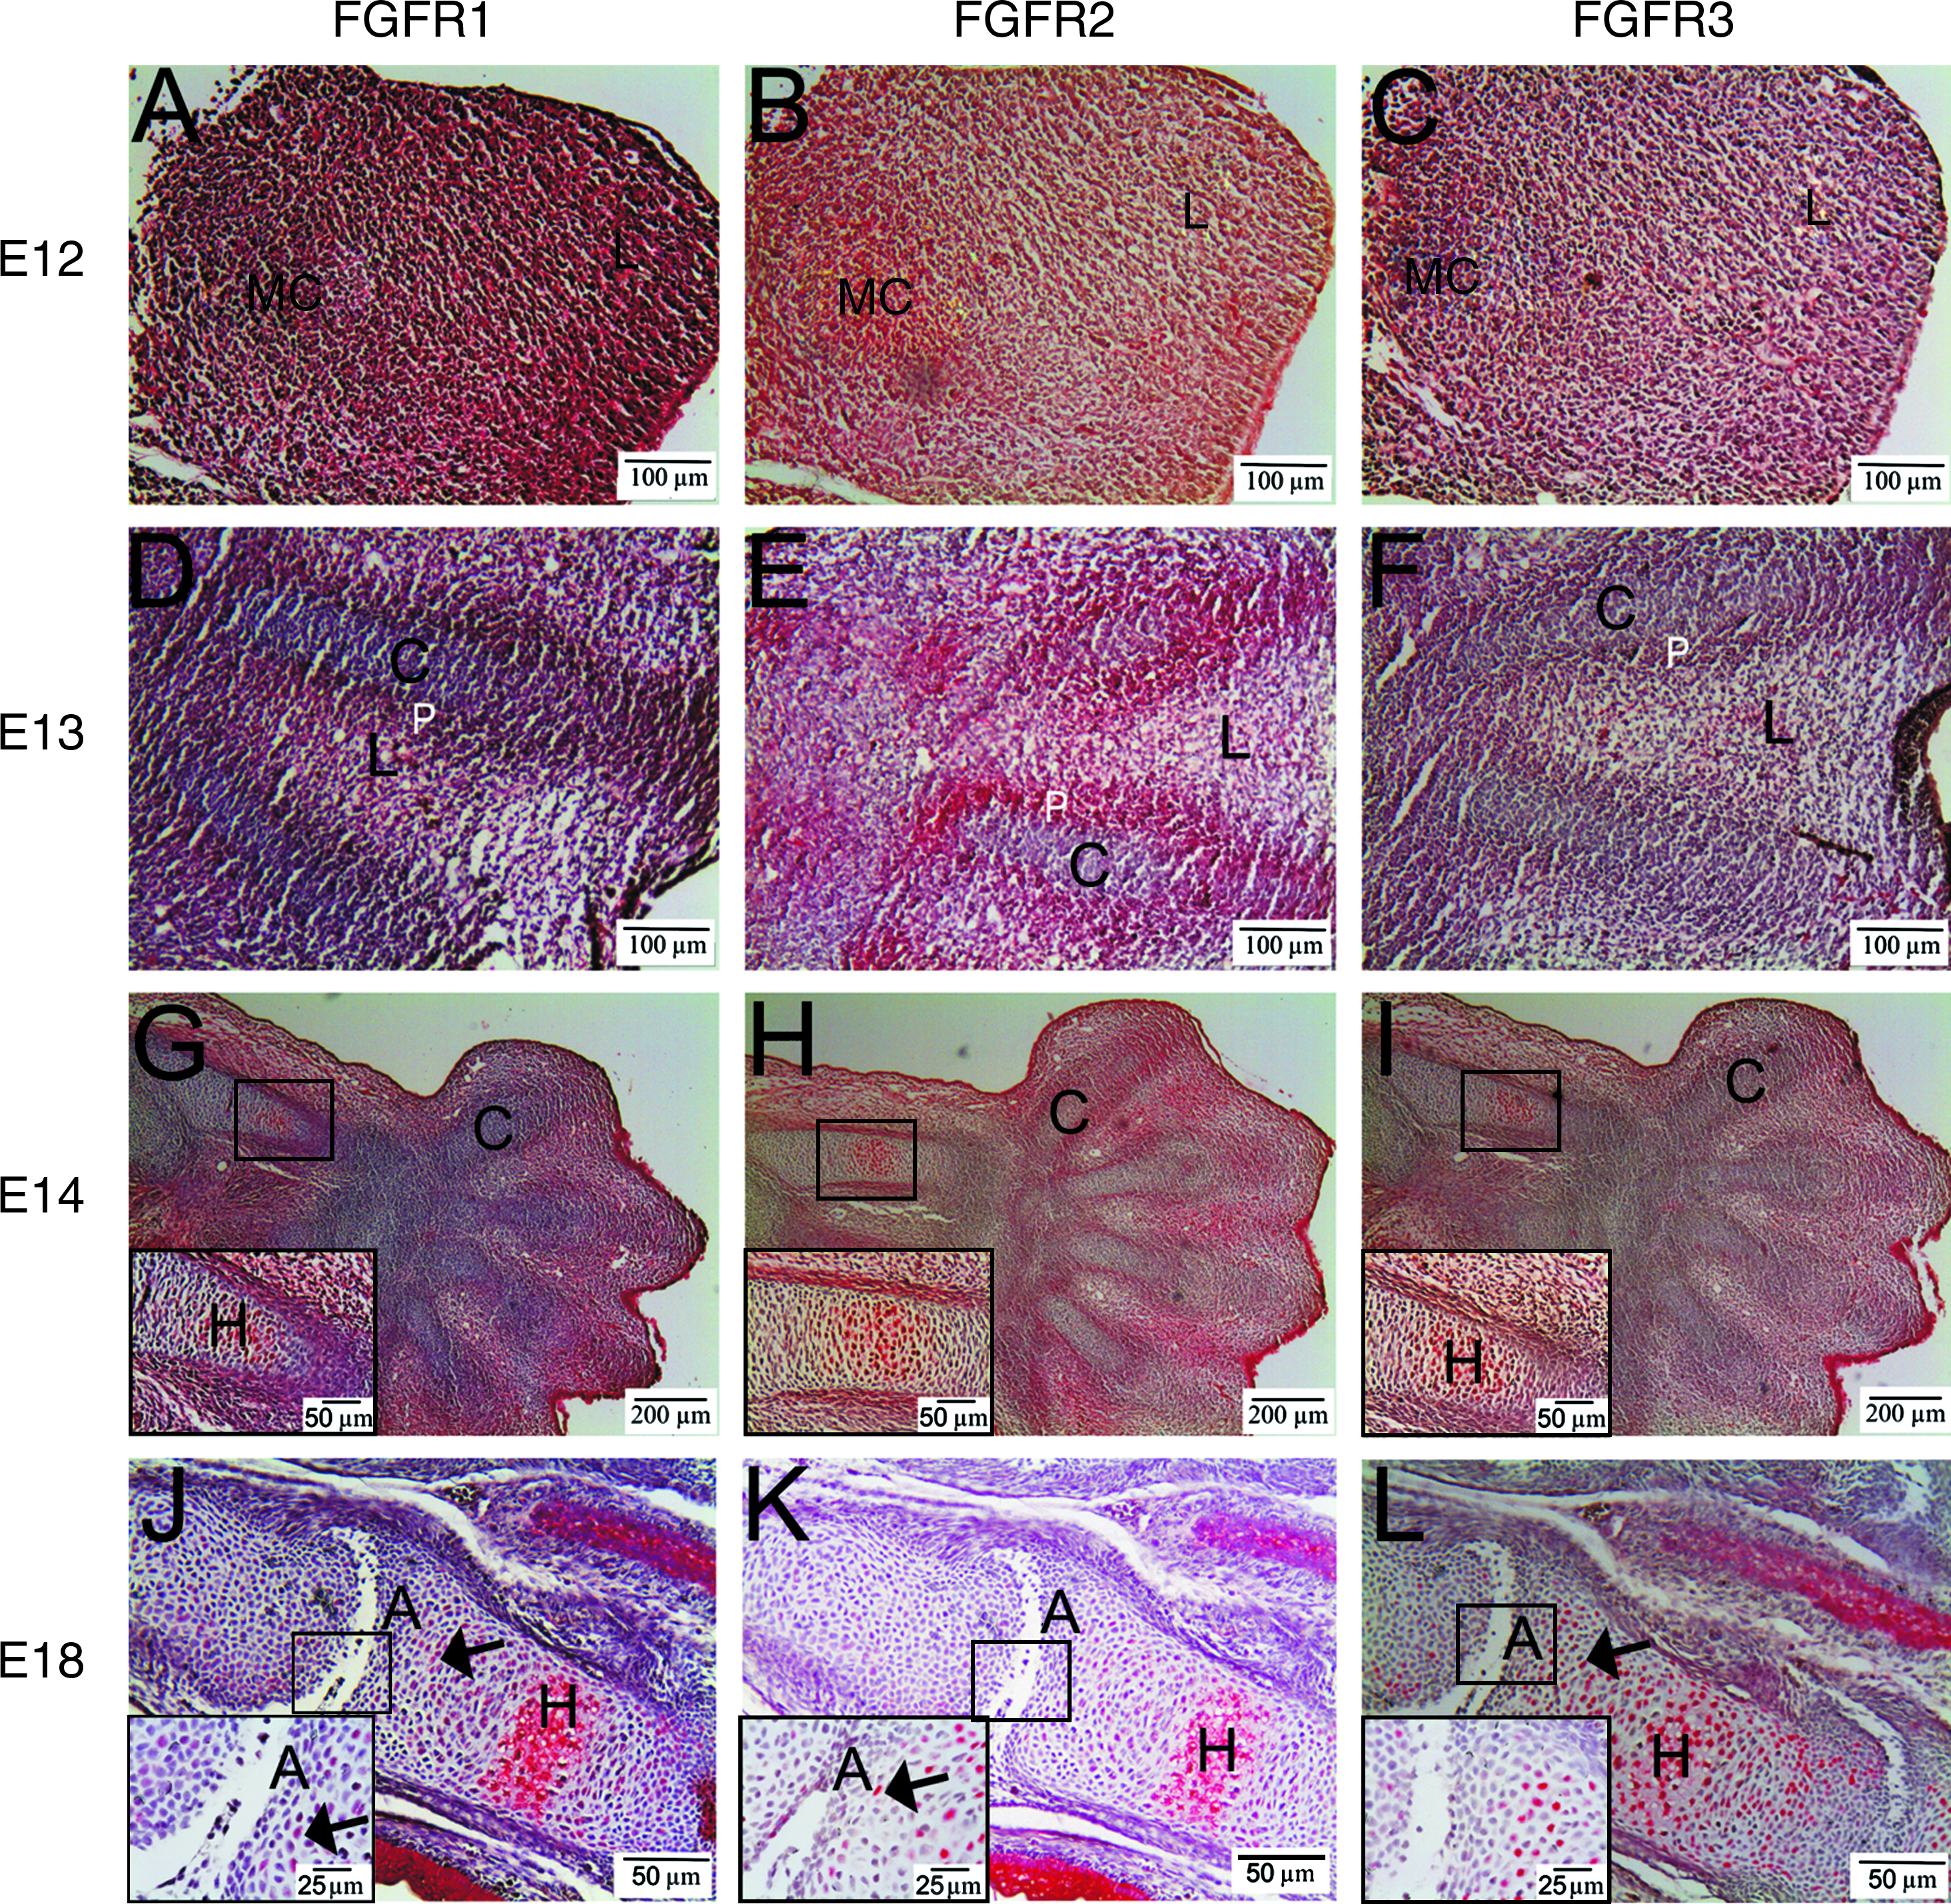
FGFR expression in embryonic chondrogenesis. Red staining demonstrates positivity for the antibody. (
Differentiation (E13)
At E13, multiple cartilage-like elements had formed, characterized by a collagen II–rich matrix. No N-cadherin or collagen X was seen (data not shown). At this stage, no expression of FGFR1–3 was seen in the differentiating chondrocytes (Fig. 1D–F). FGFR1 and FGFR2 were expressed in the periphery of the cartilage templates, outlining the future perichondrium. FGFR2 was also expressed in the mesenchyme located between the future skeletal elements. FGFR3 was not expressed anywhere at this stage.
Hypertrophy (E14–18)
The first signs of hypertrophy were seen at E14, characterized by a collagen X–rich matrix (data not shown). These hypertrophic chondrocytes expressed FGFR1–3 at a high level, whereas the remaining differentiating chondrocytes showed no expression of FGFRs at all (Fig. 1G–I). At E18, expression of FGFR1–3 was not only limited to hypertrophic chondrocytes, but also expressed by some differentiating chondrocytes (Fig. 1J–L).
Articular cartilage (E16–E18)
To evaluate the expression of FGFR1–3 in permanent cartilage, the articular cartilage was studied. Interphalangeal joint cavitation was noted at E16 and E18. The joint surface of the phalanges was covered with a high-density layer of differentiated chondrocytes not expressing FGFR1–3. No expression of FGFR1–3 was seen in these articular hyaline chondrocytes at any time point (Fig. 1J–L).
In vitro chondrogenesis
Differentiation stages
After 35 days of culture, pellets of all donors had produced both collagen II and X, suggesting terminal hypertrophic cartilage differentiation. A large, swollen morphology of the MSCs confirmed their hypertrophic differentiation. Only pellets of donor 1 homogeneously differentiated to cartilage. Of the other three donors, only a limited area within the pellets showed collagen II and X production (20–75% of the area), indicating that only a subpopulation of the cells in these pellets chondrogenically differentiated during culture. Therefore, gene expression was performed on pellets of donor 1, supporting the immunohistochemical results. mRNA levels of collagen II and collagen X gradually increased over time (Fig. 2A, B), confirming the hypertrophic differentiation of MSCs.
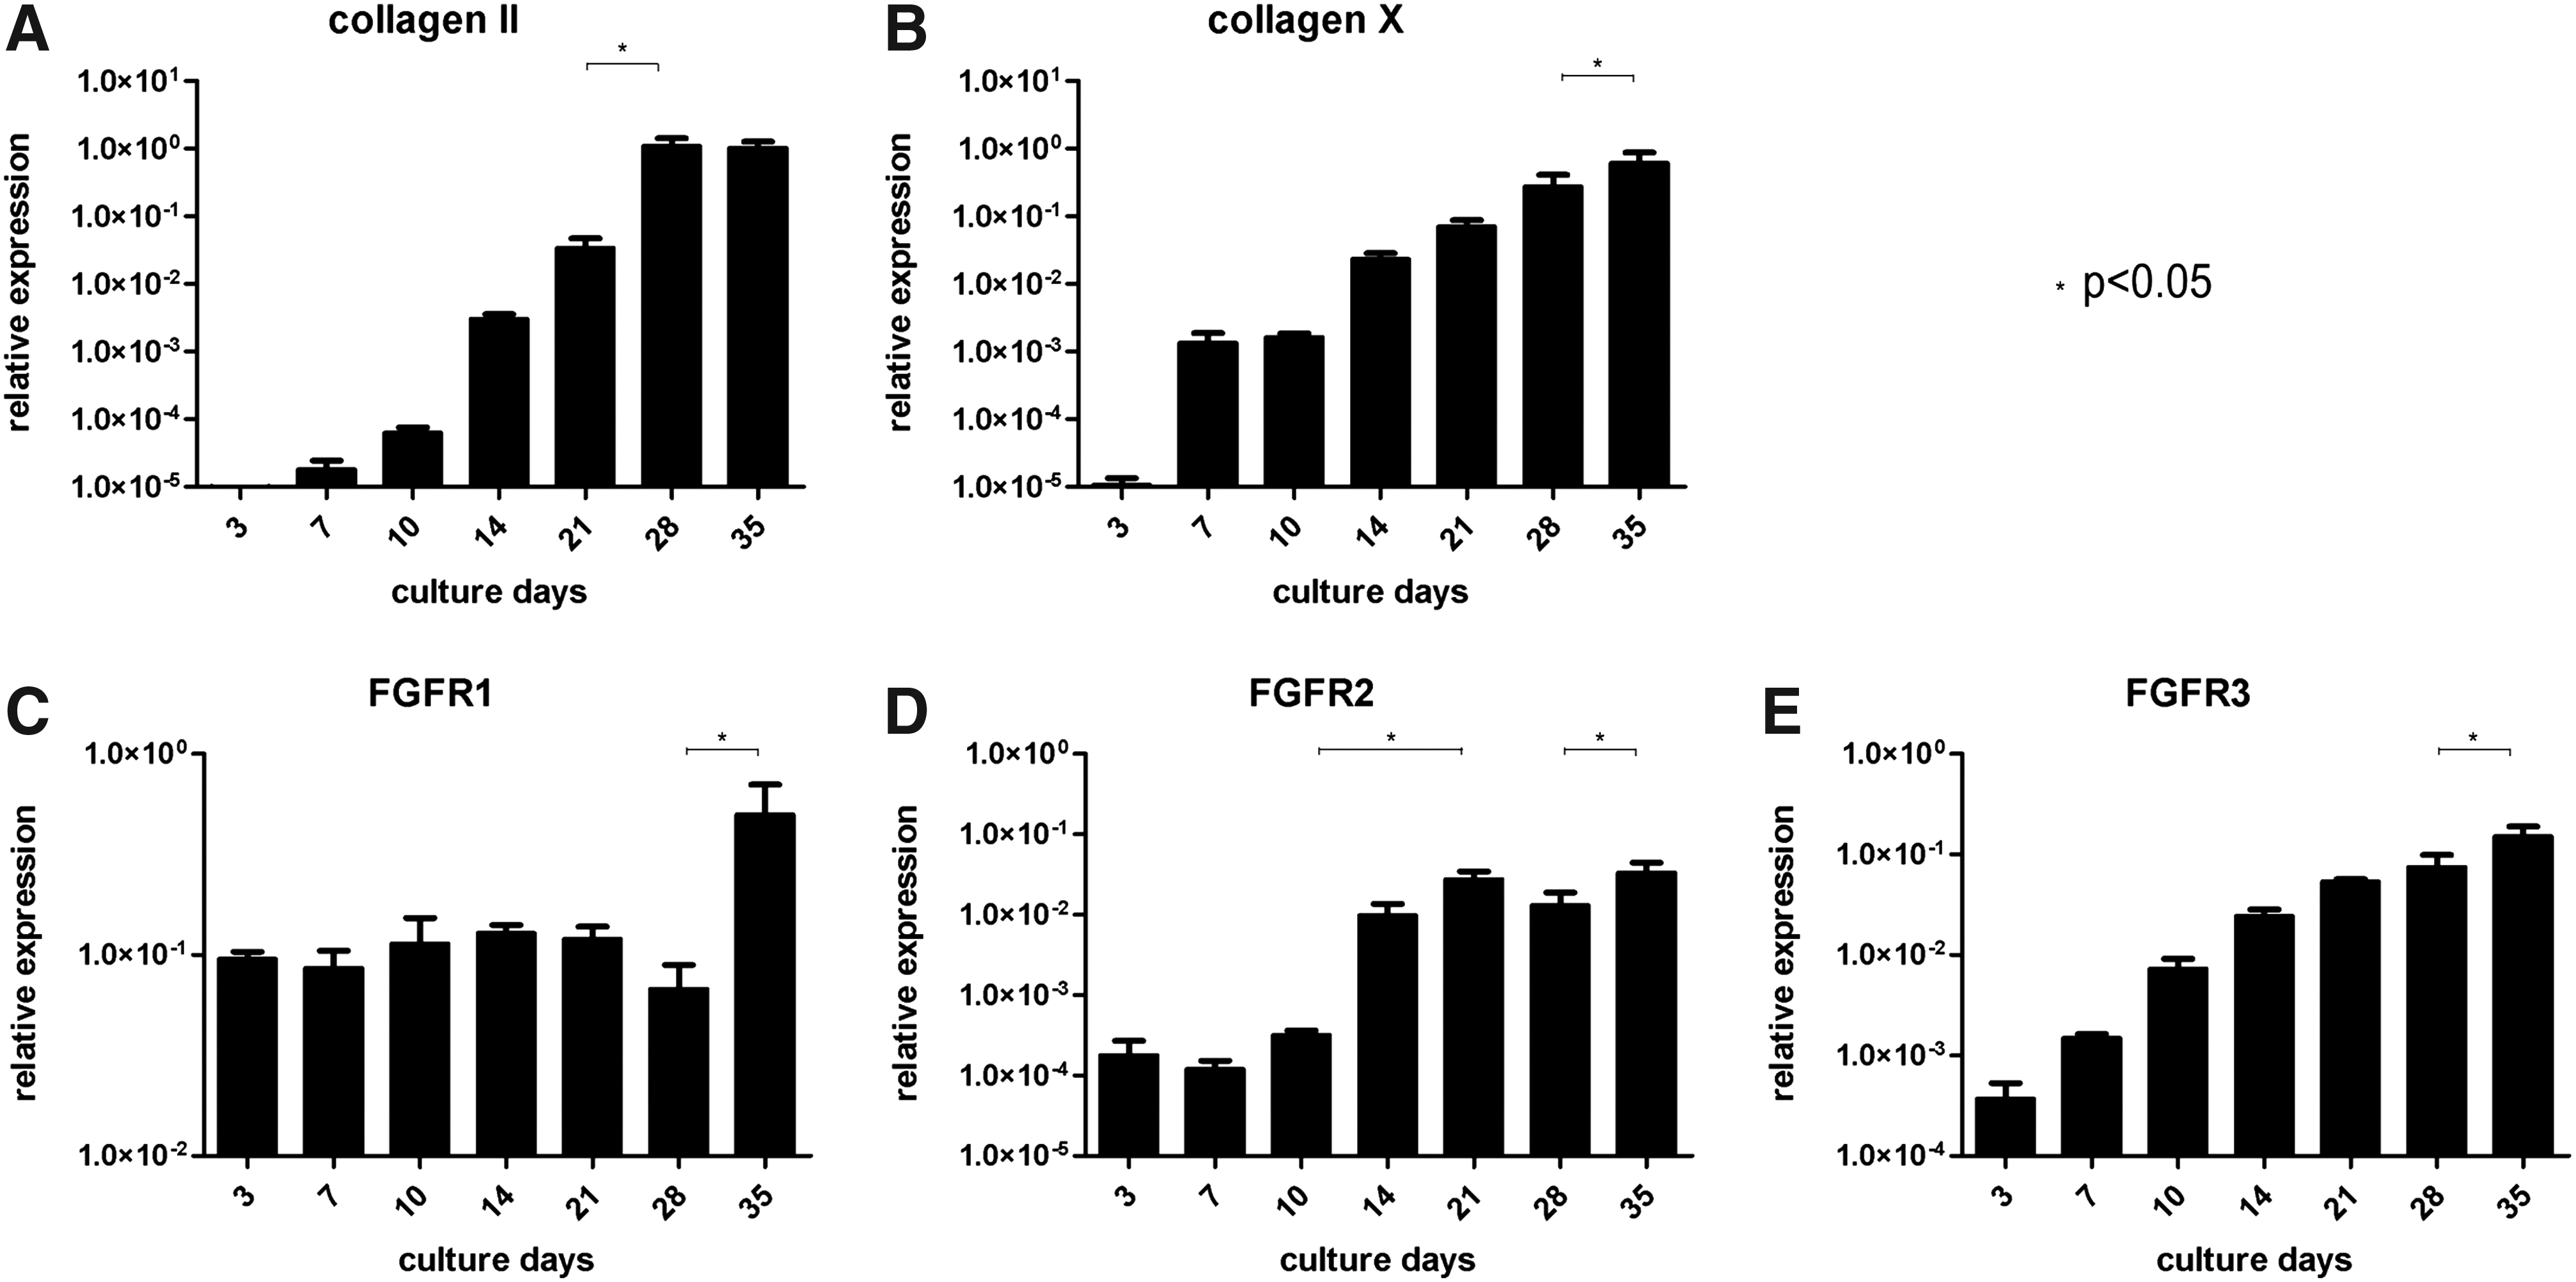
Gene expression analysis of chondrogenically differentiated MSCs. Graphs show relative mRNA expression (determined by reverse transcription (RT)-polymerase chain reaction) during culture of pellets of donor 1 (homogenous cartilage formation) (
N-cadherin was clearly expressed in the center of the pellets of all donors on days 7–10, indicating condensation stage. N-cadherin expression decreased before collagen II was produced, and increased again mildly during hypertrophy (Fig. 3A–D). In donor 1, collagen II was observed on day 21 in the periphery of the pellet, whereas collagen X was still absent (Fig. 3F, I). In pellets of two other donors, a similar interval was seen between collagen II and X production, whereas one donor demonstrated the appearance of collagen X together with collagen II at day 21.

Immunohistochemistry: markers of development in chondrogenically differentiated MSCs. Red staining demonstrates positivity for the antibody. Pellets of donor 1 are shown because of homogenous chondrogenesis in these pellets. (
Concluding, one could say that the pellets were in the condensation stage on days 7–10 of culture (Fig. 3A, D), whereas the cells after 35 days of culture had terminally differentiated to become hypertrophic chondrocytes (Fig. 3C, G, J). Although on day 21 some MSCs had already attained a chondrogenic differentiation, without being hypertrophic (Fig. 3B, F, I), the small interval between collagen II and collagen X production, and the increasing collagen X gene expression suggest that these cells were undergoing rapid terminal differentiation.
FGFR expression
During expansion, before differentiation in pellet cultures, all MSCs stained brightly positive for FGFR1. No positive staining was seen for FGFR3 and only a very weak staining for FGFR2 (Fig. 4). This expression pattern during expansion was not influenced by adding FGF2 to the culture medium (data not shown).
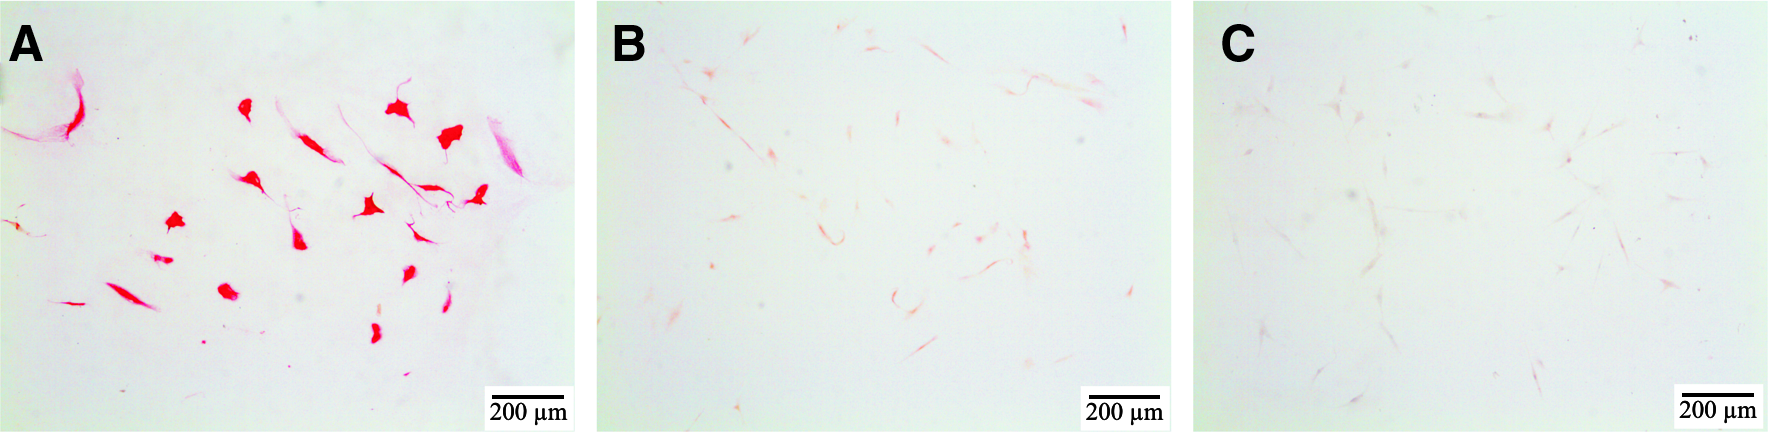
FGFR expression in MSCs during expansion. Red staining demonstrates positivity for the antibody. Cells are not counterstained. During expansion FGFR1 (
As MSCs of donor 1 formed complete cartilaginous pellets, FGFR expression was scored semiquantitatively in these pellets. The response of the MSCs from the other donors was comparable to those of donor 1 within the cartilaginous regions.
Condensation
FGFR1 was clearly expressed in pellets of donor 1 at day 3, but was followed by a significant decrease during the condensation stage, days 7–10 (Fig. 5A, D). In contrast, FGFR2 showed a significant peak in expression in the center of the pellets at day 10 (Fig. 5E, H). The area of positive staining for FGFR2 overlapped the staining for N-cadherin, the marker for mesenchymal condensation (Figs. 3A and 5E). Staining for FGFR3 was also somewhat positive in this condensing center of the pellet (Fig. 5I), but the difference in scores was not statistically significant (Fig. 5L). The N-cadherin–positive center stained clearly positive for FGFR2 in pellets of all other donors as well, and vaguely positive for FGFR3 in two of the three remaining donors. FGFR1 staining was almost negative in this area. Thus, during the condensation stage, FGFR2 in particular showed a peak in the expression in chondrogenically differentiating MSCs.
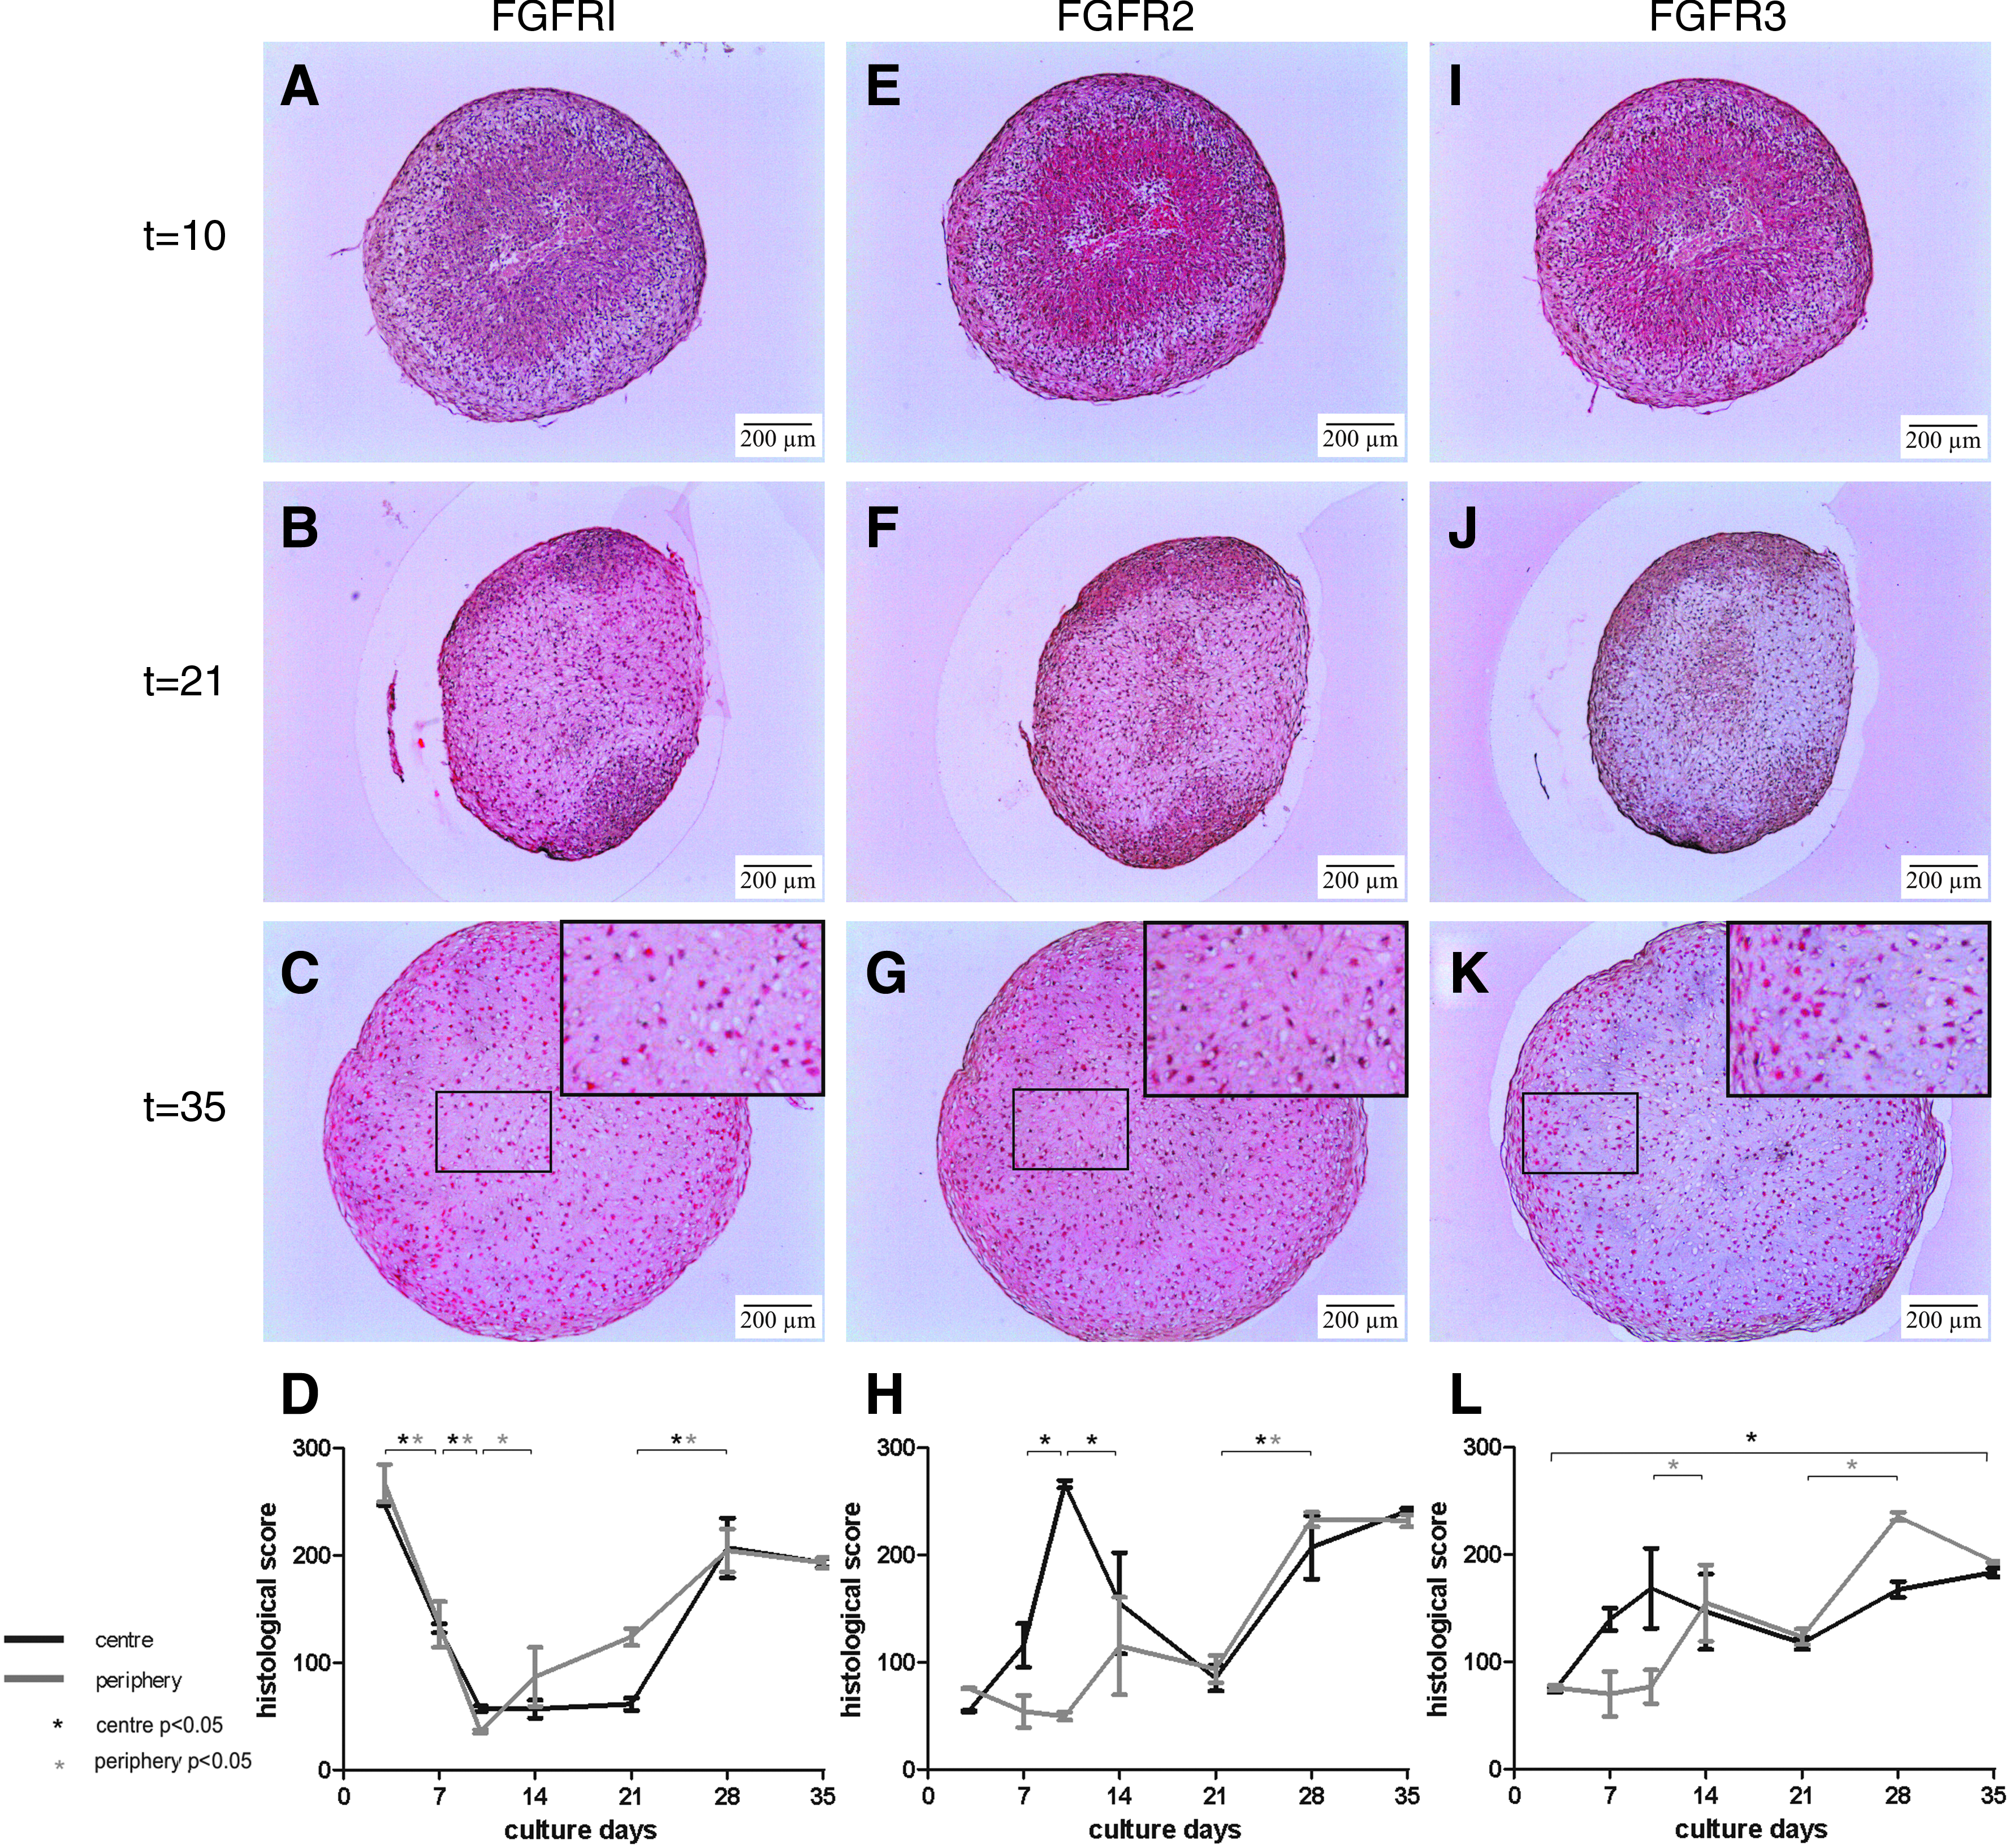
Immunohistochemistry: FGFR1–3 expression in chondrogenically differentiated MSCs. Red staining demonstrates positivity for the antibody. Pellets of donor 1 are shown. (
Differentiation
Increased positive staining for FGFR1 was seen in donor 1 on day 21 compared with previous time point, in the area that overlapped with the staining for collagen II (Figs. 3F and 5B). No collagen X was seen at that time point (Fig. 3I). Staining for FGFR2 and FGFR3 was not abundant and similar to previous days (Fig. 5F, J). In the pellets of the other donors where a small interval between appearance of collagen II and X was also seen, none of the FGFRs were evidently positive in the area where collagen II was present.
Hypertrophy
FGFR1 and FGFR2 stained brightly positive throughout pellets of donor 1 at days 28–35 (Fig. 5C, D, G, H). Staining for FGFR3 was less intense but, in general, expression of FGFR3 increased throughout the culture period (Fig. 5K, L). In pellets of donors with less homogeneous chondrogenic differentiation, a positive staining for FGFR1–3 overlapped the area that stained positive for collagen II and X (Fig. 6). Cells not producing collagen II or X were almost negative for FGFR1–3. Therefore, all FGFRs were specifically expressed by hypertrophic MSCs.
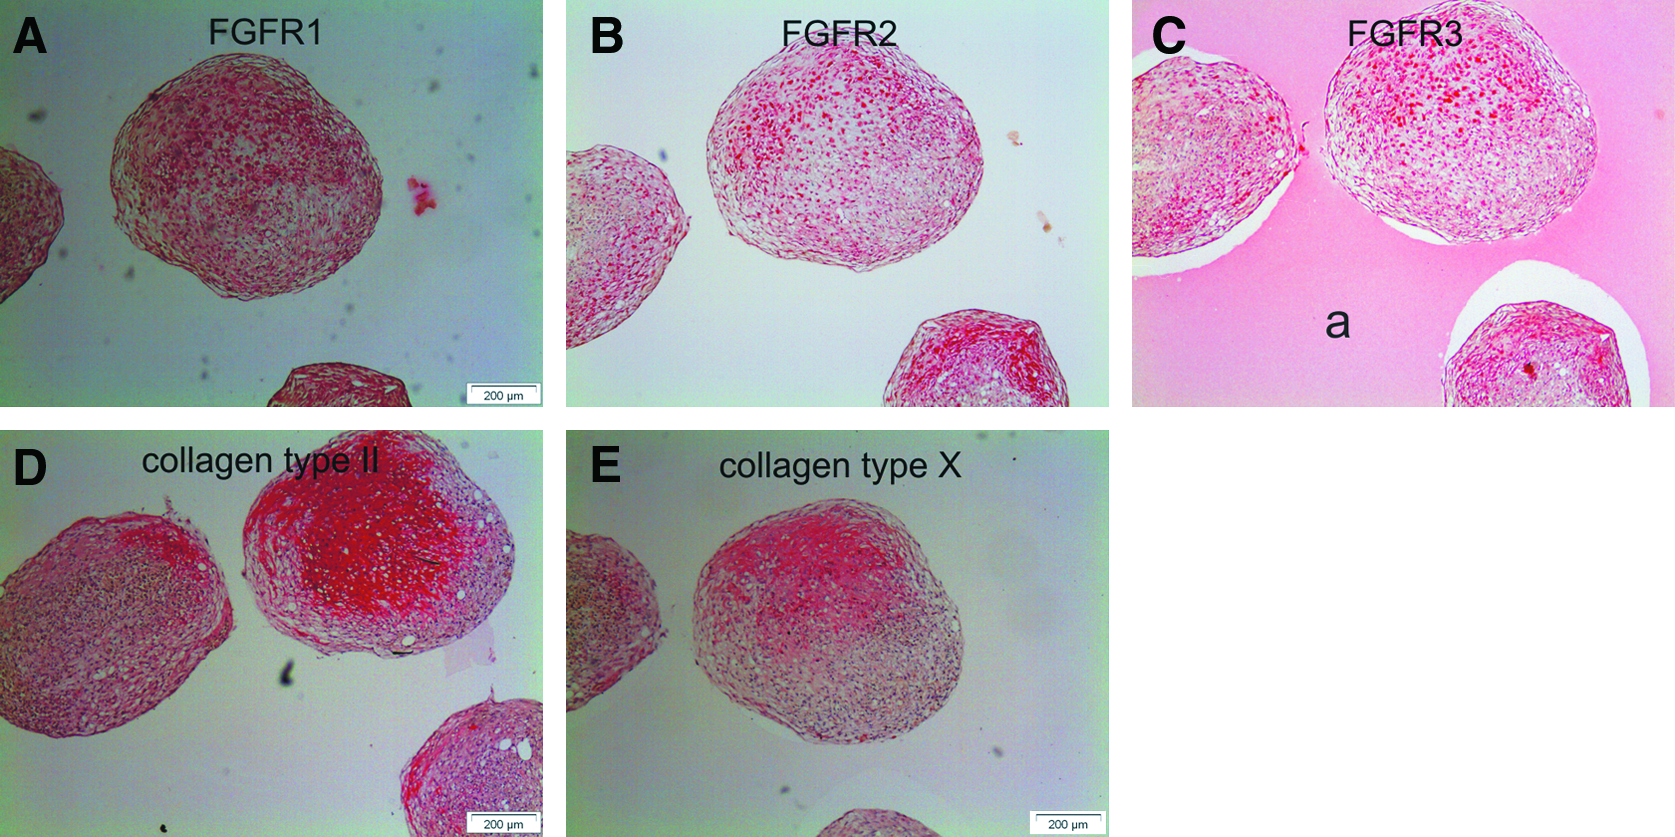
Immunohistochemistry of FGFRs in hypertrophic cartilage of pellets with partial cartilaginous morphology. A typical example of pellets from donor 2 with limited cartilage formation is presented to demonstrate spatial differences in immunohistochemical staining. FGFR1 (
Gene expression
On transcriptional level, FGFR1 was constantly expressed abundantly during the first 28 days of culture, and increased from day 28 till day 35. The reduced expression during condensation (days 7–10) and the increased expression from day 21 seen on histology was therefore not observed on a gene expression level (Fig. 2C). FGFR2 mRNA levels were only minimal at the start of the culture period and significantly increased over time (Fig. 2D). Thus, the peak during condensation followed by a decrease during differentiation, seen on protein level, was not seen on mRNA level. This was also the case for mRNA levels of FGFR3 (Fig. 2E).
Control cell population
Pellets cultured in the medium without dexamethasone were used as a control cell population to assure that the observed FGFR expression pattern is related to chondrogenic differentiation. No collagen II was produced in these pellets after 35 days of culture. FGFR1 was expressed at day 3, as was seen during expansion in monolayer culture and in the chondrogenically differentiating pellets at day 3. At all subsequent time points FGFR1 was hardly expressed. FGFR2 and FGFR3 were scarcely expressed at all time points in these pellets.
Modulation of FGF signaling
Because FGFR1 and FGFR2 in particular seemed to have pronounced stage-specific expression patterns in in vitro chondrogenic differentiation of MSCs, we studied the possibility to modulate chondrogenesis by stimulation with FGF2, which has a higher binding affinity for FGFR1, 18 and FGF9, which has a higher binding affinity for FGFR2. 19 FGF was added either throughout the culture (days 0–35), early in the differentiation process (days 3–14), or during a later stage of differentiation (days 21–35).
FGF addition throughout culture
Pellets treated with FGF2 or FGF9 contained significantly less GAG at day 35 than control pellets cultured in the chondrogenic medium without addition of FGF (Fig. 7A). No significant difference was seen in amount of DNA (data not shown). This was confirmed by histology. Control pellets from both donors demonstrated a strong positive staining for collagen II and X at day 35. Addition of FGF2 throughout the culture period resulted in a weaker staining that was limited to a smaller area. Only a very weak staining was seen in pellets treated with FGF9 (data not shown).
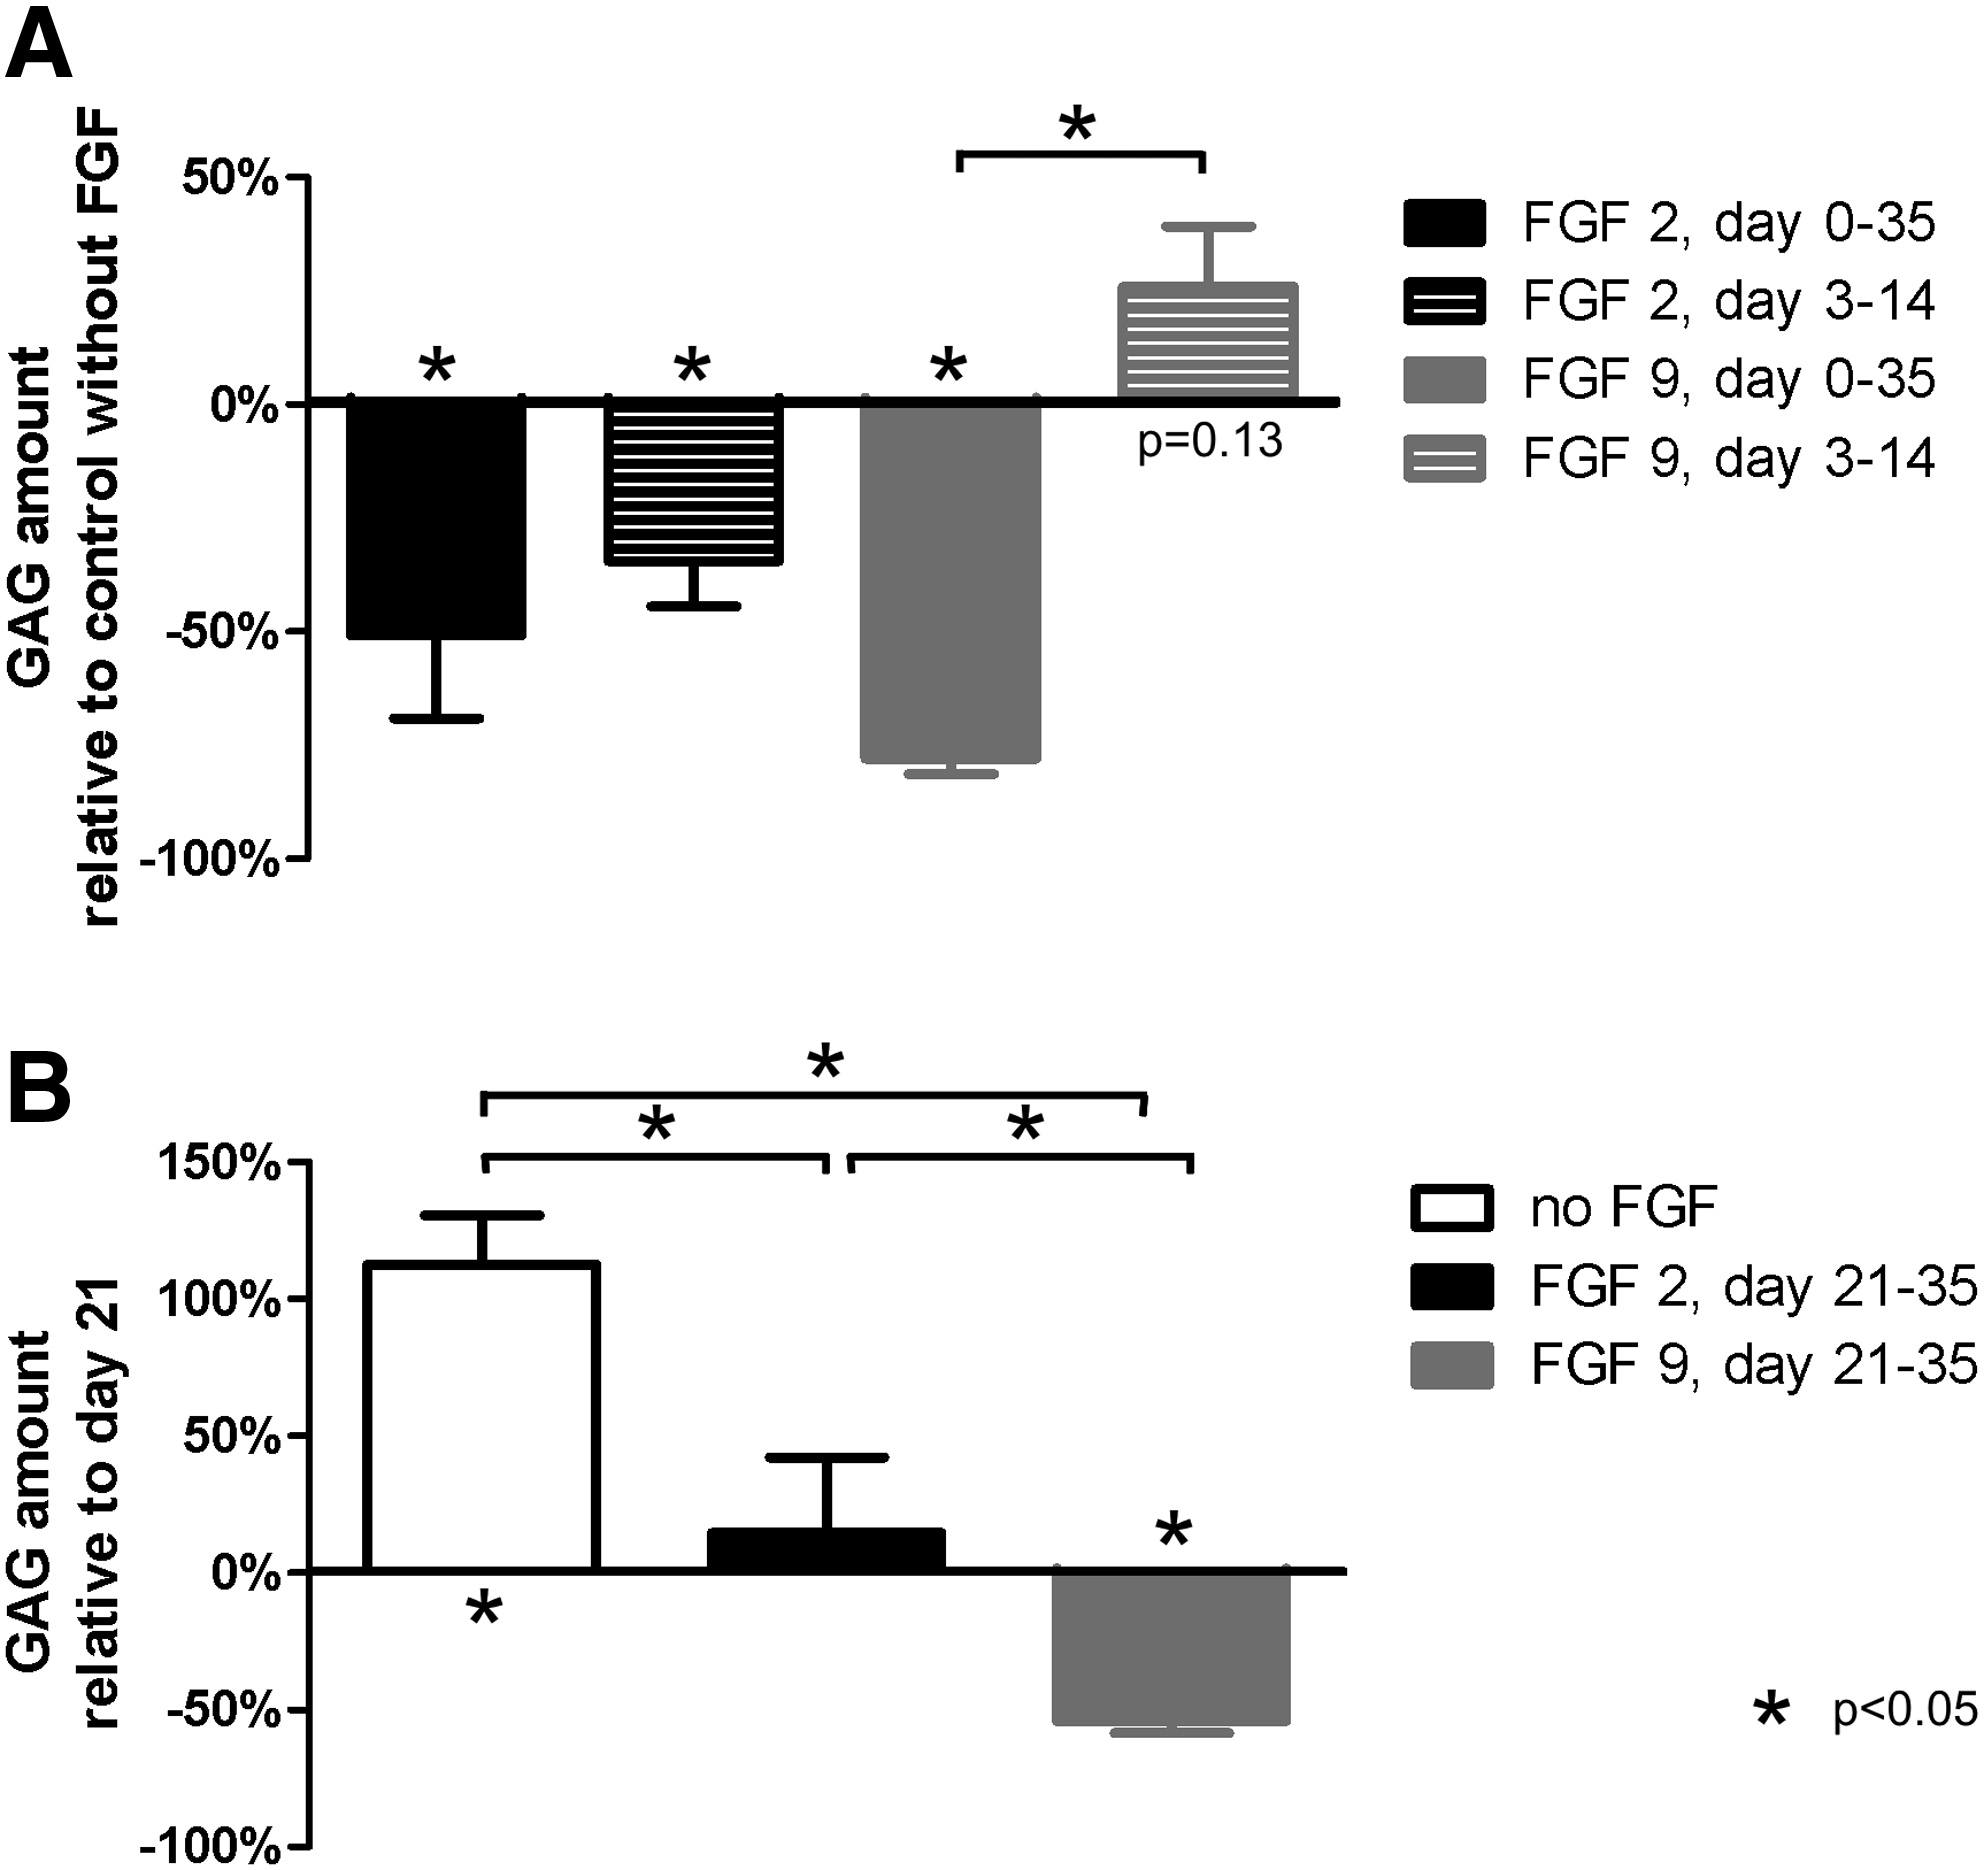
Modulation of chondrogenic differentiation of MSCs with FGF. (
FGF addition during early differentiation
Pellets treated with FGF2 from day 3 to day 14 contained a lower amount of GAG at day 35 than control pellets (Fig. 7A). Conversely, a trend toward a higher GAG amount was seen when FGF9 was added from day 3 to day 14 (p = 0.13). The amount of DNA did not significantly differ (data not shown). Although immunohistochemical staining for collagen II and X was observed in all pellets, no clear difference in between the conditions could be observed (data not shown).
FGF addition during late differentiation
In the control condition, new GAG was deposited from day 21 to day 35 (Fig. 7B). Addition of FGF2 from day 21 to day 35 prevented the accumulation of new GAG (Fig. 7B). Addition of FGF9 resulted in a two-fold reduction of the matrix (Fig. 7B), indicating that the addition of FGF9 during late differentiation stimulated matrix resorption over matrix production. These data were confirmed by histology. At day 21, before addition of FGF, collagen II and collagen X were already clearly expressed. An increased staining was seen from day 21 to day 35 in control pellets. When FGF2 was added from day 21 to day 35, the stained area for collagen II and X was somewhat smaller than in the control pellets at day 35. A very weak staining was seen in pellets treated with FGF9.
Discussion
This study demonstrates that FGFR1–3 are expressed in a stage-dependent pattern both in chondrogenic differentiation of adult MSCs in vitro and in embryonic limb development.
To our knowledge, this study is the first to directly relate embryonic chondrogenesis to in vitro differentiation of MSCs in pellet culture. In both models three stages can be discriminated, condensation, differentiation, and hypertrophy, respectively, characterized in this article by N-cadherin, collagen II, and collagen X expression. However, this study demonstrates that there is a difference in these models when the relative length of these stages is considered. For example, while in embryonic development a differentiation stage is clearly discernable, in in vitro chondrogenic pellet cultures of MSCs almost no interval exists between production of collagen II and X. We have related the expression of different FGFR subtypes to the differentiation stage in both models. In embryonic endochondral ossification, the mesenchymal condensation expressed FGFR2 and FGFR3. No FGFRs were expressed in differentiating and mature hyaline chondrocytes, whereas all FGFRs were expressed during hypertrophy. In comparison, in in vitro differentiating MSCs FGFR2 and, to a lower extent, FGFR3 were clearly expressed during condensation days 7–10. During differentiation, expression of FGFR2 and FGFR3 was low, but FGFR1 was already expressed by cells producing collagen II before collagen X was observed. When collagen X was expressed, during hypertrophy of MSCs, all FGFRs were expressed. This relation between chondrogenic differentiation stages and FGFR expression was further strengthened by low expression of all FGFRs in pellets that did not undergo chondrogenic differentiation due to withdrawal of dexamethasone.
When trying to relate the in vitro differentiation of MSCs to embryonic chondrogenesis, it is important to take into account the fundamental differences in these models. Most importantly, chondrogenically differentiating cells in the embryonic limb bud get signals from other cell types surrounding these cells, such as in the future perichondrium and the loose mesenchyme. The signals to these cells are hugely complex and not only involve growth factors such as TGF-β and FGF, but also include pathways such as BMP, IHh, PTHrP, Wnt/β-catenin, and many more. 20 In comparison, in pellet cultures of MSCs only one cell population is present, and the exogenous signals provided to these cells are simplified compared with the signaling in embryonic development. However, studying embryonic chondrogenesis may shed light into the possibilities to enhance the exogenous signal to better control chondrogenic differentiation. In this article, we have focused on FGF signaling and the possibility to modulate chondrogenesis stage specifically rather than adding a growth factor throughout the culture period.
FGFR expression in embryonic limb development has been studied before but only at mRNA level.10–12,21,22 In differentiating MSCs FGFR expression has not been studied extensively. There is only one recently published study that demonstrated expression of all FGFRs in terminally differentiated MSCs, 23 confirming the data in the presented study. Our study added information on FGFR expression during the entire culture time.
A potential drawback of our study is that we compared murine embryonic development to the differentiation of human MSCs. We used primary antibodies cross-reacting with antigens of both species to minimize this problem. We did not perform PCR during embryonic chondrogenesis; therefore, it was not possible to directly relate the murine and the human model at mRNA level. Previous studies showed similar FGFR expression patterns in murine and human development at mRNA level.10–12,21,22 Moreover, the MSCs we used in our experiment were derived from patients suffering hip osteoarthritis. Whether this may have an influence on the chondrogenic differentiation of these cells is unclear, as data regarding this subject are contradictory.24–26
Our study on human MSCs demonstrated a difference in FGFR expression between mRNA level and protein level. This could be due to posttranscriptional regulation. This may also explain why our results at protein level regarding FGFR expression in murine embryonic endochondral ossification differ from previous results at mRNA level. Another explanation for these differences could be that many different isoforms exist. For immunohistochemistry we used antibodies directed to all isoforms. Although we used a single PCR assay to detect all currently known isoforms of FGFR2 and FGFR3, it was not possible to design a single set of primers capable of detecting all isoforms of FGFR1. Our PCR primer set for FGFR1 was developed to detect five of the seven currently known splice variants, including the so-called isoforms IIIb and IIIc, known to play important roles in limb development. 27 In addition, to minimize the limitations of immunohistochemistry, we had a consistent, methodical protocol to process and stain the specimens. We, therefore, feel confident that the differences in FGFR expression patterns observed between mRNA level and protein level in the in vitro model are not subject to the experimental procedures. As a consequence, since our data on protein level on FGFR expression in embryonic endochondral ossification differ from results from previous studies on mRNA level, further experiments dealing with FGF signaling in the developing skeleton should preferentially be based on functional protein expression of the receptors.
We demonstrated that FGFR1 was expressed at the protein level in expanding MSCs and in early outgrowth of the limb bud, while it was downregulated during condensation. FGF2 has a strong binding affinity for this subtype FGF receptor. When it was added from day 3 to day 14, when FGFR1 was still expressed, it inhibited cartilage differentiation. Therefore, it seems likely that FGFR1 plays a role in MSC proliferation and retaining pluripotency, and not in (early) chondrogenic differentiation. This is supported by the fact that conditional inactivation of FGFR1 identified it as a positive regulator of limb bud outgrowth. 28 FGFR2 expression showed a peak during condensation, both in embryology and adult MSC differentiation. Moreover, in MSC pellets its staining overlapped with the staining for N-cadherin. FGF9, which has a high binding affinity for FGFR2, resulted in a somewhat increased matrix production when added during early differentiation. This suggests that FGFR2 plays a significant role in early chondrogenesis. The importance of FGFR2 during early chondrogenesis is supported by a previous study indicating FGFR2 as a positive regulator in chondrogenesis, by influencing the size of the cartilage templates and the onset of the differentiation. 29 The severe syndactyly seen in Apert syndrome, caused by an FGFR2 gain-of-function mutation, supports this view. 30
Since all FGFRs are expressed in hypertrophic chondrocytes in endochondral ossification, while no FGFRs are expressed in hyaline articular chondrocytes, downregulation of FGFRs may well be important for stable chondrocyte differentiation and FGF signaling may prove to be a tool to better control in vitro chondrogenesis of MSCs. This is supported by our finding that addition of FGF during hypertrophic differentiation is detrimental for cartilage–matrix production. In our in vitro study, MSCs undergoing differentiation displayed only a minimal interval between collagen II and collagen X production, indicating rapid hypertrophic differentiation of these cells. A clear decrease in FGFR3 expression did not take place during differentiation of MSCs in pellet culture. Therefore, the lack of FGFR3 downregulation could play a role in rapid progression to hypertrophy in pellet culture of MSCs. Moreover, since FGFR1 was the first receptor upregulated in the cells producing a cartilage-like matrix, it may also play an important role in the early terminal, hypertrophic differentiation of MSCs in pellet culture. Although all receptors were expressed during hypertrophy, FGF2 and FGF9 had differential effects when added at days 21–35. While FGF2 inhibited further matrix deposition, FGF9 increased matrix resorption. This suggests that the FGFRs have specific effects, even during hypertrophy when they are all expressed. Further research is indicated to study the potential to modulate FGF signaling to create stable, hyaline cartilage. In this respect it may be important to realize that during embryonic limb development, the cells differentiating toward hyaline, articular cartilage are most likely derived from a distinct progenitor cell population than the cells differentiating toward hypertrophic cartilage in the future bony skeletal elements.31,32
We have demonstrated not only that different stages can be discerned in chondrogenic differentiation, but also that the effect of a growth factor depends on the stage in which it is added in the medium. This is in accordance with embryonic development. While FGF9 has an inhibitory effect when added throughout culture, or during hypertrophy, it does not have a negative effect when given during early differentiation and might even be stimulatory when given at the right time interval. Therefore, a more specific stimulation of FGFR2 activation during condensation may be interesting for cartilage tissue engineering. Moreover, since the effects of growth factors and modulation of intracellular signaling are mostly studied throughout culture, more attention to stage-specific effects may be warranted.
In conclusion, we have demonstrated that in vitro differentiation of MSCs takes place in stages similar to those in embryonic endochondral ossification. A mesenchymal condensation (indicated by N-cadherin) is followed by chondrogenic differentiation (indicated by collagen II), and hypertrophy (indicated by collagen X). FGFRs are differentially expressed in these stages, both in chondrogenically differentiating MSC in vitro and in embryonic endochondral ossification, and first data indicate that modulation with FGF subtypes during different stages affects the amount of cartilage formed by MSCs. A better knowledge of, and control over, FGF signaling may lead to advances in cartilage tissue engineering and regenerative medicine.
Footnotes
Acknowledgments
The authors would like to thank Carola Feijt on her work to optimize the primers for FGFR1–3, Inez Slagt for her help on developing a scoring system for immunohistochemistry, Martine de Herdt and Laura Veder for setting up a protocol for immunohistochemistry for N-cadherin, and Jeanine Hendriks for a valuable discussion. This research was financially supported by the Dutch Program for Tissue Engineering.
Disclosure Statement
No competing financial interests exist.