
Abstract
Administration of culture-expanded mesenchymal stem cells (MSCs) has been sought for regeneration of various damaged tissues/organs in clinical situations. Liquid suspensions of MSCs have either been directly injected into organs or generally infused. In this study, we focused on the viability and differentiation of MSCs after suspension in phosphate-buffered saline. When the MSCs were treated with epigallocatechin gallate, which is purified from green tea catechin, the MSCs showed high viability as well as osteogenic differentiation capability even while suspended in phosphate-buffered saline for 4 days at 4°C. In contrast, nontreated MSCs showed low viability and showed hardly any differentiation. The rate of proliferation of the treated MSCs was much higher than that of the nontreated MSCs. These results indicate the usefulness of epigallocatechin gallate treatment for fabrication of ready-to-use cellular products of MSC suspension.
Introduction
Because the MSCs are multipotent cells, they have also been used for other treatments such as cardiac or vascular disease because of their capability of differentiation toward cardiomyocytes and vascular endothelial cells.6,7 It has also been reported that MSCs could inhibit the proliferation of activated T cells and the formation of cytotoxic T cells. Based on the findings, MSCs have recently been used for treatments of graft-versus-host disease. 8 MSCs are also used for the treatment of genetic bone diseases9–11 with the MSCs' capability of osteogenic differentiation. All these cases were treated by injecting MSCs without the use of biomaterials, that is, the MSCs were directly injected into the damaged organ, such as an infarcted heart, or generally administered by venous infusion. These therapeutic approaches require a suspension of MSCs for injection. In regenerative medicine, we should consider the safety of the final cellular products (in the above cases, the products are MSC suspensions). The safety issue includes absence of bacterial, fungal, and viral contamination as well as undetectable levels of endotoxins or no endotoxins. Although elucidation of the absence of contamination is time consuming and some number of days might be required to obtain the final results, the prolonged viability and differentiation capability of the cell products as ready-to-use are mandatory. Transportation of the products must also be taken into account. Usually, cells are cultured in a facility called a cell processing center, and cultured cells are transported from there to a hospital operating room. In some instances, the hospital is located far from the cell processing center and thus transportation can take a long time.
We have previously reported that the suspension of human MSCs in phosphate-buffered saline (PBS; Invitrogen, Carlsbad, CA) at 4°C could maintain relatively high levels of viability and osteogenic ability. 12 However, after 24 h, this is significantly reduced. In this study, we focused on prolonging MSC viability and differentiation by treating them with epigallocatechin gallate (EGCG), which is purified from green tea catechin.
Materials and Methods
Cell preparation and culture for storage
After we obtained informed consent from three patients (34-year-old male, 30-year-old male, and 29-year-old female), bone marrow cells were harvested from their iliac crest by needle aspiration. The cells were cultured in 75-cm2 flasks (Becton Dickinson, Lakes, NJ) with a basal medium that consisted of minimum essential medium α (α-MEM) (Invitrogen, Carlsbad, CA) supplemented with 15% fetal bovine serum (JRH Biosciences, Leneka, KS) and antibiotics (100 U/mL penicillin G, 100 g/mL streptomycin sulfate, and 0.25 g/mL amphotericin B; Nacalai Tesque, Kyoto, Japan). The details were as previously described. After about 10 days of culture, floating cells were eliminated by medium exchange and the adherent cells became subconfluent. The adherent cells were detached from the flasks with a trypsin solution and further cultured for several days to expand the number of cells. The culture-expanded cells were detached from the flasks and cryopreserved until use. The cryopreserved cells (5 × 10⁵) were thawed rapidly and put into 75-cm2 flasks with the basal medium containing 15% fetal bovine serum and antibiotics, and then cultured. The culture medium was changed two or three times a week. The cells were harvested using 0.05% trypsin/0.53 mM ethylenediaminetetraacetic acid when they proliferated and grew to near confluency. The trypsinized cells were used for various assays as described below.
Cell culture and cryopreservation were done in accordance with the Ethics Committee of the National Institute of Advanced Industrial Science and Technology.
EGCG treatment
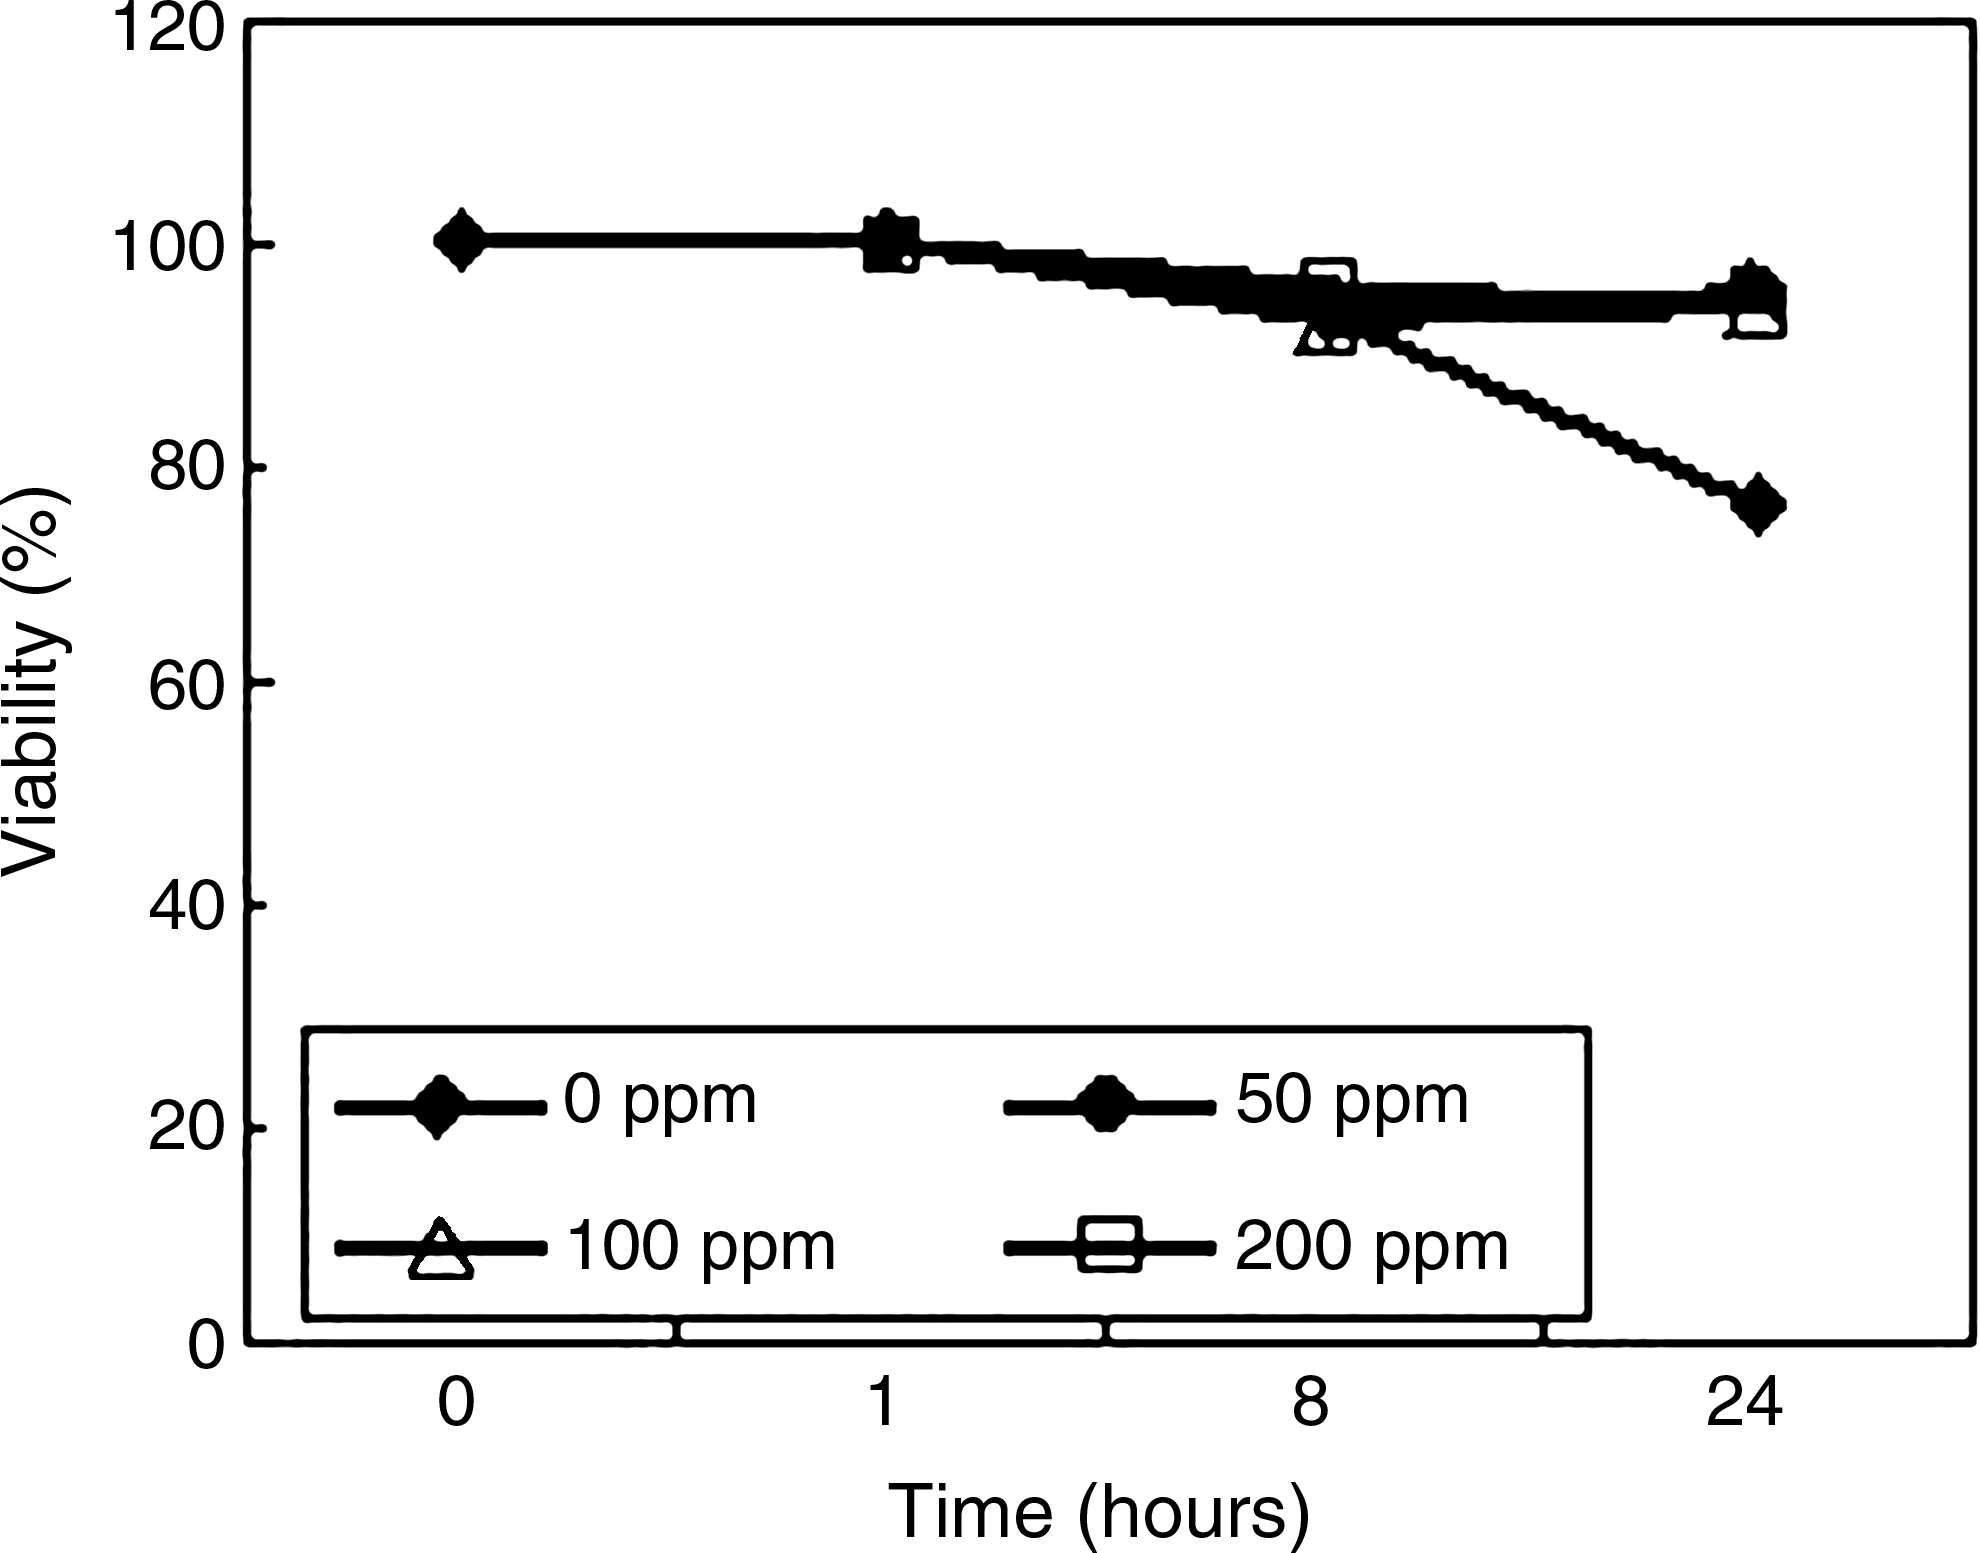
The purified EGCG (TEAVIGO™) was purchased from DSM Nutritional Products (Basel, Switzerland). The purity of the EGCG was more than 95%. The EGCG was dissolved in PBS (Invitrogen) at various concentrations. The EGCG could be dissolved in the culture medium; however, many media contain some chemicals that are not suitable for human use. Therefore, we used clinically available PBS (Fig. 1). To determine the treatment time and dose of EGCG on MSCs, the trypsinized cells were suspended in 15 mL PBS containing 0–200 ppm EGCG for 0–24 h at 4°C and assayed for their viability 12 as described later (Fig. 2). Based on the results, we selected the time and dose as 2 h and 100 ppm (218 M), respectively (Fig. 1).
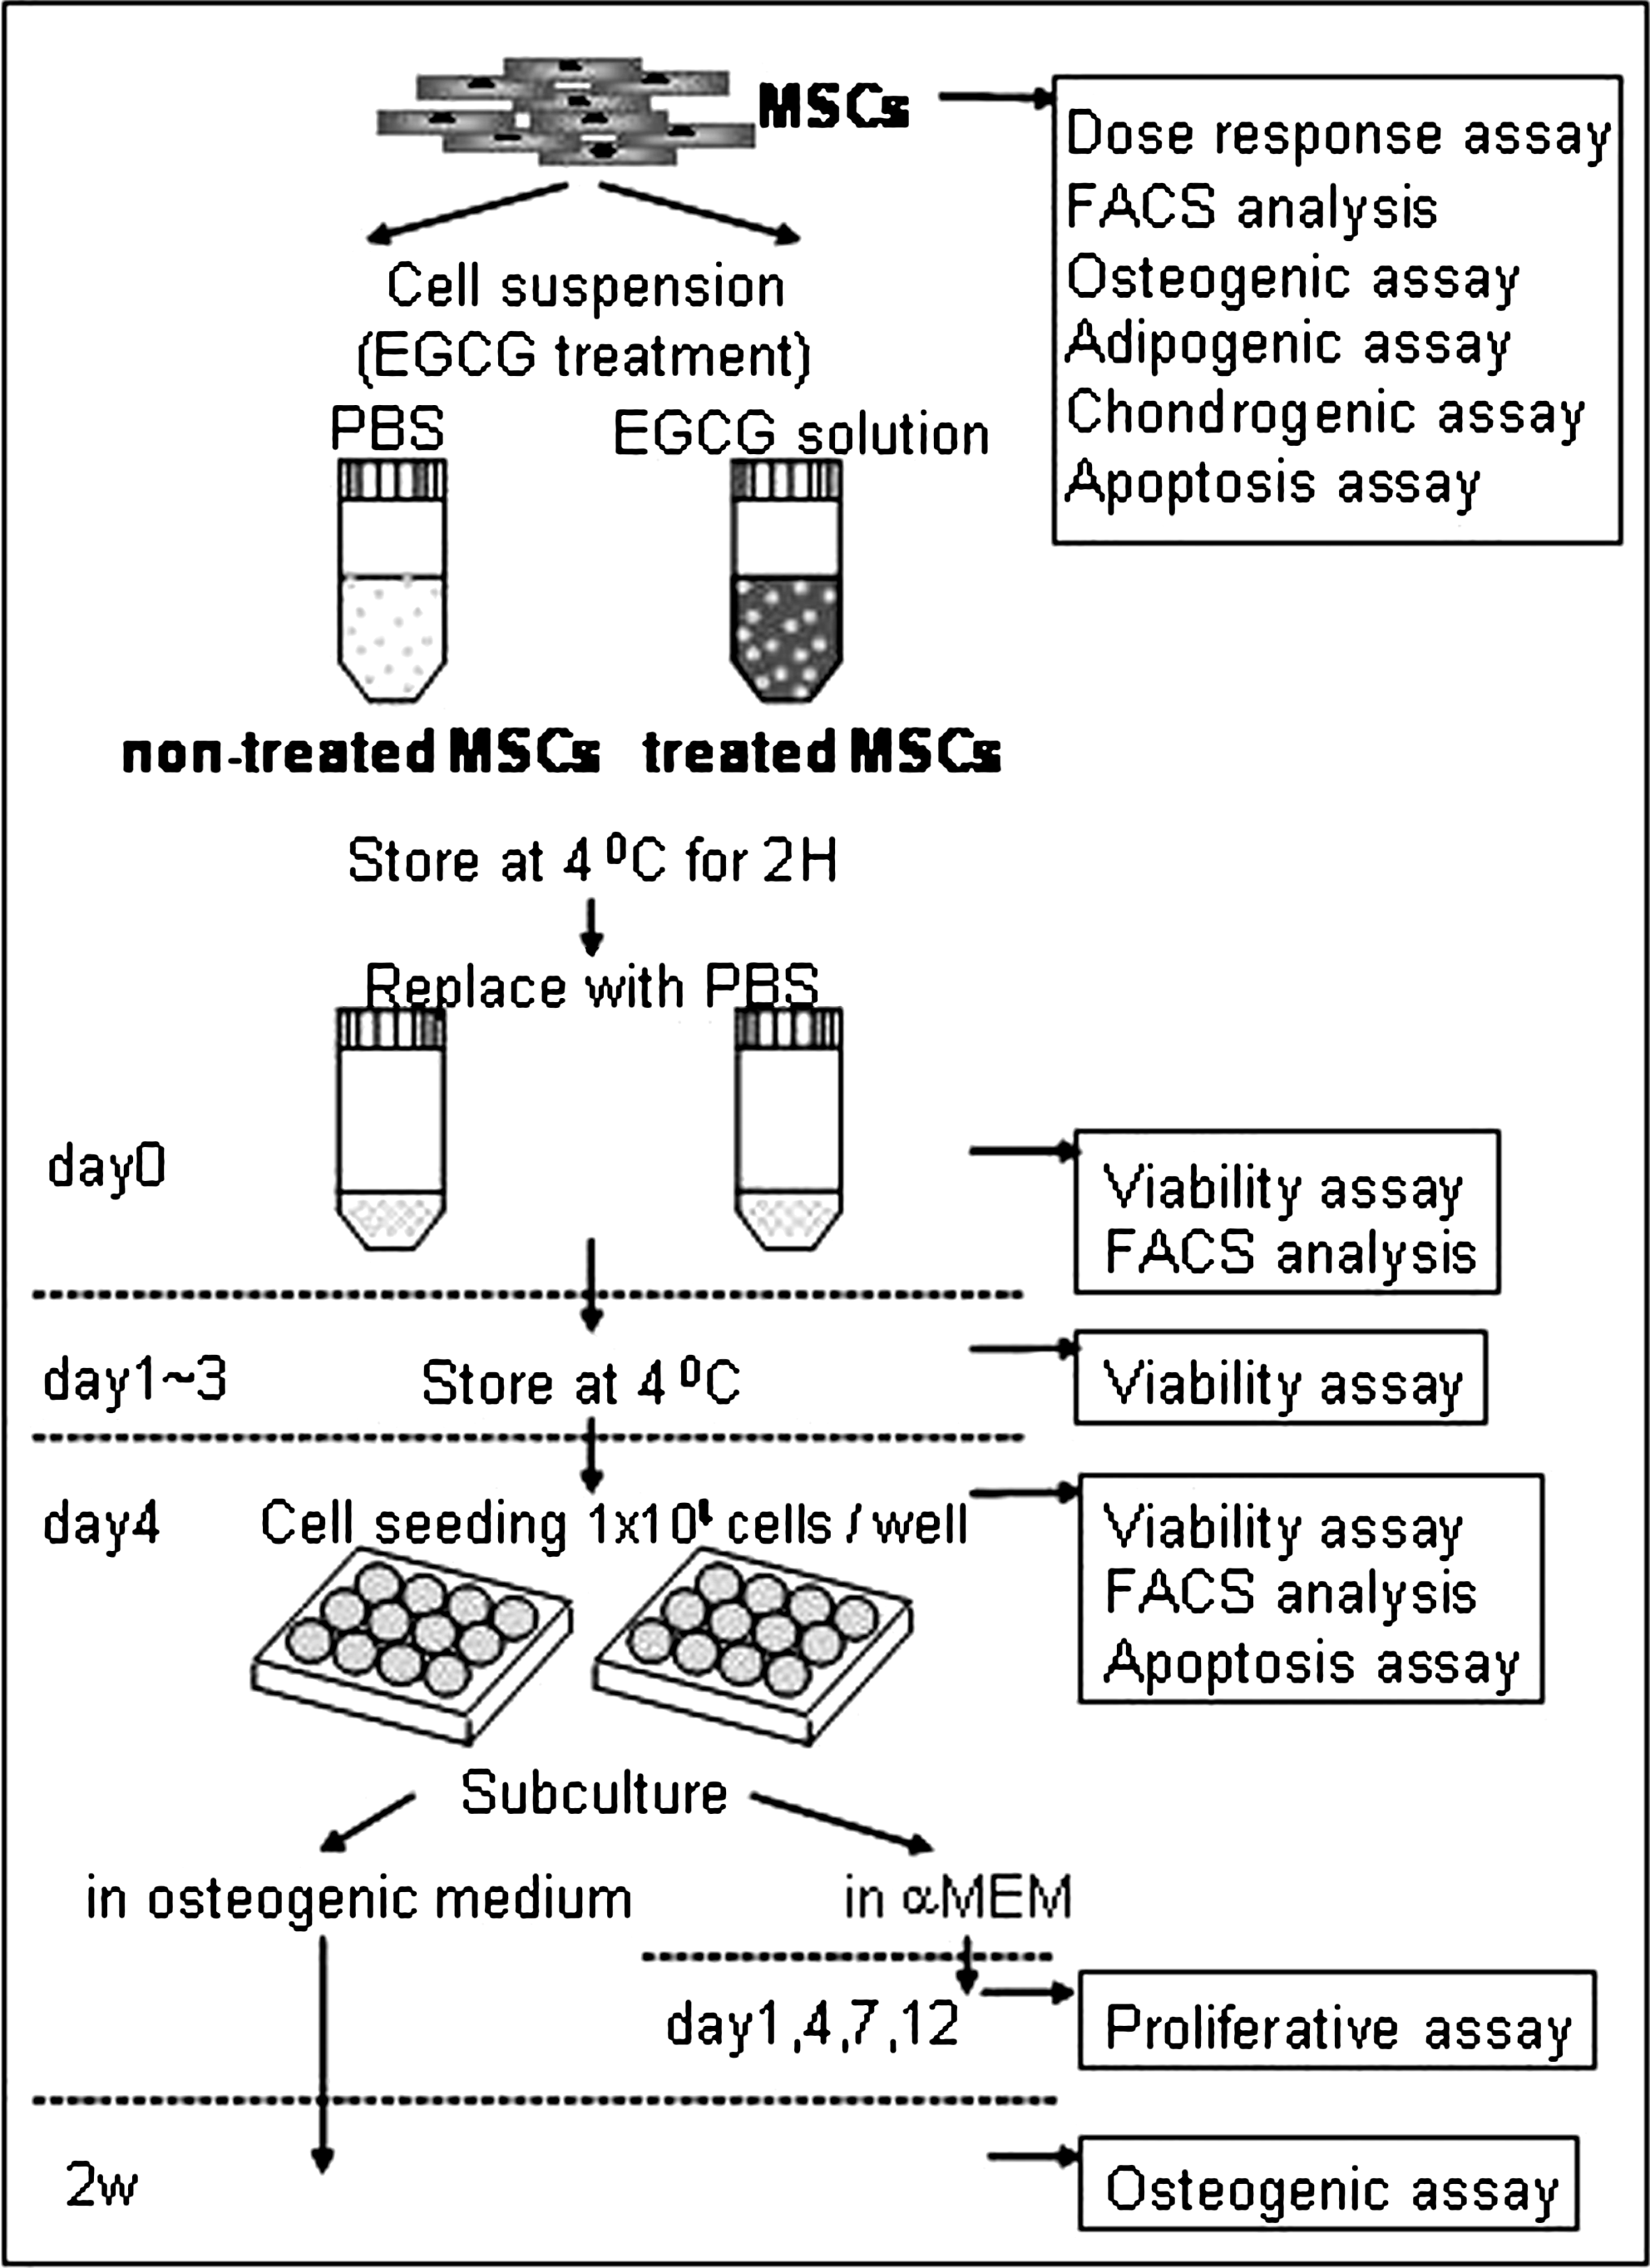
Scheme of the experiment. Cryopreserved mesenchymal stem cells (MSCs) were seeded onto the flask. When the cells proliferated to near confluency, they were collected and used for various assay (dose–response, differentiation, FACS, and apoptosis). The MSCs were then treated with or without epigallocatechin gallate (EGCG) for 2 h at 4°C. After replacing with phosphate-buffered saline (PBS), the cells were subjected to cell surface marker analysis and cell viability assay until day 4. After 4 days storage at 4°C, the cells were seeded onto the culture plates and checked for cell proliferation and osteogenic activity.
Time
Cell characterization
Osteogenic differentiation
The trypsinized cells were seeded onto 12-well plates at 1 × 10⁴ cells per well and cultured in osteogenic medium for 2 weeks. 12 The osteogenic medium contained 10 mM β-glycerophosphate disodium salt (Calbiochem, San Diego, CA), 0.07 mM L-ascorbic acid 2-phosphate magnesium salt n-hydrate (Wako Pure Chemical Industries, Osaka, Japan), and 0.1 M dexamethasone (Dex; Sigma-Aldrich, St. Louis, MO) in the basal medium. As a negative control, cells were cultured in the basal medium supplemented only with 10 mM β-glycerophosphate disodium salt. About 1 μg/mL of calcein (Dojindo Laboratories, Kumamoto, Japan), which is a calcium-binding fluorescent chemical for the detection of extracellular mineralization, was added to the medium during the culture periods. 13 Extracellular mineralization was also observed with a phase-contrast and a fluorescence microscope (Olympus IX70; Olympus Optical, Tokyo, Japan).
Adipogenic differentiation
Three days after the trypsinized cells were seeded onto 12-well plates at 2 × 10⁴ cells per well, the cells were induced to adipogenic differentiation with adipogenic induction medium (minimum essential medium α (α-MEM), 15% fetal bovine serum, 0.5 M Dex, 0.5 mM 3-isobutyl-1-methyl-xanthine, and 0.05 mM indomethacine; Sigma-Aldrich). As a negative control, cells were cultured in the basal medium. Adipogenic differentiation was demonstrated by staining with Oil Red O (Sigma-Aldrich).
Chondrogenic differentiation
The trypsinized cells (3 × 10⁵ cells) were centrifuged at 180 g for 5 min in 15-mL tube. Cells pellets were cultured in chondrogenic differentiation medium (Dulbecco's modified Eagle's medium—high glucose, sodium pyruvate, pyridoxine hydrochloride, 0.1 mM nonessestial amino acids [Invitrogen, Carlsbad, CA]; 50 g/mL L-ascorbic acid, 0.4 mM L-proline, 10−7 M Dex, 1% ITS+1 [Sigma-Aldrich]; and 10 ng/mL recombinant human TGF-β3 [R&D Systems, Minneapolis, MN]) for 3 weeks. 14 Chondrogenic differentiation was demonstrated by staining with Toluidine blue (Merck, Darmstadt, Germany).
Cell surface antigens
The trypsinized cells (1 × 10⁵ cells) were incubated with antibodies in 1.5-mL tubes for 15 min in dark. The cells were washed twice with PBS and analyzed by a FACSCalibur flow cytometer (Becton Dickinson Biosciences, San Jose, CA). The antibodies used in this experiment were CD13-FITC, CD34-FITC, CD44-FITC, CD45-FITC, CD71-FITC, CD90-FITC, CD105-FITC, CD130-FITC, and CD157-FITC (Caltag Laboratories, Burlington, CA; Biocarta, San Diego, CA; Serotec, Oxford, UK; and Medical & Biological Laboratories, Nagoya, Japan) and ALP, Stro-1, and GD2. ALP and Stro-1 were isolated from hybridomas developed by the Developmental Studies Hybridoma Bank, Iowa City, IA. 15 GD2 was kindly gifted by Dr. Jacques Portoukalian, Laboratory of Dermatological Research Edouard Herriot Hospital. EGCG-treated and nontreated MSCs were also used for the FACS analysis.
Cell viability assay
The EGCG was dissolved in PBS at a concentration of 100 ppm (218 M). About 4 × 10⁶ MSCs were suspended in either 15 mL of the EGCG solution or PBS as a control for 2 h at 4°C and then centrifuged at 180 g for 5 min. The supernatant was discarded. The cells were washed with PBS and centrifuged again. The resulting cells in pellet form were suspended in 5 mL PBS. At this point, the cells were termed the day 0 sample (Fig. 1). After this treatment, the cells were stored at 4°C for 4 days.
The viabilities of the EGCG-treated and nontreated control MSCs were assayed at days 0, 1, 2, 3, and 4 by a NucleoCounter system (ChemoMetec, Allerød, Denmark) according to the manufacturer's instructions. The six tubes containing the 0.1 mL cell suspension were prepared. Three of them were used for counting the nuclei with cell lysis (total cell number). Other three were used for counting the nuclei without cell lysis (nonviable cell number). The subtraction of the nonviable cell count from the total cell count was the number of viable cells. Thereby, it was possible to calculate the viability in percentage.
Cell proliferation assay
After 4-day storage in PBS, the EGCG-treated and nontreated MSCs were seeded onto 12-well plates at 1 × 10⁴ cells per well. At days 1, 4, 7, and 12, the DNA contents were measured to evaluate cell proliferation. To measure the DNA contents, we adopted the method provided by the Japan Medical Devices Manufacturers Association. In detail, the medium was removed, and the cells were washed twice with PBS. The cells were scraped off and collected into 1 mL of 0.2% Triton X-100 (Nacalai Tesque), sonicated for 5 min and then used for the measurement of the DNA content. The DNA content of the cells was measured with Quant-iT Pico-Green® dsDNA Reagent and Kits (Invitrogen). A microplate reader (Wallac 1420 ARVOsx; PerkinElmer Life and Analytical Sciences, Waltham, MA) was used to measure the fluorescence intensity. DNA content was expressed as nanograms per well.
Cell preparation for osteogenic differentiation
After 4-day storage in PBS, the EGCG-treated and nontreated MSCs were seeded onto 12-well plates at 1 × 10⁴ cells per well and cultured in osteogenic medium for 2 weeks, by the above mentioned method.
Extracellular mineralization analysis
The medium containing the calcein was removed, and the cells were washed with PBS. Then the fluorescence of the deposited calcium was viewed and quantified with an image analyzer (Typhoon 8600; 526 nm short-pass filter; GE Healthcare Life Sciences, Buckinghamshire, England). 13 Extracellular mineralization was also observed with a phase-contrast and a fluorescence microscope (Olympus IX70; Olympus Optical).
Alkaline phosphatase activity assay
To analyze alkaline phosphatase (ALP) activity, we adopted the method provided by the Japan Medical Devices Manufacturers Association. After an analysis of the extracellular mineralization, PBS was aspirated from the plate. The cells were scraped off and collected into 1 mL of 0.2% Triton X-100 and sonicated for 5 min. The cell solution (100 L) was assayed for ALP activity, using p-nitrophenyl phosphate (pNPP) substrate (900 L). The cell solutions were then incubated at 37°C for 10 min and measured on a microplate reader for absorbance of the p-nitrophenol (pNP) product formed at 405 nm. ALP activity was expressed as micromoles of pNP products per minute per well.
ELISA of osteocalcin
To measure the osteocalcin, the cell layers on the plate were washed with PBS. The cells were scraped off and collected into 1 mL of 10% formic acid (Nacalai Tesque), sonicated for 5 min, and stored at 4°C. The cell solution was centrifuged at 880 g for 10 min at 4°C, and the protein fraction was eluted using NAP-5 columns (Amersham Biosciences, Uppsala, Sweden) and enriched by centrifugation (SPD SpeedVac, UVS800DDA Universal Vacuum System; Thermo Scientific, Waltham, MA). Then the enriched protein was dissolved in PBS containing 10% Block Ace (DS Pharma Biomedical, Osaka, Japan) and used for the measurement of osteocalcin. An Intact Human Osteocalcin EIA Kit (Biomedical Technologies, Stoughton, MA) was used for osteocalcin quantification. The assay is a sandwich method enzyme immunoassay (EIA), which utilizes monoclonal antibodies directed toward the amino- and carboxy-terminal regions of the protein. The reactions were measured using the microplate reader at 450 nm. Osteocalcin production was expressed as nanograms per well.
Apoptosis assay
To assay cells for apoptosis by analysis of cell surface markers, 1 × 10⁵ MSCs, EGCG-treated and nontreated MSCs each, at day 4 were reacted with Annexin V–FITC (BioVision, Mountain View, CA). After 24 h, cells were collected and analyzed by a FACSCalibur flow cytometer. Propidium iodide (PI) was used for identifying dead cells. PI binds DNA by intercalating between the bases with little or no sequence preference and with a stoichiometry of one dye per four to five base pairs of DNA. PI is membrane impermeant and generally excluded from viable cells.
The EGCG-treated and nontreated MSCs at day 4 were used for apoptosis assay by polymerase chain reaction (PCR). Total RNA was extracted with chloroform and precipitated with propanol after being homogenized with TRIZOL Reagent (Invitrogen). The RNA pellets were washed with 75% ethanol, and the RNA was resolved in RNase-free water. The RNA concentration was quantified with NanoDrop® (NanoDrop Technologies, Wilmington, DE). A volume of 400 ng of RNA was used for cDNA synthesis using an RNA PCR Kit (AMV) Ver. 3.0 (TaKaRa Bio, Shiga, Japan) according to the manufacturer's instructions. PCR was performed using an ApoPrimer Set (TaKaRa Bio) with a Gene Amp PCR system 9700 (Applied Biosystems, Branchburg, NJ).
The PCR products were detected by 1% agarose gel electrophoresis and viewed with 0.1% ethidium bromide under a UV transilluminator (Model M-20, Toyobo, Osaka, Japan).
Statistical evaluation
The data were tested by calculating Pearson's correlation coefficient. The significance of the correlation coefficient was followed by Fisher's r to z-test (p-value). These data were analyzed for significance using StatView J Version 4.5 (Statvview; Abacus Concepts, Berkeley, CA).
Results
Time-course and dose–response study of EGCG
We first determined the time and dose of the EGCG for the treatment of MSCs. At 4°C, the viabilities of the MSCs were more than 90% within several hours treatment of EGCG at the dose of 50 to 200 ppm (Fig. 2). The MSCs at the dose of 100 ppm proliferated well compared to other doses; therefore, we selected the treatment at the dose of 100 ppm for 2 h.
Cell characterization
To characterize the cells we used in this study, we examined three lineage of differentiation (bone, fat, and cartilage). The mineralization capability as a result of osteogenic differentiation was clearly seen (black and green areas in Fig. 3a+ and 3b+, respectively). Differentiation to adipocyte and chondroblast was demonstrated by staining with Oil Red O (Fig. 3c+) and Toluidine blue (Fig. 3d+). These results showed that the cells could differentiate to osteoblasts, adipocytes, and chondroblasts. We also analyzed the cell surface antigen expressions by flow cytometry. As seen in Figure 4, the cells expressed high levels of CD105 and CD90; however, they hardly expressed CD45 and CD34. They also expressed Stro-1 and other mesenchymal markers. The patterns of the flow cytometry did not change after the EGCG treatments. These data of three lineage differentiation and CD expression pattern demonstrated that the cells we used were mesenchymal cells, that is, MSCs.
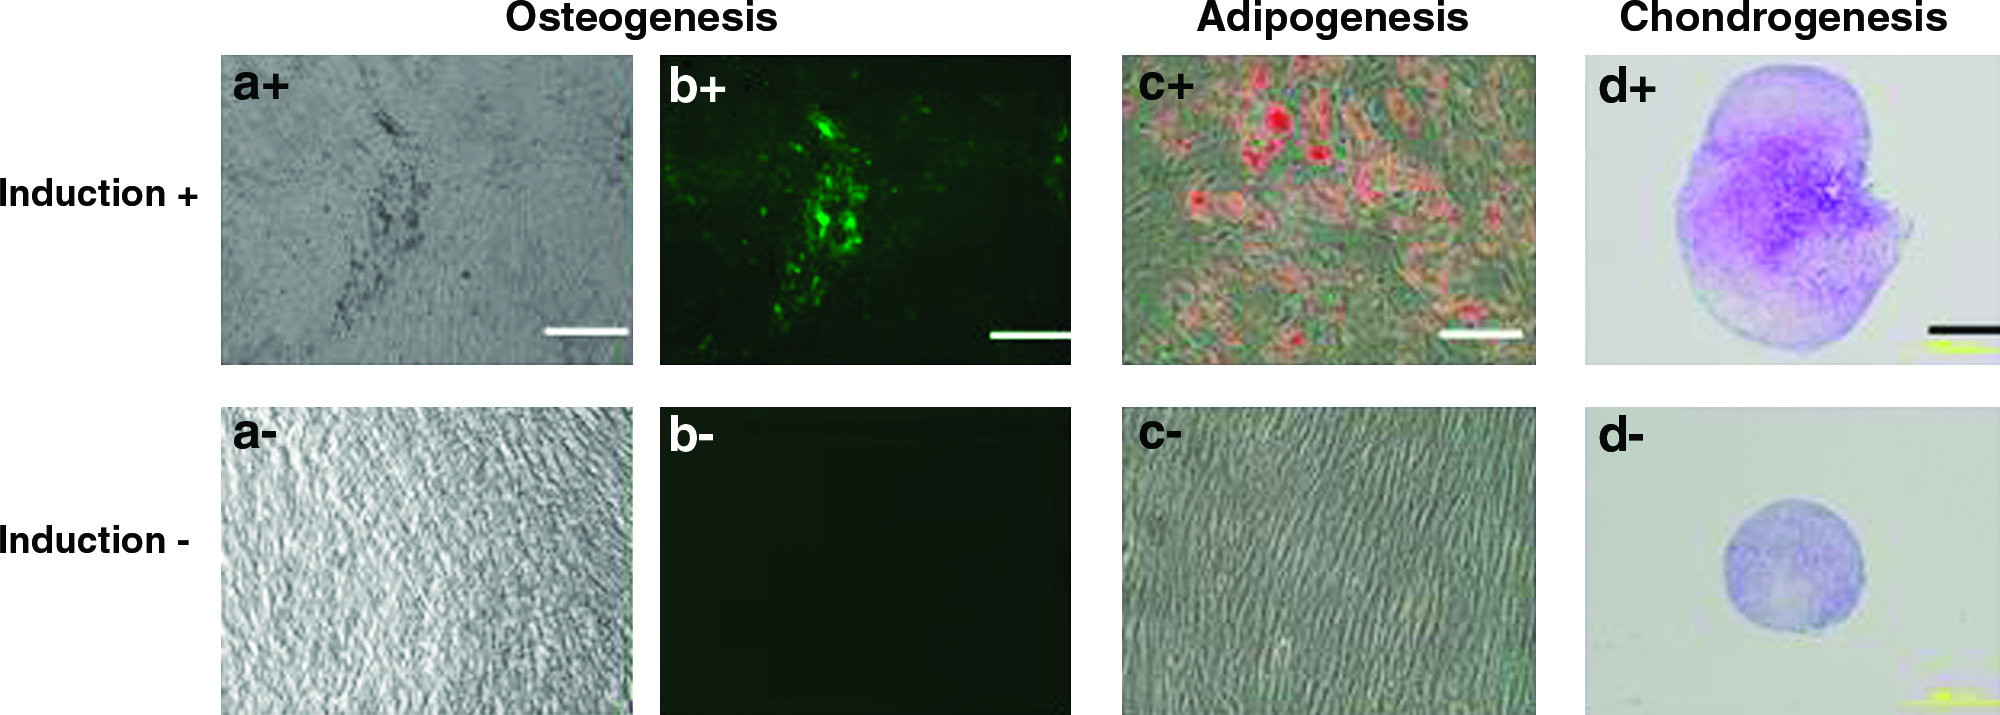
Differentiation capability of MSCs. MSCs were induced to osteoblasts (a, b), adipocytes (c), and chondroblasts (d). Two weeks culture of MSCs in the osteogenic (a+ , b+) or in control medium (a− , b−). Phase-contrast microscopic image shows extracellular mineralization (black areas in a+) and fluorescence image shows calcein uptake (green area in b+). Two weeks culture of MSCs in the adipogenic (c+) or in control medium (c−). Phase-contrast microscopic image shows adipocytes stained with Oil Red O (red areas in c+). Three weeks culture of MSCs in chongrogenic (d+) or in control medium (d−). Histological section shows chondroblasts stained with Toluidine blue (purple areas in d+). White bar indicates 200 m and black bar indicates 500 m. Color images available online at www.liebertonline.com/ten.
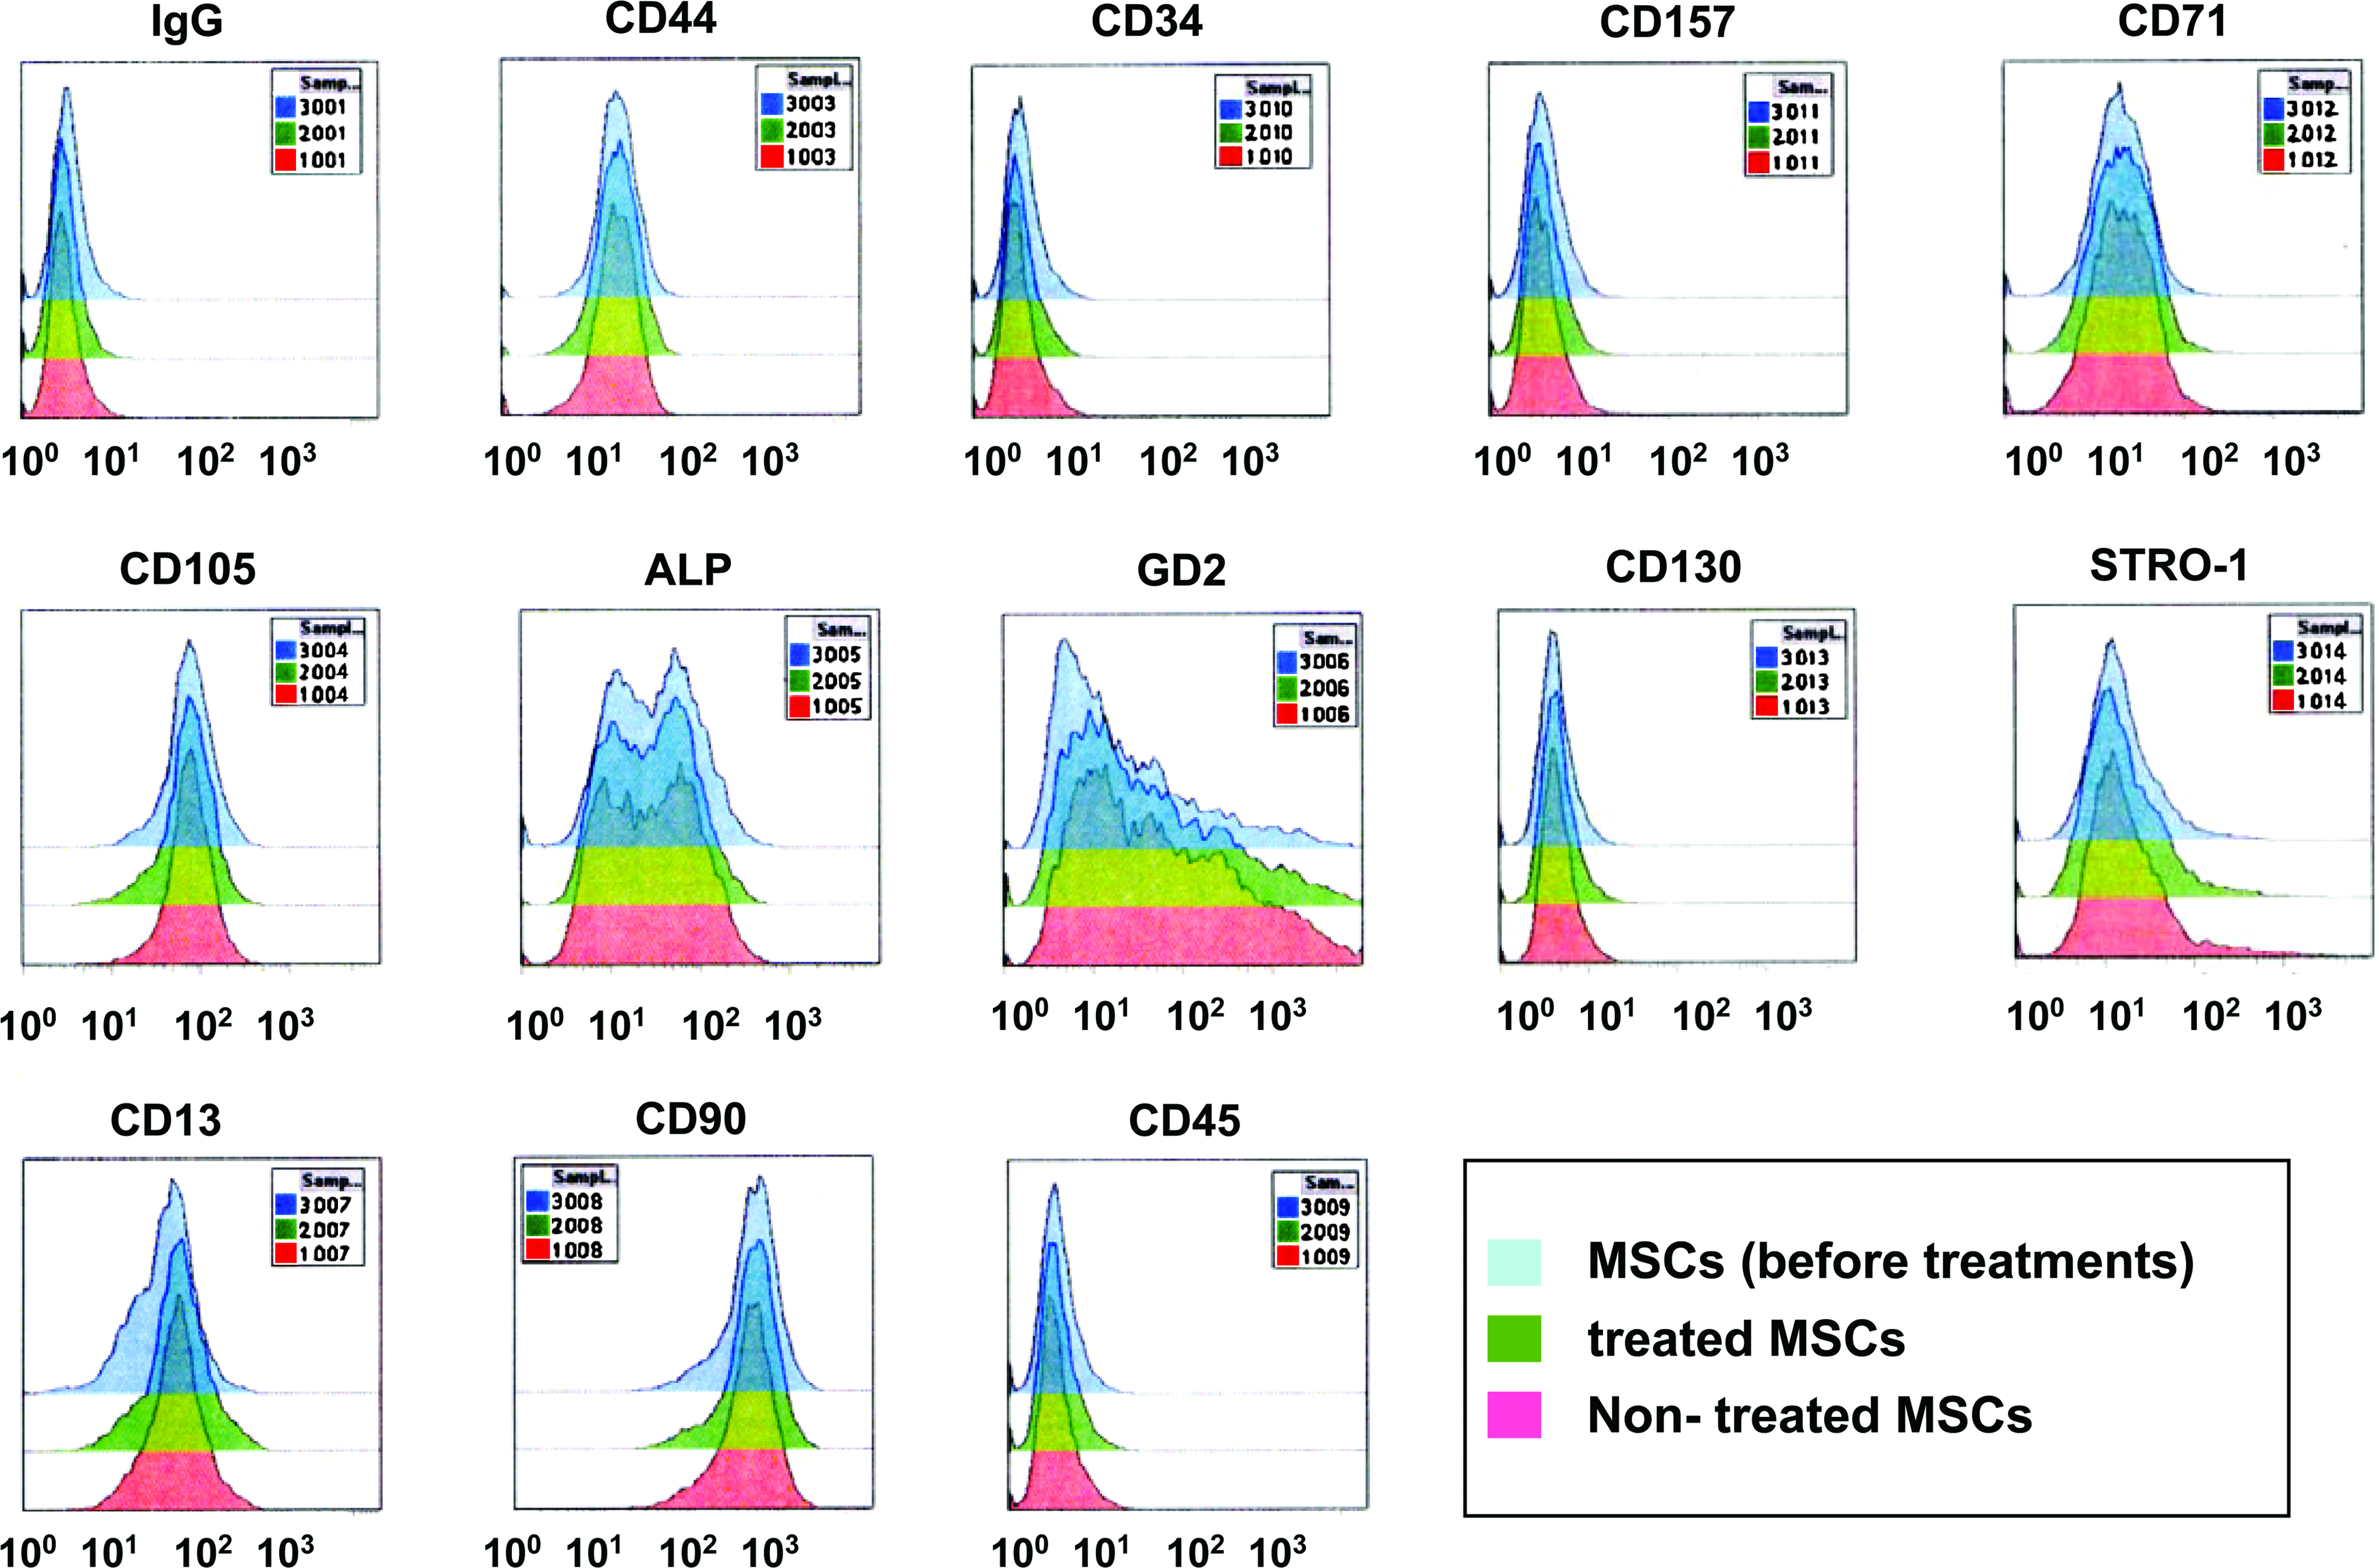
FACS analysis of MSCs. As seen in Figure 1, after proliferation of cryopreserved MSCs, the MSCs were used for FACS analyses (MSCs; gray peaks). The MSCs were then soaked in PBS with 100 ppm EGCG (treated) or without EGCG (nontreated) and used for FACS analyses. Green and pink peaks indicate treated and nontreated MSCs, respectively. These MSCs were labeled with FITC-conjugated antibodies. The x-axis indicates fluorescence intensity (FI). The y-axis indicates cell counts. The units of the y-axis are arbitrary. Color images available online at www.liebertonline.com/ten.
Cell viability
When EGCG-treated and nontreated MSCs were stored at 4°C in PBS, the cell viability was maintained at more than 96% at day 1, and then decreased with time. At day 3, the viability of nontreated MSCs was about 70.4%, but the viability of treated MSCs was about 84.7%. At day 4, the cell viabilities were 59.9% and 78.4%, respectively (Fig. 5). These results show that MSCs could show high viability for a long period by treating with EGCG.
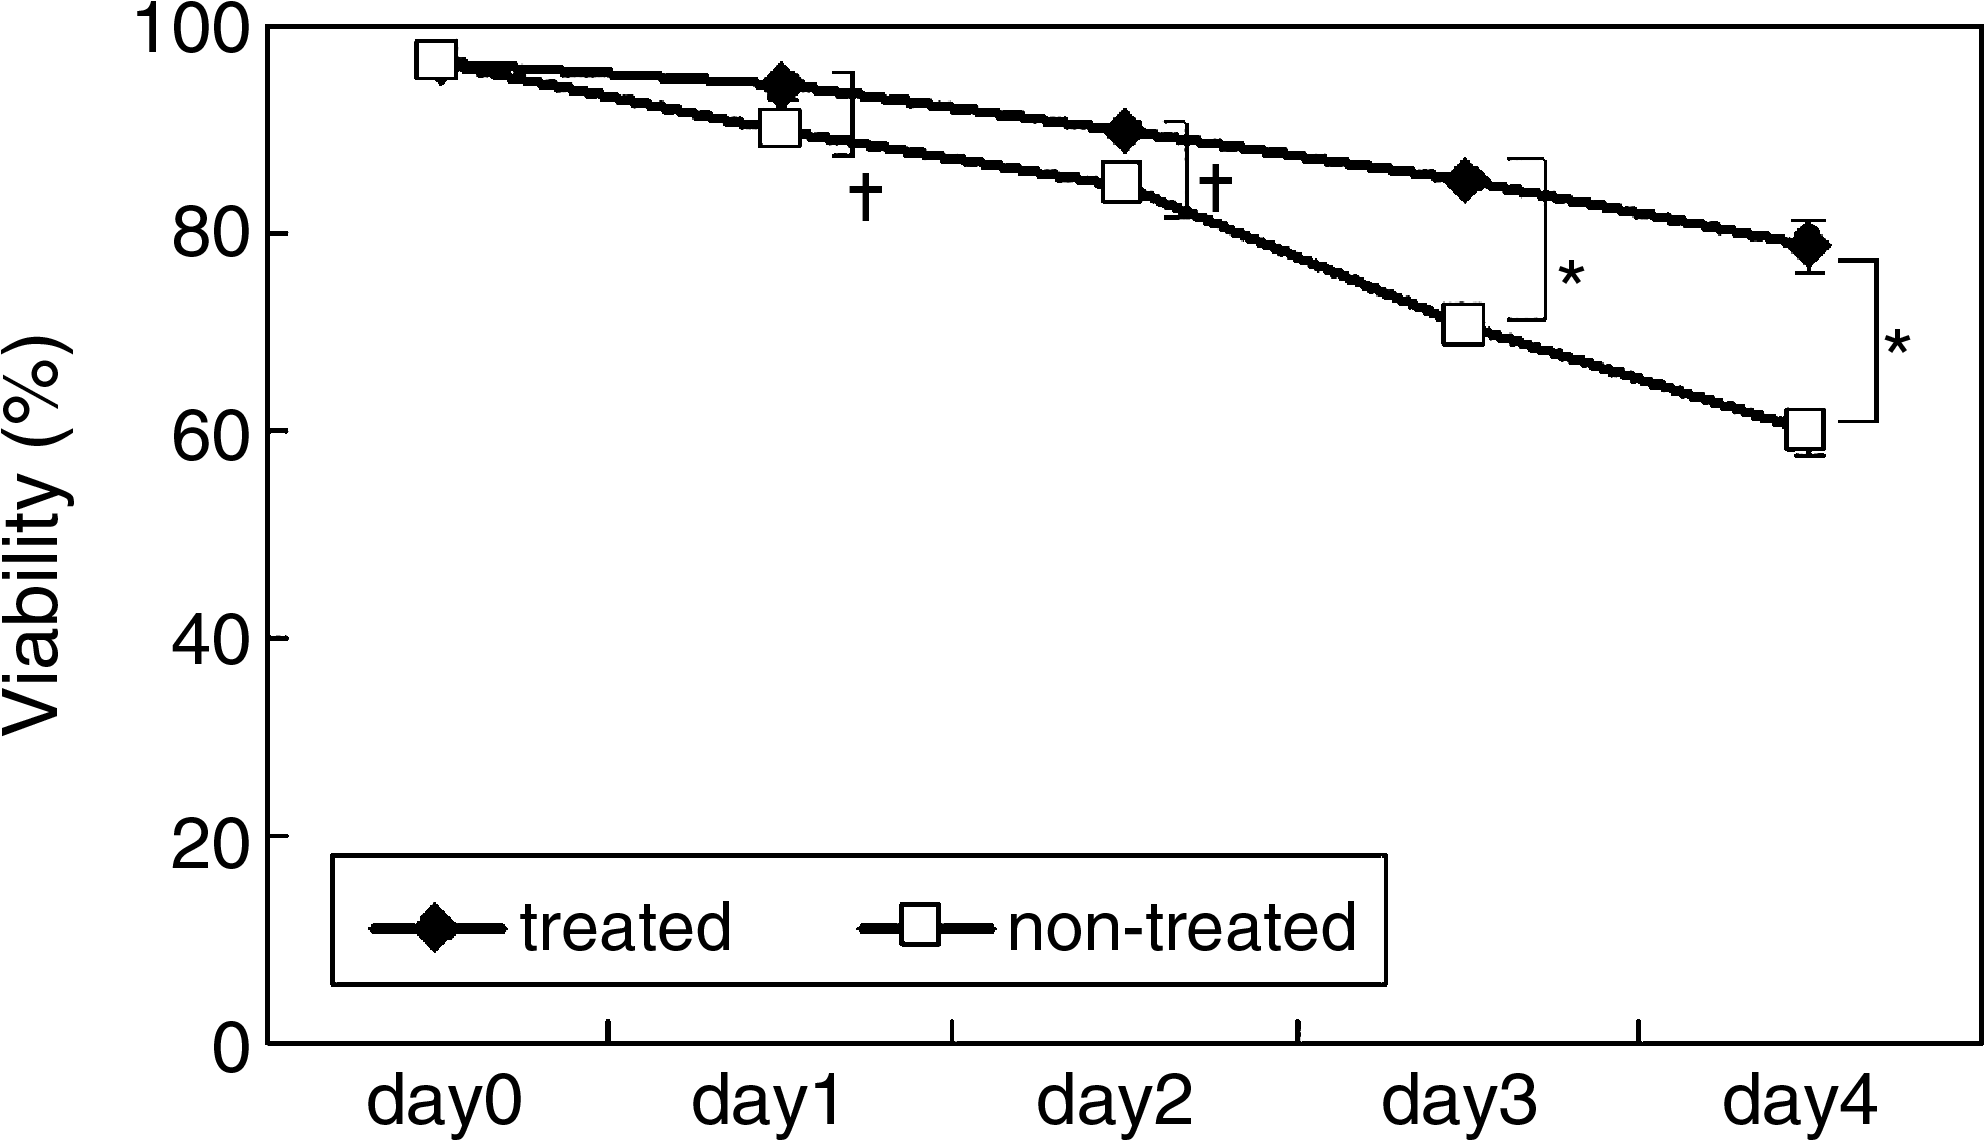
Cell viability of EGCG-treated and nontreated MSCs during 4 days in PBS at 4°C. The EGCG-treated and nontreated MSCs were stored in PBS at 4°C and assayed for their viability. The data represent the mean ± standard deviation of the three samples. (*p < 0.01; †p < 0.05).
Cell proliferation assay
At day 1, the EGCG-treated MSCs attached well to the plates compared with the nontreated MSCs (Fig. 6b). Further, the treated MSCs proliferated faster than did the nontreated MSCs. At day 4, the treated MSCs had 5.7 times more DNA than did those of the nontreated MSCs (Fig. 6a). At day 12, the DNA content of the EGCG-treated MSCs was almost the same as that of the nontreated MSCs (Fig. 6).
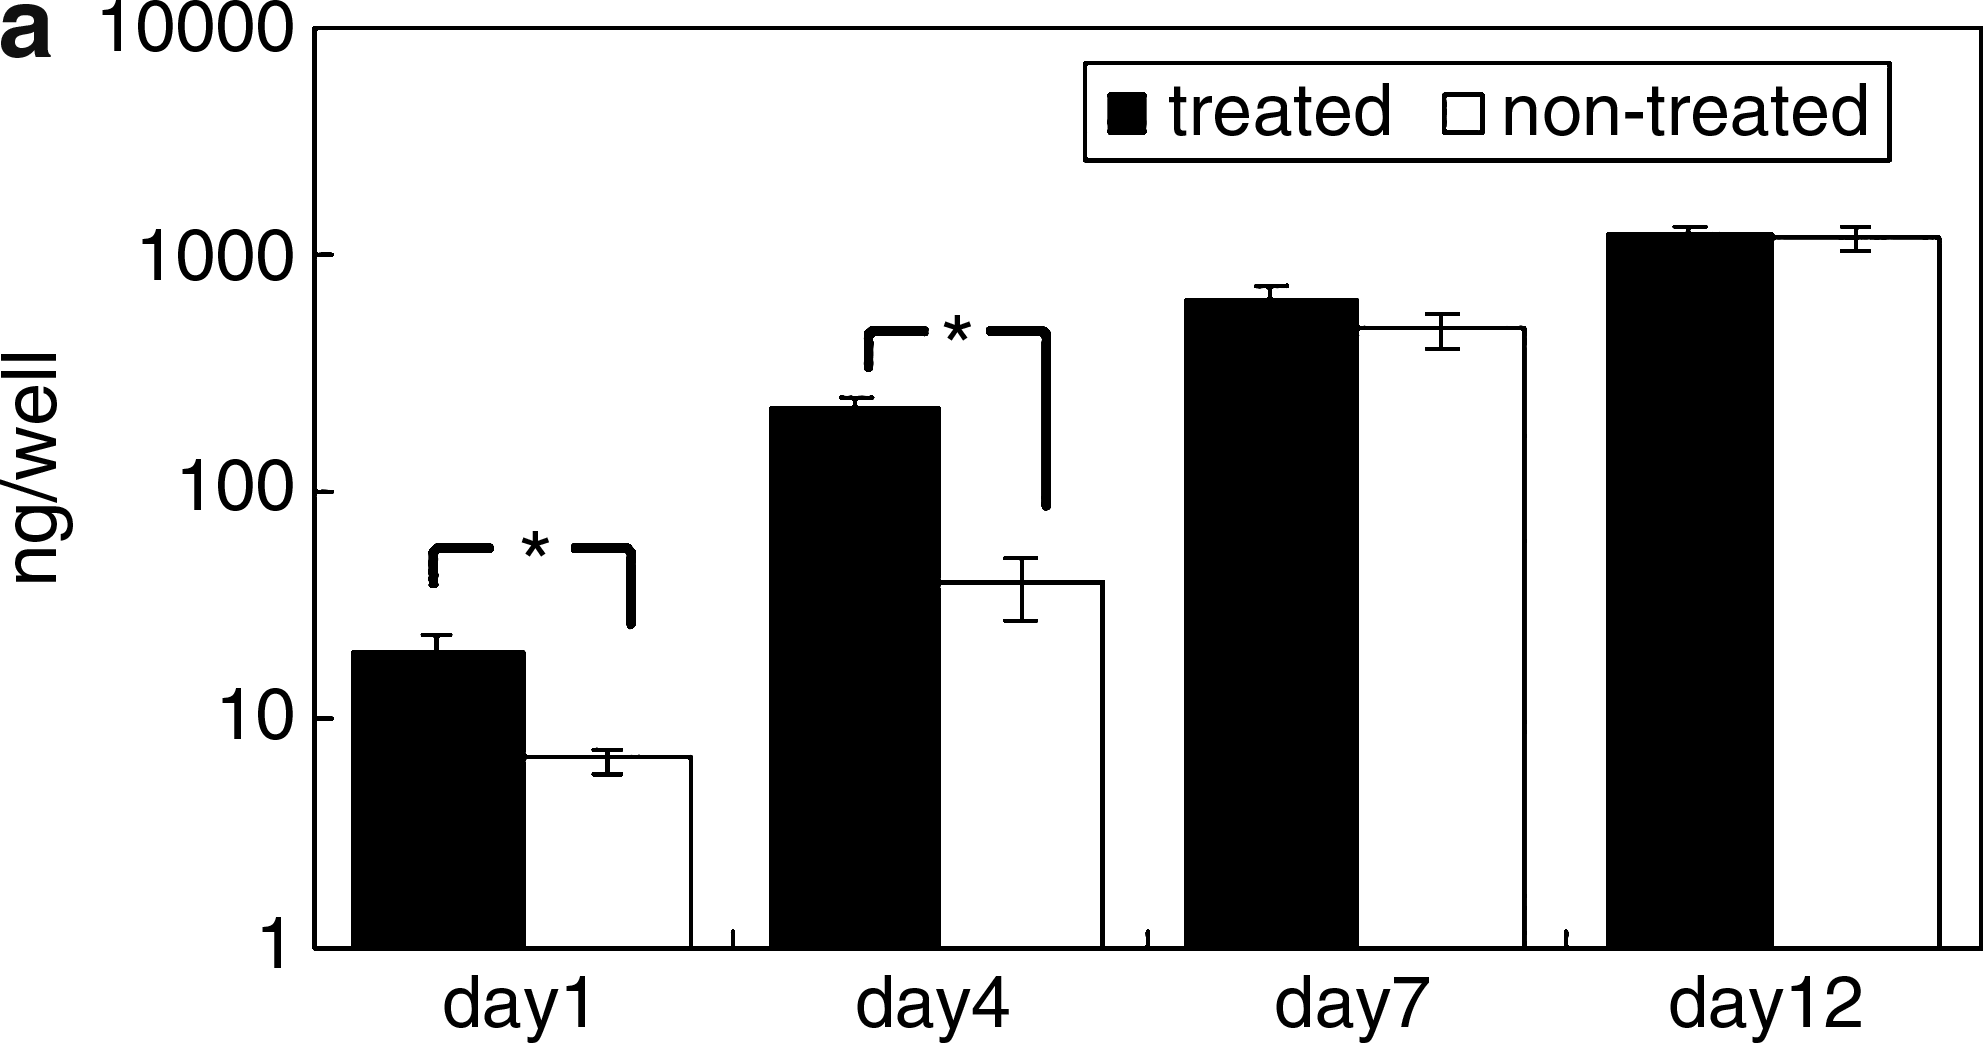
Proliferation of EGCG-treated and nontreated MSCs during 12 days culture. These MSCs were seeded after 4 days storage in PBS and cultured for 12 days. The DNA content (
Osteogenic differentiation assay
As shown in Figure 7, the DNA content (Fig. 7a), mineralization (Fig. 7b), ALP activity (Fig. 7c), and osteocalcin production (Fig. 7d) of the EGCG-treated and nontreated MSCs were quantitatively measured after 2 weeks culture. The culture was done in the presence of Dex (D+, osteogenic culture condition) and the absence of Dex (D−). There was no significant difference in the DNA content among all the cultured cells. In the osteogenic culture condition, the mineralization, ALP activity, and osteocalcin production of the EGCG-treated MSCs were 7.5, 4.8, and 24 times greater, respectively, than those of the nontreated MSCs.
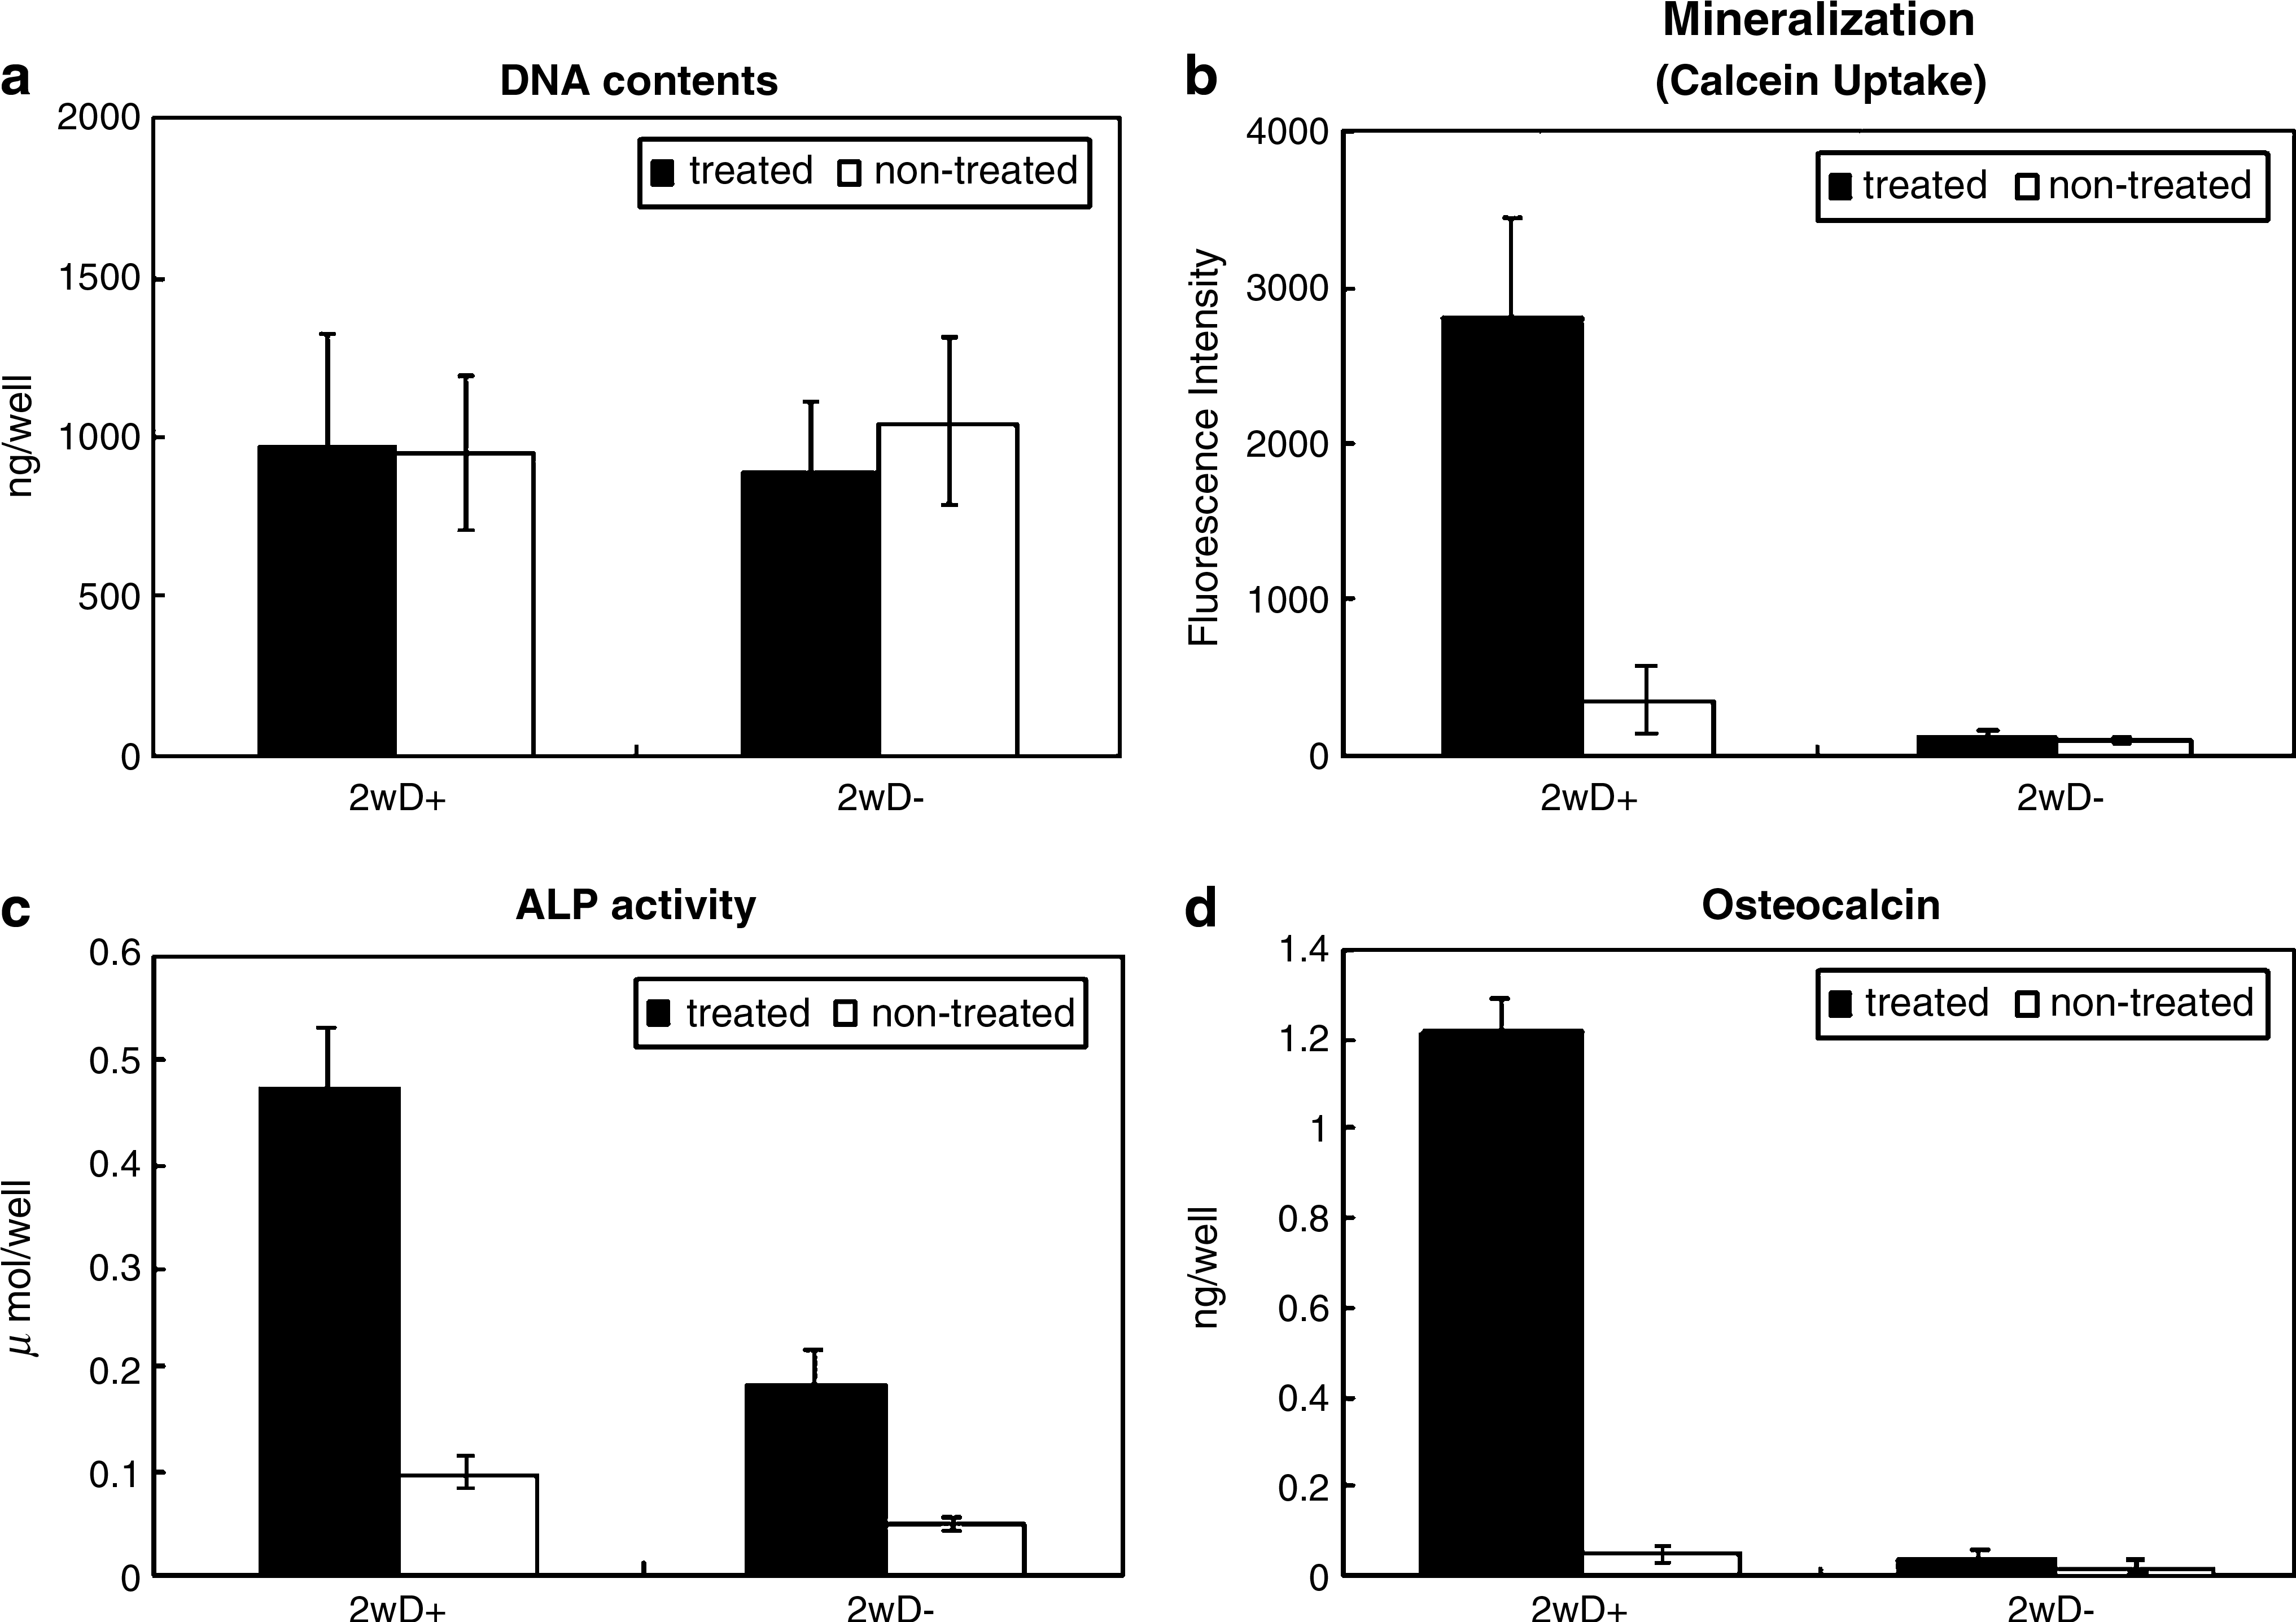
DNA content (
As shown in Figure 8a, in the osteogenic culture condition for 2 weeks, macroscopic viewing of the mineralization was done by the image analyzer. Black dots indicate the mineralization reflected by the fluorescence intensity of the calcein uptake. The number of dots in the EGCG-treated MSCs was more than that in the nontreated MSCs. Microscopic observation was done using a phase-contrast (Fig. 8b) and a fluorescence microscope (Fig. 8c). The mineralization (black areas in Fig. 8b and green areas in Fig. 8c) in the EGCG-treated MSCs was clearly visible. In contrast, the mineralization of the nontreated MSCs was difficult to detect. Therefore, by the EGCG treatment, the cells having the capability of osteogenic differentiation survived well even after their suspension in PBS for 4 days.
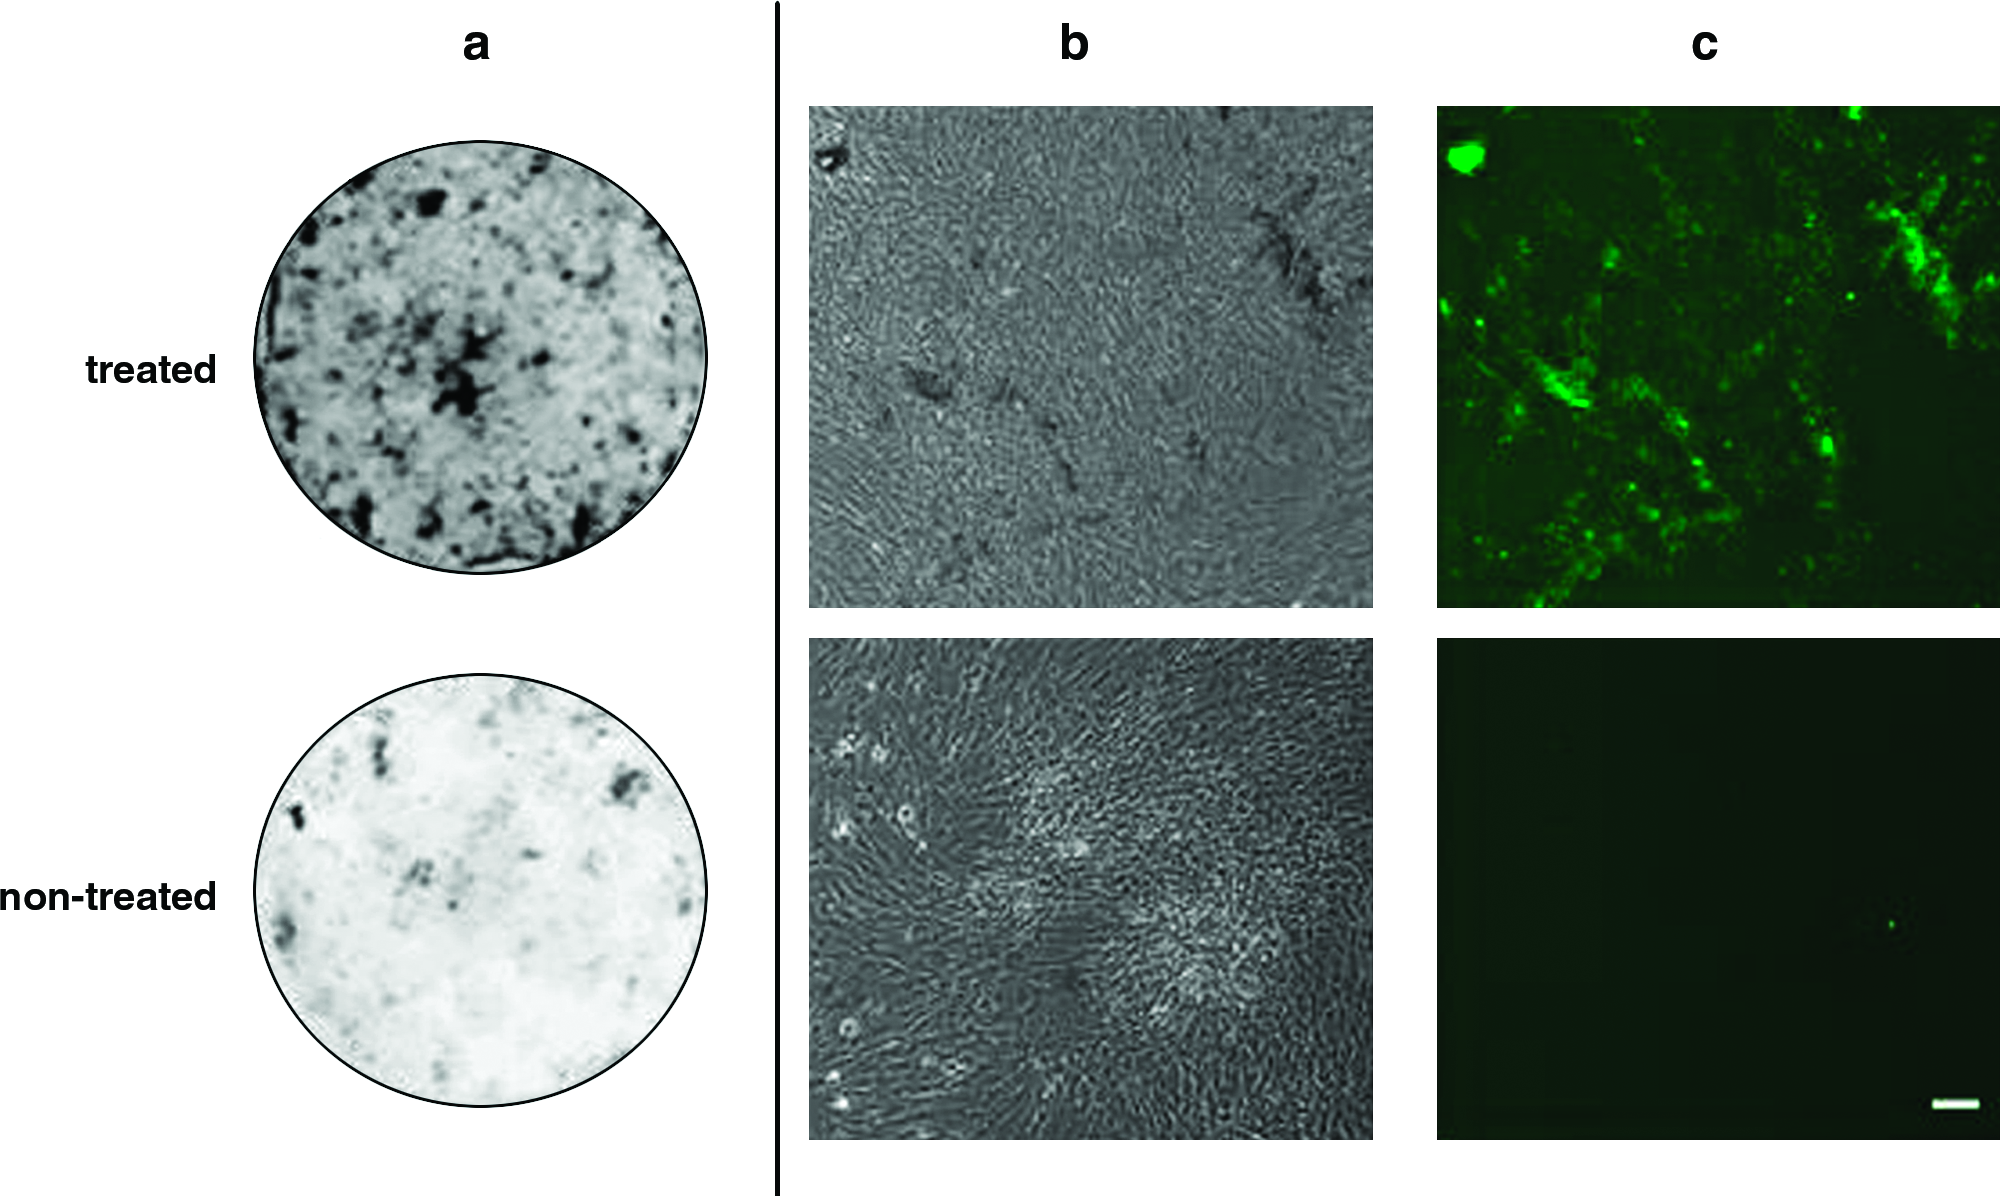
Cell morphology and mineralization of EGCG-treated and nontreated MSCs. These MSCs were seeded after 4 days storage in PBS and cultured in osteogenic media for 2 weeks. Mineralization (
Apoptosis assay
Annexin V–positive cells were hard to detect in both the EGCG-treated and nontreated MSCs at day 4 (Fig. 9a). However, the level of PI-positive cells in the nontreated MSCs was higher than that in the treated MSCs. By reverse transcription (RT)-PCR assay, though less expression of Bcl-2 gene was seen in nontreated MSCs, other apoptosis marker gene expressions were essentially the same in the EGCG-treated and nontreated MSCs (Fig. 9b).

FACS analysis for apoptosis of EGCG-treated and nontreated MSCs at day 4 (
Discussion
In this study, the effect of EGCG on the long-term storage of MSCs in liquid suspension was examined. The EGCG was purified from green tea catechin. Green tea catechins are the major constituents of tea leaves and are considered beneficial to human health. Green tea is consumed by the Japanese and Chinese people mostly in the form of beverages. Many studies have demonstrated the beneficial effects of catechins such as antioxidative, 16 antiallergic, 17 antimutagenic/anticarcinogenic, 18 and antifungal 19 effects.
It was reported that the EGCG treatment of many cells20–23 and tissue types such as vein, pancreas,24,25 cornea, 26 and nerve 27 resulted in positive effects for prolonged preservation. In these articles, the concentrations of EGCG were lower than that used in the present study of 100 ppm which showed long-term cell survival of MSCs. The reason for the low concentration used in other articles might be due to the toxic effect of EGCG for viable cells. However, the cytotoxicity of EGCG is caused by oxidization of EGCG and H2O2 generation. Oxidization progresses when the cells are incubated at 37°C. In contrast, it significantly delays at low temperature and therefore, in the present study, MSCs were treated with EGCG and stored at 4°C. As a result, the treatment with 100 ppm EGCG well maintained the cells' viability and showed excellent proliferation as well as osteogenic differentiation capability. Therefore, EGCG has the effect of maintaining the cellular functions of the MSCs even in a liquid suspension.
EGCG has an amphipathic nature and could bind to a 67-kDa laminin receptor. 17 It is also known to inhibit epidermal growth factor–dependent kinases resulting in the inhibition of cell proliferation. 28 In culture study, the degree of inhibition was proportional to the concentration of EGCG. However, it was abolished after the EGCG was removed from the culture medium and, thus, the inhibition was reversible. 23 We observed that without EGCG treatment, MSCs showed an initial low proliferation capability followed by rapid growth resulting in confluence (Fig. 5) at 2 weeks. However, the confluent cells showed little capability of osteogenic differentiation (Figs. 7 and 8). In contrast, EGCG-treated MSCs showed rapid proliferation as well as a high level of differentiation capability. Our preparation of MSCs was heterogeneous and not cloned cells, thus the preparation contained not only stem cell–like cells but also fibroblastic cells. Therefore, these observations indicate that treatment with EGCG effectively preserved the stem cell–like cells, which proliferated, and also showed the differentiation capability.
Our results showed that suspension of the MSCs in PBS resulted in decreased viability in a time-dependent manner (Fig. 5), and the decrease was less when the MSCs were treated with EGCG. Because the cells were suspended in PBS, they lost the property of cell adhesion. The loss could inhibit cell proliferation due to cell apoptosis, a phenomenon termed anoikis. 29 Because the EGCG treatment results in more viable cells than does nontreatment, EGCG may control the apoptotic cascade. However, the population of apoptotic cells (annexin-positive cells) was not different between the treated and nontreated cells. Further, the treatment did not affect the pattern of Bcl-2 family gene expression. The Bcl-2 gene was identified as a gene translocated in human follicular lymphoma that functions by inhibiting apoptosis. Thus, EGCG treatment did not inhibit apoptosis but rather affected cell proliferation by binding to the cell membrane or supporting the attachment of cells having differentiation capability to the culture dish surface. The prompt attachment of the MSCs was easily seen at culture day 1 (Fig. 6b).
In conclusion, the treatment of MSCs with EGCG could maintain a high level of viability and proliferation/osteogenic differentiation capabilities even though the MSCs were suspended in PBS for 4 days. The period is sufficient enough for the transport of cellular products to distant clinical facilities and for enabling the safety of the products. Therefore, EGCG is useful for the storage of MSCs in a liquid suspension as a ready-to-use product. Because MSCs are currently being used to treat a broad range of tissues affected by damage or disease, EGCG treatment might facilitate the availability of MSCs for the purpose of tissue regeneration.
Footnotes
Disclosure Statement
No competing financial interests exist.