




Abstract
To design and fabricate next-generation tissue engineering materials, the understanding of cell responses to material surfaces is required. Surface topography presents powerful cues for cells and can strongly influence cell morphology, adhesion, and proliferation, but the mechanisms mediating this cell response remain unclear. In this report, we have investigated the effects of nanoroughness assemblies of silk fibroin protein membranes and RGD sequences fabricated from two different silk fibroin sources, that is, mulberry (Bombyx mori) and nonmulberry (Antheraea mylitta), on cytoskeletal organization, proliferation, and viability using primary rat bone marrow cells. To vary surface roughness, silk fibroin substrates were treated with graded ethanol (50%–100% v/v) to produce nanoarchitectures in the range of 1–12 nm height. The graded alcohol treatments have been found to produce nanoscale topographies of reproducible height in a much faster and cheaper way. The results showed no difference in cell proliferation within the same treatment groups for both silk types. However, a change in cell response in terms of good cytoskeleton organization, actin development, cell spreading, and strong binding to substratum using A. mylitta fibroin protein films having RGD sequences was observed. This finding provides the information that the nanoroughness affects cellular processes in a cell-specific manner and may be helpful for the development of smart silk-based biomaterials especially for directing cell differentiation and regenerative therapies.
Introduction
Study of cell interaction in relation to topographies with nanometric dimensions is dependent on the availability of fabrication methods. To facilitate this idea, studies have centered on either roughness or have drawn on microelectronics techniques for precise fabrication. One such method is electron beam lithography for fabrication of ultra precise nanotopographies having ordered arrays down to 10 nm for the examination of cell–nanoenvironment interactions. 8 The inherent disadvantage with this technique is that it is time consuming and expensive—especially, when it comes to patterning large areas even though it is precise and reproducible. Thus, there is a need to develop useful nanotopographies that can be quickly reproduced over large areas.
Silk, due to its widespread versatility as a biocompatible tissue engineering material, has been used as a model protein in this study. Silk fibers are composed of a fibrous protein core (fibroin) and sericin, a glue protein surrounding it. 9 Lepidopteron insects of the family Bombycidae (i.e., Bombyx mori) and Saturniidae (i.e., Antheraea mylitta) are known for commercially important mass-producible silk that is mainly used as textile fibers. Its use as a surgical suture in medical practice is well known since decades. Owing to its properties like hemocompatibility, permeability to water and oxygen, high strength, toughness, and elasticity, pure silk fibroin in recent times has been processed as a biocompatible material to be used in various biotechnological and biomedical applications.10–14 In this study, contrary to the conventional practice of isolating silk fibroin from cocoons, fibroin protein was isolated from the silk glands of both domesticated mulberry silkworm, B. mori, and wild nonmulberry tasar silkworm, A. mylitta. Further, the obtained protein was dissolved in a novel way under low shear conditions involving an anionic surfactant sodium dodecyl sulfate (SDS) as compared to conventional LiBr method, thus retaining its integral mechanical properties.10,11,15,16 As far as we know, silk in the form of films has not received much attention for fabrication of nanoscale topographical feature to guide cell morphology, attachment, and proliferation.
The present work depicts an experimental demonstration of the credibility of silk fibroin protein as a biomaterial for fabrication of topographical features of nanometric dimensions using a simple graded alcohol treatment method. We have also shown that apart from surface topography, presence/absence of RGD integrin binding sites within the silk substrate does play a significant role in cell attachment and proliferation. These fabricated membranes were employed for culturing rat bone-marrow-derived cell populations to determine response of such cells in terms of attachment and morphology to nanotopography and RGD.
Materials and Methods
SDS (MW 288.38; J.T. Baker), polyethylene glycol 6000 (SRL), cellulose dialysis tubing of cut off 12000 and 3500 kDa (Pierce), tissue-culture-grade polystyrene plastic flasks and plates (Tarsons), cell-culture-grade chemicals including Dulbecco's modified Eagle's medium (DMEM; Sigma), α modified minimum essential medium (α-MEM; Sigma), fetal calf serum, trypsin, and penicillin–streptomycin antibiotics (Gibco BRL), Rhodamine-phalloidin and Hoechst 33342 (Molecular Probes), and all other chemicals (Sigma or Aldrich) were used for the present experiments without further purification.
Live silkworms
Fifth instar matured larvae of both nonmulberry tropical tasar silkworm, A. mylitta, and mulberry silkworm, B. mori, were collected from local silk farms.
Extraction and regeneration of silk fibroin protein from silk glands
The fully-grown fifth instar larvae were dissected for extraction of silk fibroin protein following a method described earlier. 15 Fibroin was isolated from the silkworms just before spinning into cocoons. In brief, the posterior silk glands were isolated and washed in Milli-Q water to remove traces of sericin. The glandular tubes are then squeezed with fine forceps to extrude out the protein. Isolated silk fibroin protein was dissolved using a mild anionic surfactant SDS following a method described earlier. 15 Excess surfactant was removed by dialysis against water using dialysis membranes. Fibroin solution was collected and the concentration was determined by weighing the remaining solid after drying at 60°C.
Fabrication of microstructured silk fibroin matrices
Regenerated 2 wt% silk fibroin protein was used for fabrication of silk fibroin matrices. For atomic force microscopy (AFM) and confocal studies, 200 μL of protein was spread on a cover glass and was allowed to dry at 37°C overnight in a laminar hood. Cell culture experiments were carried out in six-well culture plates by coating 500 μL of fibroin solution and drying as mentioned above. The dried films were either left untreated or treated with grades of ethanol for 30 min, that is, 50%, 70%, 90%, and 100% (v/v), for induction of crystallinity and insolubility.
Atomic force microscopy
Topology of the fibroin surface was observed using tapping mode AFM (CP II, Model-AP–0100; Veeco Instruments, Inc.). The tapping mode settings were as follows: 0.5 Hz scan rate at a scan size of 10 × 10 μm with a resolution of 256 × 256 data points per scan. A V-shaped silicon nitride cantilever (MMP-11123; Veeco Instruments, Inc.) having spring constant 40 N/m, length 115–135 μm, and radii of curvature <10 nm were used.
Data analysis
Topological data were analyzed using Image Processing and Data Analysis Software (version 2.1.15; copyright TM Microscopes USA). Rp−v (peak to valley distance), average roughness (Ra), root mean square (Rms) roughness (Rq), and mean height were calculated. The arithmetic average roughness (Ra) and the Rms roughness (Rq) are given by
Power spectrum
Statistical analysis of roughness scaling behavior was performed using the power spectrum (PS), which is the Fourier transform of the height autocorrelation function.
where PS(f) is the power of the surface wave of frequency f, L is the total scan length in μm, and x is the spatial variable. 18
Skewness and kurtosis
AFM images were imported in ASCII format to Matlab 7.1.0 (service pack 3; Mathworks, Inc.) for statistical analysis. Skewness (S) and kurtosis (k), which describe the probability distribution of a dataset, were calculated from the data:
where i and j are coordinates on the x–y plane of a point of the surface Z (i, j) with height equal to h. The maximum values assumed by the coordinates i and j are given by n x and n y . In the present study, n x = n y = 256. 18
Primary rat bone marrow cell isolation and culture
The procedures were performed in accordance with the guidelines for animal experimentation by the Institutional Animal Care Committee, Indian Institute of Technology, Kharagpur, India. Primary rat bone marrow cells (BMCs) were isolated from bone marrow of young adult 60-g male Wister rats. Briefly, after deep euthanasia and cervical dislocation, the femoral and tibial bones were dissected aseptically and cleaned extensively to remove associated soft connective tissues. The distal ends of the bone were then cut open and marrow cavities were flushed with α-MEM supplemented with 10% fetal bovine serum (FBS) and combined. The obtained marrow plugs were triturated and passed through needles of decreasing gauge (18 down through 22 gauge) to break up clumps and cellular aggregates. The resulting single-cell suspension was centrifuged at 800 g for 5 min. The number of viable, nucleated cells was determined by trypan blue staining and counted using a hemocytometer. For the initial proliferation experiments, cells were plated at a density of 5 × 10⁶ to 5 × 10⁷ cells per T25 cm2 flasks in α-MEM supplemented with 10% FBS, 1 mM sodium pyruvate, 292 mg/mL L-glutamine, 100 U/mL penicillin G, and 100 mg/mL streptomycin sulfate. After 3 or 4 days of incubation in a humidified atmosphere of 5% CO2 at 37°C, the nonadherent cells were washed away leaving behind the adherent cell population that was growing in clusters. 19 The cells were grown to sufficient numbers for experimentation by passaging using standard tissue culture protocols when they reached 60%–80% confluence. After three passages, attached marrow stromal cells were devoid of any nonadhering population of cells.
BMC proliferation on fibroin protein matrices
Isolated BMCs were seeded at a density of 5 × 10⁴ cells/well onto prewetted films. The coated silk-fibroin protein films were preconditioned with complete DMEM for 2 h in six-well tissue-culture plates as mentioned earlier. DMEM supplemented with 10% FBS was used for cell proliferation of BMCs. Seeded culture plates were incubated at 37°C and 5% CO2 for 7 days. The medium was replenished every 3 days, with half of it being replaced with fresh complete medium. Identical culture conditions were maintained for control experiment sets, where polystyrene plates without fibroin-protein coating served as the substratum for BMC adherence and proliferation. Cell proliferation was monitored using Alamar blue dye reduction assay (AbD Serotec) at each day's interval for a total period of 7 days.
BMC attachment and detachment on fibroin protein matrices
Cell attachment studies were carried out on A. mylitta and B. mori silk fibroin films and polystyrene cell culture plates as control. Briefly, the sterilized films were incubated with 1 mL complete DMEM per well for 2 h for conditioning. The medium was replaced with 2 mL cell suspension having 2 × 10⁴ cells/well. The films containing cells were incubated at 37°C in a 5% CO2 incubator. After every 30 min, the medium from each well was carefully removed and the unattached cells were counted using hemocytometer.
For cell detachment study, A. mylitta and B. mori silk fibroin films were treated similarly as above and 104 cells/well were added in each well. The cells were allowed to adhere by incubating for 24 h at 37°C in 5% CO2. Cell detachment was carried out using 1 mL 0.25% trypsin–0.02% ethylenediaminetetraacetic acid (EDTA) solution. After every 5 min, the trypsin–EDTA solution containing detached cells from each well was carefully removed and counted using hemocytometer.
Flow cytometric analysis: Live/Dead assay
Cell viability of BMCs was assessed using Live/Dead viability/cytotoxicity kit (Molecular Probes) using manufacturer's protocol. Equal number of BMCs (105) was seeded on each fibroin films and polystyrene culture plates (PCPs) as control using similar technique as mentioned earlier. The culture was incubated for 7 days in a humidified atmosphere containing 5% CO2 at 37°C. On day 7, cells were trypsinized and isolated from the matrices. The cell suspension was centrifuged at 800 rpm and was resuspended in 1 mL of fresh medium. Two microliters of 50 μM calcein AM solution and 4 μL of 2 mM ethidium homodimer-I was added per mL of cells. After incubation for 30 min in dark, the samples were analyzed by flow cytometry (FACS Calibular, B-D using Cell Quest Pro software) using 488 nm excitation and measuring green fluorescence emission for calcein (live cells) and red fluorescence emission for ethidium homodimer-I (dead cells). Cells were gated (to exclude debris) and voltage and compensation adjusted before final images were taken.
Confocal microscopy
Attachment and spreading of BMCs on A. mylitta and B. mori silk fibroin films and control PCPs was assessed using confocal microscopy. The fibroin films were seeded with BMCs (104) and cultured for 3 days at 37°C, 5% CO2 in complete DMEM medium to allow them to adhere and spread on the matrix. On day 3, the films were washed three times with phosphate-buffered saline (PBS; pH 7.4) followed by incubation in 3.7% formaldehyde in PBS for 10 min. The samples were further washed with PBS and preincubated with 1% bovine serum albumin for 30 min. The constructs were then permeabilized using 0.1% Triton X-100 for 5 min. Incubation with Rhodamine-Phalloidin for 20 min at room temperature followed by PBS washing and staining with 5 μg/mL Hoechst 33342 for 30 min was performed. Fluorescence images from stained constructs were obtained using a confocal laser scanning microscope (CLSM; Olympus FV 1000 attached with inverted microscope IX 81) equipped with Argon (488 nm) and HeNe (534 nm) lasers. Two-dimensional multichannel image processing was done using FV 1000 Advance software version 4.1 (Olympus).
Cell spreading and actin filament development
Single cell was imaged using 60 × oil immersion objective on an Olympus FV 1000 confocal microscope (CLSM; Olympus FV 1000) and images collected using FV 1000 Advance software version 4.1 (Olympus). A minimum of 25 cells/film were analyzed for spreading and shape. The cell areas were calculated using ImageJ 1.40g program (Wayne Rasband, National Institutes of Health) by outlining the perimeter of the cell as observed through actin staining using Rhodamine-phalloidin. Similarly, cell length was determined following a method as describes earlier. 20 The values of mean cell surface area and cell length are represented in Table 2.
Actin stress fiber development and spreading of BMCs were analyzed using FV 1000 Advance software version 4.1 (Olympus). Contour maps of actin fibers spreading on fibroin films and control plates were scaled according to their color intensities based on Rhodamine-phalloidin staining. Difference in color intensities for actin fibers within the cells marked the binding/development of stress fibers, where green was for lesser developed or less binding area, while red/yellow indicated strong binding or highly developed fibers.
Statistics
For surface morphology analysis, principal component analysis (PCA) and Student's t-test were performed using SPSS for program Windows version 10 (SPSS, Inc.). A correlation method was used for PCA. Data were standardized-centered about the mean and scaled by standard deviation. Five samples of each group were analyzed to test the level of significance. All cell culture experiments were done in minimum triplicates, unless otherwise mentioned, and results expressed as mean ± standard deviation. Statistical analysis of data was performed using one-way analysis of variance. Differences between groups of p ≤ 0.05 were considered statistically significant, and p ≤ 0.01 highly significant.
Results
Surface characterization of silk fibroin protein films using AFM
The homogeneity and overall surface roughness of alcohol-treated silk fibroin and polystyrene cell culture surface was verified using AFM. Various surface roughness parameters were considered and evaluated to study surface microarchitecture of PCP as control and alcohol-treated silk fibroin films and are summarized in Figure 1 and Table 1. Figure 1a, b, c, d, and e represent AFM images of untreated (no alcohol treatment) and 50%, 70%, 90%, and 100% (v/v) ethanol-treated silk gland fibroin from (A) A. mylitta, (B) B. mori, and (C) PCP, respectively. Roughness of the fabricated films increased on treatment with increasing percentage of alcohol up to 100% (v/v). Surface roughness decreased on 100% (v/v) ethanol treatment specifically in case of A. mylitta silk fibroin. Maximum Rms (Rq) and average (Ra) roughness values of 0.96 ± 0.08 and 0.74 ± 0.05, respectively, were observed in case of A. mylitta 90% (v/v) alcohol-treated silk gland fibroin compared with values of 3.28 ± 0.11 and 2.56 ± 0.13 in case of B. mori 100% (v/v) alcohol-treated silk gland fibroin films. In both cases, minimum Rms (Rq) and average (Ra) roughness were observed in untreated gland fibroin films. PCP control plates had values that ranged between 0.15 ± 0.02 and 0.11 ± 0.01 for Rms (Rq) and average (Ra) roughness, which were least in comparison to both A. mylitta and B. mori fabricated films. The result suggests steady increase in fibroin film surface roughness on graded alcohol treatment.
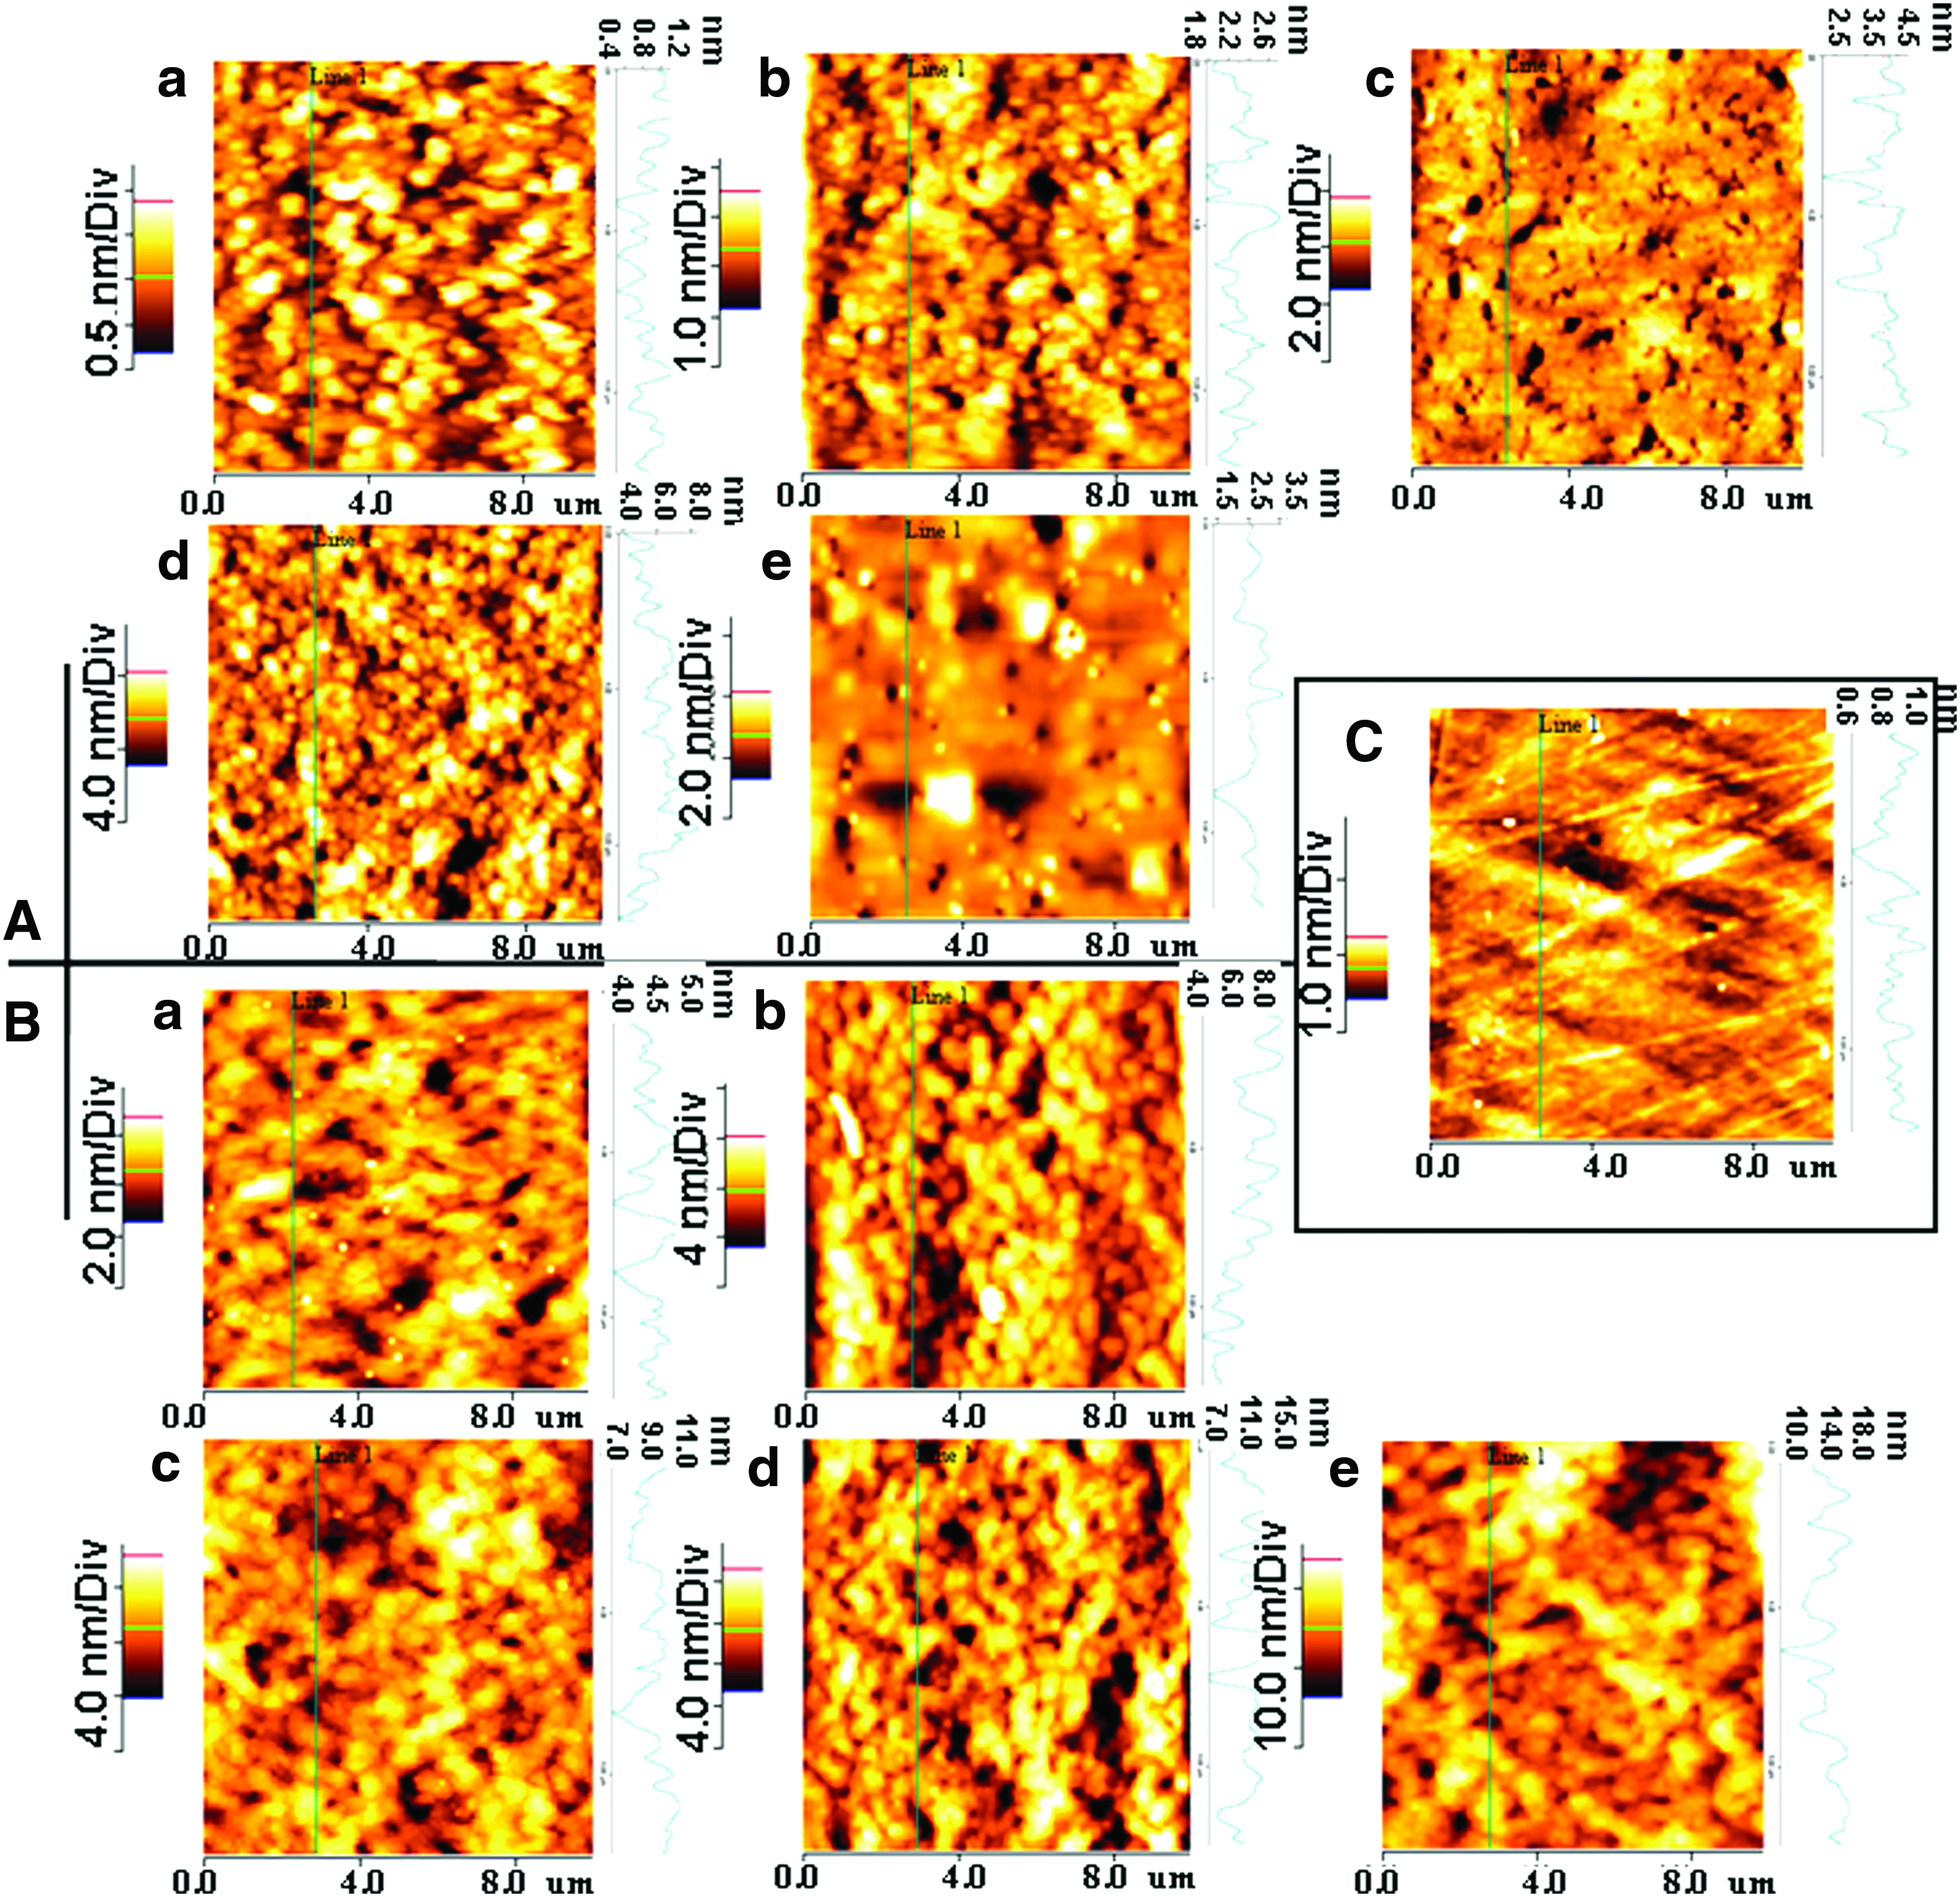
Atomic force microscopy (AFM) images of untreated and alcohol-treated silk gland fibroin protein surfaces from (
The data represent mean ± SD; n = 6.
To further assess silk fibroin film surfaces in terms of its roughness homogeneity and distribution, PS analysis was carried out using data sets obtained from AFM images. Figure 2 shows PS analysis of PCP and silk fibroin surfaces following graded alcohol treatment (0%, 50%, 70%, 90%, and 100% v/v). A. mylitta and B. mori silk fibroin films and PCP were identified as separate entities in terms of spatial distribution. PCP values were comparatively closer to values of A. mylitta (magnitude of ∼10 times) than that of B. mori (magnitude of ∼100) (p ≤ 0.05). The magnitude of difference between PCP and B. mori films in terms of surface roughness was 100 times higher (which were in the order of 10,000 μmÅ2) as compared to values of 100 μmÅ2 in case of A. mylitta films and PCP (p ≤ 0.001). This suggests that surface topology of PCP was closer to A. mylitta than to B. mori alcohol-treated films. To compare closeness of data set points between the groups, PCA analysis was carried out for different samples of silk fibroin films of A. mylitta and B. mori. Scree plot indicates that the first two components exhibit maximum variability. Both PCP and A. mylitta films lay in one component plane, whereas B. mori was observed to be in the other component plane due to differences in surface morphology (Fig. 3).
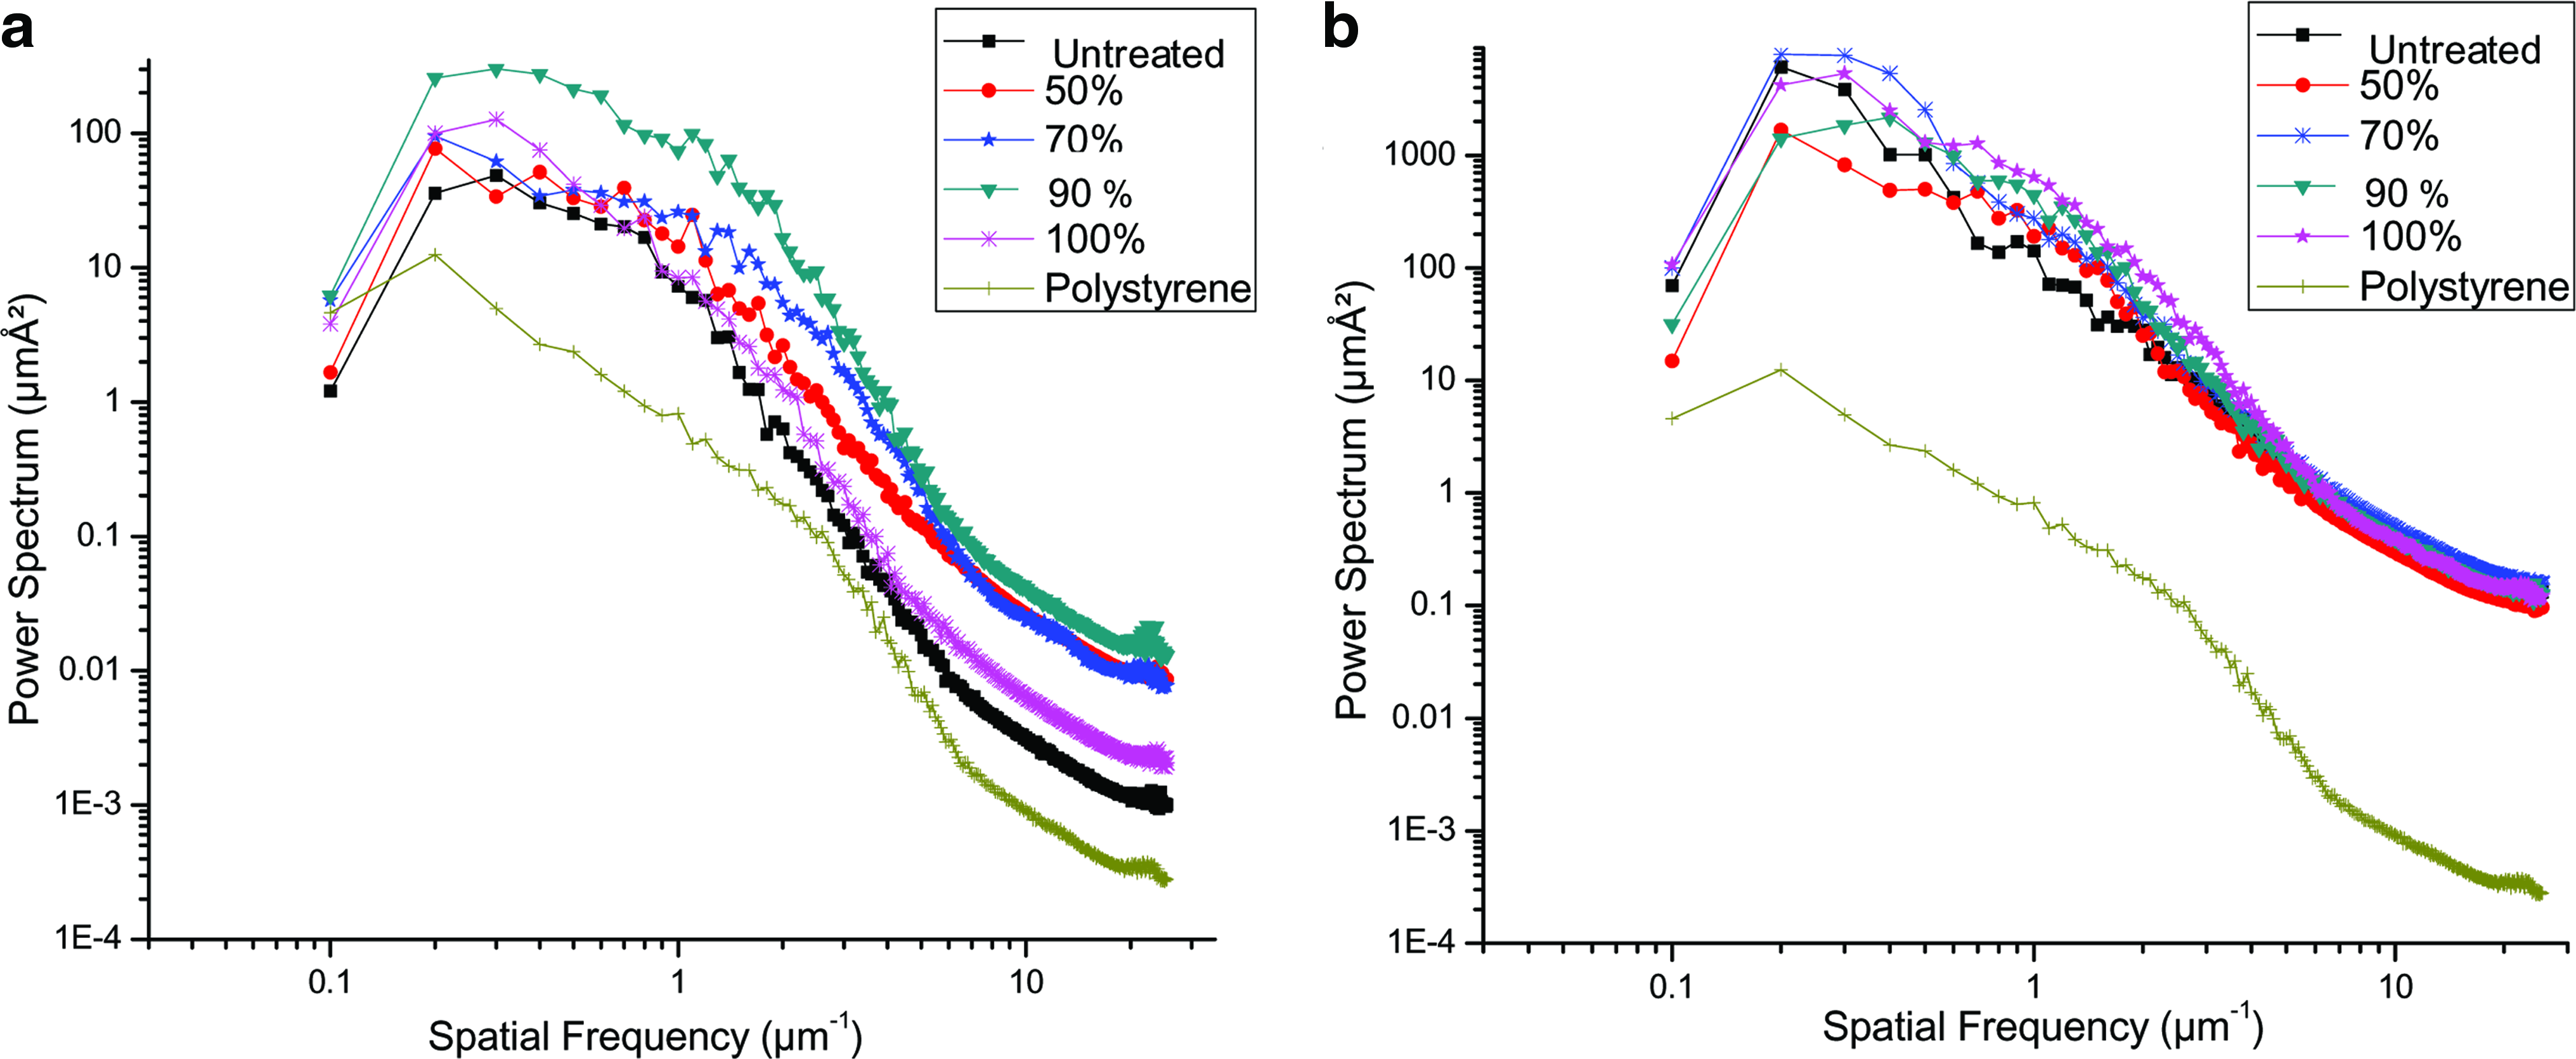
(

Principal component analysis of AFM roughness data. Graph showing distribution of surface roughness points obtained from polystyrene culture plate, and A. mylitta and B. mori silk gland fibroin protein in different principal component planes. Color images available online at www.liebertonline.com/ten.
BMC attachment and detachment
Earlier reports suggest that cell attachments to surfaces are predominantly marked by their surface topology/roughness and also due to presence of integrin binding sites (e.g., -RGD- sequences). To assess the effect of surface nanoroughness and RGD sequences on fabricated fibroin films, cell attachment and detachment studies were carried out. Isolated rat BMCs (20,000 cells) were seeded on alcohol-treated fibroin matrices, from A. mylitta and B. mori as well as on PCP control plates. In case of A. mylitta films, cell attachment trend was comparatively faster than that of PCPs. Initial cell attachment was higher (∼14,000 cells) in A. mylitta films than in PCPs (∼10,000 cells) after 30 min of cell seeding (Fig. 4). The attachment trend shows that approximately 90% and 100% of the total cells were found to be attached on A. mylitta fibroin films within 45 and 60 min of incubation as compared to 65% and 85% of the total cells in case of PCPs. Cell attachment trend on B. mori films was comparable to PCPs. Of the total cell number, 60% and 85% of the cells were attached after 30 and 60 min time in B. mori compared with 50% and 85% in case of PCPs, respectively (Fig. 4). However, no statistically significant difference in cell attachment was observed due to the differences in roughness within the similar silk film groups in either case.
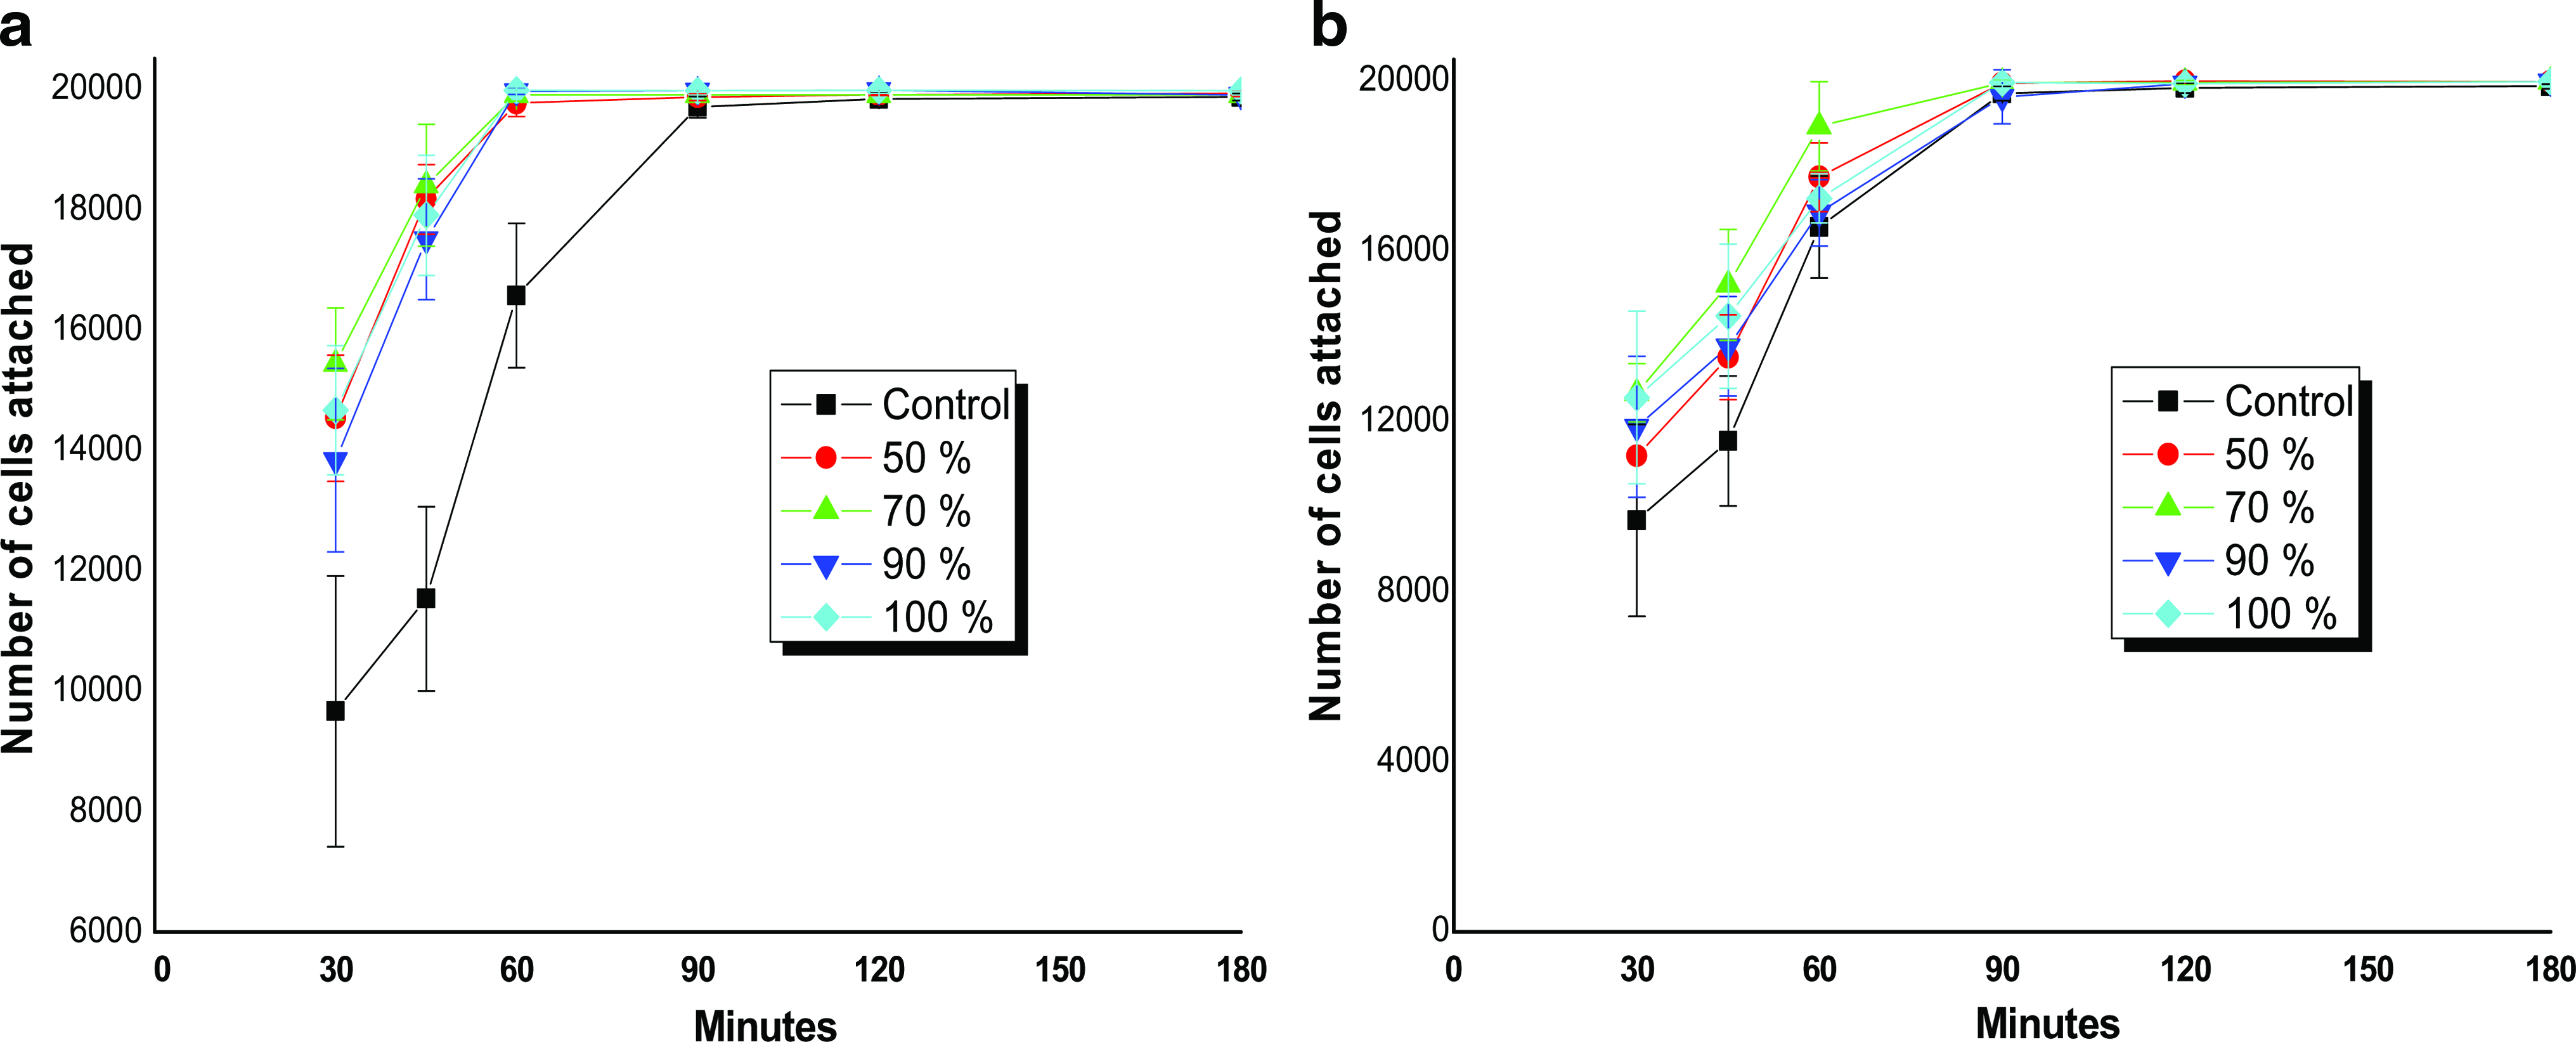
Rat bone marrow cell (BMC) attachment on (
Cell detachment studies were conducted on these surfaces to determine degree/strength of cell adherence on to these silk matrices. In case of cells adhering to A. mylitta films, detachment time was greater than that of control PCPs, suggesting higher force of attachment (Fig. 5). After 15 and 25 min of trypsin–EDTA treatment, the trend shows that nearly 90% and 25% of the total cells remained attached on the A. mylitta film surface as compared to 25% and 0% in case of PCP control plates. In all treatment conditions (50%–100% v/v alcohol treated), the cell detachment trend followed was similar. About 100% cell trypsinization was achieved after 30 min of incubation.

Detachment of rat BMCs from (
In case of B. mori fibroin films, cell detachment trend was similar and comparable to control PCPs (Fig. 5). In all treatment conditions (50%–100% v/v alcohol treated), cell detachment trend was same without any marked variation in detachment time. After 15 min of incubation, only 30% of the total cells remained attached to the B. mori fibroin surface. Finally, 90% of cell detachment was achieved in ∼20 min.
Cell proliferation
Alamar blue assay was conducted to assess cell proliferation on alcohol-treated gland fibroin films, from A. mylitta and B. mori as well as PCPs as control (Fig. 6a, b). Initial cell seeding density was kept constant at 50,000 cells/well. On day 7, cell proliferations on 50%, 70%, and 90% (v/v) alcohol-treated A. mylitta fibroin films were comparable to control plates. It was further observed that initial cell attachment was affected by roughness on differently treated silk films. This resulted in difference in final cell count on day 7. Maximum initial cell attachment on 70% (v/v) alcohol-treated films resulted in higher cell count on final day (∼72,000 cells). In comparison, 100% (v/v) alcohol-treated A. mylitta films, due to their least initial cell attachment, resulted in lower cell number (∼58,000 cells) as on day 7 as compared to PCP. To nullify the effect of difference in cell attachment on differently treated silk films and to compare cell proliferation, we normalized the proliferation data taking the minimum values as the base line (Fig. 6c). Upon normalization, it may now be concluded that the cell proliferation on graded alcohol-treated silk films was not markedly different and the observed difference in final cell count (day 7) was mainly due to difference in initial cell attachment. Approximately 40% increase in cell number was observed at the end of day 7 as compared to initial cell seeding on A. mylitta films.

Alamar assay showing proliferation of rat BMCs on A. mylitta (
In case of B. mori films, all groups showed lesser cell count (∼61,000 cells) than PCP control plates (∼70,000 cells) on day 7. Further, all alcohol-treated silk fibroin groups showed similar cell proliferation pattern without any marked difference (Fig. 6d). Approximately, 16% increase in cell number was observed on B. mori films compared to 40% on PCPs on day 7.
Live/dead assay
Biocompatibility of a matrix is an important parameter for its effective use in cell culture applications. To analyze cell response on the fabricated matrices from A. mylitta and B. mori as well as PCP control plates, flow cytometric analysis was carried out using Live/Dead kit from Molecular probes (Fig. 7). On day 7, films of A. mylitta showed similar number of live cells (∼85%), which was comparable to PCP, except for the 100% (v/v) alcohol-treated films, where live cell percentage was ∼70%. Maximum number of live cells was observed on 70% (v/v) alcohol-treated A. mylitta films, where the ratio of live/dead was 91/08%. In case of all B. mori films, number of live cells were comparable (∼75%), except in 70% (v/v) alcohol treatment, which showed ∼80% live cells and was comparable to control PCP. The experiment demonstrates that once cells attach on these matrices, they survive without much hindrance. Further cell viability was not drastically affected by different degrees of surface roughness within a critical range.
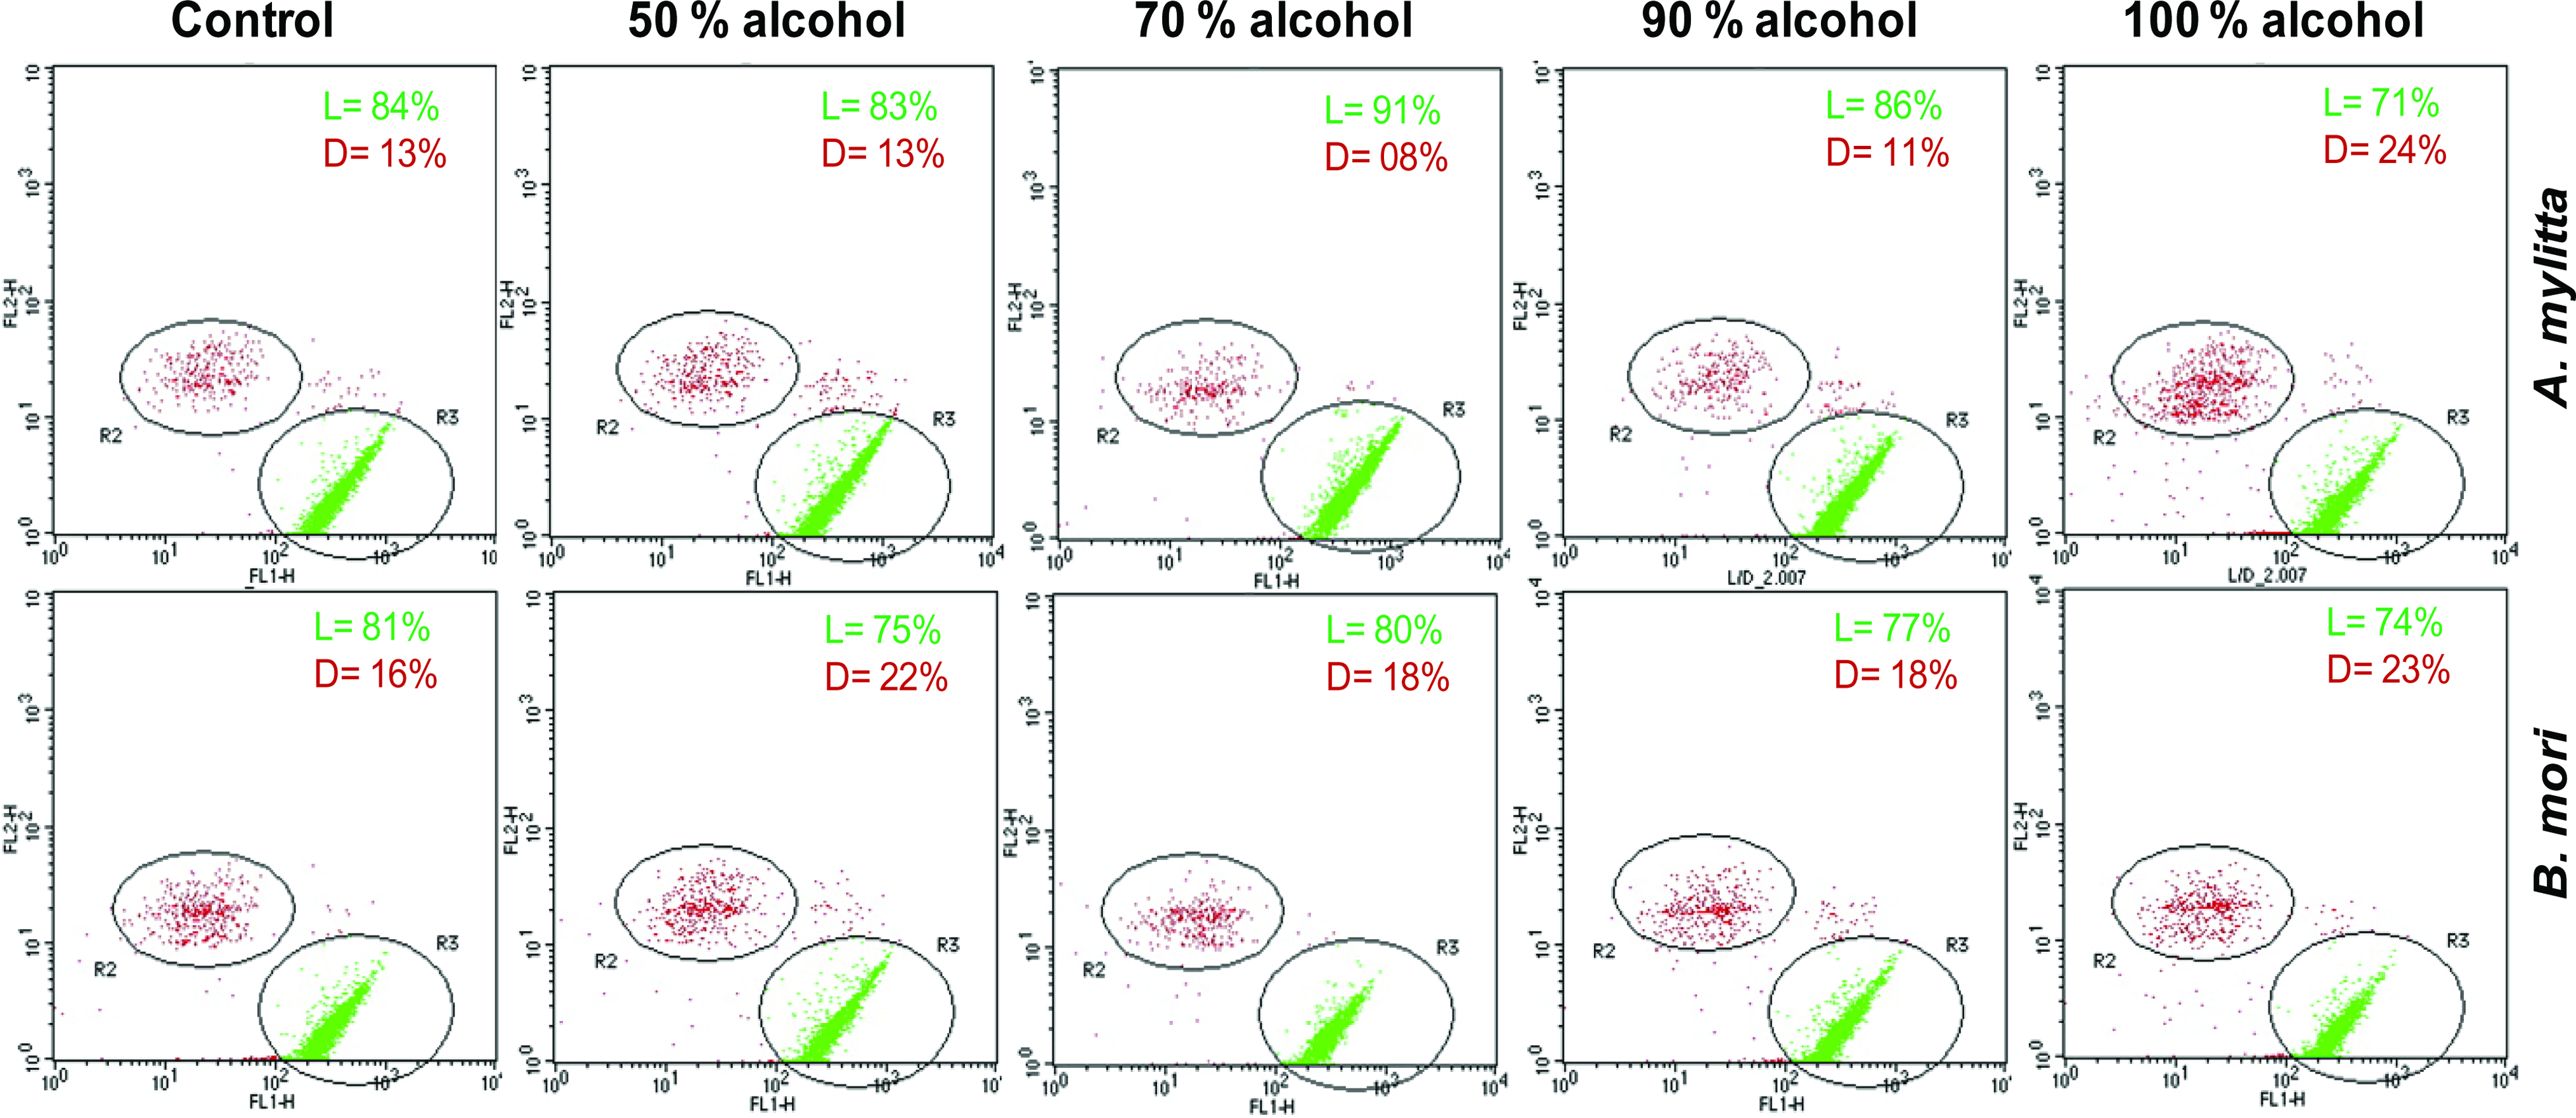
Flow cytometric data showing cell viability on nonmulberry A. mylitta and mulberry B. mori silk gland fibroin protein matrices and polystyrene plate (control) after 7 days of culturing. The viable cells are stained with calcein AM (green) and dead cells with ethidium homodimer-I (red). The percentage-gated viable and dead cells are shown in the inset in each representative figure (where, L indicates live and D indicates dead). Color images available online at www.liebertonline.com/ten.
Cell spreading on fibroin matrices
Cell responds to surface topology and integrin binding sequences that are evident from cell spreading and actin filament development on different surfaces. To ascertain the effect of integrin binding RGD sequences and nanoroughness on cell spreading due to varying alcohol treatment, confocal microscopic images were taken. Isolated rat BMCs spread uniformly on A. mylitta alcohol-treated films. In all varying alcohol-treated percentages, well spread out cell morphology, developed actin filaments, and clear condensed nuclei were visible (Fig. 8). The results were even better than control PCPs in terms of cell spreading as evident from cell spreading surface area. The results suggested normal cell growth on these fibroin protein films as evident from spread out actin filaments and rounded nuclei. However, in case of 100% (v/v) alcohol-treated films, cell spreading was minimal. The cells appeared to be narrow and clumped. To further elaborate the results, cell spreading area was calculated under each treatment condition separately. A. mylitta films covered more cell spreading area than control PCPs (Table 2). Maximum spreading area of 2610 ± 480 μm2 was observed for 70% (v/v) alcohol treatment condition compared with 1967 ± 500 μm2 for control PCPs. Least cell spreading was observed in case of 100% (v/v) alcohol treatment with an area of 1440 ± 359 μm2. These results suggest the effect of RGD sequences and surface topology on cell spreading. A difference in morphology was observed between cells grown on A. mylitta films compared with B. mori films. When compared, cells seeded on B. mori films were less spread out and were mostly elongated in shape (Fig. 9). Average cell length was approximately 90–95 μm and comparable to control PCPs in case of A. mylitta films, whereas cells were 130–135 μm in length in case of B. mori films (Table 2). Under high resolution, actin filaments were well developed on B. mori films but were compact and close to each other with rounded nuclei as compared to filaments, which are well spread out in A. mylitta films and PCPs (Fig. 8). In terms of cell spreading area, cells grown on B. mori films covered lesser cell spreading with maximum and minimum values of 1998 ± 320 and 1720 ± 640 μm2 in case of 70% and 100% (v/v) alcohol treatment conditions, respectively (Table 2).
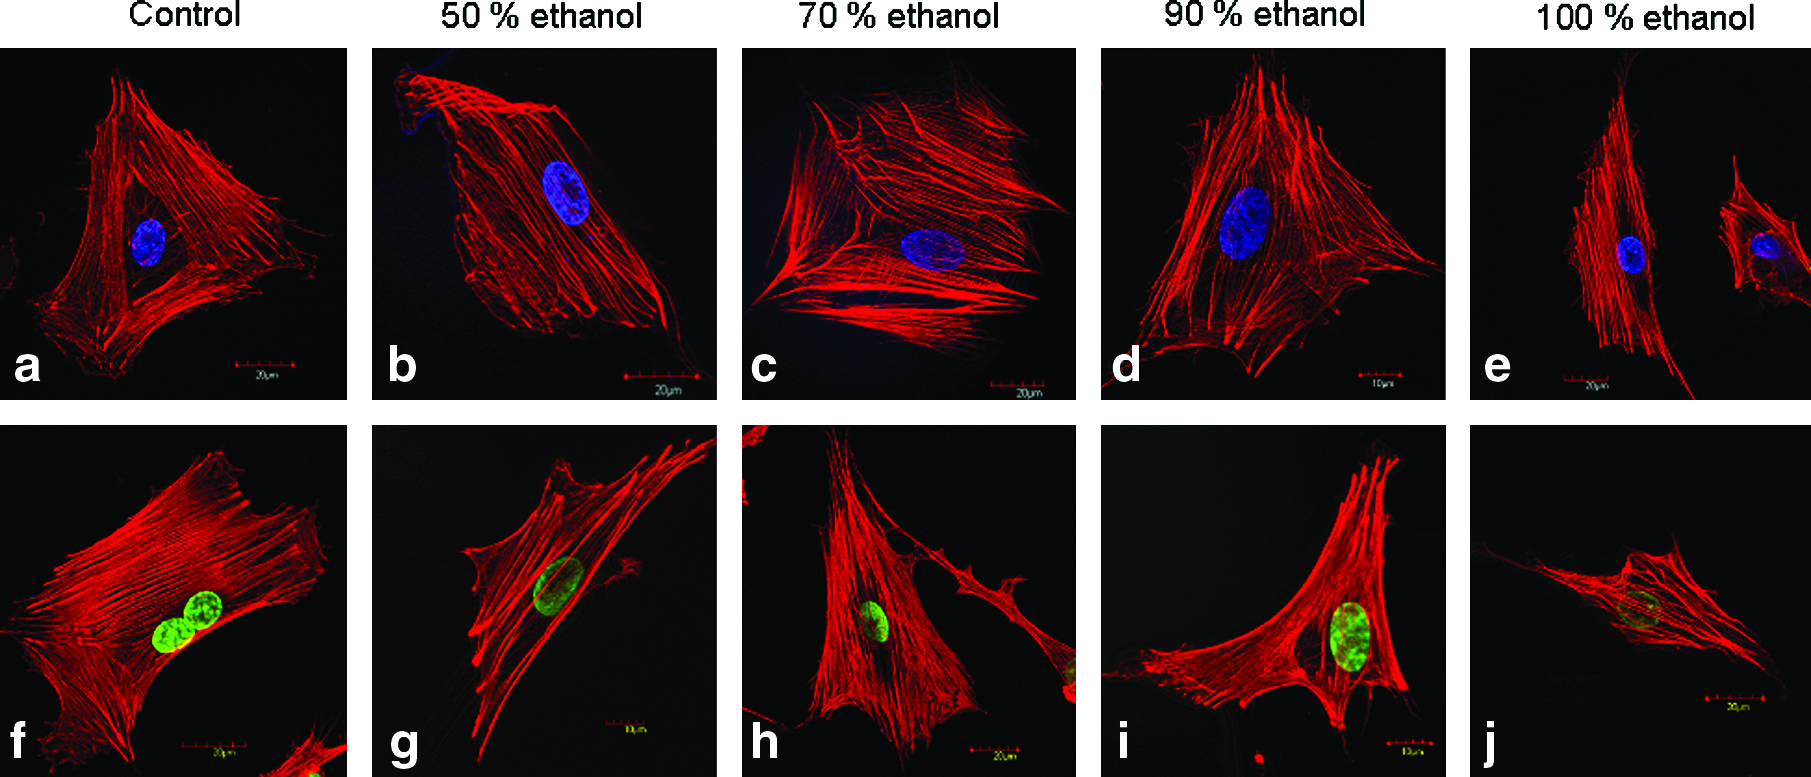
Rat BMC spreading and actin morphology on (
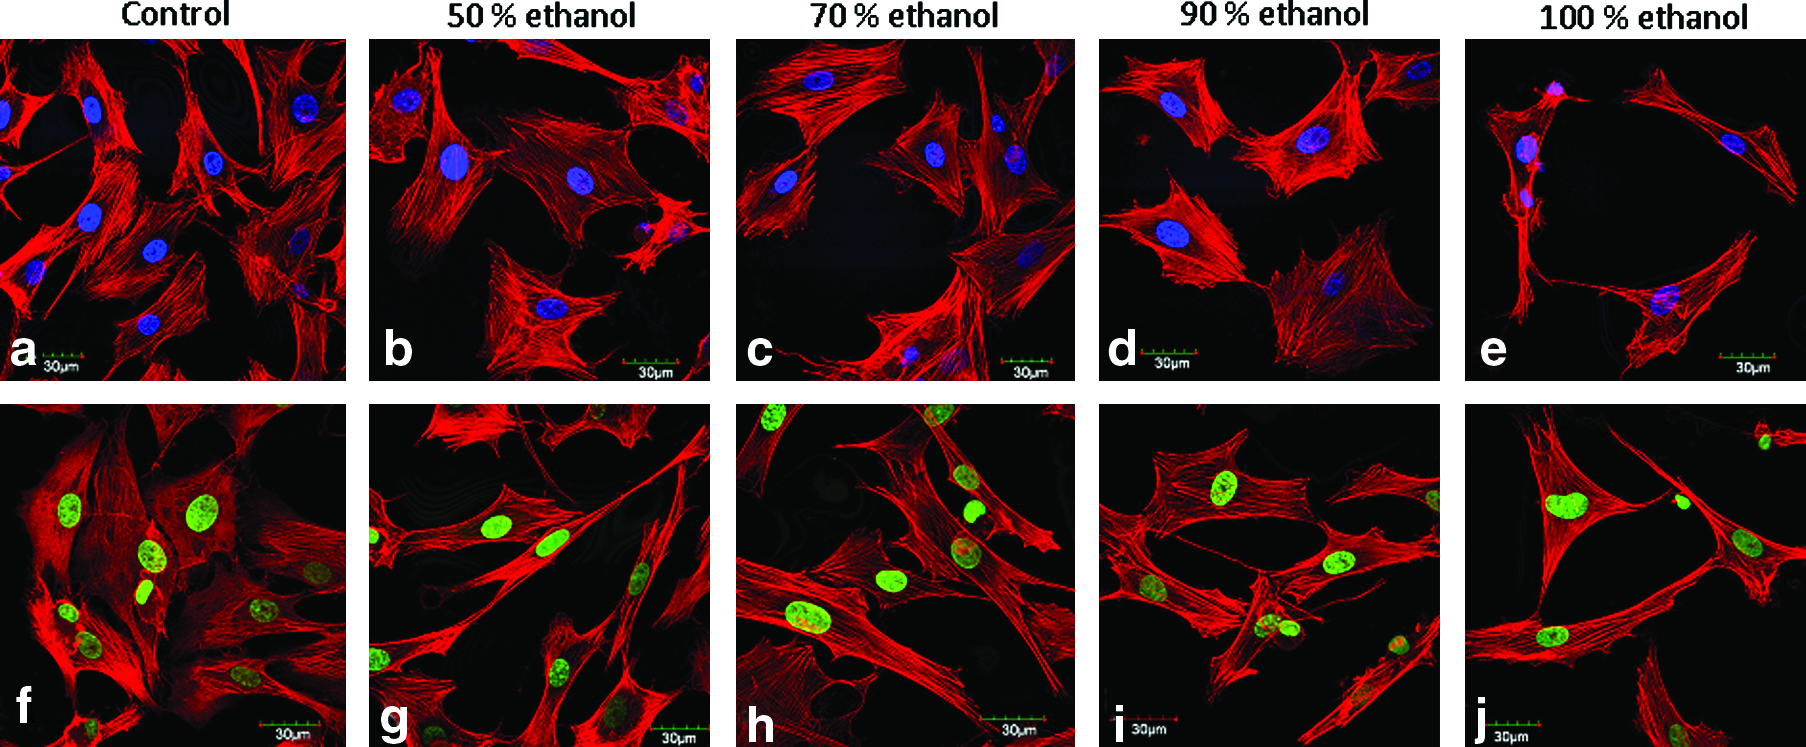
Rat BMC spreading on (
Actin filament organization
Studies have revealed that when cells are subjected to morphological and mechanical cues, they undergo internal cytoskeleton rearrangement leading to alternation in their overall cellular biochemistry. Thus, it can be concluded that different surface topology/geometry can infer different stresses resulting in fiber remodeling. This intricate changes may lead to change in fiber density, which in turn can alter overall cellular function. Thus, studies relating to changes occurring in cellular fiber arrangement in terms of actin filament development are most important to design/fabricate ideal surfaces for cellular applications. Confocal imaging was done to assess stress fiber distribution and arrangement of BMCs on both A. mylitta and B. mori silk fibroin (70% alcohol treated as a representative case) and PCP matrices (Fig. 10). The actin fibers were graphed in terms of color intensity (green to yellow, shown in figure inset), which represents their substrate binding intensities (minimum 0 to maximum 250). It is assumed that different color intensity values represent points of variable attachment force to substratum (directly proportional to amount of dye binding) and represent actin fiber development in a cell (greater dye binding represents higher intensities depicting matured and well-developed actin). In case of control PCPs, actin filaments were distributed throughout and they ran in parallel the entire length of the cell. High stress actin fibers (yellow) were predominantly located on the periphery of the cell, suggesting strong/intense binding on to the support PCPs. Actin fibers (red) were predominant throughout the cell in all sides, suggesting adherence to the support. When compared with cells grown on A. mylitta 70% (v/v) alcohol-treated films, the distribution of actin fibers was found to be similar to control PCP, suggesting intense binding to fibroin substratum. The actin fibers (both yellow and red) were distributed homogenously throughout and were observed running in parallel the entire length of the cell. In contrast, the cells grown on B. mori films represented elongated morphology with very closely arranged stress actin fiber development. Limited numbers of yellow and red actin fibers were observed on the periphery, depicting lesser substratum attachment points (Fig. 10). Predominantly low intensity actin fibers were observed throughout.
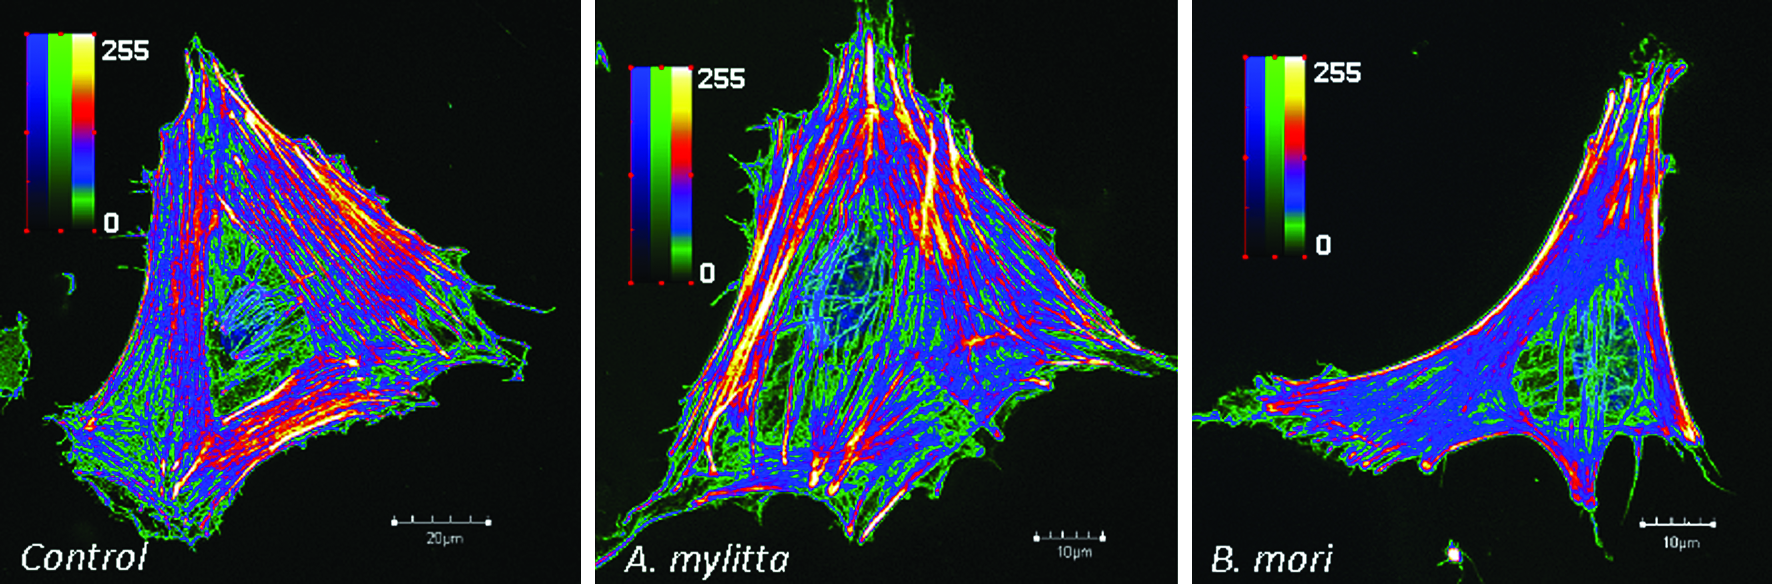
Development and distribution of actin filaments of rat BMC on polystyrene plates (control), and A. mylitta and B. mori silk gland fibroin protein matrices treated with 90% (v/v) alcohol. Color images available online at www.liebertonline.com/ten.
Discussion
Over the years researchers have demonstrated that cell–substrate interactions, spatial distribution, and arrangement of aggregates can regulate cell behavior even in submicron range. 4 In this study we demonstrate that regular surface architecture is not only essential in regulation of cellular processes but is also vital for normal cell physiology. To observe the effect of surface topography on cellular processes, we have chosen natural silk fibroin as a model protein from two different silkworms (mulberry and nonmulberry). In line with our quest, we have taken PCPs as control (which is the most common substratum for daily cell culture needs) for comparison and confirmation of our findings based on silk fibroin protein film surfaces.
We have further elaborated on the fact that apart from surface topography, presence/absence of RGD integrin binding sites within the silk substrate does play a significant role in cell attachment and proliferation. We have restricted our study on using biopolymers, naturally consisting of these integrin binding RGD sequences without the need of any external addition. Silk fibroin protein originating from two different silkworm sources, that is, mulberry (domesticated), B. mori, and nonmulberry (wild), A. mylitta, which differ not only in their amino acid compositions but also in presence/absence of integrin binding RGD sequences ideally, serves our study purposes. Nonmulberry wild silk fibroins of Antheraea pernyi and A. mylitta naturally contain RGD sequences.21,22 So far to our knowledge there are no such reports examining the presence of RGD sequences in mulberry silk fibroin protein. To avoid any anomaly and for validation of the results, the silk fibroin protein has been subjected to similar treatment for its dissolution in mild surfactant. The choice of bone marrow primary cells for this study was solely based on size and distinct actin pattern within the cells to monitor any subsequent change occurring due to altering of parameters.
The observed topological changes occurring due to graded alcohol treatment further suggest transition of regenerated fibroin protein, which is predominantly a random coil to β-sheet because of rearrangement of hydrogen bonds in the protein moiety. This observation is in line with our earlier findings that showed shift from silk I to silk II structure on alcohol treatment.10,11 Treatment with ethanol/methanol further accelerated this rearrangement process by diffusing into the fabricated films and inducing swelling. Weakening of hydrogen bonds led to rearrangement of silk fibroin molecules into more stable β-sheet secondary structure.23,24 It may be hypothesized that due to the difference in water content (in different grades of ethanol used), effective swelling and degree of secondary structure transition has been different. This has led to differences in stretching force induced on these silk films during drying process, leading to attainment of various levels of nanoroughness features. In all cases, average roughness and mean height of aggregates formed have been lower when higher water content was present (50% alcohol). This further supports that water has a chain relaxation effect making the surface smoother during the process of swelling and drying of silk films. Once silk films were treated with alcohol and dried in air, they maintained their insolubility and topographical features even on wetting. In case of 100% ethanol treatment, due to lack of water molecules there is sudden drying of the films, which has led to highly stretched condition, thus giving rise to highly rough surface.
Previous studies on material surface roughness had revealed slowing down of cell proliferation rate on rougher surfaces.25–29 This further suggests that only in a range of critical roughness, cells respond to higher proliferation. In line with these reported results, our studies showed that Rms roughness and mean height values below 1 and 7 nm, respectively, observed in case of A. mylitta films play a positive role in cellular proliferation. However, not much of a difference in growth rate was observed in between this range. Remarkably, in case of B. mori films, due to observed higher Rms roughness (2.12–3.28 nm) and mean height (9.5–12.8 nm) on subsequent alcohol treatment, cell proliferation was low compared with A. mylitta films and control PCP surface. This might be due to the absence of RGD sequences in B. mori. It might also be stated that the critical roughness range is an important parameter and anything below or beyond the range affects the cellular processes.
Although nanoroughness had some role on cell proliferation, it had limited effect on cell attachment, detachment, and also on subsequent cell spreading behavior. The governing factor that seems to play was the presence and absence of integrin binding arginine-glycine-aspartic acid (RGD) sequences. RGD sequences assist in cellular attachment and physiological processes.30–32 The requirement of cellular attachment time was less in A. mylitta films than in control and B. mori films. Similarly, binding force, that is, between cells and substratum, was higher as observed from cell detachment studies in case of A. mylitta films. This might be due to the presence of integrin binding sequences, which helped in firm binding to the substratum. Further, no observable differences were noticed in cell attachment and detachment time on graded alcohol-treated surfaces within A. mylitta or B. mori groups, thus further justifying RGD to be the major role player in the observed differences.
Effects of RGD were more pronounced in cell spreading experiments carried out using both types of silk proteins. Not only did A. mylitta films support proliferation, but also cells were spread out with well-developed actin filaments throughout the cell surface. Due to the presence of RGD, A. mylitta supported better cell spreading than control PCPs. In case of B. mori films, cell spreading area was comparable to that of control. This observation further confirms that the presence of RGD has pronounced effect and has a major role to play on cell spreading (as observed in A. mylitta) even when roughness of the surface is within a close range (control compared to B. mori).
Development of actin filaments and spreading on different substratum may be attributed due to the presence/absence of RGD in milieu with topological nanoroughness changes occurring due to subsequent alcohol treatment. The cells were observed to develop strong binding junctions with the substratum, particularly at the periphery. Appearance of these filaments throughout the cell membrane surface in case of A. mylitta further indicates the pronounced effect of RGD for enhanced binding. Cells recognize these sequences and surface features and react to them, resulting in contact guidance. On detection of a suitable site for adhesion, focal adhesions and mature actin fibers are formed; this leads to recruitment of tubulin microtubules that stabilize the contact. 33 The ability of the substrates to promote formation of these focal contact points and development of cytoskeleton is vital for the performance of the material.
Differential adsorption of serum proteins, that is, fibronectin, vitronectin, and laminin, on surfaces benefits actin development and spreading.34–36 This assumption might safely be nullified in the present study as the experiments were carried out under similar growth conditions with similar serum supplements. Also, the observed changes in nanoroughness within the experimental silk and control substrates were in the small nano range (1–12 nm, mean height), thus abruptly not effecting the protein adsorption rate to show any positive effect on actin spreading and development.4,37,38
Integrins located within the adhesions, and actin cytoskeleton linked to integrins are involved in signal transduction pathways. 38 The signal transductive events locating from focal contacts do affect long-term cell differentiation.39–41 Nature of actin fiber alpha-smooth muscle versus f-actin and the isotropy of the cell, in addition to fiber alignment, are reported to be more susceptible to redifferentiation upon exposure to exogenous biological signals like FGF-2 and mechanical cues and surface topography favoring differentiation of stem cells.1,42–44 The aspect of mechanical cues imparted by these films using different sources cannot completely be nullified at this point of time. A. mylitta was shown to have higher mechanical strength than B. mori films, and this may further justify differences in results obtained for nonmulberry silk fibroin.10,11
Conclusions
This study provides a significant insight into the topographical cues playing role in cell morphology and growth. Not only does nano-structuring of materials provide a powerful mechanism to encourage and direct cell behavior ranging from cell adhesion to gene expression, but also the nanocues, such as those presented in this study, may prove to be important in tissue-specific stem cell differentiation applications. 1 Changes in cytoskeletal tension in response to cues, such as topography, could led to change in interphase nucleus organization and hence directly influence cellular gene expression profiles.45,46 In practical applications, these nanocues could effectively be used to stimulate bone growth resulting in reduction of aseptic loosening and failure of implants. 47 Similarly, one could effectively use these engineered nanoscale features as biotechnological culture supports in implanted biosensors, neural interfaces, and other structural medical implants to reduce fibrous encapsulation and allow stronger interfacing with the host tissue for a longer period.48,49
In this study, nonmulberry A. mylitta silk fibroin films showed higher cell proliferation rate, cell attachment, viability, and cell spreading than mulberry silk fibroin from B. mori due to the inherent morphological and biochemical differences. Further, using silk fibroin we could able to produce nanoroughness in the order of few nanometers over a large area using a very simple graded alcohol treatment method. We envisage that alcohol-induced nanoroughness on silk fibroin matrices can safely be implemented onto implant devises in future to achieve enhanced cell support, proliferation, and differentiation of cells.
Footnotes
Acknowledgments
Department of Biotechnology and its bioinformatics facility (BT/PR6035/MED/14/733/2005), Indo-Australia Biotechnology Fund (BT/PR9552/ICD/16/755/2006), Council of Scientific Industrial Research (for fellowship to B.B.M. and S.D.), Govt. of India, Indo-U.S. Science and Technology Forum, New Delhi, are acknowledged for financially supporting this work.
Disclosure Statement
No competing financial interests exist.