




Abstract
When incubated under simulated microgravity (s-μg), endothelial cells (EC) form tubular structures that resemble vascular intimas. This delayed formation of 3D EC structures begins between the 5th and 7th day of culturing EC under conditions of s-μg, when double-row cell assemblies become visible. With the aim of learning about this initial phase of tubular structure formation, we found that NFκBp65 protein content was similar in all cell populations, but gene and protein expression of phosphokinase A catalytic subunit, phosphokinase Cα, and extracellular signal-regulated kinases 1 and 2 was altered in cells cultured under s-μg. Apoptosis remained below 30% in all EC cultures. In contrast to controls, the 7-day-old s-μg cultures contained 3D aggregates with proliferating cells, enhanced numbers of necrotic cells, and osteopontin-negative EC as well as supernatants with reduced quantities of vascular endothelial growth factor (VEGF), basic fibroblast growth factor (bFGF), soluble TNFRSF5, TNFSF5, intercellular adhesion molecule-1, tumor necrosis factor receptor 2, IL-18, complement C3, and von Willebrand factor. VEGF and/or bFGF (10 ng/mL) application influenced the accumulation of proteins in supernatants more profoundly under 1 g than under s-μg. These findings provide evidence that phosphokinase Cα plays a key role in tube formation. Improving the interaction of VEGF and/or bFGF with EC under s-μg could enhance the engineering of vascular intimas.
Introduction
Recently, we described a type of 3D tubular structure (TS) that is formed by endothelial cells (EC) and closely resembles the vascular intima. TS are cylindrical and surrounded by walls consisting mainly of single-layered EC. They elongate to reach lengths of a few cm after 28 days of incubation on a desktop RPM. 7 They can then be harvested and may be used to study the functions of blood vessel intimas or for engineering whole blood vessels.
So far what we know about TS formation is that early kinds of cellular cylinders become visible after 2 weeks of exposure of EC to s-μg. Their progenitors are small cell colonies formed of elongated or double-row rod-like cell aggregates. They are formed between the 5th and the 7th day of incubation on a desktop RPM, when some EC, which are still adhered to the culture flasks, spread across neighboring adherent EC. Therefore, we were interested to learn more about the origin and the development of these structures, with the aim of improving our ability to engineer TS.
We examined human EC of the EA.hy926 cell line and their supernatants after exposure to s-μg for 7 days, and compared them to EC of 7-day-old 1 g control cultures and 28-day-old s-μg cultures. For this purpose, we quantified a series of markers bound either to the cells or secreted into the culture medium (Table 1). The markers cover a number of functions involved in the formation of blood vessels. They were investigated by measuring the concentrations of proteins and their corresponding mRNAs. The data obtained were compared to the EC's aggregation, apoptosis, and proliferation in plain medium or in medium containing the angiogenic growth factors vascular endothelial growth factor (VEGF) and basic fibroblast growth factor (bFGF). In addition, we focused on possible signaling pathways involved in the process of tube formation and investigated expression of phosphokinase C (PKC) and of extracellular signal-regulated kinases 1 and 2 (ERK1/2) under s-μg, because PKCα is required for EC growth and vessel formation. 8
VEGF, vascular endothelial growth factor; bFGF, basic fibroblast growth factor; TNF-R1, tumor necrosis factor receptor 1; ICAM, intercellular adhesion molecule; VCAM, vascular cell adhesion molecule; EGF, epidermal growth factor.
The results revealed that the secretion of several proteins, including the soluble forms of membrane receptors, was influenced by VEGF and/or bFGF in 1 g as well as s-μg conditions. Significant synergism between the growth factors and s-μg was only observed in terms of the release of the interleukins IL-1α, IL-8, IL-12, and IL-18.
Materials and Methods
RPM
Microgravity was simulated by a desktop RPM manufactured by Dutch Space, an EADS-Astrium company (Leiden, Netherlands). Under the control of dedicated software, the RPM enables a random 3D positional change in the biological specimen. 9 The samples were mounted close to the center of the platform on the RPM, which was then placed in an incubator under standard cell culture conditions at 37°C and 5% CO2.
Cell culture procedure
The human endothelial EA.hy926 cells 10 were grown in Dulbecco's modified Eagle's medium (Invitrogen, Eggenstein, Germany), supplemented with 10% fetal bovine serum (Biochrom, Berlin, Germany), 100 units penicillin/mL, and 100 mg streptomycin/mL. The cells were grown in 25 cm2 culture flasks (Sarstedt, Nürnbrecht, Germany) until subconfluent monolayers were formed. The flasks were then randomized to s-μg and static controls samples containing vehicle (saline 0.9%), human VEGF-165 (10 ng/mL; Chemicon, Hofheim, Germany), human bFGF (10 ng/mL; Chemicon), or 10 ng/mL VEGF-165 and 10 ng/mL bFGF. These were then incubated immediately on the desktop RPM and under control 1 g gravity according to the experimental design. At set time points (days 4, 7, 11, 15, 18, 22, and 25) the various cell populations were fed by removing 50% of the cell medium by pipettes, carefully avoiding sucking off the floating 3D aggregates or damaging adherent cells, and adding new culture medium.
At day 7, cells and the cell supernatant were harvested in three steps:
After a period of 10 min for particle sedimentation at 1 g, 80% of the supernatant was carefully removed, avoiding sucking off floating 3D aggregates or damaging adherent cells. This fluid was immediately freed from nonsedimenting single cells and cell debris by centrifugation and then used for determination of the micromilieu
11
or frozen and stored at −80°C until analysis. The remaining 20% of the culture medium was removed from the culture flasks together with the 3D aggregates, which were prepared for analyses. The adherent cells were scraped off and prepared for analyses. When indicated, steps 2 and 3 were combined.
As 1 g control cultures were almost confluent after 11 days and had to be subcultured, only 7-day-old static 1 g cultures were used for the experiments. At days 21 and 28, the visible 3D aggregates were first removed by tweezers, and then the supernatant was harvested and treated as described above. Finally, adherent cells were scraped off. For the flow cytometry procedure, the cells were trypsinized to obtain a single-cell suspension of adherent EC.
Morphology of the TSs
EC were stained either with hematoxylin and eosin 3 or immunohistochemically using monoclonal antibodies against VEGF (Sigma-Aldrich Chemie, Taufkirchen, Germany), and osteopontin (Developmental Studies Hybridoma Bank, Department of Biological Sciences, University of Iowa, Iowa City). Antigen-antibody complexes were observed by the streptavidin–biotin method.7,12 Phase contrast microscopy (Carl Zeiss, Jena, Germany) of all samples was performed and revealed the growing 3D tubular constructs as shown in Figure 1A (inset) and 1C.
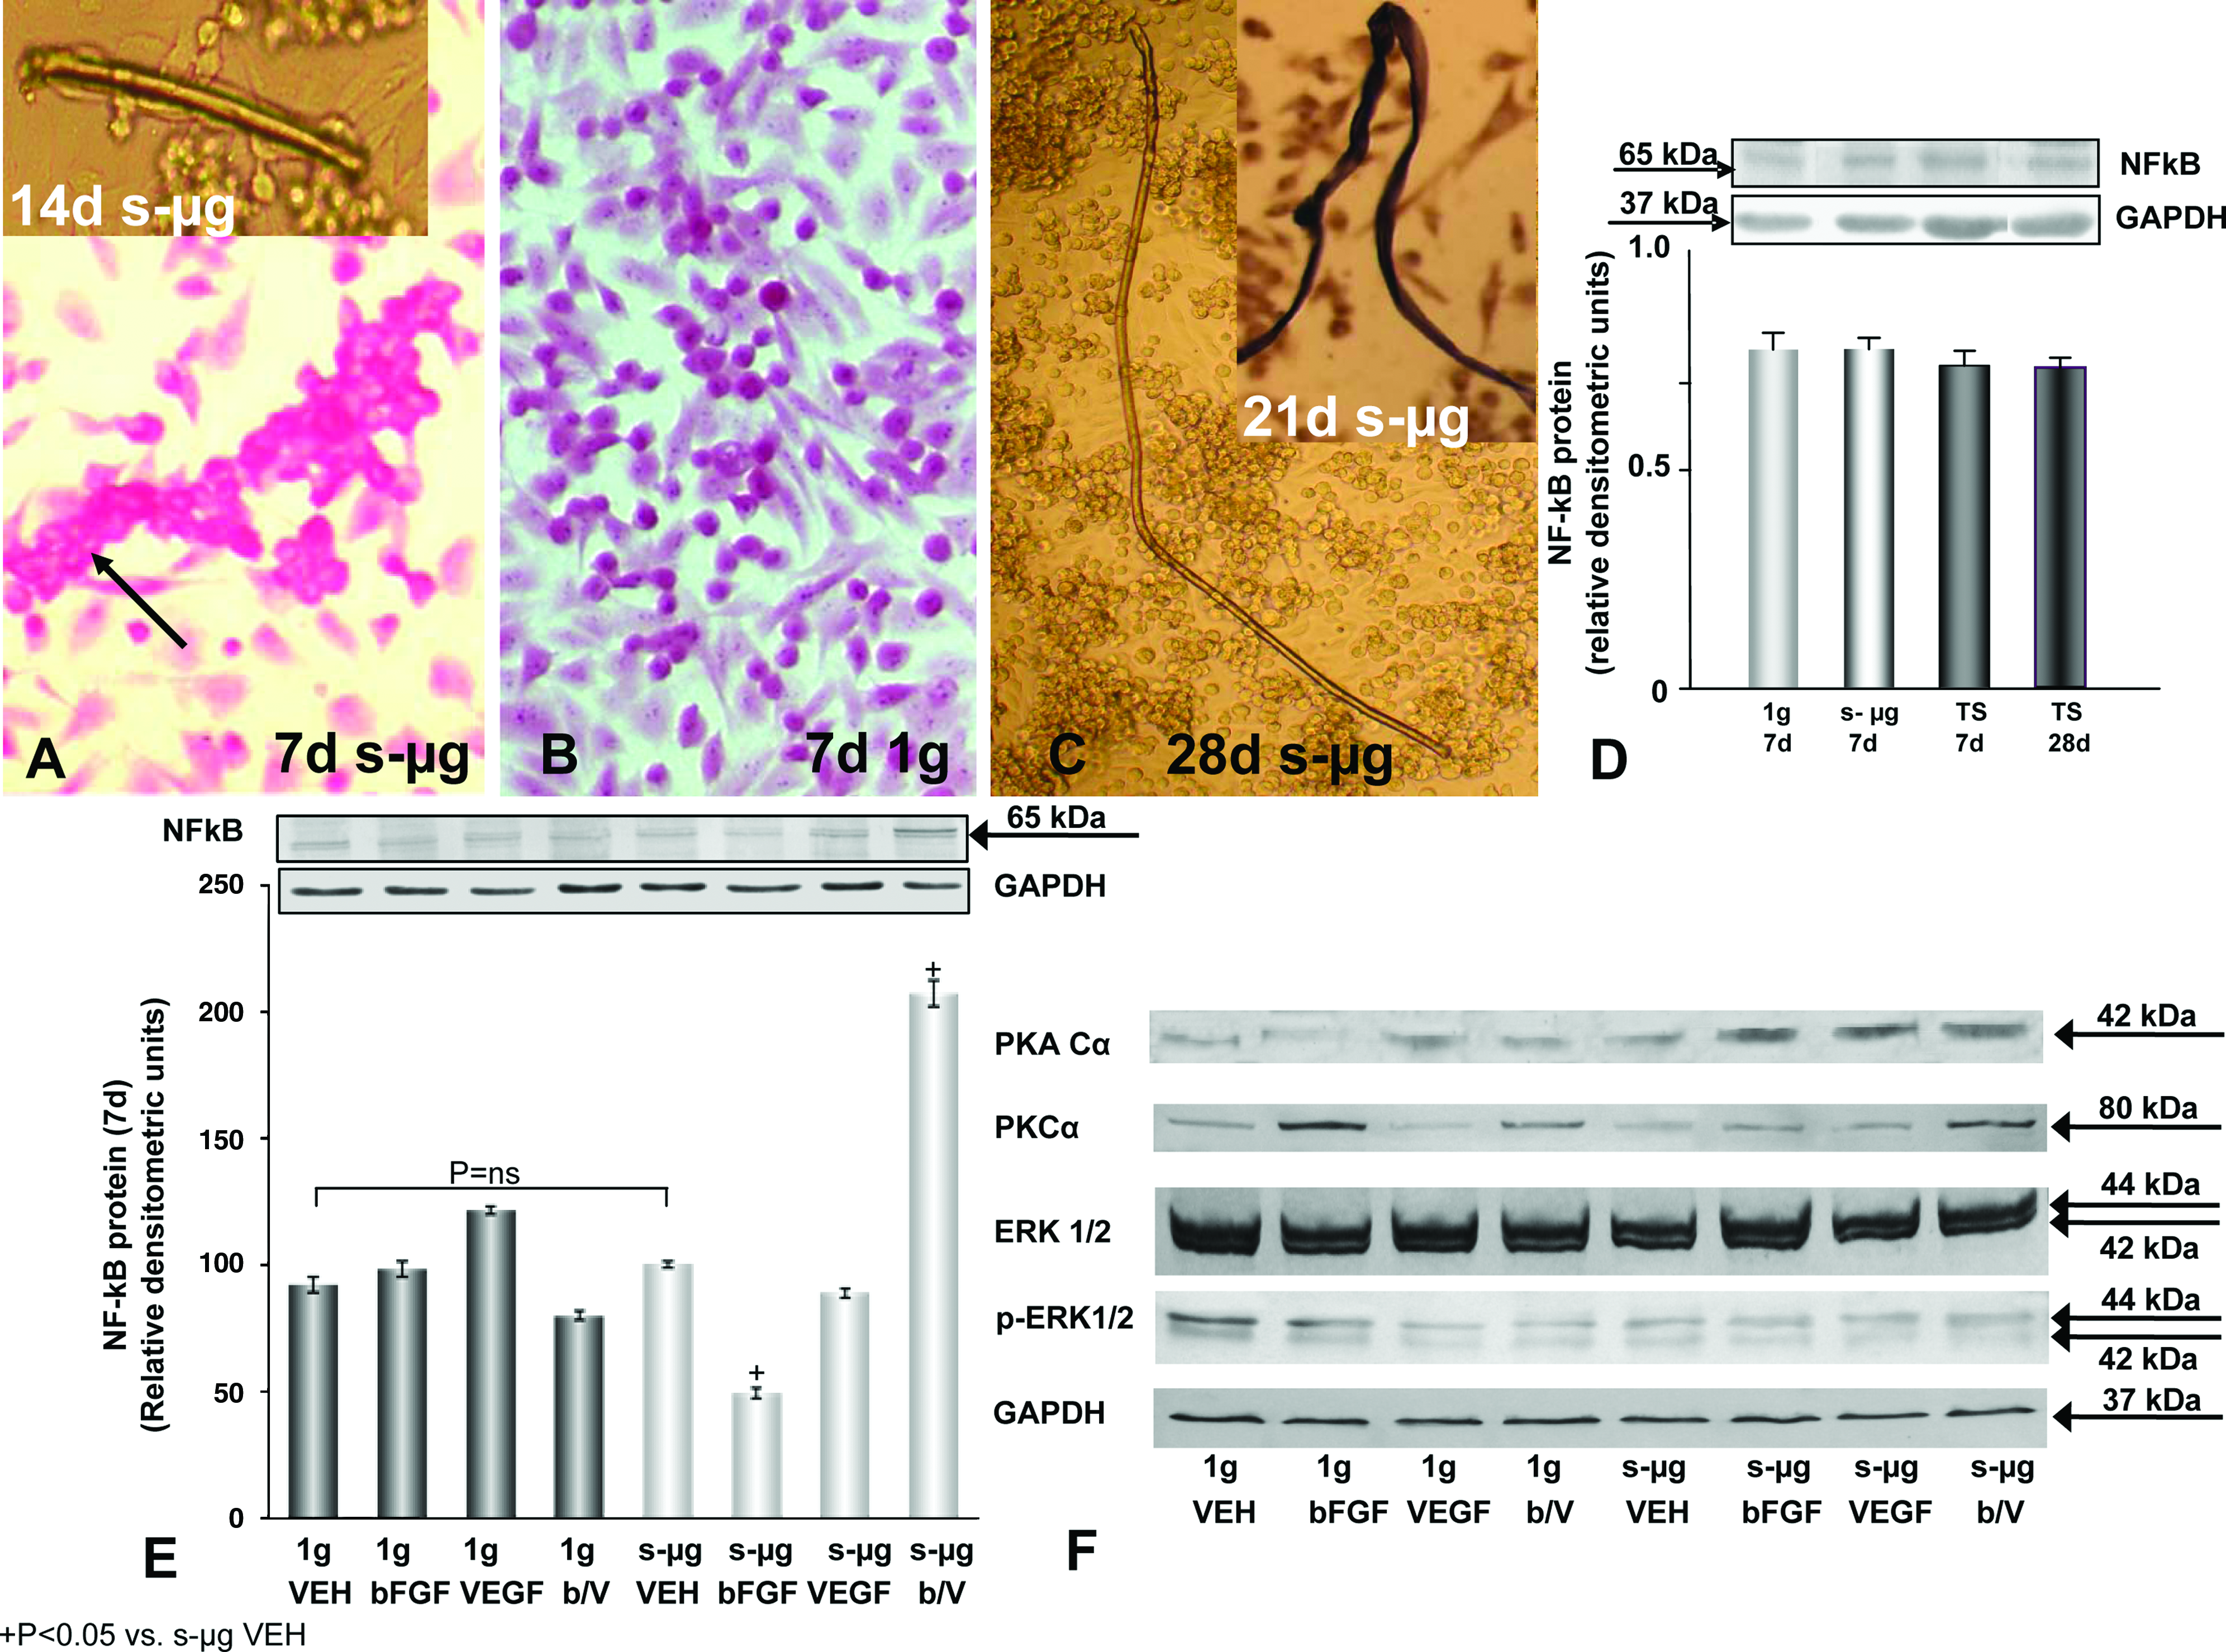
Endothelial cells (EC) cultured on a random positioning machine for 7 days (
Cytokine measurement by multiplex array assay
Proteins secreted into the supernatant by the cells were analyzed according to the Multiplex Array Assay technology as described.11,13 The beads used contained antibodies against TNFRSF5 (CD40), TNFSF5 (CD40L), the intercellular adhesion molecule-1 (ICAM-1), the vascular cell adhesion molecule-1 (VCAM-1), the tumor necrosis factor receptor 2 (TNF-R2), the interleukins 1α, 8, 12p40 and 18 (IL-1α, IL-8, IL-12p40, IL-18), the epidermal growth factor (EGF), TNF-α, glutathione S-transferase, von Willebrand factor, and the third component of the complement system (complement C3). The concentrations of the proteins dissolved in the culture supernatants were measured using standard curves obtained from serial dilutions of each cytokine. A regression analysis was performed to derive an equation used to calculate the concentration of the unknown samples.
RNA isolation
Total RNA from EA.hy926 cells was isolated with the Qiagen Minikit (Qiagen, Hilden, Germany) according to the manufacturer's instructions. The isolated RNA had an A260/280 ratio of >1.5. The quality of the RNA was checked by agarose gel electrophoresis, and no degradation was seen. RNA concentrations were determined spectrophotometrically at 260 nm. A total of 2 μg mRNA was added to 40 μL RT-mixture. Of this, 1 μL was used for each TaqMan reaction.
Quantitative real-time PCR (TaqMan PCR)
We used real-time quantitative PCR (RTq-PCR)12,13 to quantify the expression levels of the genes of ICAM, VCAM, osteopontin (OPN), VEGF, TNFRSF5, TNF-α, phosphokinase A (PKA), PKC, and ERK1/2 (Table 2). Six samples of each group were investigated. The appropriate primers and fluorogenic probes were designed using Primer Express® software. The ABI PRISM® 7000 SDS instrument in conjunction with the ABI TaqMan Universal Master Mix and the SYBR® Green PCR Master Mix (Applied Biosystems, Darmstadt, Germany) were used to perform the assays. The reaction volume was 25 μL with a final concentration of 500 nM for the primers and for TaqMan reactions 200 nM for the probes. The PCR conditions were set as recommended by the manufacturer. The primers and fluorogenic probes were synthesized by TIB Molbiol (Berlin, Germany) and Applied Biosystems (Table 2). Relative quantification was achieved by means of the comparative CT method, which involves comparing the CT values of the samples of interest with a control or calibrator such as a non-treated sample. Each sample was measured in triplicate. To normalize our expression data, we utilized 18S rRNA as a housekeeping gene.
The 18S-probe was labeled with the reporter dye FAM at the 5′-end and with the quencher dye TAMRA at the 3′-end. If no probe is given, the assay was SYBR Green based. Relative quantification was effected by means of the comparative CT method, which involves comparing the CT values of the samples of interest with a control or calibrator such as a non-treated sample. Every sample was measured in triplicate. To normalize our expression data, we utilized 18S rRNA as a housekeeping gene.
ERK1, extracellular signal-regulated kinases 1.
Western blot analysis
Sodium dodecyl sulfate–polyacrylamide gel electrophoresis, immunoblotting, and densitometry were carried out on six replicates following routine protocols (n = 6 each group). 3 Protein determination was done with the bicinchonic acid system (Pierce, Rockford, IL, USA) using bicinchonic acid system as a standard. Antibodies against these proteins were applied: nuclear factor kappa B subunit p65 (NFκBp65; Santa Cruz Biotechnology, Santa Cruz, CA), bax and bcl-2 (both Millipore, Schwalbach, Germany), activated caspases-8 and -9, PKA catalytic subunit α, PKCα (all Cell Signaling Technology, Beverly, MA), ERK1/2, p-ERK1/2 (both Cell Signaling Technology), Ki-67, activated caspase-3 (both Abcam, Cambridge, MA), and TNF-R1 (ABR-Affinity BioReagents, Golden, IL). As a control for sample loading we used glyceraldehyde 3-phosphate dehydrogenase (ABR-Affinity BioReagents). Western blots were quantitated by densitometry (Molecular Dynamics Personal Densitometer No. 50301, Krefeld, Germany). 11
Flow cytometric analysis of cellular antigens
In each test, monoclonal antibodies were added to 105 single cells that had been prepared and fixed in ethanol (70%) as described previously.3,13 We used six samples per group (n = 6). The cells were incubated with unconjugated antibodies (caspase-3 (Santa Cruz Biotechnology), and osteopontin (Developmental Studies Hybridoma Bank, University of Iowa, Department of Biological Sciences, Iowa) for 60 min at room temperature in darkness and washed three times with phosphate-buffered saline containing 2% fetal calf serum. The cells were treated again for 45 min at room temperature with fluoresceinisothiocyanate (FITC)-conjugated anti-mouse-IgG antiserum (DAKO, Hamburg, Germany) and washed. The cell suspensions were analyzed with a Facscan flow cytometer (Becton Dickinson, Heidelberg, Germany) equipped with an argon laser. Cells with fluorescence intensities above the upper limit of the negative control distribution were considered positive.
Annexin V-FITC/propidium iodide assay
The Annexin V-FITC/propidium iodide (PI) assay was performed using the Annexin V-FITC apoptosis detection kit II (BD Pharmingen, San Diego, CA) according to the manufacturer's instructions. 14 Six culture flasks per time point were investigated (7 and 28 days, n = 6 each time point). Briefly, 1 × 10⁶ cells were treated with FITC-labeled antibodies against Annexin V and PI. The Annexin V-FITC(−)/PI(−) cells were considered as normal healthy cells, whereas Annexin V-FITC(+)/PI(−) or Annexin V-FITC + /PI + cells were taken as a measure of early apoptosis or necrosis, respectively. About 1 × 10⁴ events were acquired for each experimental point via a Facscan flow cytometer (Becton Dickinson) equipped with an argon laser and analyzed with WinList software (Verity Software House, Topsham, ME).
Statistics
Statistical analysis was performed using SPSS 12.0 (SPSS, Inc., Chicago, IL). All data are expressed as means ± SD. We tested all parameters for deviations from a Gaussian distribution by the Kolmogorov–Smirnov test and compared the cases using the independent-samples t-test or Mann–Whitney U-test (depending on the results of the normality test). Differences were considered significant at the level of p < 0.05. For the cytokine and growth factor measurements, comparisons between various groups were performed using the paired Student's t-test. A p-value <0.05 was considered statistically significant.
Results
When a culture flask containing a subconfluent monolayer of EC had been incubated on an RPM for 7 days, three types of EC could be distinguished. EC grew either within a monolayer adhering to the bottom of the culture dish, or within an elongated cellular aggregate floating in the medium or within an assembly of cells consisting mainly of two cell rows still in contact with the plastic dish surface (Fig. 1A). Double-row cell assemblies as shown in Figure 1A (arrow) were considered to be progenitors of the elongated cylindrical structures, which were harvested from 2-week-old s-μg cultures (Fig. 1A, inset). They were never observed in static 1 g control cultures, in which cells grew within monolayers (Fig. 1B). Nor were they observed in s-μg cultures incubated for longer than 10 days, which contained elongated cellular aggregates (Fig. 1C). We thus hypothesized that a situation arises in s-μg cultures around the 7th day of exposure to s-μg that favors the formation of rod-shaped cell assemblies and initiates their development to TS. Therefore, we decided to characterize 7-day-old s-μg cultures. For this purpose, we quantified the series of markers shown in Table 1. Their polypeptides and corresponding mRNAs were measured in cells or fluids of EC cultures incubated either for 7 days under s-μg or for 7 days under 1 g or for 28 days under s-μg conditions.
First, we investigated NFκBp65, an inducible transcription factor that controls a number of genes involved in cell proliferation, apoptosis, and angiogenesis. This marker was found in all cell populations at quite similar concentrations, irrespective of whether cells were adherent after 7 days under 1 g or s-μg or were incorporated in aggregates floating in 7- or 28-day-old s-μg cultures (Fig. 1D). Growth factor application had no impact on NFkBp65 under normal 1 g conditions, whereas, under s-μg, combined bFGF/VEGF treatment elevated, but bFGF reduced the content of NFκBp65 (Fig. 1E).
As NFκBp65 activity is influenced by PKC and phosphorylated ERK1/2, 15 these kinases were determined. Western blot analyses revealed that ERK1/2 was unaltered, but PKC and phosphorylated ERK1/2 were lowered in s-μg exposed cells as compared to 1 g control cells (Fig. 1F). In contrast, PKA concentration was slightly enhanced under s-μg. This suggested transcriptional changes.
Therefore, the effects of such changes on cell proliferation and apoptosis were investigated. First, we examined the proliferation marker Ki-67. Equal amounts of Ki-67 were found in EC that were adherent under 1 g and s-μg conditions. Ki-67 was reduced by about 50% in cells of 3D aggregates floating in the culture medium after 7 days under s-μg and was undetectable in TSs of 28-day-old s-μg cultures (Fig. 2A). Second, we measured the amount of apoptotic cells in EC cultures according to the Annexin V method (Fig. 2B). These analyses proved that most of the EC were alive in all three cultures, although the s-μg exposed cell populations contained 25–50% more apoptotic cells than control populations. However, the 7-day-old s-μg cultures contained the largest number of dead cells. Like the 28-day-old s-μg cultures, they contained about 27% of apoptotic cells, but, in addition, they also included a larger number of necrotic cells (Fig. 2B).

(
An important pro-apoptotic component is activated caspase-3. Flow cytometry analysis showed that 28-day-old s-μg and 7-day-old 1 g EC populations contained equal numbers of caspase-3-positive cells, whereas the 7-day-old s-μg cultures contained more (Fig. 2C). As caspase-3 promotes apoptosis, after its activation, we determined the amount of pro- and activated caspase-3 molecules in the various populations (Fig. 2D). First, we focused on the extrinsic pathway of apoptosis and detected an elevated TNF-R1 protein in s-μg (Fig. 3A). More caspase-3 may be cleaved in cells exposed to s-μg either by active caspase-8, which was found at higher levels compared to the control (Fig. 3B) as well as by active caspase-9 which was increased together with an elevated ratio of bax/bcl-2 in s-μg samples (Fig. 3C, D). It is of interest that production of both, caspase-8 and 9, is tremendously stimulated in the presence of bFGF/VEGF (Fig. 3B, D).
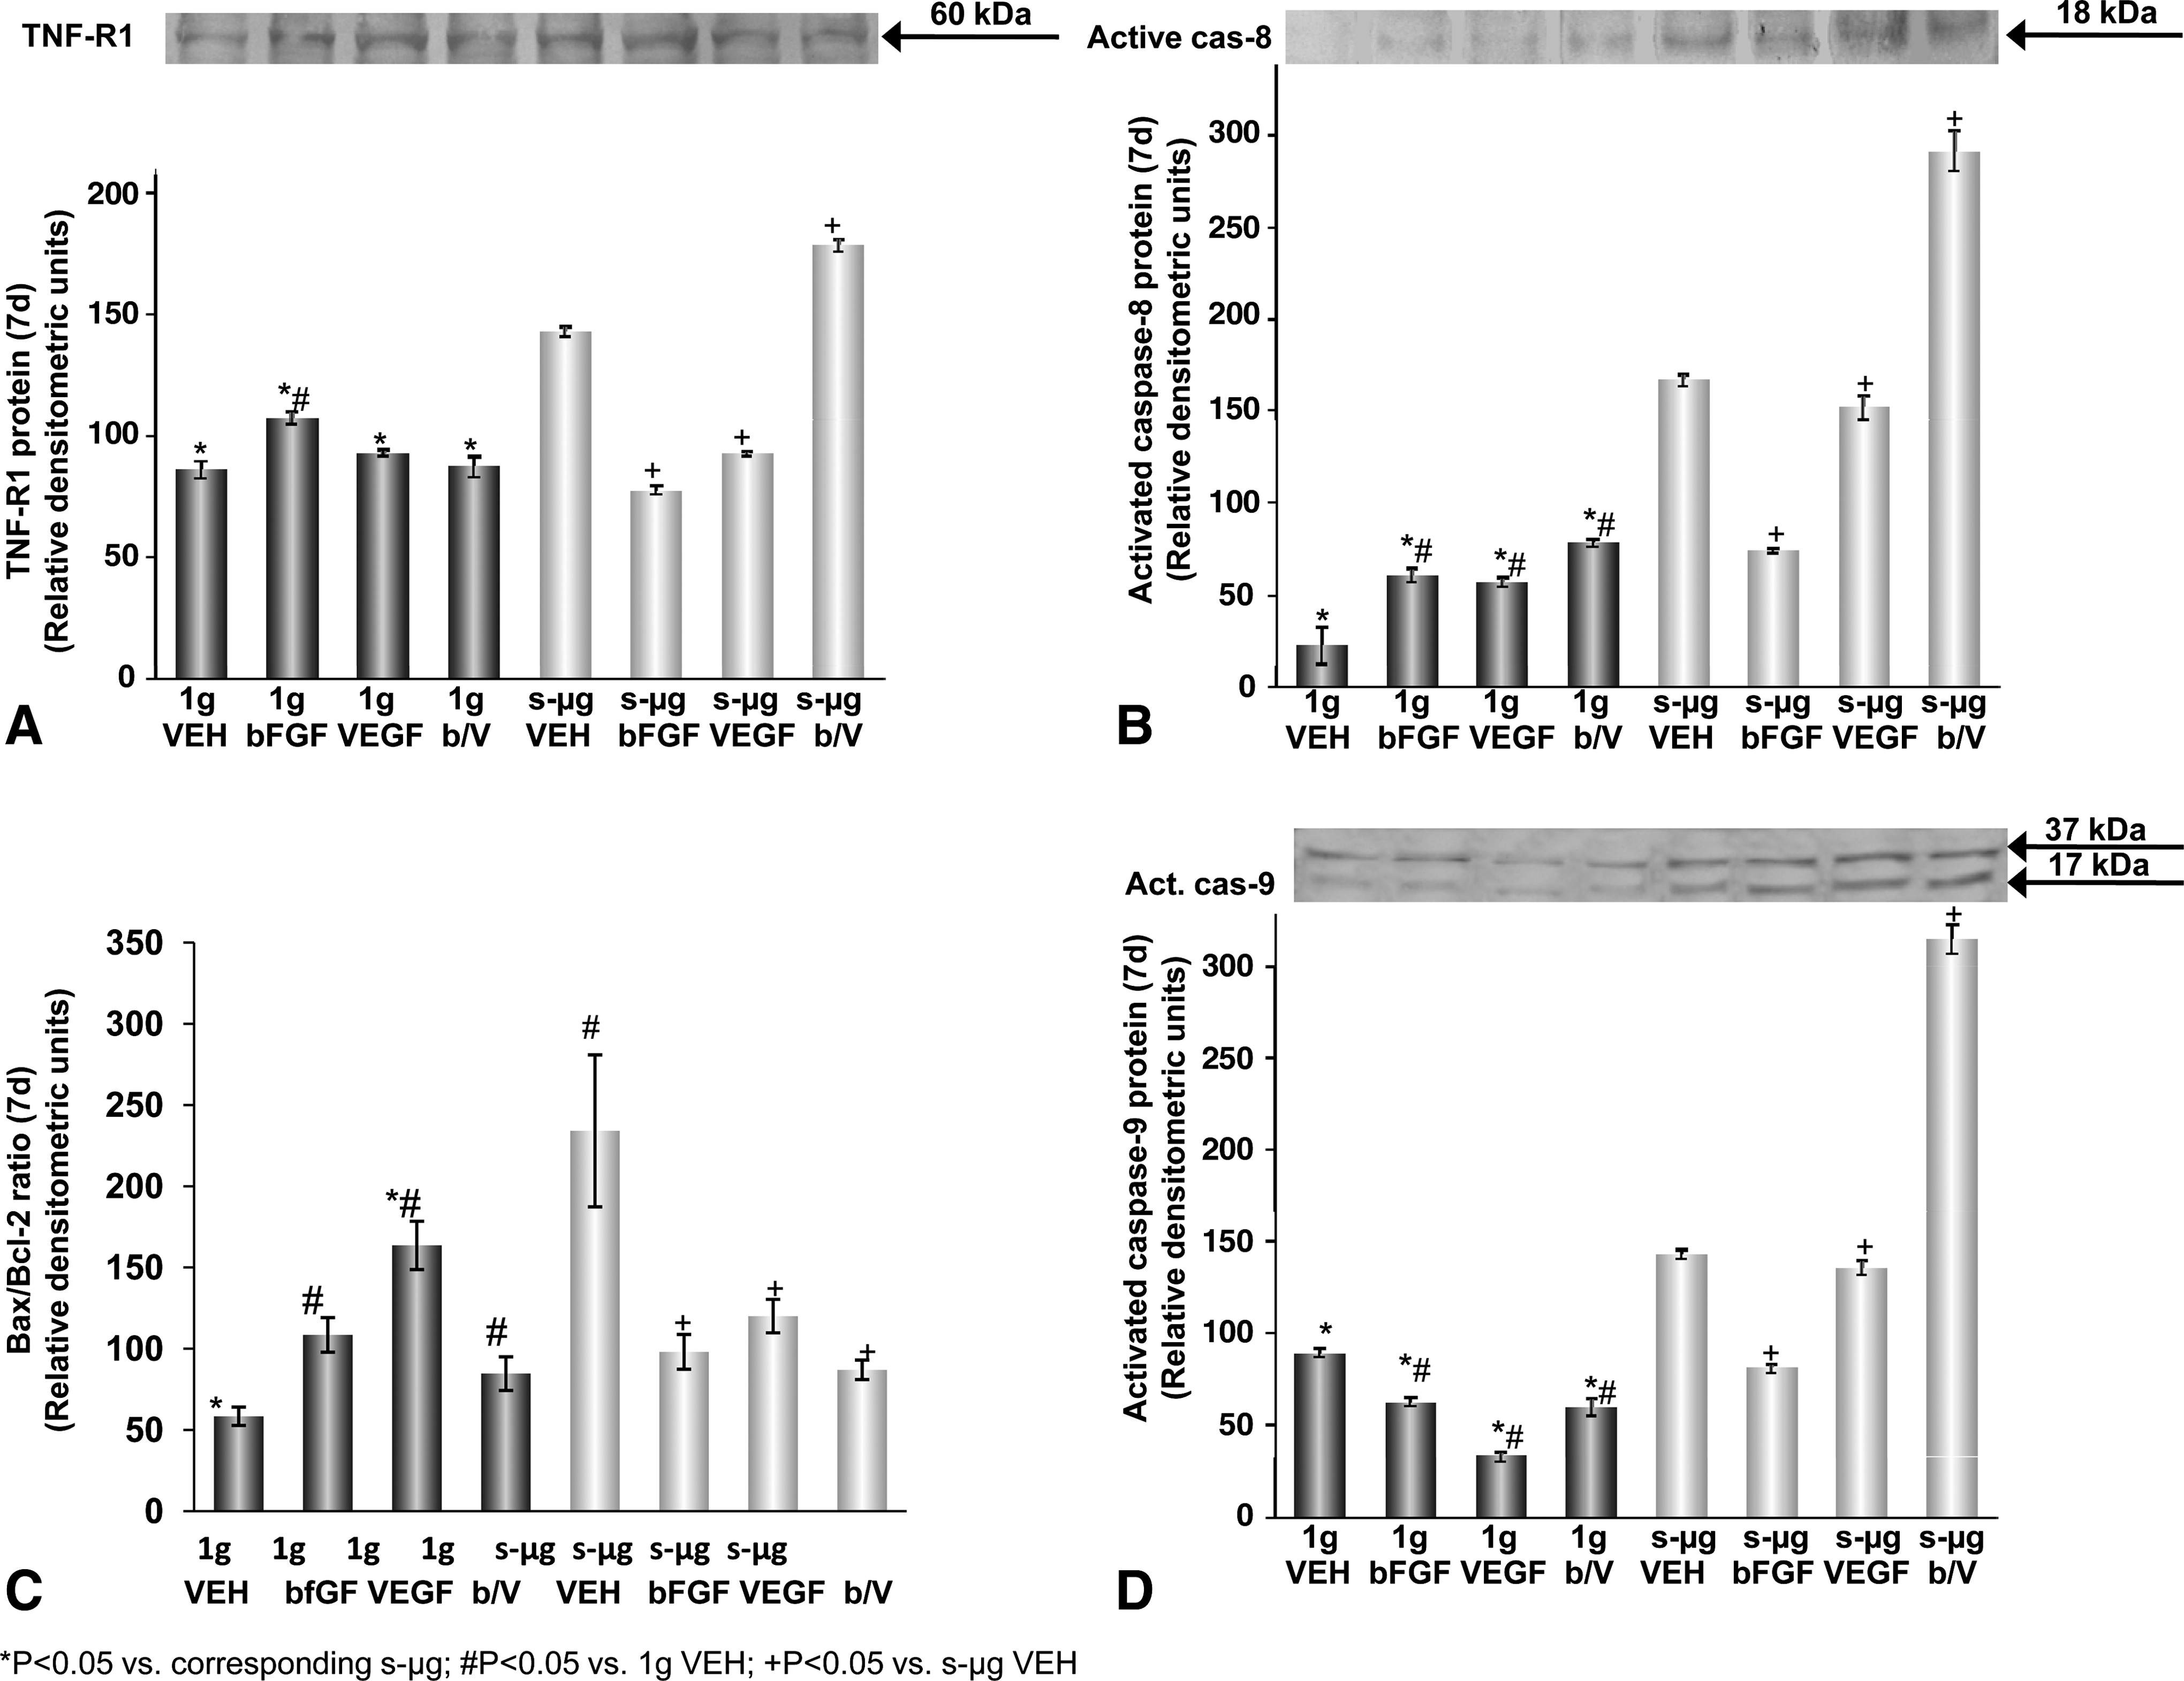
(
Osteopontin, an extracellular matrix protein and cell adhesion molecule plays an antiapoptotic role in EC. 16 It may stop programmed cell death. By using flow cytometry for the measurement of single cells, we found that 82% of the EC of 1 g cultures but only 64% of EC exposed to s-μg for 7 days contained osteopontin (Fig. 2E). Interestingly, osteopontin was strongly expressed by EC incorporated in cylindrical structures (Fig. 1C, inset).
As VEGF and bFGF have proliferative and angiogenic effects on EC, we investigated the role they play in EC cultures incubated on the RPM. After 5 days of cell culturing on a desk-top RPM, the cells incorporated into 3D aggregates preferentially bound antibodies against VEGF (Fig. 4A). However, 1 g control cells (Fig. 1B) accumulated more VEGF and bFGF within their supernatants than the EC of s-μg cultures (Fig. 1A, C). A total of 0.1, 0.036, and 0.03 ng/mL VEGF was measured in the 7-day-old monolayer, 7-day-old s-μg cultures, and 28-day-old s-μg cultures, respectively (Fig. 4C). Similarly, we detected 1.45 ng/mL, 0.39 ng/mL and 0.23 ng bFGF per mL in the supernatant of 7-day-old 1 g controls, 7-day-old s-μg, and 28-day-old s-μg cultures, respectively (Fig. 4D).
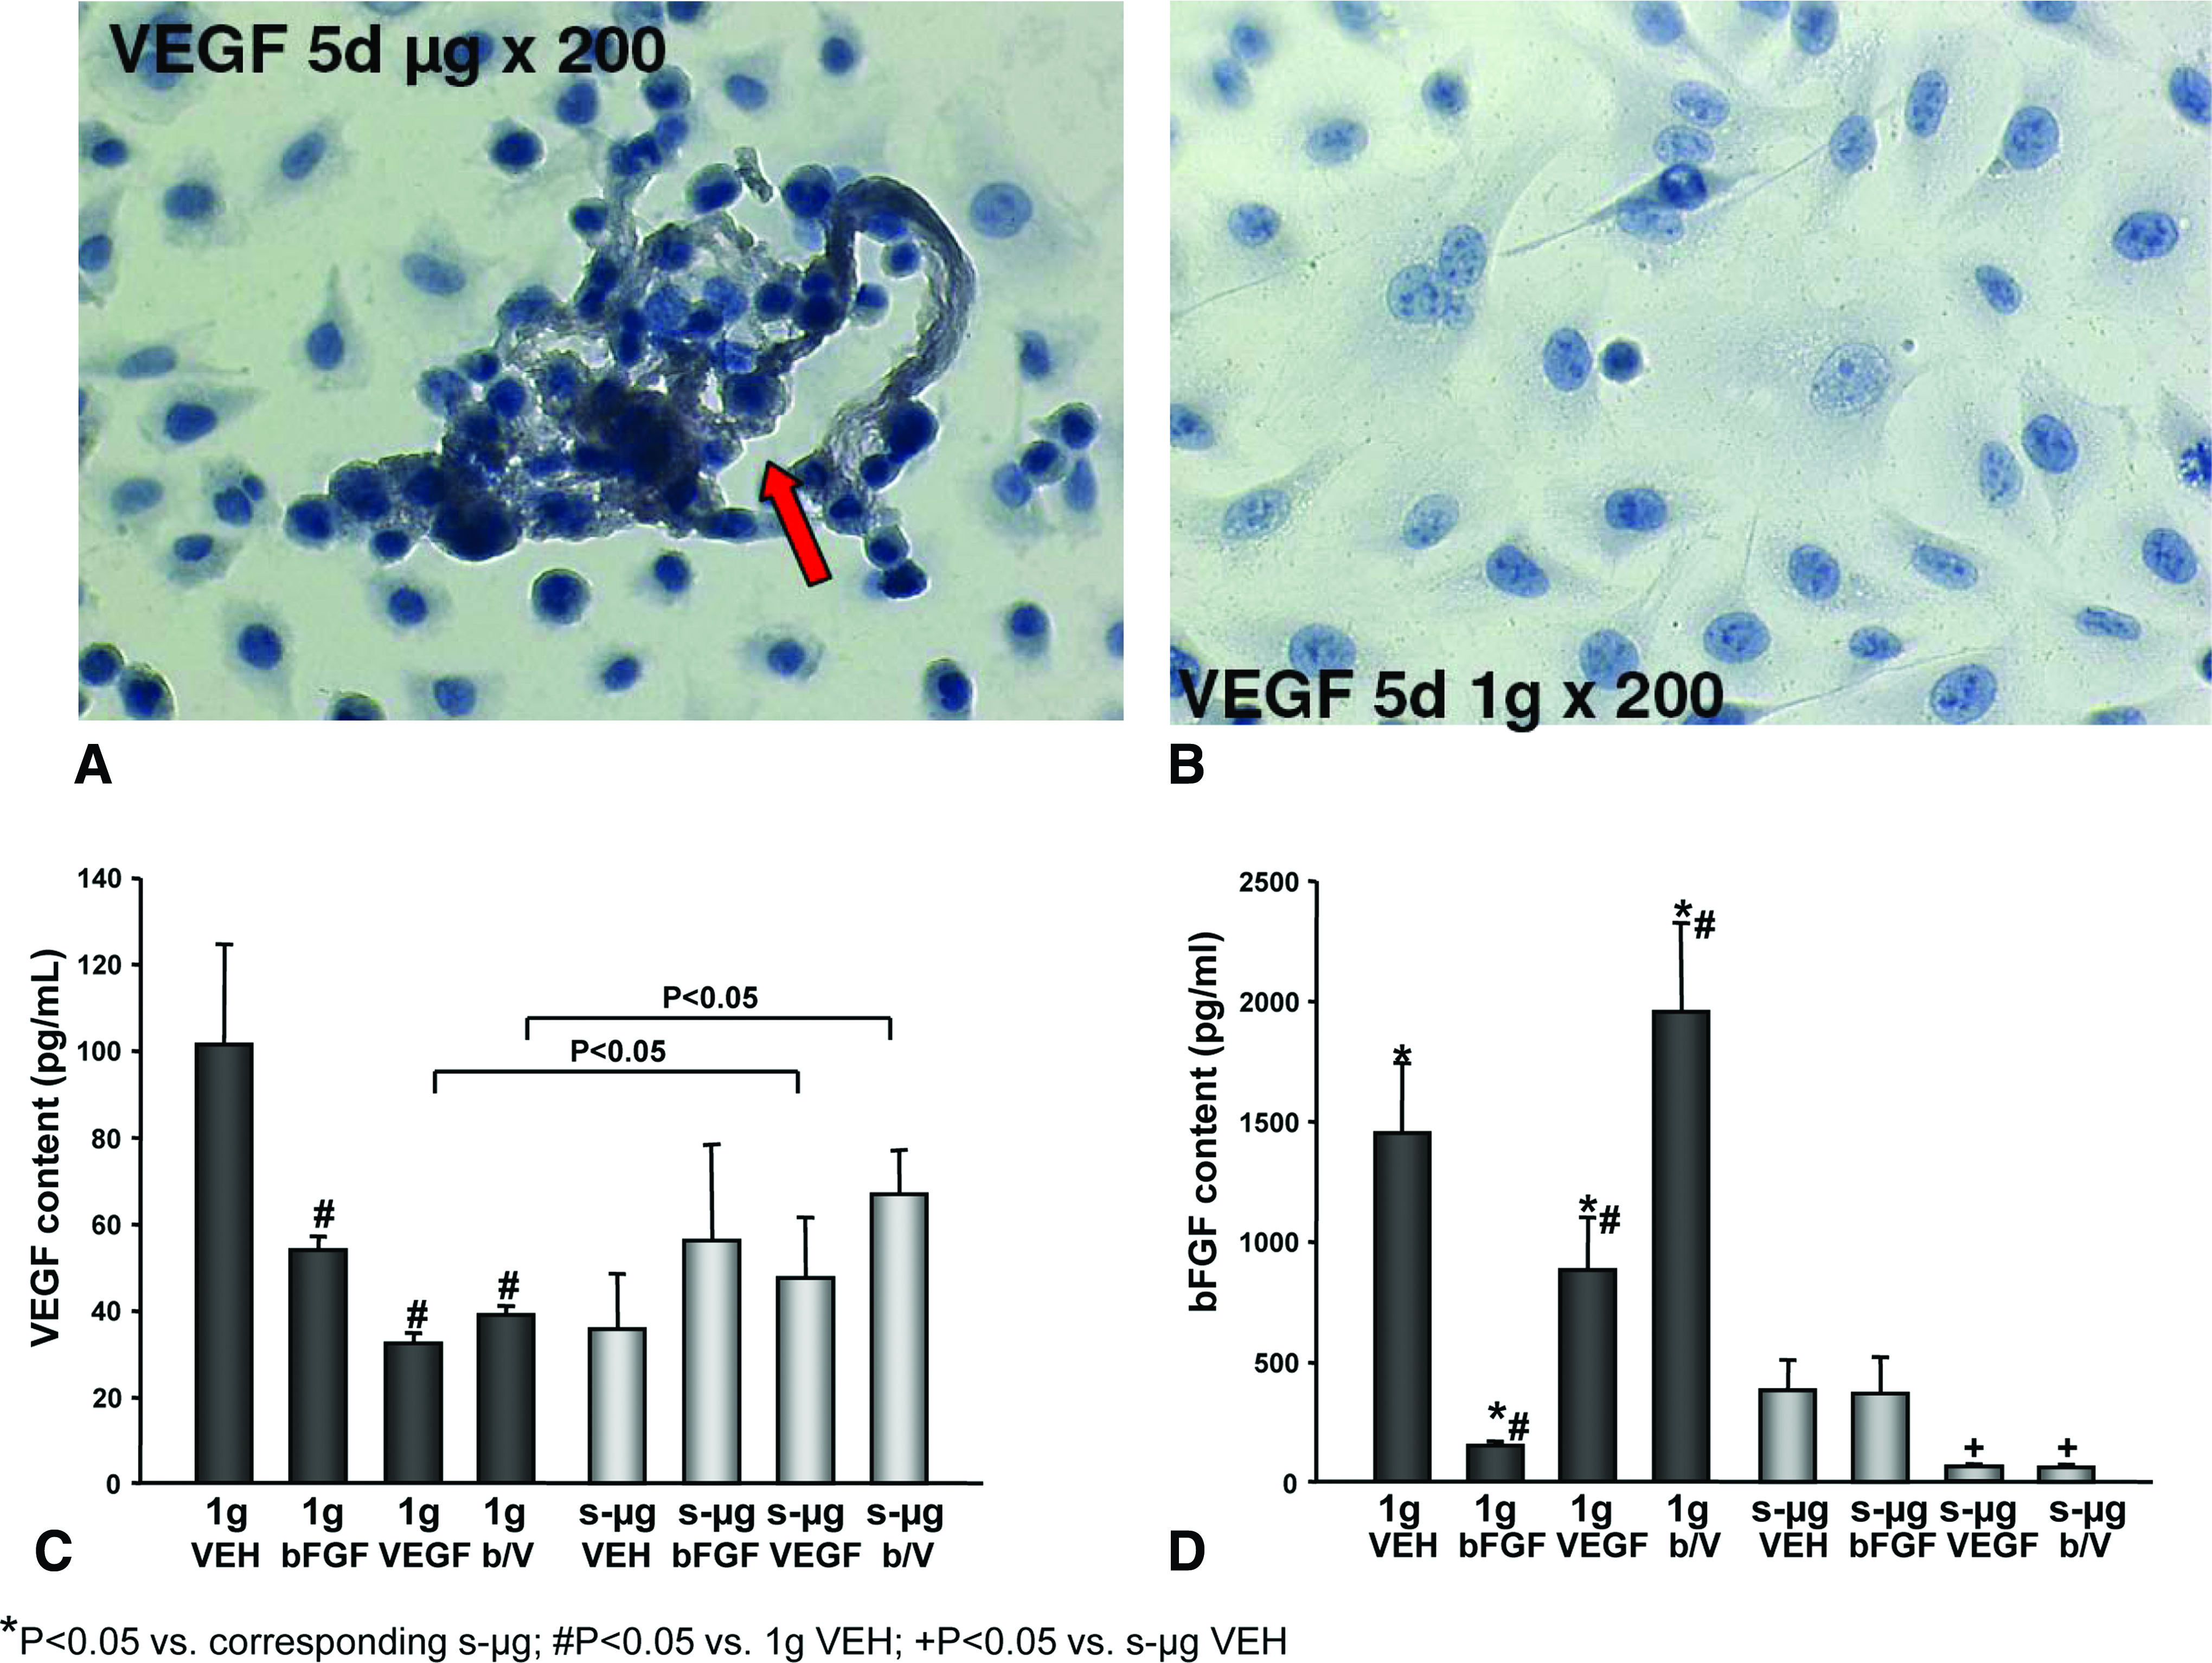
Immunohistochemical staining of vascular endothelial growth factor (VEGF) antigens of EC of cell assemblies formed after 5 days of incubation under s-μg (
Earlier studies showed that the addition of 10 ng/mL VEGF to the culture medium protected the EC against apoptosis for 72 h. 4 When the culture medium contained an additional 10 ng/mL VEGF or bFGF at the start of the experiments and during cell feeding, 0.032 ng/mL VEGF and 0.15 ng/mL bFGF were detected in the supernatants of 7-day-old 1 g monolayer cultures and 0.048 ng/mL VEGF and 0.38 ng/mL bFGF in 7-day-old s-μg cultures (Fig. 4C, D). These results show that the majority of the 10 ng/mL VEGF and/or bFGF had been removed before the time of analysis and that the initial presence of these growth factors had even reduced the accumulation of bFGF and VEGF under 1 g conditions.
To investigate the effects of the initial presence of VEGF and/or bFGF in more detail, we determined the concentrations of proteins in the supernatants, which are secreted by EC at rather high concentrations. Glutathione S-transferase, a widely accepted housekeeping protein, was detected in all the culture supernatants at concentrations of around 0.15 ng/mL (Table 3). In contrast, we found 19.3 ng/mL of the immune-system-related protein complement C3 in media wherein EC had been cultured for 7 days under 1 g conditions. This concentration, however, was reduced when the EC were treated with VEGF, bFGF, or both under normal cell culture conditions, whereas the release of C3 was blunted under s-μg, irrespective of growth factor treatment. Similarly, 52 ng/mL of the von Willebrand coagulation factor were found in culture medium when the cells had been cultured under 1 g conditions. This concentration decreased when either bFGF or combined VEGF/bFGF were added to the culture medium. von Willebrand factor was undetectable in the supernatants of s-μg cultures after 7 days of incubation, but was found at 9.4 ng/mL after 28 days (Table 3).
Values are mean ± SD.
p < 0.05 versus 1 g VEH.
p < 0.001 versus 1 g VEH.
p < 0.001 versus corresponding 1 g.
p < 0.05 versus corresponding 1 g.
p < 0.05 28d μg versus 7d μg VEH.
s-μg, simulated microgravity; n.d., not detectable; VEH, vehicle; b/v, bFGF combined with VEGF.
In further experiments, we focused on soluble factors that play a role in angiogenesis. TNF-α was only detected in 28-day-old s-μg cultures (Table 4). EGF was released into the supernatant at clearly detectable concentrations by EC incubated at 1 g in plain medium or in medium supplemented by VEGF, bFGF, or combined VEGF/bFGF. s-μg conditions did not alter the secretion rate of EGF significantly up to the 28th day of culturing. However, 16 pg/mL IL-1α was detected in supernatants when cells were incubated in plain medium at 1 g. This concentration was halved when growth factors where present during incubation and when s-μg conditions were applied for 7 days. When VEGF/bFGF were present or the incubation on the RPM was extended to 28 days, the IL-1α secretion under s-μg conditions was further lowered. In addition, the pro-angiogenic factor IL-8 showed the highest accumulation in 7-day-old 1 g control supernatants. VEGF significantly downregulated IL-8 concentrations in 7-day-old 1 g culture fluids, whereas bFGF and both together had a slight effect (Table 4). s-μg inhibited the release of IL-8 compared with 1 g. The presence of VEGF or VEGF/bFGF as well as a longer period on the RPM led to a further reduction of IL-8 secretion under s-μg. A total of 59 pg/mL IL-18 was found in supernatants of EC cultured in plain medium under 1 g. VEGF or bFGF reduced this concentration, whereas VEGF/bFGF enhanced this concentration. Under s-μg conditions EC halved their IL-18 secretion rate, whereas the presence of growth factors, but not longer incubation, led to further reductions (Table 4). The concentration of the antiangiogenic IL-12p40 was only moderately lower in s-μg (0.29 ng/mL) than in 1 g cultures (0.43 ng/mL). The addition of bFGF or VEGF to the medium slightly reduced the supernatants' content of this factor at standard gravity. Under s-μg an additional reduction was only observed, when VEGF/bFGF were added together (Table 4). Although the results were different for the various factors and proteins, it became obvious that VEGF and bFGF prompted a similar interleukin secretion behavior by EC as s-μg conditions did. However, synergy between the growth factors and s-μg was rarely observed. Only the presence of VEGF/bFGF together led to a further reduction in the secretory activity in all s-μg cultures (Table 4).
Values are mean ± SD.
p < 0.05 versus 1 g VEH.
p < 0.05 versus corresponding 1 g.
p < 0.05 versus 7d μg VEH.
A series of membrane receptors involved in angiogenesis can be shed in soluble forms into a culture supernatant. In our system, soluble VCAM-1 was below the threshold of reliable measurement in the majority of the culture supernatants tested (Table 5). Only the addition of bFGF to the medium increased the release of soluble VCAM-1 to a detectable level. sICAM-1, however, accumulated in 7-day-old 1 g culture supernatants at concentrations clearly above the threshold (Table 5). When the media contained growth factors, the concentrations of soluble ICAM-1 diminished, but were still above the threshold. If the cells were cultured on the RPM, soluble ICAM-1 concentrations did not reach the threshold until after 28 days. A total of 0.74 ng/mL TNFRSF5 was secreted by EC under static 1 g conditions. bFGF application clearly reduced this shedding activity, whereas VEGF and combined bFGF/VEGF had no influence. Only about 0.02 ng/mL TNFRSF5 was accumulated by EC after 7 days of culturing under s-μg irrespective of whether or not a growth factor was added to the medium. However, 0.41 ng/mL TNFRSF5 was present in 28-day-old s-μg cultures. TNFSF5 (CD40L) concentrations were found in supernatants of 7-day-old 1 g cultures, only 20% above the threshold. In all the other supernatants TNFSF5 was either below the threshold or could not be detected at all. Focusing on the release of TNFR2, we measured a clear secretion under 1 g. The concentrations in the supernatants were significantly reduced by growth factors. s-μg halved the amount of the soluble receptors in each culture.
Values are mean ± SD.
p < 0.05 versus 1 g VEH.
p < 0.05 versus corresponding 1 g.
p < 0.001 versus corresponding 1 g.
p < 0.05 versus 7d μg VEH.
In further experiments, we determined gene expression of key proteins involved in angiogenesis in EC at the 7th day of culturing under s-μg and 1 g. Measurement of the mRNAs corresponding to the secreted proteins revealed that ICAM mRNA was present at an equal concentration in EC of 7-day-old s-μg and 1 g cultures (Fig. 5A). Moreover, VCAM- and especially VEGF mRNA levels were higher in EC of the s-μg control than of the 1 g cultures (Fig. 5B, E). In contrast, the mRNA concentrations of TNFRSF5 and TNF-α were lower in EC of s-μg cultures compared to 1 g cultures (Fig. 5C, D). Except of VEGF mRNA, the amounts of each type of mRNA were enhanced within the EC under standard gravity conditions, but reduced under s-μg, when VEGF and the combination VEGF/bFGF was present during culturing.
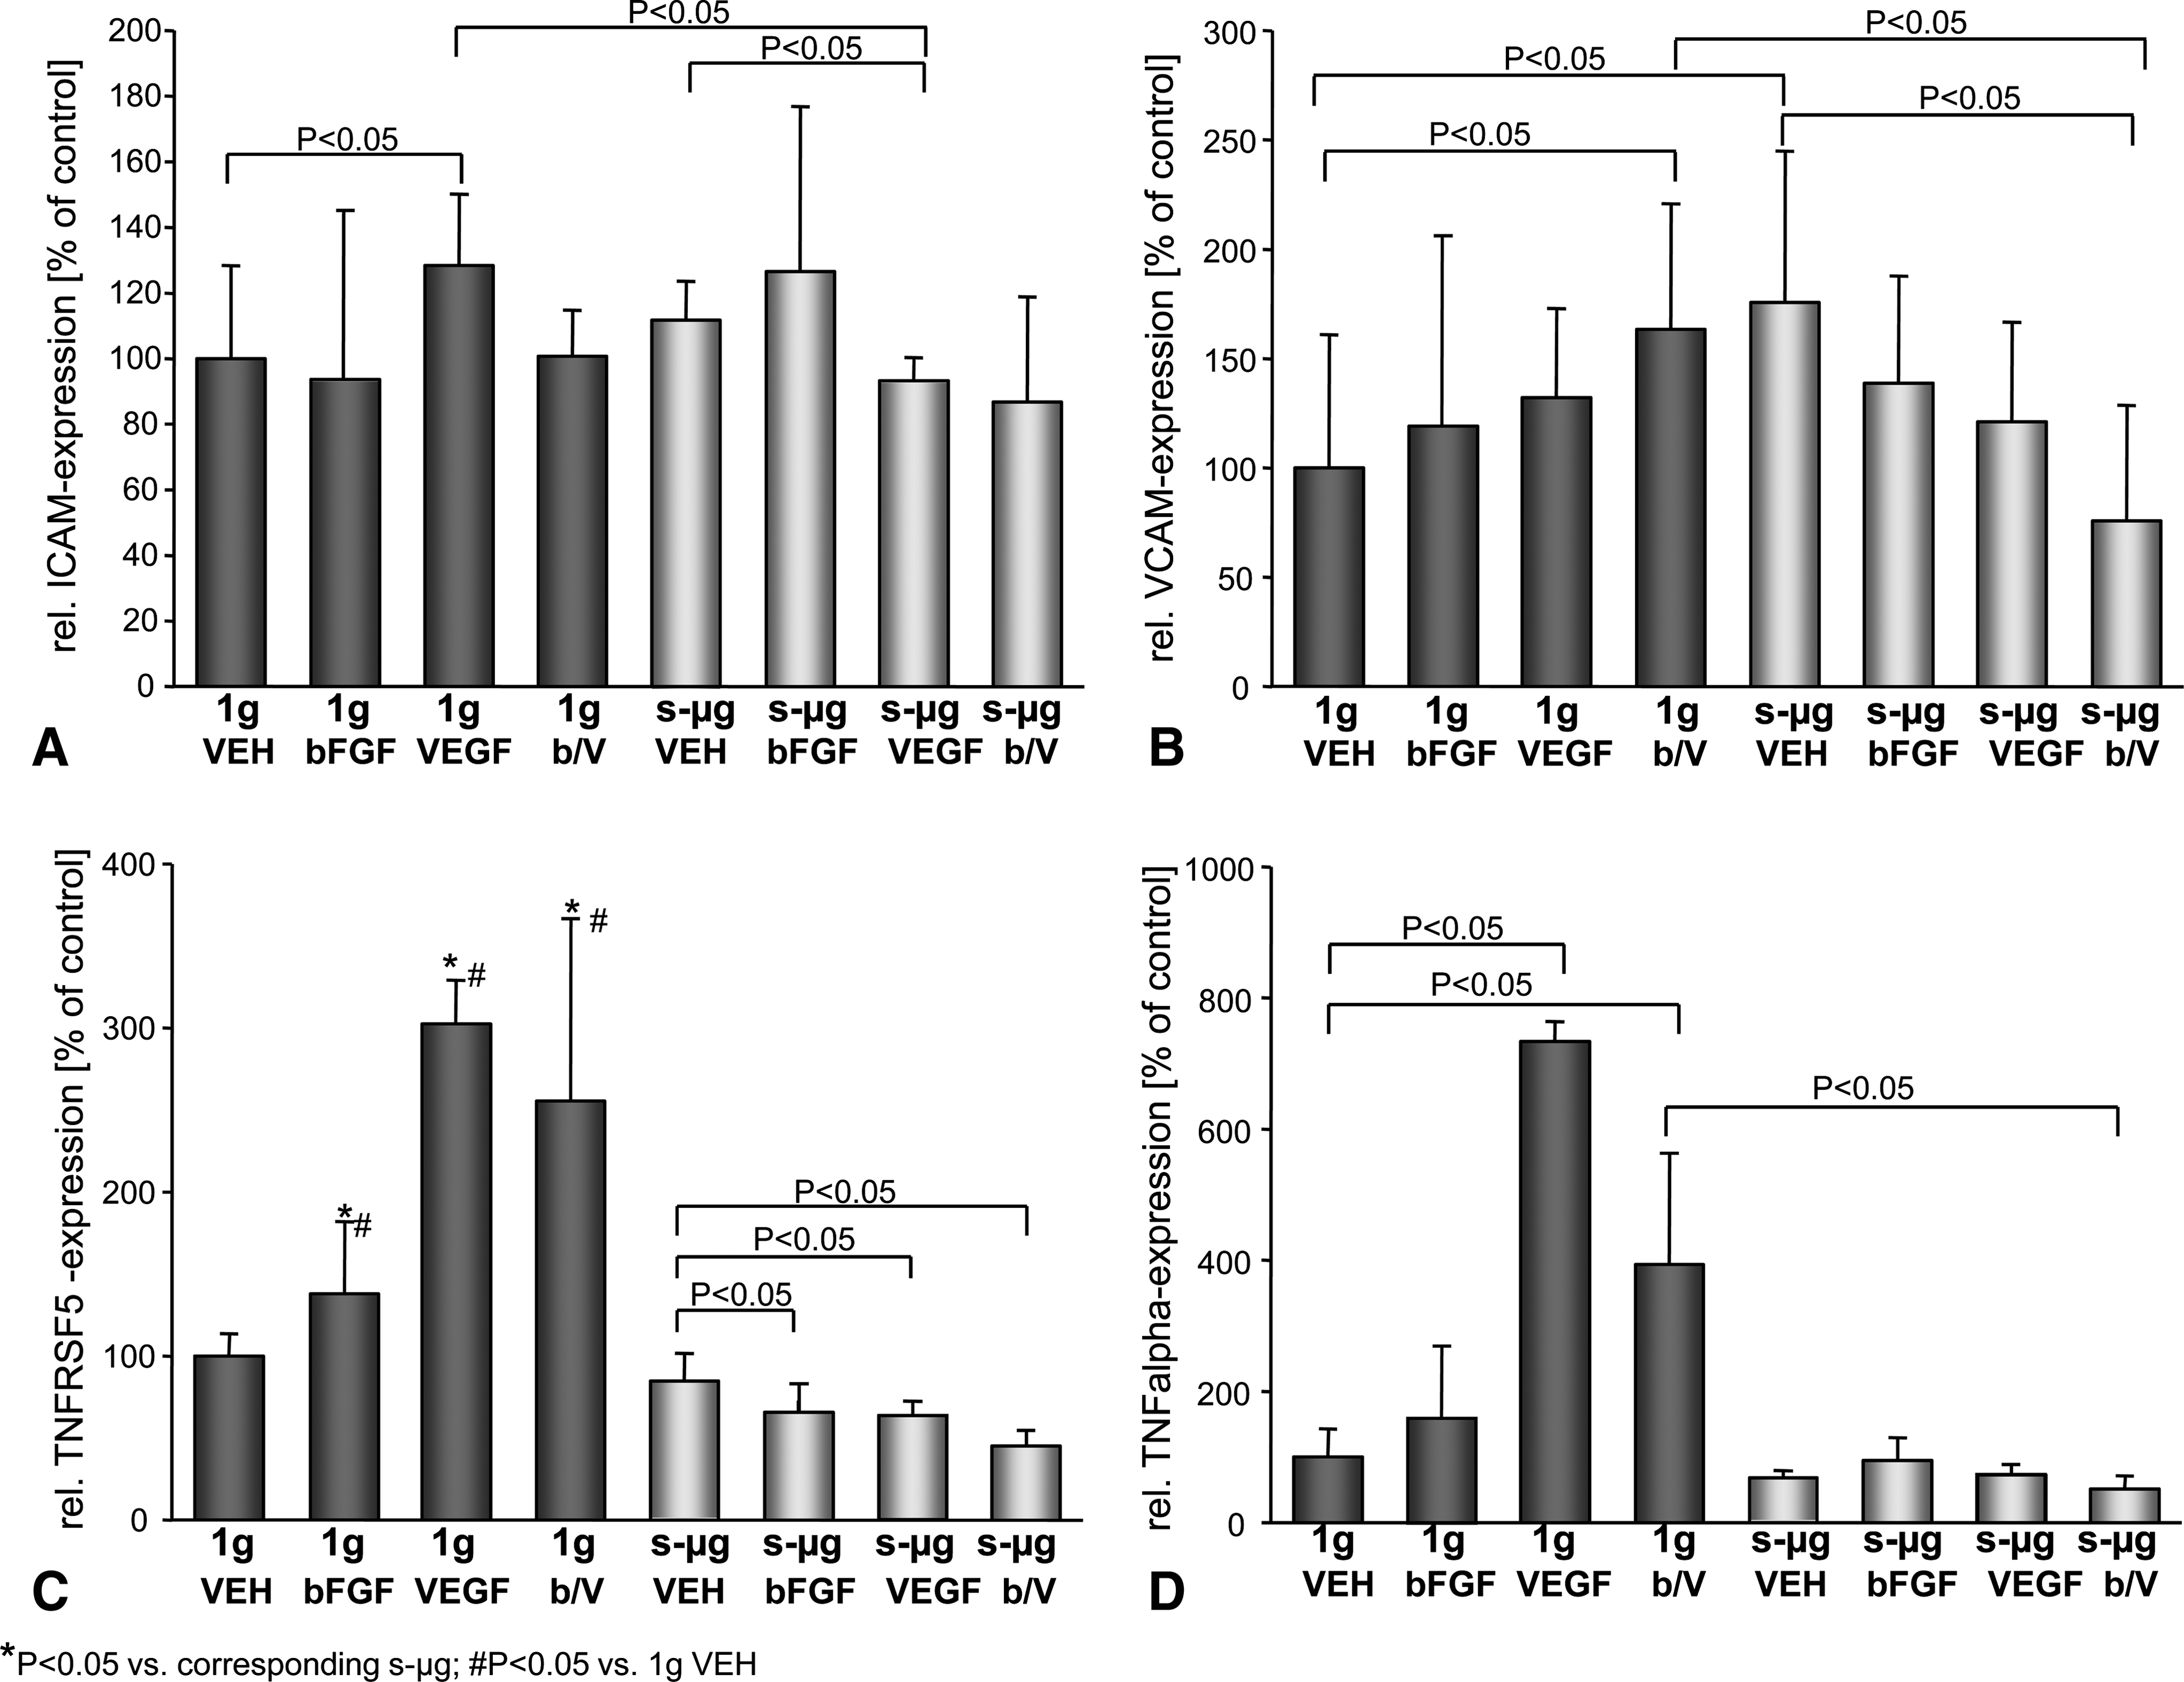
Relative quantities of mRNA of intercellular adhesion molecule (
In addition, we determined the mRNA of several cell associated proteins described above. Expression of OPN mRNA was higher in control than in s-μg-exposed EC (Fig. 2F). Gene expression of the catalytic subunit of PKA (PRKACA) was slightly upregulated under s-μg conditions compared with 1 g (Fig. 6A). Application of VEGF and combined bFGF/VEGF upregulated the PKA (PRKACA) mRNA under gravity, but down-regulated it under s-μg. With regard to protein kinase Cα gene expression, we detected clear up-regulation of the PRKCA gene in all growth-factor-treated 1 g samples. PRKCA gene expression was also up-regulated by s-μg and further increased by bFGF treatment (Fig. 6B). Moreover, ERK1 and ERK2 mRNAs were measured at equal concentrations in plain medium under 1 g and s-μg. The addition of VEGF and combined bFGF/VEGF enhanced ERK2 mRNA at 1 g. bFGF up-regulated ERK1/2 mRNAs at s-μg, whereas the application of bFGF/VEGF reduced the mRNAs of both ERKs at s-μg (Fig. 6C, D).
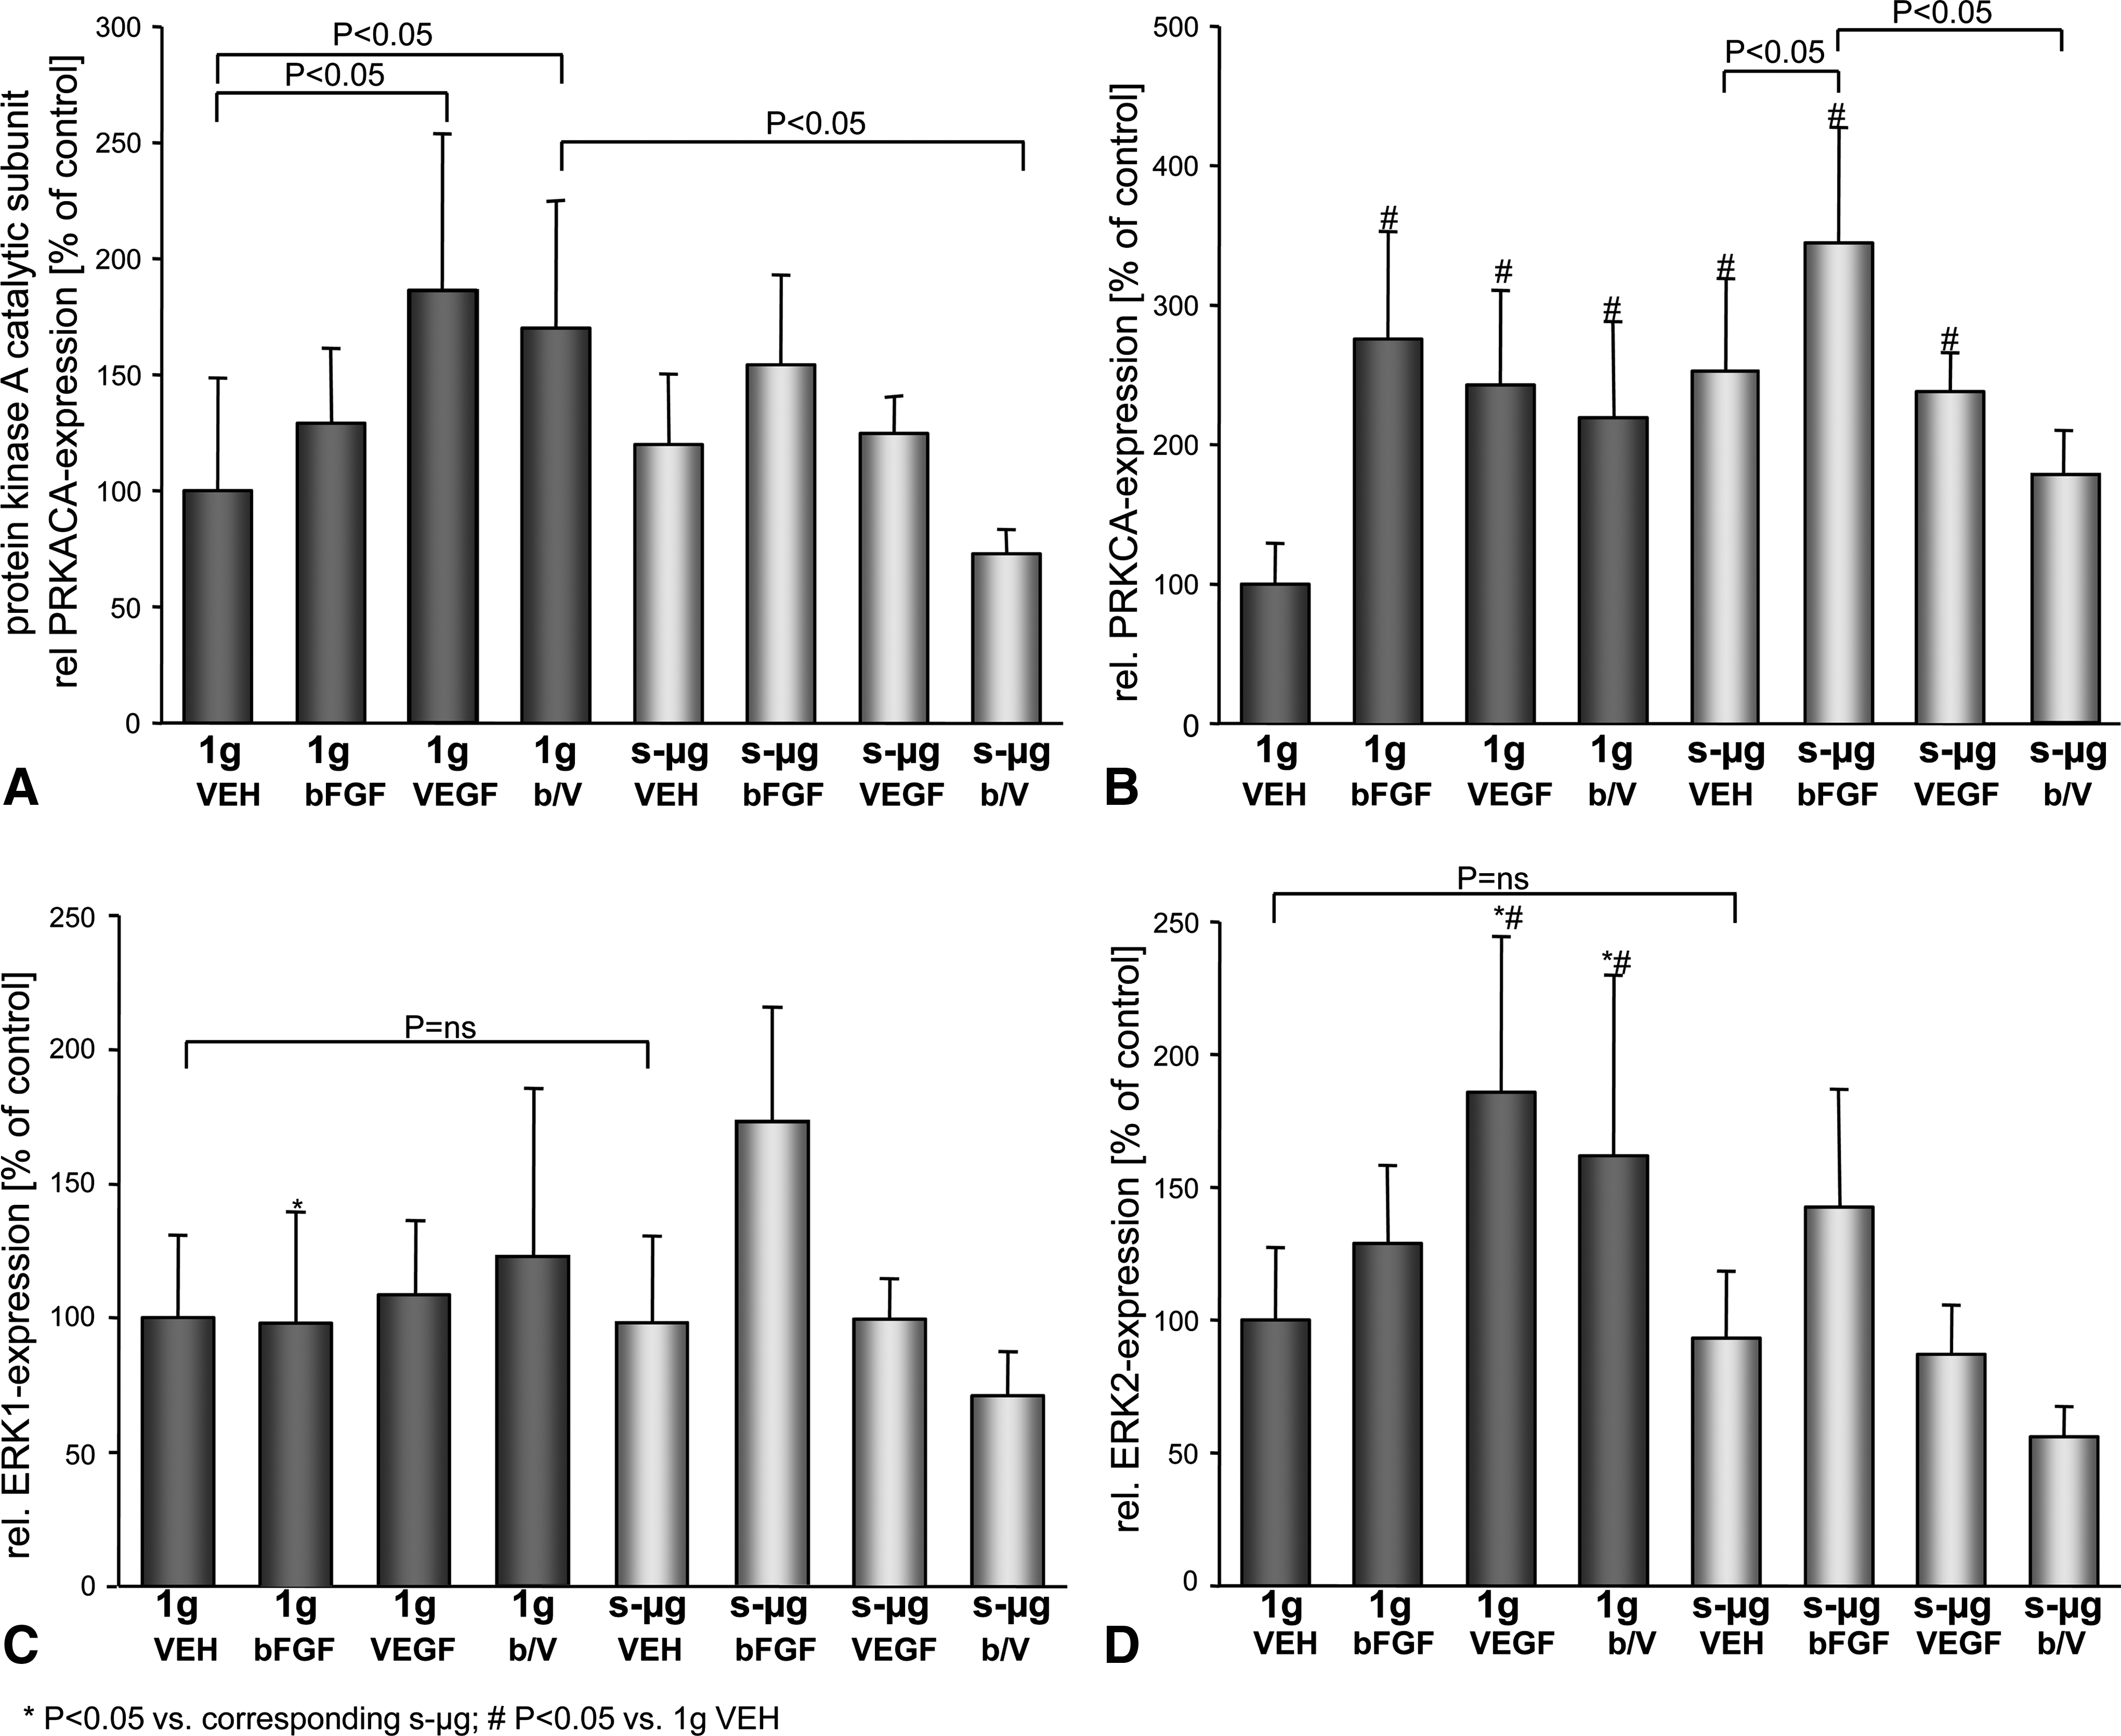
Relative quantities of mRNA of protein kinase A catalytic subunit (
Discussion
In an attempt to improve tissue engineering of vascular intimas, we investigated the culture conditions, under which the formation of EC colonies and their transition to double-row cell assemblies occur, which signal the beginning of the development of TSs. Initially, we assessed the general physiology of the EC exposed to s-μg for 7 days. Seven-day-old adherent s-μg EC cultures contained about 57% viable cells, whereas 1 g control monolayer cells contained 75% and 28-day-old s-μg cultures 62% (Fig. 2B). Similar numbers of cells expressed osteopontin with antiapoptotic activity 16 (Fig. 2E). NFκBp65 was present in all cell populations at similar concentrations. However, the kinases PKC and pERK1/2, which direct the nuclear factor to different genes by kinase type-specific phosphorylation, 15 were produced at lower concentrations in cells exposed to s-μg. The measurement of Ki-67, an excellent marker of proliferation that is detectable during the cell cycle phases G1, S, G2, and mitosis, but is absent from resting cells (G0), indicated proliferation in 7-day-old s-μg cultures, which was higher in adherent than in aggregated cells (Fig. 2A). Therefore, one can conclude that the physiological activity of EC is impaired around the 7th day of incubation on a desktop RPM but is sufficient to ensure survival of the population such that the number of viable and osteopontin-positive cells increases during further incubation on the RPM up to 28 days.
Strong up-regulation of apoptosis in EC incubated on the RPM between the 4th hour and the 3rd day was already observed by others.4,17 Here we show that this up-regulation appears to be due to processes occurring in extrinsic (caspase-8) and intrinsic (caspase-9) pathways (Fig. 3). In addition, the number of necrotic cells was highest in 7-day-old s-μg cultures (Fig. 2B). Necrotic cells challenge the immune system 18 and may also trigger EC to secrete immune-system-related biofactors. 19 Although the interleukins that we analyzed were present at diminished concentrations in s-μg supernatants, an indication of an immune reaction may be that the C3 complement component concentrations in the supernatants were much lower in s-μg cultures than in 1 g cultures (Table 3). Complement C3 in fluid surrounding necrotic cells is rapidly absorbed and converted to membrane-bound C3b by necrotic cells. 20 C3b that is bound covalently to the cell surfaces influences the recognition of EC by phagocytes or neighboring EC.21,22
When the medium was supplemented with 10 ng/mL of VEGF or bFGF at the beginning of the experiment and the cells were fed on the 4th day by replacing 50% of the supernatant with fresh supplemented media, the amount of VEGF or bFGF on the 7th day found was similar to that in supernatants of cells suspended in plain medium (Fig. 4). This strongly suggests that these growth factors were degraded in the supernatants in vitro, just as VEGF is removed from blood in vivo, 23 and that the quantities of specific components found in cell supernatants represent the difference between secretion/addition and removal of a specific biofactor.
In each cell supernatant, the quantities of glutathione S-transferase were independent of gravity conditions (Table 3). Glutathione-S-transferase is an enzyme that is expressed by EC to protect themselves and their tight junctions against oxidative stress. 24 The angiogenesis-related factor EGF was also accumulated to a similar extent in the various 1 g and s-μg cultures (Table 4). So, there are proteins such as glutathione S-transferase and EGF whose concentrations in EC supernatants were unaffected by different gravity conditions and by externally added VEGF and bFGF.
The quantities of complement C3, vWF, IL-8, IL-1α, IL-18, and IL-12p40 in the supernatants were reduced by s-μg and also at 1 g by VEGF or bFGF (Tables 3 and 4). This finding is difficult to explain. It is possible that there is an accelerated consumption of complement C3 as suggested above or retarded secretion. For example, vWF may not have been secreted in s-μg cultures during the first 7 days, because the assembly of ordered TSs of von Willebrand factor required for their release from Weibel–Palade bodies 25 was prevented in the absence of gravity. Although the exact mechanisms remain unknown, the fact that externally added VEGF and bFGF reduced the quantities of complement C3 and vWF and of IL-8, IL-1α, IL-12p40, and IL-18 under 1 g strongly suggests that the initial presence of VEGF and/or bFGF has physiological consequences up to the 7th day under these conditions.
There was also another group of proteins whose accumulation in supernatants was reduced by s-μg conditions alone and by VEGF or bFGF under 1 g conditions. This group comprised soluble forms of the membrane proteins TNFRSF5, TNF-R2, ICAM-1, and TNFSF5 (Table 5). Soluble forms of membrane proteins can be generated either by proteolytic cleavage of a membrane-bound protein or by translation from variant mRNAs that specifically encode a soluble form of the protein. 26 Proteolytic cleavage of membrane-bound proteins is strictly controlled and depends on the ratio of activated proteases and protease inhibitors present within a membrane. 27 Systems controlling the shedding of ICAM, VCAM, and members of the TNF and TNF receptor families include PKC 28 and PKA. 29 In leukocytes, PKC 30 and PKA 31 were sensitive to changes in the gravity vector. In EC, similar results were obtained (Fig. 1F).
The purpose of this study was to characterize the situation in a 7-day-old RPM culture. Measurements of protein levels, as described above, can provide insights into the cell status, but reflect an endpoint status. To fully understand and, in the end, successfully modulate a regulatory mechanism, it is important to also consider mRNA concentrations. In all analyses, the supernatants of 1 g cultures contained more ICAM-1, TNFRSF5, and VEGF than the s-μg supernatants. Nevertheless, ICAM mRNA and TNFRSF5 mRNA were present in 7-day-old s-μg and 1 g control cells at equal or at least similar concentrations, and the amounts of VCAM mRNA and VEGF mRNA were even higher in 7-day-old s-μg than in 7-day-old 1 g EC (Fig. 5). We thus concluded that there is no corre-lation between mRNA in the cells and the corresponding protein in the supernatant. The lack of correlation of soluble-membrane-associated proteins in supernatants with their corresponding mRNA could be explained by assuming that the mRNA has been translated and that the reduced amount is due to an increased number of membrane-bound receptors in s-μg-exposed EC. This conclusion would fit the results described by Buravkova et al. 32 They found that EC-associated ICAM-1 proteins were clearly enhanced in EC exposed to s-μg. However, the lack of correlation of proteins and corresponding mRNA concentrations may also be explained by a delay in translation or a translational control step. It would also explain the elevated binding of anti-VEGF antibodies by EC aggregates as shown in Figure 4A. Looking at proteins bound to the cells, we found at least a partial correlation. The amount of osteopontin mRNA was 50% lower in s-μg cells than in 1 g control cells (Fig. 2F). The protein as measured by flow cytometry was reduced by 20% in s-μg compared to control cells. We have demonstrated in earlier studies that osteopontin is differently expressed at different time points. 13 However, we also found that s-μg enhanced PKCα mRNA, but did not alter the mRNA concentrations of ERK1 and 2. Simultaneously, PKC protein and phosphorylated ERK1/2, which both are required for full EC tube formation 8 and angiogenesis, 33 were decreased under s-μg, whereas unphosphorylated ERKs remained unchanged. This situation may point to a coming up burst of PKC activity and ERK phosporylation and may supplement tube formation mediated by PKA, 34 which is already increased at the 7th day of culturing on the RPM.
Two characteristics of 7-day-old s-μg cultures were striking. First, the quantities of IL-8, IL-1α, IL-18, and IL-12p40, complement C3, vWF, and of the soluble membrane proteins ICAM-1, TNFRSF5, and TNFSF5 in these supernatants were much lower than that in control culture supernatants. Further, those proteins for which accumulation was reduced by s-μg showed a response to externally added VEGF and bFGF mainly at 1 g. Only the interleukins IL-8, IL-1α, IL-18, and IL-12p40 were further impaired in s-μg cultures when VEGF and especially when VEGF/bFGF were present. Second, externally added VEGF and bFGF decreased in the supernatants until the 7th day of culture. In 1 g cultures, the initial presence of 10 ng/mL influenced the accumulation of various proteins in the culture supernatants. However, in s-μg cultures, the effects of VEGF and bFGF were rather weak or absent, especially with regard to shedding of membrane proteins or translation of variant mRNAs that specifically encode a soluble form of the proteins. 26 This difference cannot be explained by VEGF receptors present on the cells, as earlier studies had revealed similar quantities of Flk-1 and Flt-1 proteins in both control EC and s-μg-exposed EC. 11 It could, however, be due to an impaired interaction between the added growth factors and the extracellular matrix, 35 which was altered under s-μg. 4
TNFRSF5, ICAM-1, and VCAM-1 are involved in angiogenesis,36,37 as TNFRSF5/TNFSF5 interaction up-regulates VCAM-1 and ICAM-1, which in turn bind immune cells that support angiogenesis. 38 Soluble forms of these proteins can block docking of other cells to EC 39 or bind the natural ligand of a receptor and form inactive complexes so that the relevant signaling pathway is not triggered. 40 Further experiments will show whether a further reduction in these molecules could be helpful in the engineering of TS.
Footnotes
Acknowledgments
This research was supported by the German Space Agency DLR (Grants 50WB0524 and 50WB0824), by the Programm zur Förderung von Forschung, Innovationen und Technologien- ProFit’ (Grant 10135687), and by a Belspo PRODEX/ESA contract (C90-303).
Disclosure Statement
No competing financial interests exist.