




Abstract
Biologic therapies for disc degeneration hold great promise as an emerging concept. Due to ease of harvest and abundance, adipose derived-mesenchymal stem cells (AD-MSC) are a readily available cell source for such therapies. Our objectives in this study were (1) to develop/validate methods to harvest AD-MSC and direct them to a disc-like phenotype by three-dimensional (3D) culture and transforming growth factor (TGF)-β3 exposure, (2) to assess cell phenotypes with gene expression profiling for these human AD-MSC and annulus cells, and (3) to test whether disc cell-AD-MSC coculture could augment glycosaminoglycan (GAG) production. When AD-MSC were exposed to TGF-β3, greater extracellular matrix was formed containing types I and II collagen, keratan sulfate, and decorin. Biochemical GAG measurement showed that production was significantly greater in TGF-β3-treated AD-MSC in 3D culture versus untreated controls (p < 0.05). Gene expression patterns in AD-MSC were compared to annulus cells; 4424 genes were significantly upregulated, and 2290 genes downregulated. Coculture resulted in a 44% greater GAG content compared with AD-MSC or annulus culture alone (p = 0.04). Data indicated that human AD-MSC can successfully be manipulated in 3D culture to express gene products important in the disc, and that coculture of annulus cells with AD-MSC enhances total GAG production.
Introduction
Recent advances have directed attention toward the exciting potential of biologic therapies for the treatment of disc degeneration. One of the major, well-recognized events in disc aging and degeneration is the marked reduction in cell number, 6 and the failure of this dwindling cell population to appropriately maintain the disc ECM. With other researchers today, we share enthusiasm for the potentials that cell-based tissue engineering, including employment of MSC, offers toward the augmentation of disc cell numbers and prevention of deleterious events in the aging/degenerating disc, such as apoptosis and cell senescence. In this realm, our lab's focus is upon adult, adipose derived-mesenchymal stem cells (AD-MSC) because of their ease of harvest and abundance from humans, and their potential autologous cell applications.
AD-MSC have the ability to differentiate into adipocytes, chondrocytes, and osteoblasts, and have been shown to differentiate into insulin-, somatostatin-, and glucagon-expressing cells.7–9 Several bioactive agents function in these differentiation processes, including transforming growth factor (TGF)-β, fibroblast growth factor, and insulin-like growth factor.10–12
The structural integrity of the disc requires a complex interaction between disc cells and the ECM they produce and remodel. In this study, our objectives were (1) to develop and validate methods to harvest AD-MSC, to direct them to a disc-like phenotype in three-dimensional (3D) culture, and test the effect of added TGF-β3, (2) to test how well this direction succeeded by comparing gene expression profiling patterns of AD-MSC in 3D culture to patterns seen in human annulus cells in 3D culture, and (3) to test whether annulus cell coculture with AD-MSC could be used to augment proteoglycan production.
Materials and Methods
Clinical study population
Experimental study of disc specimens was approved prospectively by the authors' Human Subjects Institutional Review Board. Since disc surgeries are routinely performed in our institution, and surgically removed tissue discarded, informed consent was not required.
Scoring of disc degeneration utilized a modification of the Thompson scoring system 13 incorporating author ENH's radiologic, MRI, and surgical findings. Disc degeneration was graded over the spectrum from a healthy disc (Thompson grade I) to discs with advanced degeneration (grade V, the most advanced stage of degeneration). Patient specimens were derived from surgical disc procedures performed on individuals with herniated discs and degenerative disc disease. Surgical specimens were transported to the laboratory in a sterile tissue culture medium. Care was taken to remove all granulation tissue and to sample only disc tissue. Nonsurgical control donor disc specimens were obtained via the National Cancer Institute Cooperative Human Tissue Network (CHTN); they were shipped overnight to the laboratory in a sterile tissue culture medium and processed as described below. Specimen procurement from the CHTN was included in our approved protocol by our human subjects Institutional Review board.
Adipose specimens were obtained after IRB approval from our medical center cosmetic and plastic surgery physicians; panniculectomy specimens were immediately collected from the surgical suite, taken to the laboratory, and processed as described below for AD-MSC isolation and characterization.
Clinical demographic features of both the adipose tissue donors and subjects from whom annulus cells were derived are presented in Table 1. Annulus cells were P2 or P3 when used in experiments; AD-MSC were P1 when used in experiments.
Used in three-dimensional culture microarray analyses.
Used in coculture experiments with adipose derived-mesenchymal stem cells (AD-MSC).
Cells used in two coculture experiments.
Specific methodologies for human disc cell culture
Methods used here for disc cell culture have previously been reported from our laboratory. 14 Briefly, disc tissue was rinsed twice with sterile modified minimal essential medium with Earle's salts (MEM; Gibco) with 1% (v/v) L-glutamine (Irvine Scientific), 1% (v/v/) nonessential amino acids (Irvine Scientific), and 1% (v/v) penicillin–streptomycin (Irvine Scientific), with the addition of 20% (v/v) fetal bovine serum (Gibco). Regions of annulus were visually identified and minced with a scalpel into small portions (1–2 mm2). Fragments were cultured in T25 flasks (Costar) and anchored by placement of a sterile nylon mesh (Spectra Mesh; Spectra Laboratory Products) over the fragments. Cells then grew out from the fragments, and were fed three times a week. When cultures showed a confluent out-growth of cells under the mesh, cultures were trypsinized (1:250; trypsin 0.5g/L and EDTA 0.2 g/L; Irvine Scientific) and split with a ratio of 1:4 for subculturing.
Specific methodologies for AD-MSC
Methods used here for AD-MSC isolation, monolayer culture, 3D culture in collagen sponge matrix, and validation of the stem cell phenotype have previously been reported from our laboratory. 15 Major details are summarized briefly below.
AD-MSC isolation and plating followed the method of Cowan et al., 16 and usually took ∼2 h depending upon the amount of fat tissue being processed. Briefly, human adipose tissue was digested with collagenase type II (1 mg/mL; Sigma) at 37°C in a water-bath shaker for 30–40 min (180–200 rpm) with a brief vortex every 10 min. Undigested tissue was removed by filtration, and AD-MSC harvested by centrifugation at 42 g for 5 min at RT. AD-MSC were resuspended in Hanks balanced salt solution (HBSS), filtered through a 40 μm cell strainer, counted, and plated as the primary culture (P0) on 100 × 20 mm round plastic tissue culture dishes (Primera; Falcon, BD Biosciences) at a density of 1000 cells/mm2. In our laboratory, the average yield of AD-MSC is 471,000 cells/mL. Plated cells were fed every 48–72 h with 10 mL of the medium (mesenchymal stem cell basal medium [MSCBM]; Cambrex Bio Science). When confluent, cells were trypsinized, centrifuged at 42 g for 5 min, and re-plated at a density of 1000 cells/mm2.
Verification of stem cell isolation
Isolated presumptive AD-MSC were verified as being stem cells by CD marker analysis, osteogenic differentiation, and chondrogenic differentiation as described below.
CD marker analysis of AD-MSC
AD-MSC were characterized by immunolocalization of the multipotent mesenchymal stromal cell markers as follows: positive localizations for CD105, CD90, CD44, and CD29, and negative localization for CD45 and CD34. This CD marker MSC characterization followed patterns as listed by the International Society for Cellular Therapy. 17
Osteogenic differentiation
Osteogenic differentiation of stem cells was performed using an Osteogenesis Kit (Chemicon International) 18 and employed positive alizarin red (Osteogenesis Kit) staining of mineralized matrix after 21 days of culture. Control cultures were fed MSCBM medium only.
Chondrogenic differentiation
Chondrogenic differentiation used micromass culture with cells grown for 7–10 days in the chondrogenic induction medium (Cambrex Bio Science) supplemented with 5% fetal calf serum. Proteoglycan production in the ECM was observed by toluidine blue staining (0.1% in dH2O; Sigma) in paraffin-embedded specimens.
Stimulation of AD-MSC with TGF-β3
Growth and differentiation of stem cells in Gelfoam®
Sterile Gelfoam (referred to here as collagen sponge; Pharmacia & Upjohn Co.) was used as a 3D scaffold. 19 AD-MSC were suspended in MSCBM at 1 × 10⁷ cells/mL concentration. Ten microliters containing 1 × 10⁵ cells was injected into collagen sponges trimmed into 0.5 cm3 cubes. Replicate collagen sponges were placed on Costar Transwell Clear Inserts (Corning Incorporated-Life Sciences) in 24-well plates and fed three times per week with 2.0 mL of MSCBM with TGF-β3 (10 ng/mL; Lonza) or without TGF-β3 (control). About 10 ng/mL TGF-β3 is the typical dose used in the literature for chondrogenic differentiation. 11 Cells were grown for 2–6 weeks and assayed for proteoglycan production in the presence or absence of TGF-β3 using the 1,9-dimethylmethylene blue (DMB) assay (see below). Additional constructs containing cells were fixed in 10% neutral-buffered formalin for 1 h and embedded in paraffin. Gelfoam was sectioned for immunohistochemical analysis and stained for ECM proteoglycan production using toluidine blue (0.1% in dH2O; Sigma). Proteoglycan production was quantitatively measured using the DMB assay (see below).
Assay of total sulfated glycosaminoglycan production
Cells were grown in 3D culture for 14 days in the presence or absence of TGF-β3 and assayed for concentrations of total sulfated proteoglycan using the DMB assay. 20 DMB (Aldrich) solution was prepared and stored at room temperature in an amber bottle. Collagen sponge constructs containing cells were rinsed two times in HBSS (Gibco) and transferred to separate 1.5 mL microcentrifuge tube. Collagenase type V (Sigma) in HBSS (Gibco) was added to produce a final concentration of 3.0 units/mL. Microcentrifuge tubes were incubated at 37°C until the sponge was completely digested (15–30 min). Samples were assayed in duplicate by mixing 0.1 mL of sample with 1.25 mL DMB solution was added to all samples and standards (0–7.5 μg chondroitin sulfate; Sigma). All tubes were incubated at room temperature in the dark for 30 min followed by centrifugation at room temperature for 15 min at 10,000 rpm. One milliliter of the supernatant was removed and the absorbency read at 595 nm using a Beckman DU 600 spectrophotometer (Fullerton). Formate buffer (pH 3.1) is used as a blank. Sample concentrations are determined from the standard curve, and results expressed as micrograms glycosaminoglycan (GAG)/construct. 19
Immunohistochemistry
Immunohistochemical localizations were carried out on sections of paraffin-embedded 3D cultures as previously described14,21 to identify type I collagen (20 μg/mL; Biodesign International), type II collagen (20 μg/mL; Biodesign International), decorin (25 μg/mL; R&D Systems), keratan sulfate (5 μg/mL; Seikagaku Corporation), and chondroitin sulfate (20 μg/mL; ICN Biomedicals). Negative controls consisted of Rabbit IgG (for collagen I and II; Dako Cytomation) or mouse IgG (for all other antibodies; Dako Cytomation) used at the same concentration as each antibody. The secondary antibody employed the LSAB2 Biotinylated Secondary kit (Dako Cytomation) (10 min.) Localizations utilized peroxidase-conjugated streptavidin (Dako Cytomation) for 10 min and DAB (Dako Cytomation) for 5 min for observation. Slides were counterstained with light green, dehydrated, cleared, and mounted with a resinous mounting medium. Negative controls were processed minus primary antibodies.
Verification of AD-MSC isolation using cell surface markers 17 was performed on paraffin-embedded specimens using the following antibodies: positive localization for stemness was verified by positive localization of CD105 (8 μg/mL; Thermo Scientific), CD90 (3.125 μg/mL; BD Biosciences), CD44 (8 μg/mL; Thermo Scientific), and CD29 (9 μg/mL; Thermo Scientific), and negative localization of CD45 (3.5 μg/mL; Dako Cytomation) and of CD34 (1.5 μg/mL; Dako Cytomation). Immunolocalizations were performed using the LSAB2 Dako detection system as described above.
Gene expression studies and analyses
Three AD-MSC 3D cultures and seven 3D cultures of annulus cells were utilized (Table 1). AD-MSC were cultured using our basal conditions with addition of TGF-β3; disc cells were cultured in 3D as previously described. 19 Cells were cultured for 2 weeks, RNA harvested according to instructions with the Trizol isolation method, checked for quality using the 2100 Bioanalyzer (Agilent Technologies, Inc.), reverse-transcribed to double-stranded cDNA, subjected to two rounds of transcription, and hybridized to the DNA microarray in the Affymetrix Fluidics Station 400. Affymetrix human U133 X3P arrays were used.
Coculture experiments
Disc and AD-MSC grown in 3D scaffold coculture were characterized by cell labeling for separation and observation. Disc cells were labeled before coculture by incubation (10 min) with carboxyfluorescein succinimidyl ester (CFSE; 10 μM) fluorescent-label as previously described. 22 AD-MSC were identified by immunolocalization of the CD44 cell surface marker (as described above) since this marker was not present on disc cells. Replicate samples of AD-MSC, CFSE-labeled disc cells, or premixed AD-MSC and CFSE-labeled disc cells were injected into absorbable collagen scaffold (50,000 AD-MSC and 50,000 annulus cells [to total 100,000 cells] were injected into 0.5 cm3 cubes). Three-dimensional cultures and cocultures were cultured on Costar Transwell Clear Inserts (Corning) for 2 weeks. Concentrations of total sulfated proteoglycans were measured using the DMB assay as described above.
Predicted proteoglycan production in the coculture experiments was calculated using the method of LeVisage et al. 23 For coculture experiments, data are means ± s.e.m. based upon five coculture experiments run in triplicate.
Statistical analysis
Statistical analysis of data other than the microarray studies utilized standard methods using SAS software (version 8.2; SAS Institute). Methods used included unpaired t-tests and Spearman's correlation statistics. A p-value of <0.05 was considered statistically significant. Data are expressed as means ± SEM (n) or ±SD (n) as noted in text and figures. Statistical analysis of gene expression: GeneSifter™ Web-based software (VizX Labs) was used to analyze all microarray data. Using GC-RMA (Robust multiarray average), Affymetrix “.cel” files were uploaded to the GeneSifter Web site and normalized. Using the Student's t-test (two tailed, unpaired), statistical significance was determined (p < 0.05). A correction factor for false discovery rate was applied using the Benjamini and Hochberg method. 24 For filtering purposes, the fold change was set at 2.0 or greater. Gene ontologies (GO) were generated by GeneSifter based on the Gene Ontology Consortium. 25 z-scores were also generated by GeneSifter and indicate any biological significance. A z-score of ≥2 or ≤−2 suggest that genes in a particular GO were altered in expression compared to what would be expected by chance. 26
Results
Verification of stem cell isolation
Human AD-MSC attached well to the standard plastic culture substrate and proliferated well (Fig. 1). Cells exhibited a spindle-shaped morphology. An important part of our experimental design for this work included verification of isolation of MSC. Traditional accepted methods were utilized for this: direction of stem cells to osteogenic and chondrogenic phenotypes (Fig. 2) and immunocytochemical marker localization according to the International Society for Cellular Therapy guidelines 17 (see Materials and Methods section) (Fig. 3). Figure 2 illustrates proteoglycan production in micromass culture, confirming direction to a chondrogenic phenotype (Fig. 2A, B), and CD marker verification of the presence of AD-MSC (positive localizations for CD105, CD90, CD44, and CD29, and negative localization for CD45 and CD34) (Fig. 3).

Human adipose derived-mesenchymal stem cells (AD-MSC) in monolayer culture show a spindle-shaped morphology. Original magnification: ×155.
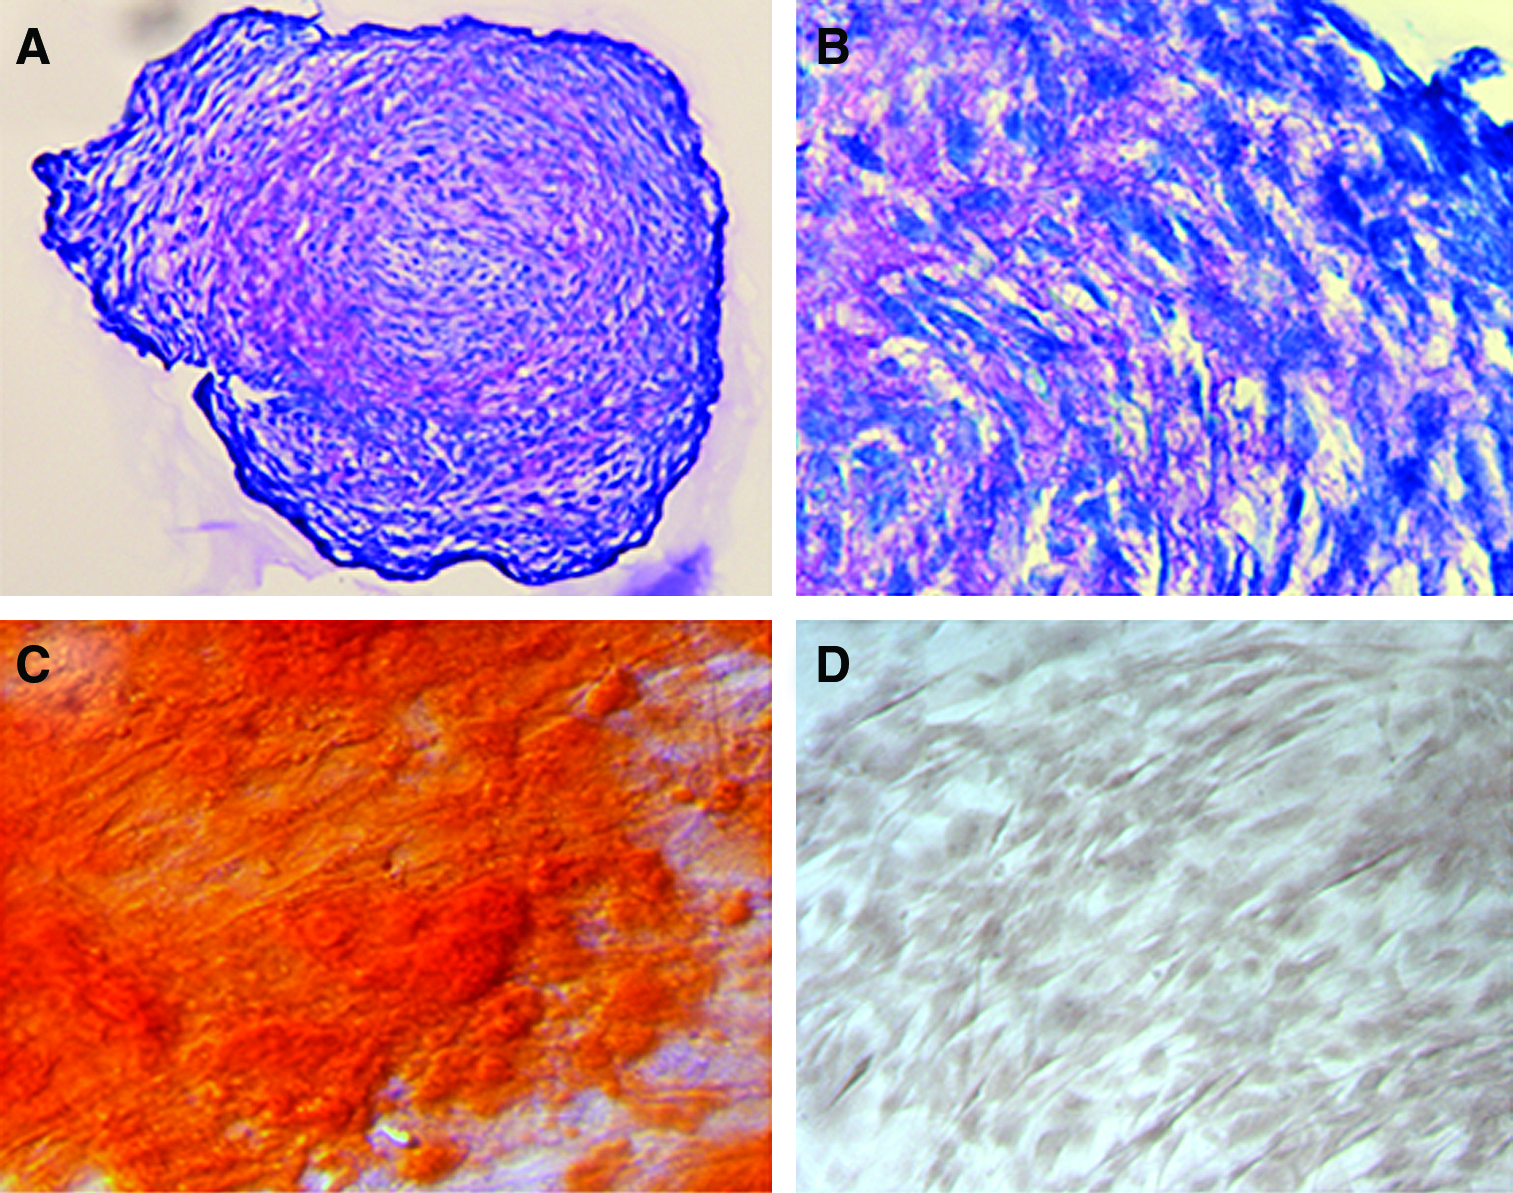
Verification of stem cell status of isolated presumptive AD-MSC was confirmed by culture under specific conditions that directed cells to a chondrogenic phenotype (
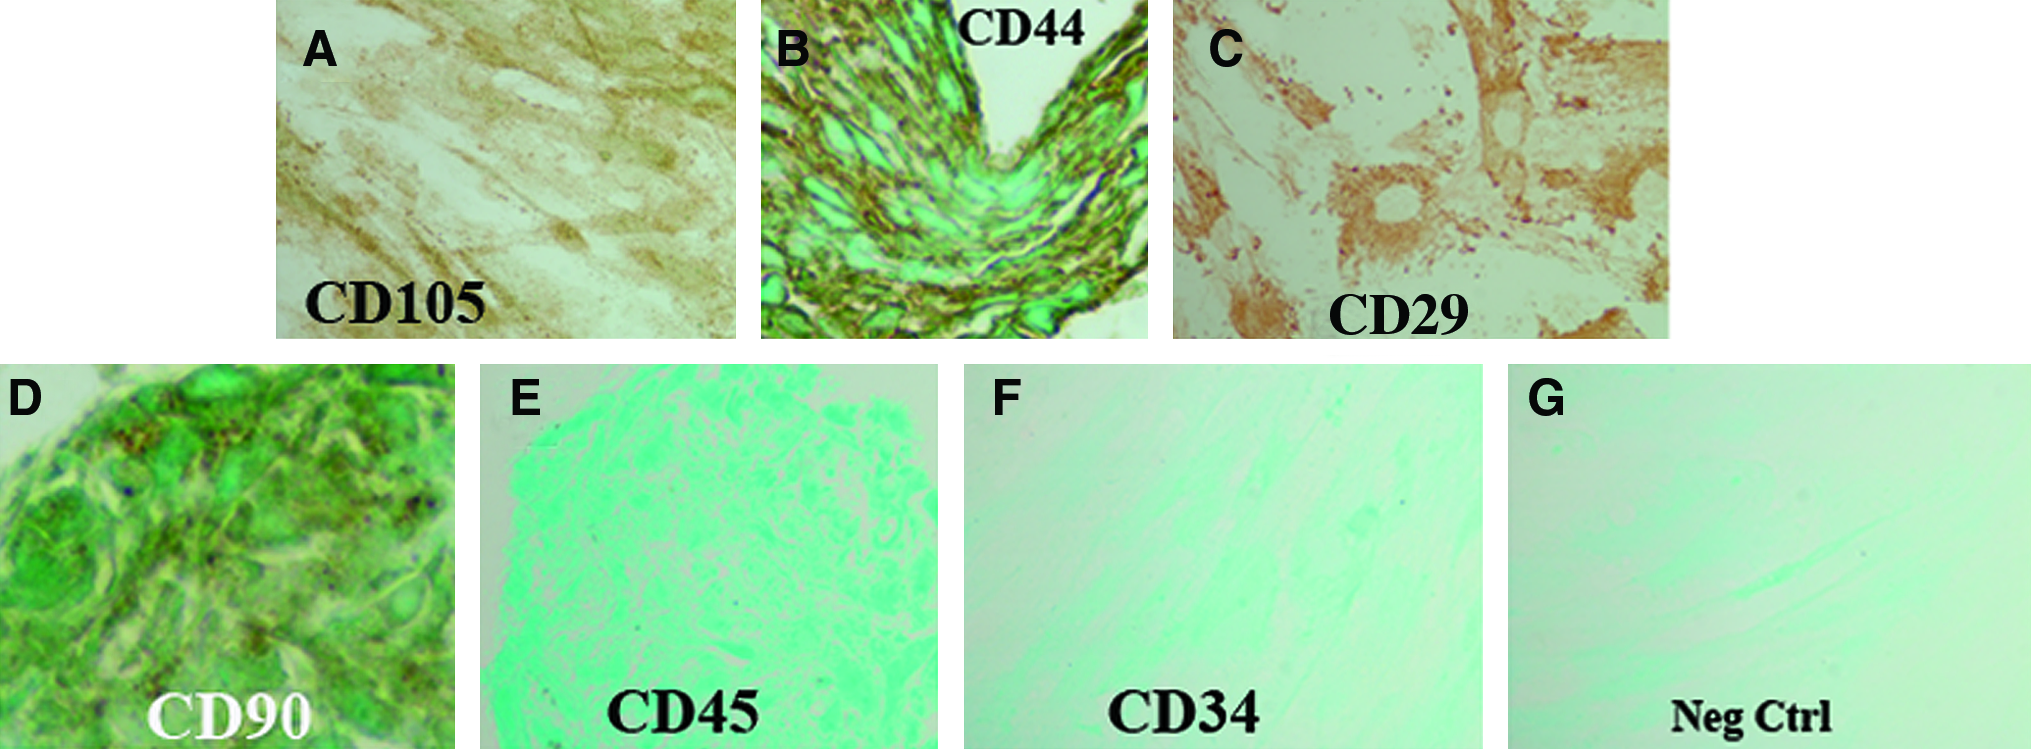
AD-MSC cultures showed the appropriate immunocytologic localizations of stem cell CD markers characteristic of MSC.
17
Isolated AD-MSC showed the appropriate positive localizations for CD105 (
AD-MSC can be directed to a phenotype that shares similarities with disc cells by 3D culture in the presence of TGF-β3
When cultured in the 3D microenvironment in the presence of TGF-β3, AD-MSC attached well and grew well. ECM was also abundant (Fig. 4A). ECM components included type II collagen (Fig. 4B) and chondroitin sulfate (Fig. 4C). To further quantitatively assess proteoglycan production in the presence of TGF-β3, the DMB method was used to assess total sulfated proteoglycans. TGF-β3 culture significantly enhanced proteoglycan production (Fig. 5; p < 0.05).
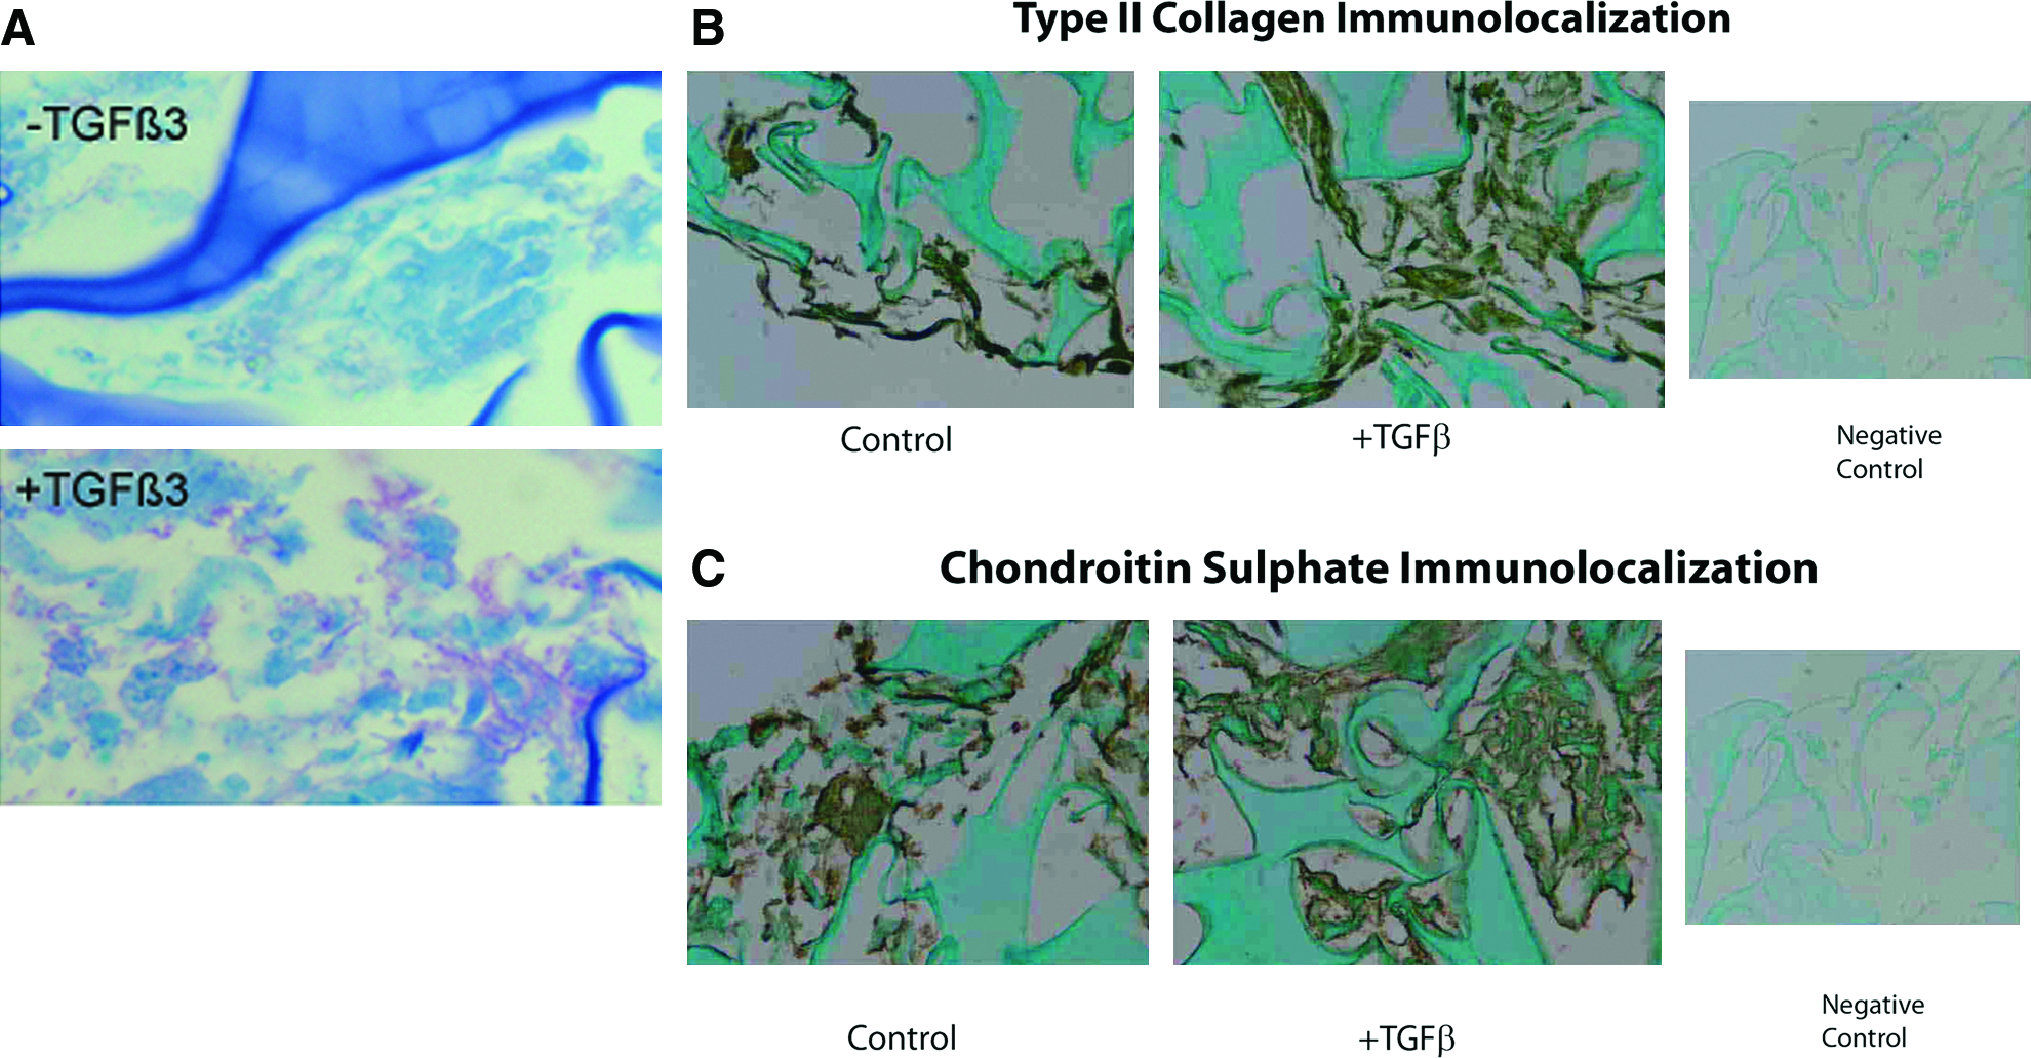
(
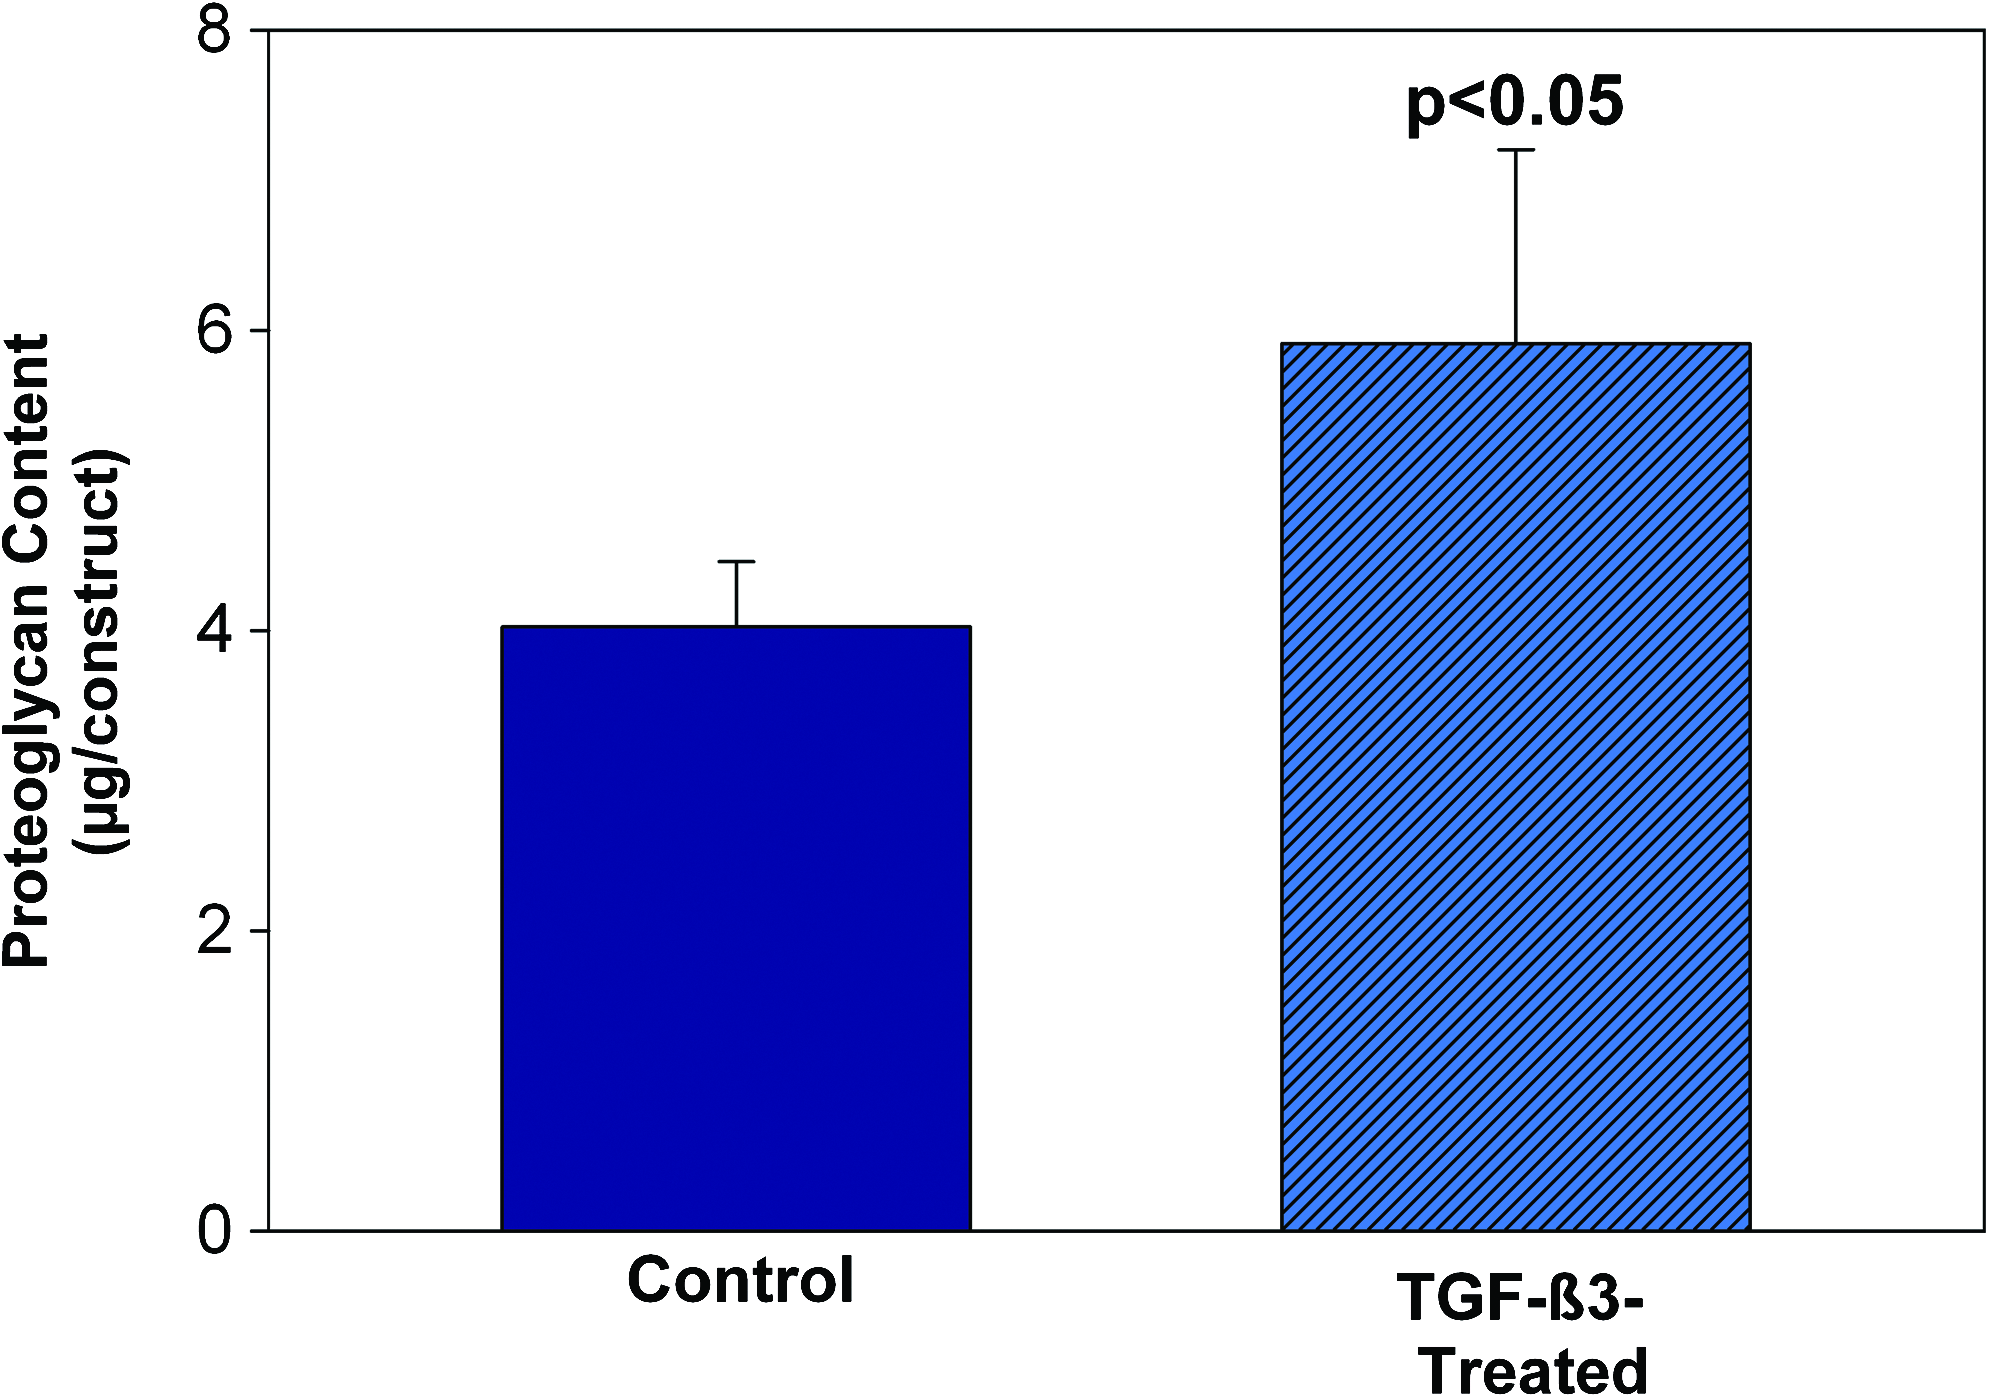
TGF-β3-treated AD-MSC show significantly greater proteoglycan content in 3D cultures compared with controls (p < 0.05) Data are means ± SD, n = 5. Color images available online at www.liebertonline.com/ten.
Comparison of gene profiles of AD-MSC with TGF-β3 versus human annulus cells in 3D culture
Gene expression patterns of AD-MSC in 3D culture in the presence of TGF-β3 were determined and compared to profiles of human annulus cells in 3D culture. GeneSifter was used with application of a correction factor to account for false discovery rates, and for this analysis the fold change level was set at 2.0 or greater. In this comparison of AD-MSC in the presence of TGF-β3 to annulus cells, 4424 genes were found to be significantly upregulated, and 2290 genes downregulated. Table 2 summarizes the gene findings, presenting the gene identified ID, the fold change, and adjusted p-value.
p-Value is adjusted for false discovery rate.
Classification by GeneSifter™: ES, extracellular space; EM, extracellular matrix; CSA, cell–substrate adhesion; CCA, cell–cell adhesion; C, collagen; LC, laminin complex; BL, basal lamina; BM, basement membrane; F, fibril; CA, cell adhesion; SC, sarcoglycan complex.
GO analyses with GeneSifter were performed to classify and group gene changes in Table 2. Major classifications were chosen that encompassed genes associated with (1) ECM, cell adhesion, and cell binding; (2) ECM catabolism; (3) genes inhibiting ECM metalloproteinases; (4) cell proliferation and growth regulation; (5) growth factors; (6) angiogenesis and vascular development; and (7) inflammation and the immune response.
For ECM-related genes, GeneSifter identified 85 genes that were upregulated, and 48 downregulated. Relevant upregulated genes included biglycan, versican, alpha 1, fibronectin 1, elastin, chitinase 3-like 1 (cartilage glycoprotein-39), hevin, SPARC, thrombospondin 3, bone morphogenetic protein (BMP)-1 and BMP receptor, vascular endothelial growth factor A, and alpha 1 chains of collagens type I, III, V, XVIII, VIII, X, XII, matrix metalloproteinase (MMP)-9, -11, -16, -1, -2, -14, several ADAMTS, lysyl oxidase, and protocadherin. Important downregulated genes were integrin alpha-7, -8, -10, -11, TNF receptor superfamily 11b, BMP-2 and -4, Matrilin 2, matrix Gla protein, aggrecan, and decorin.
GeneSifter software was used to generate the z-scores for the Table 2 GO and results are shown in Table 3. z-scores are used to determine any biological significance; z-scores ≥2 or ≤−2 indicate an alteration of gene expression compared to what would be expected by chance. As shown in Table 3, ontologies with a significant finding of overexpressed upregulated genes were ECM (z-score, 4.30), collagen (z-score, 2.23), and cell adhesion (z-score, 5.96). The cell adhesion ontology contained the following subterms that were also significant: cell–cell adhesion (z-score, 2.63) and cell–substrate adhesion (z-score, 2.32). Within the downregulated genes, there was also overexpression representation in ontology groups of extracellular space (z-score, 2.88), basal lamina (z-score, 2.06), and sarcoglycan complex (z-score, 2.19).
Gene ontologies having a z-score ≥2 or ≤−2 are in bold, and signify that more genes in those ontology groups were altered in expression compared to what would be expected.
z-Scores were calculated using GeneSifter software.
Array genes indicate the number of genes on the array for each ontology.
Comparison of AD-MSC gene expression profiles in the presence or absence of TGF-β3
We also were interested in determining the extent to which TGF-β3 exposure in 3D culture modified the gene expression patterns of AD-MSC. Affymetrix gene analyses identified 69 genes that were upregulated and 81 that were downregulated. Table 4 presents the major GeneSifter findings for all genes with organization according to ontology classification by genes involved in development and differentiation; ECM production, cell adhesion, and binding; ECM catabolism; pro- and antiapoptotic genes, cell motility and migration, cell proliferation, and inflammatory/immune responses; coagulation; energy production and ion exchange; and signaling pathways, vesicle trafficking, and oxidative stress.
p-Value adjusted for false discovery rate.
Classification by GeneSifter; DP, developmental process; IO, intracellular organelle; EM, extracellular matrix; ES, extracellular space; BM, basement membrane; C, cytoplasm; CD, cell development; CA, cell adhesion; CCA, cell–cell adhesion; CMP, cellular metabolic process; SDB, SH2 domain binding; CS, cell surface; ST, signal transduction; M, membrane.
z-Scores that were generated by GeneSifter for the GO represented in Table 4 appear in Table 5. There were two ontologies with a significant finding of overexpressed upregulated genes: ECM (z-score, 2.32) and basement membrane (z-score, 2.18). There were other ontologies with significant overexpression of downregulated genes, including cytoplasm (z-score, 2.30), cell adhesion (z-score, 4.37), developmental process (z-score, 2.37), and SH3 domain binding (z-score, 3.09). The cell adhesion ontology also contained the following subterm, which was significant: cell–cell adhesion (z-score, 2.97).
Z- scores were calculated using GeneSifterTM software. Gene ontologies having a z-score ≥ 2 or ≤ −2 are in bold and signify more genes in those ontology groups were altered in expression than compared to what would be expected.
Array Genes indicates the number of genes on the array for each ontology.
Coculture of AD-MSC with human annulus cells enhances proteoglycan production
Our final experimental study tested whether 3D coculture of human intervertebral disc cells with human AD-MSC would stimulate expression and production of ECM components important in the disc, including proteoglycans. Before coculture, annulus cells were labeled with CFSE (Fig. 6A), which was internalized into the cell cytoplasm and could thus be used as a marker with immunohistochemistry in harvested coculture preparations. Postharvest, AD-MSC could also identified by anti-CD44 immunolocalization (Fig. 6B). After the 2 week coculture of annulus and AD-MSC, both cells types were still present at harvest as evidenced by immunocytochemical localizations (Fig. 6C shows dark immunolocalization of CFSE-containing annulus cells; arrows mark AD-MSC that were not labeled with CFSE before coculture).

(
Quantitative analysis of proteoglycan production showed significantly greater proteoglycan concentrations in 3D cocultures than in the AD-MSC cultures (p = 0.04, Fig. 6D). As previously described by LeVisage et al., to assess proteoglycan production in coculture, data were expressed as an increase in sulfated proteoglycans compared with the predicted value taken as the average of the individual control stem and disc cell cultures. 23 Three-dimensional coculture of annulus and AD-MSC resulted in a 44% increase in proteoglycan production compared to the predicted value taken as the average of the individual control stem and disc cultures (predicted proteoglycan content [μg/construct] 2.34 ± 1.62 (5), mean ± SEM (n) vs. coculture mean of 3.21 ± 1.57 (5), p < 0.05).
Discussion
In this study, we utilized cells from the annulus fibrosus of the human intervertebral disc. Although maintenance and regulation of proteoglycan synthesis is also critical within the nucleus pulposus, we have chosen annulus cells here because of our specific interest in development of clinically appropriate future biologic therapies for disc degeneration, especially those that might employ autologous disc and MSC or AD-MSC therapies.27–34 We concur with An et al. and others that for clinical applications, research on the annulus is a logical first step since no therapeutic methods for the nucleus would be likely to be successful in the environment of a compromised annulus tissue.35,36 Ultimately, it is the ECM of the annulus that fails in disc degeneration; dehydration and matrix fraying culminate in the formation of tears within the annulus during biomechanical loading and torsion. This is believed by many to be the major source of incapacitating low back pain conditions. Additionally, nucleus and annulus disc material may rupture through these tears, causing radicular pain. Annular tears are present in >50% of patients in early adulthood and are almost always present in the elderly. 37
Data presented here have shown that AD-MSC were isolated from surgical fat specimens in a manner that retained their multiipotency for osteogenic and chondrogenic differentiation, and their stem cell markers. 23 The AD-MSC grew well in monolayer, and supplementation with TGF-β3 increased GAG production in the 3D microenvironment. Future studies would benefit from utilization of flow cytometry to quantify CD marker profiles of the isolated stem cells, data that the present study did not collect.
Considerable recent research has focused upon AD-MSC, with specific focus upon their ability to be subcultured for considerable periods while retaining their stem cell potentials, 38 their capability for rapid expansion, 39 and their biologic and functional properties.40–42
Gene expression profiling showed patterns that characterized the AD-MSC in 3D culture that involved ECM genes, MMPs, BMPs, and integrins (Table 2). Our study of expression profiles for AD-MSC was designed to utilize seven annulus cell cultures derived from Grades I, II, and III discs, thus excluding the patterns that would be present from cells from the most degenerated Thompson grade IV and V discs. These novel data showed differences in the expression patterns of AD-MSC and annulus fibrosus cells in 3D culture—these changes are important as we continue to explore the potential of AD-MSC in biology therapies for disc degeneration.
It has long been recognized that characterization of disc cell phenotypes, and identification of phenotypic changes with aging/degeneration is a high priority research topic, 43 and although researchers have not yet derived a list of specific gene expression profiles that fully characterize human disc cells, good progress is being made on this topic.44–46 As such research continues to advance, we hope that data presented here will be of use as investigators identify key regulatory events that direct AD-MSC to a disc-like phenotype.
In terms of a general overview of data presented here, AD-MSC cultured in TGF-β3 in collagen sponges showed upregulation of several key disc proteoglycans (biglycan, cartilage oligomeric matrix protein, versican, and brevican) and several key collagens, laminin, fibronectin and elastin) (Table 2); these findings speak to the appropriate direction of the AD-MSC cells to a disc-like phenotype. Associated with these findings were concomitant changes in genes involved in ECM turnover (MMPs and ADAMs) that tell us that the in vitro microenvironment was suitable for matrix remodeling (Table 2, second section). Genes encoding growth factors, such as BMP-1, showed upregulation, and a downregulation of the neurotrophin brain-derived neurotrophic factor (Table 2). Additional expression of other important genes regulating other growth factors and their receptors, ECM components, and chemokines was also identified; their investigation will continue as we further study how AD-MSC can be directed in vitro. Our findings in general support the value of TGF-β as a culture component in the direction of AD-MSC (Table 4 and Table 2) (see additional comments below related to TGF-β).
As might be expected, there were differences in gene expression profiles for human annulus cells in 3D compared to profiles of human AD-MSC. The multipotency of the AD-MSC genome prepares for a wide spectrum of gene expression capabilities. Differences were also present in the gene expression profiles for AD-MSC exposed to TGF-β3 compared to profiles of control AD-MSC.
Our 3D culture per se also has provided a specialized microenvironment that also acted in conjunction with TGF-β3 to direct gene expression.47–49 Understanding how these microenvironments influence the AD-MSC is essential for potential use of these cells in autologous tissue-engineered constructs for biologic therapy of disc degeneration. Researchers hope to be able to utilize specific microenvironments in the future to direct stem cells in a manner that makes them capable of coping with in vivo environments with inherent problems, 50 such as the avascular intervertebral disc.
The use of specific cytokines is now known to be especially important when trying to direct MSC along specific lines of differentiation so as to maximize gene expression characteristics. MSC appear to require such modulation for differentiation as recently shown by Ng et al. in their work with MSC directed to chondrogenic, adipogenic, and osteogenic lineages. 51 Similar previous work by Sales et al. 52 and Mehlhorn et al. 53 have also illustrated the complexity of transcriptional regulation of MSC direction to specific phenotypes.
Data identified in the gene expression profiles presented here are important first steps in exploring the potential of AD-MSC in tissue engineering applications for the intervertebral disc. Elucidation of the resulting cell signaling networks involved in these culture conditions is important for future research studies. Our literature review showed relatively few gene expression characterization studies for AD-MSC, including the earlier studies of Lee et al. 54 and the recent work of Peroni et al. 55 Wagner et al. compared bone marrow MSC with AD-MSC 56 and found many differentially expressed genes.
Guilak et al. have carried out an interesting clonal analysis of the differentiation potential of human AD-MSC that confirmed that they are a type of multipotent adult stem cell (and not a mixed population of unipotential progenitor cells). 57
Relatively little is known or understood about the direct cell contact coculture of AD-MSC and human disc cells, and the majority of this work has utilized cells from the nucleus pulposus, not the annulus as reported here. In the present work, we showed that coculture with annulus cells was feasible with retention of both types of cells in a viable state. Coculture resulted in significantly increased GAG content compared to single culture of either cell type. These novel findings are important for future biology disc therapies that may utilize an autologous cell approach. Li et al. cocultured AD-MSC and rabbit nucleus pulposus cells. 58 Their favorable results showed an increase in type II collagen and aggrecan expression. Richardson et al. utilized human bone-marrow-derived MSC, and cocultured these cells with human cells from the nucleus pulposus. 59 Direct cell contact coculture showed increased expression in marker genes for the nucleus pulposus by MSC. This result was also favored only if the cell ratio favored the nucleus pulposus cells in culture. The authors suggested that if differentiated MSC were implanted into a disc, the retention of the disc phenotype could be restorative to the disc. Lu et al. used the transwell system for coculture of AD-MSC and nucleus pulposus cells in micromass conditions. 60 This technique induced stem cell changes toward a chondrogenic phenotype with type II collagen and aggrecan expression. A final comment about our coculture studies deserves consideration. One should remember that at present we are quite naïve about how other proteins important to disc cell function may be influenced by such coculture; this merits additional study in future experiments.
Work by LeVisage et al., which tested both annulus and nucleus cells, found that only the annulus cells were associated with greater GAG content during MSC coculture. 23 Gaetani et al. have recently studied coculture of nucleus pulposus cells with AD-MSC. 61 They also show improved ECM production. In our study, the annulus cell was chosen because it is the annulus that shows fraying, dehydration, and rupture during disc degeneration and herniation.
We chose to use the Gelfoam 3D sponge system over alginate because our previous extensive studies have shown that annulus cells form only small colonies in alginate with minimal ECM production.21,62 In the collagen sponge microenvironment, ECM formation is superior, and cells proliferate well. Additional evidence supporting the use of the Gelfoam 3D sponge system and annulus cells came from our earlier studies of AD-MSC harvested from fat in a small animal model; these cells were associated with enhanced GAG production and ECM deposition when cocultured with human annulus cells. 15
In summary, findings presented here showed that human AD-MSC were enhanced by 3D culture with the addition of TGF-β3, that AD-MSC showed differences in their gene expression profiles compared to human annulus during 3D culture, and that coculture of AD-MSC and annulus cells significantly increased production of total sulfated proteoglycans. These novel findings have potential application in future cell-based therapies for disc degeneration.
Footnotes
Acknowledgments
The authors wish to thank the Carolinas Back Pain Research Endowment for general lab support, and internal funding from the Health Services Foundation of Carolinas Medical Center. The authors also thank Stanley Getz, M.D., and the Carolinas Cosmetic and Plastic Surgery group for assistance with collection of adipose tissue. This research was performed at Carolinas Medical Center, Charlotte, NC.
Disclosure Statement
No competing financial interests exist.