




Abstract
Introduction:
Human mesenchymal stem cells (hMSCs) are promising candidates for bone engineering and regeneration with a considerable number of experimental successes reported over the last years. However, hMSCs show several limitations for tissue engineering applications, which can be overcome by using human embryonic stem cell-derived mesodermal progenitors (hES-MPs). The aim of this study was to investigate and compare the osteogenic differentiation potential of hMSCs and hES-MPs.
Materials and Methods:
The osteogenic differentiation and mineralization behavior of both cell types were evaluated at passage 5, 10, 15, and 20. Expression of COL1A1, RUNX2, OPN, and OC was evaluated by reverse transcription (RT)-polymerase chain reaction, whereas mineralization was examined by photospectrometry, von Kossa staining, and time-of-flight secondary ion mass spectrometry. The immunoprofile of both cell types was investigated by flow cytometry.
Results:
We demonstrated that, under proper stimulation, hES-MPs undergo osteogenic differentiation and exhibit significantly increased mineralization ability compared to hMSCs after protracted expansion. hES-MPs were also found to express lower amount of human leukocyte antigens class II proteins.
Conclusions:
The high osteogenic ability of hES-MPs, together with low expression of human leukocyte antigens class II, makes these cells an attractive alternative for bulk production of cells for bone engineering applications.
Introduction
Despite the above interesting properties and encouraging results, adult hMSCs manifest important limitations from a tissue engineering perspective. First, after aspiration from patients or donors through more or less invasive procedures, hMSCs must be isolated and enriched through not yet fully established procedures, usually resulting in a high degree of heterogeneity, which may affect the desired clinical outcome.12,13 Second, after protracted ex vivo expansion, hMSCs have been shown to lose their replicative capability,14,15 which limits their bulk production for tissue engineering applications. Further, long-term ex vivo expansion of hMSCs has been associated with significant alterations in the pattern of gene expression, karyotypic instability, 16 spontaneous malignant transformation,17,18 and an impaired differentiation capacity. 19 Other groups have lately demonstrated the ability of murine embryonic stem cells (ESCs) 20 and human ESCs (hESCs) to differentiate into bone-like tissues.21–23 hESCs hold the promise to provide a homogenous and unlimited source of cells for bulk production of cells for tissue engineering and regenerative medicine applications. 24 However, their ability to form teratoma in vivo 25 is today hampering their potential use in clinical applications.
An alternative could be the use of cell lines derived from hESCs. We recently derived such a cell line denoted human embryonic stem cell-derived mesodermal progenitors (hES-MPs), which do not express any of the hESC-specific markers and do not form teratoma in vivo.26,27 In fact, the hES-MPs highly resemble hMSCs considering their ability to differentiate toward tissues of the mesodermal lineage, 26 as well as in terms of their gene expression and surface marker profile. 27 However, hES-MPs display significantly higher proliferation ability than hMSCs. Additionally, it has been demonstrated that hES-MPs display lower amount of human leukocyte antigen (HLA) class II proteins than hMSCs, suggesting that hES-MPs may be well qualified for the successful treatment of musculoskeletal conditions. 27 Unlike other hESC-derived mesodermal progenitors, hES-MPs can be derived through a simple, robust, and reproducible protocol under xeno-free conditions, 26 which is a fundamental prerequisite for application of stem cells in clinical situations.
Many studies, over the last years, have been performed to examine the osteogenic potential of individual cell types, such as MSCs and hESC-derived progenitor cells with encouraging results.21,28 However, there are no studies comparing the osteogenic potential of the above cell types at different time points and after protracted expansion.
Thus, the aim of this study was to evaluate and compare the osteogenic differentiation potential of hMSCs and hES-MPs with special regard to their differentiation capacity after protracted ex vivo expansion, and to estimate their potential for bulk production of cells for bone tissue engineering applications.
Materials and Methods
Cell types
hMSCs were isolated after informed consent from bone marrow aspirates from the iliac crest of three patients (age 14, 27, and 43 years, respectively) undergoing spinal fusion. Briefly, 5 mL of fresh bone marrow was transferred into 5 mL of a solution of phosphate buffer containing Heparin E500 (Heparin LEO; Apoteket AB) to prevent coagulation. Adipose tissue was removed by centrifugation at 1800 rpm for 5 min. hMSCs were then isolated by gradient centrifugation using CPT Vacutainer® tubes prefilled with Ficoll (Pharmacia) according to manufacturer's instructions. The donation of bone marrow was approved by the ethics committee at the Medical Faculty at Gothenburg University (Dnr. 532-04).
hES-MPs were provided by Cellartis. The hES-MPs were derived from an undifferentiated hESC line (SA002.5), and the characterization of hES-MPs has been described earlier.26,27
Briefly, undifferentiated hES cells were removed from the supporting feeder layer and plated onto 0.1% porcine-gelatin-coated cell culture dishes (BD Falcon/BD Biosciences) in a medium consisting of DMEM-HG (PAA Laboratories) supplemented with 1% penicillin–streptomycin (PEST; PAA Laboratories), L-glutamine (2 mM; Gibco), 10% fetal bovine serum (FBS; Gibco), and 10 ng/mL basic fibroblast growth factor (bFGF). To initiate the derivation of hES-MP cells, the hES cells were enzymatically passaged as a single-cell suspension using TrypLE™ Select (Invitrogen) and were subsequently plated onto gelatin-coated culture dishes. This procedure was repeated every 7 days until the cell population became homogeneous for a mesenchymal morphology. After the initial derivation steps, the hES-MP cells were cultured in uncoated tissue culture flasks (BD Falcon/BD Biosciences) in a humidified atmosphere at 37°C and 5% CO2 and enzymatically passaged with TrypLE Select every 7 days.
Cell expansion
Both hMSCs and hES-MPs were expanded up to passage 20. At passages 5, 10, 15, and 20 (P5, P10, P15, and P20, respectively), cells were harvested and the differentiation potential was evaluated. hMSCs were expanded in a medium consisting of DMEM-LG (PAA Laboratories) supplemented with 1% PEST (PAA Laboratories), L-glutamine (2 mM; Gibco), 10% FBS (Gibco), and 10 ng/mL human recombinant bFGF (Invitrogen). hES-MPs were expanded in DMEM-HG (PAA Laboratories), supplemented with the same additives as described above for the hMSCs. Media were changed every 3–4 days, and cells were passaged when reaching 80% confluence. Both cell types were cultured at 37°C in 5% CO2.
Flow cytometry analysis
Flow cytometry analysis was used to verify isolation and enrichment of hMSCs and examine expression of immunological markers.
To verify enrichment of hMSCs, cells were stained with CD34-PerCP, CD45-FITC, CD105-FITC, and CD166-PE antibodies (all from Ancell).
Expression of immunological markers was studied in both hMSCs and hES-MPs at P5 under osteogenic conditions and after treatment with interferon-gamma (IFN-γ). After 7 days of culture, the cells were treated with IFN-γ (100 U/mL; R&D Systems Europe Ltd.) and cultured for 7 additional days. The cells were then stained with HLA-ABC-FITC (BD Biosciences), HLA-DR-FITC (BD Biosciences), CD80-FITC (BD Biosciences), and CD86-PerCP-Cy5 antibodies (Ancell).
All samples were analyzed using the FACS Aria flow cytometer (Becton Dickinson) using FACS Diva software (Becton Dickinson).
Osteogenic differentiation
hMSCs and hES-MPs at P5, P10, P15, and P20 were cultured under osteogenic conditions, for 6 weeks. Briefly, cells were seeded in 24-well plates (Becton Dickinson) at a density of 10,000 cells per cm2 and cultured in DMEM-LG supplemented with 1% PEST, L-glutamine (2 mM), 10% fetal calf serum, L-ascorbic acid (4.5 × 10⁻⁵ M; Sigma-Aldrich), dexamethasone (10−6 M; Sigma-Aldrich), and β-glycerophosphate (2 × 10⁻² M; Calbiochem).
All cells were incubated at 37°C in 5% CO2. Media were changed every 3–4 days, and cells were harvested every week to examine cellular differentiation and mineralization. Per each experiment, cells were plated in triplicate.
Alkaline phosphatase activity
Alkaline phosphatase (ALP) activity was measured after lysis of the cells using M-PER (Fisher Scientific). ALP activity was assayed by using p-nitrophenylphosphate as substrate. The quantity (in alkaline solution) of p-nitrophenol produced, which exhibits an absorbance maximum at 405 nm, was considered directly proportional to the ALP activity. The analysis was performed at the accredited laboratory of Sahlgrenska University Hospital.
Calcium and phosphate content
The amount of mineralized matrix produced was evaluated for both cell types at P5, P10, P15, and P20. Cells were cultured for 6 weeks under osteogenic condition, and the content of calcium and phosphate in the matrix was assessed weekly. Briefly, samples were rinsed twice with the culturing medium (without serum) and fixed in Hisotfix™ (Histolab Products AB) for 30 min. After rinsing with distilled H2O, the samples were demineralized by incubation in HCl (0.6 N) on an orbital shaker for 24 h at room temperature. The calcium content was then measured using the ortho-cresolphthalein complexone method and phosphate was determined by colorimetry of phospho-vanado-molybdic acid. The analyses were performed at the accredited laboratory of Sahlgrenska University Hospital.
von Kossa staining
Mineralization was assayed, for both cell types, at P5, P10, P15, and P20 by von Kossa staining. Cells were cultured for 6 weeks under osteogenic condition and stained weekly. Briefly, cells were washed with phosphate-buffered saline and then fixed in Histofix™ for 30 min. A solution of AgNO3 (2% w/v; Sigma-Aldrich) was added, and the plates kept in dark for 10 min. The plates were then rinsed three times with distilled H2O before being exposed to bright light for 15 min. After washing with distilled H2O, samples were quickly dehydrated adding EtOH (95%).
Time-of-flight secondary ion mass spectrometry
Mineralization was evaluated by time-of-flight secondary ion mass spectrometry (TOF-SIMS) analysis for both cell types. At P5 cells were plated into 24-well plates and cultured under osteogenic conditions up to 6 weeks. After 3 and 6 weeks, samples were fixed and mineral deposition was examined. Undifferentiated cells were used as control. Briefly, samples were rinsed twice with DMEM-LG and subsequently treated with ethanol (95%) to dissolve membranes and fix the samples.
TOF-SIMS analyses were carried out using a TOF-SIMS IV (ION-TOF, GmbH) instrument equipped with a Bi cluster ion source and a C60+ ion sources. Analysis was done with the instrument optimized for high mass resolution (m/Δm ∼5000, beam diameter 3.5 μm) using 25 keV Bi3+ primary ions at a pulsed current of 0.1 pA or with the instrument optimized for high lateral resolution using 50 keV Bi3++ primary ions at 0.04 pA. Depth profiles and 3D maps were recorded by repeated sputtering of the surface using 10 keV C60+ ions (300 × 300 μm, 0.6–2.6 nA) and analyzed (Bi3+ primary ions, high mass resolution, 200 × 200 μm, 128 × 128 pixels) in an alternating mode. The data file acquired during the analysis contains an entire mass spectrum in each of the 128 × 128 pixels within the analysis area, and at the different sputtering times, allowing for retrospective reconstruction of the data in different forms, such as (1) depth profiles showing the signal intensity of selected ion peaks added over the entire analysis area as a function of sputtering time or sputter dose (number of applied sputter ions per surface area), (2) 2D images showing the signal intensity of selected ion peaks in selected horizontal or vertical cuts through the sample (in vertical cuts the depth coordinate is represented by the sputtering time), or (3) mass spectra from a selected 3D region of the sample obtained by selecting a region of interest on the sample surface and a selected range of sputtering times. Several peaks in the mass spectra could be assigned to hydroxyapatite (HA), based on comparison with a reference spectrum recorded on a pure HA sample. A number of peaks were assigned to proteins, originating from the cell material or protein deposits, based on the 3D colocalization with small nitrogen-containing organic fragment ions.
Quantitative reverse transcription-polymerase chain reaction
Cells at P5 and P20 cultured in the osteogenic medium were harvested after 1–4 weeks. The cells were lysed in 350 μL RLT buffer with addition of 1% β-mercaptoethanol and vortexed for 1 min. The lysate was transferred directly into a QIAshredder spin column and centrifuged for 2 min. Total RNA from the samples was extracted using RNeasy® Minikit (Qiagen GmbH) according to the manufacturer's instructions. DNAse treatment was performed to eliminate any contamination from genomic DNA. Each sample was normalized to 50 ng/μL before the reverse transcription. Reverse transcription was carried out using iScript cDNA Synthesis Kit (Bio-Rad) in a 10 μL reaction, according to the manufacturer's instructions. Primers for RUNX2, COL1A1, OPN, and OC were designed using Primer3 Web-based software. 29 Design parameters were adjusted to minimize formation of artifact products and to be able to use an annealing temperature in the polymerase chain reaction (PCR) at about 60°C. Primers were designed to yield short amplicons (preferably <200 bp) and to function well with SYBR Green I fluorescent dye for detection of the PCR products in real time. Primer sequences are available at TATAA Biocenter AB (www.tataa.com).
Real-time PCR was performed in duplicates using the Mastercycler ep realplex (Eppendorf ) in 20 μL reactions. Cycling conditions were 95°C for 10 min followed by 45 cycles of 95°C for 20 s, 60°C for 20 s, and 72°C for 20 s. The fluorescence was read at the end of the 72°C step. Melting curves were recorded after the run by stepwise temperature increase (1°C/5 s) from 65°C to 95°C.
Quantities of target genes were presented as normalized to the number of cell using expression of 18S ribosomal subunit. Normalized relative quantities were calculated using the delta Ct method and 90% PCR efficiency (k × 1.9Δct).
Oil-red O staining
After 25 days of culture under osteogenic conditions, with or without bone morphogenetic protein (BMP) 2 (25 ng/mL; R&D Systems), hMSCs and hES-MP cells at P5 were analyzed for lipid content with microscopic inspection and oil-red O staining. For oil-red O staining, the cells were washed in phosphate-buffered saline and fixed in Histofix for 10 min. The cells were then stained with oil-red O (Merck) solution (in 60% isopropanol) for 1 h followed by repeated washings with water. Quantification of the lipid content was obtained by using BioPix Software (www.biopix.se).
Statistical analysis
Results are expressed as means and standard deviations. All data points were transformed to log 10 scale in attempt to satisfy normality assumptions. A small value of 10−6 was added to all raw measurements to avoid infinity. Linear general least squares model for repeated measures was fit to all datasets where signals were detected for >1 week among at least one of the cell types. Autoregressive covariance structure with heterogeneous variances over time was chosen for the model. Contrasts were calculated to estimate the difference between the cell types for each week. Two-sided t-test was performed to test weather the contrasts differed significantly from zero. Open source statistical software package R (www.r-project.org) was used for the model and contrast fitting. Bonferroni was used for repeated measurements correction. Where no repeated measurements were performed, differences were determined by Student's independent t-test. For all the analyses, a value of p < 0.05 was taken as significant difference.
Results
Mineralization ability of hMSCs isolated from different donors
To evaluate the osteogenic differentiation capacity of hMSCs isolated from three donors (14, 27, and 43 years old), cells at P5 were cultured under osteogenic conditions. After 5 weeks of culture, cells were stained with von Kossa staining and content of calcium and phosphate within the matrix produced by the cells was quantified. Higher content of calcium and phosphate as well as stronger von Kossa staining were obtained for hMSCs from the 14-year-old donor (data not shown). Hence, only hMSCs from the 14-year-old donor were used in the extensive comparison with hES-MPs.
Flow cytometry analysis of hMSCs
Flow cytometry analysis was used to evaluate the enrichment of a homogenous population of hMSCs. Our results demonstrate that 96% ± 2% of the cells were CD166+/CD45− and 94% ± 1% of the cells were CD105+/CD34− (data not shown).
ALP activity
In Figure 1 the ALP results for hMSCs and hES-MPs are shown. At all investigated passage numbers a general increase in the ALP activity can be observed over time for both hMSCs and hES-MPs. However, while hMSCs tend to reach the peak of ALP activity between weeks 4 and 5 (Fig. 1A–D), hES-MPs manifest the highest level of ALP activity at week 6 for all the investigated passages (Fig. 1A–D). Interestingly, for both hMSCs and hES-MPs, a significant decrease in the ALP activity can be observed with increasing number of passage, dropping significantly from P5 to P20. The activity of ALP produced by hMSCs at P15 and P20, for example, was detectable starting from weeks 2 and 4, respectively, whereas no ALP activity was detected for hES-MPs until week 5 both at P15 and P20 (Fig. 1C, D). At all the investigated passages the ALP activity was significantly higher in hMSCs than in hES-MPs for the first 5 weeks of culture (Fig. 1A–D).
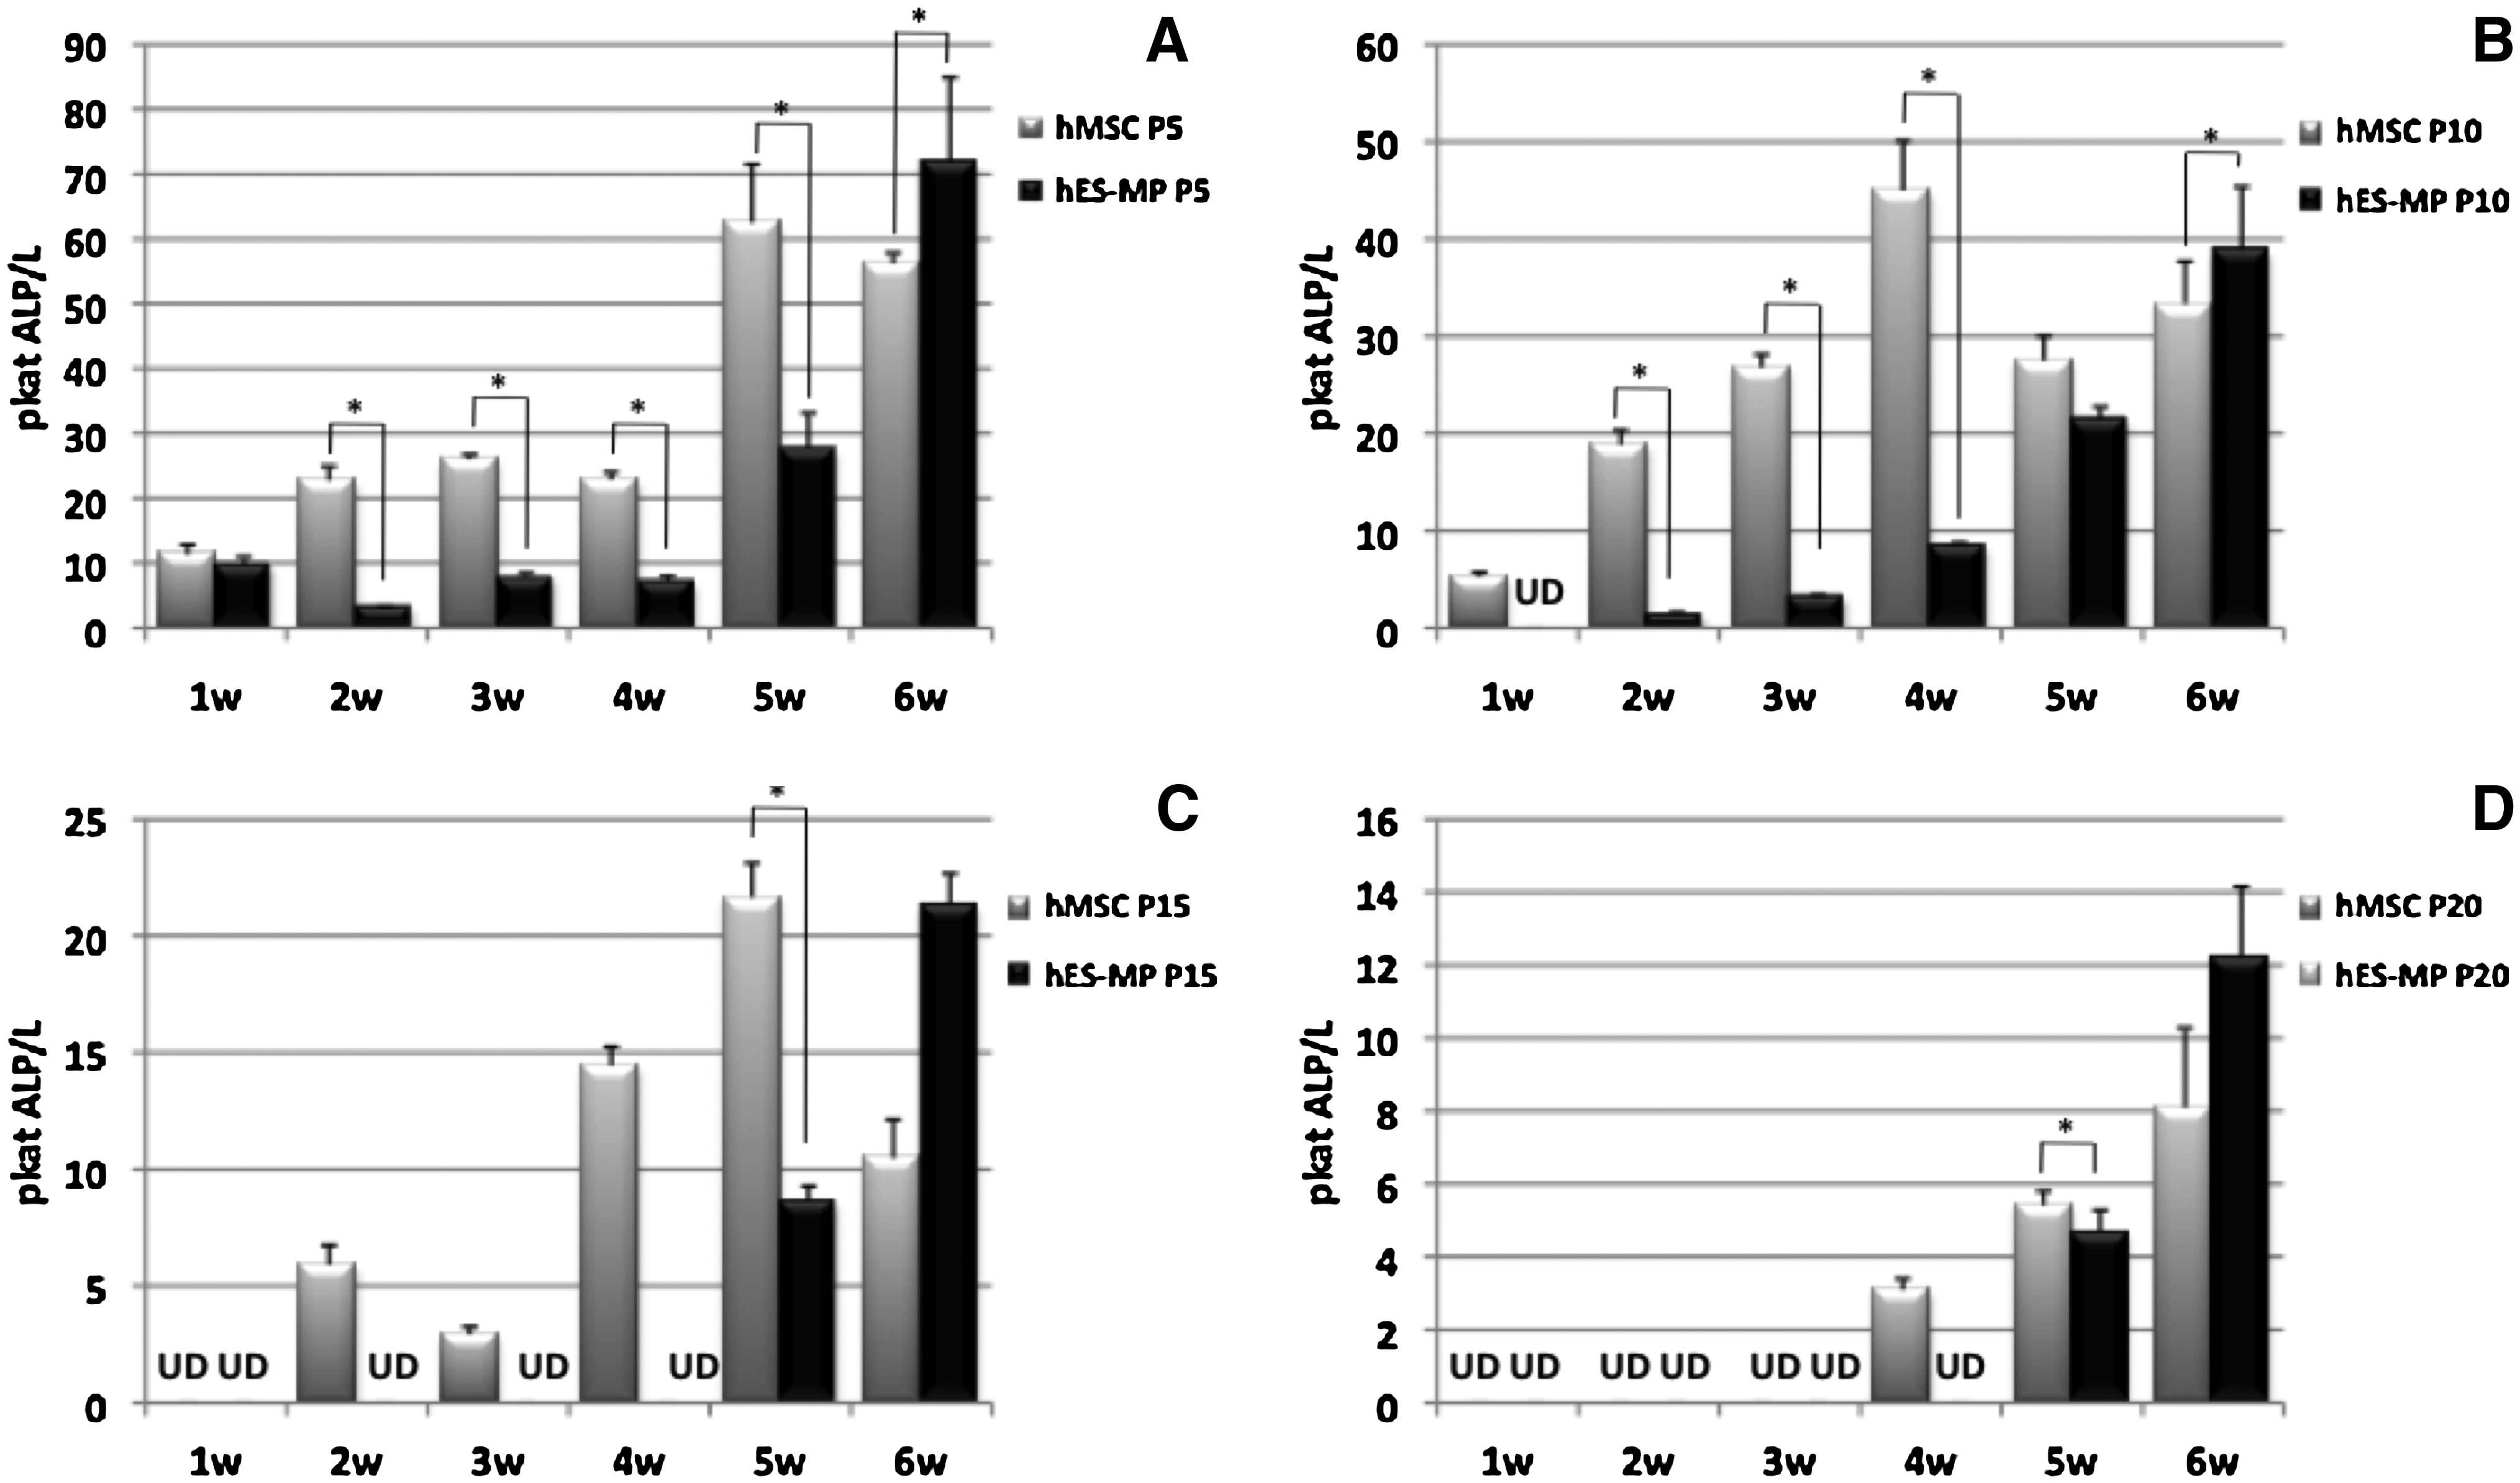
Histograms demonstrating alkaline phosphatase (ALP) activity for human mesenchymal stem cells (hMSCs) and human embryonic stem cell-derived mesodermal progenitors (hES-MPs) during 6 weeks of culture under osteogenic conditions at passage 5 (P5) (
Calcium/phosphate content
In Figure 2 the contents of calcium (Fig. 2A–D) and phosphate (Fig. 2E–H) in the matrix are shown for both cell types. hMSCs displayed a progressive increase in calcium content over time, with the highest levels detected after 6 weeks (Fig. 2A–D). However, a general decrease in the level of calcium in the matrix can be seen for cultures at higher passage numbers, to the extent that no calcium is detected in P20 cultures (Fig. 2D). A similar trend can be observed for hES-MPs, where, unlike hMSCs, calcium is detectable also at P20 after 6 weeks of culture (Fig. 2D).

Histograms displaying the content of calcium (
Phosphate levels detected for hMSCs and hES-MPs, at all passage numbers (Fig. 2E–H), exhibit a similar tendency, as for calcium, with an increasing level of phosphate detected from weeks 3 to 6. Taken together, the calcium and phosphate results demonstrate that hES-MPs start mineralizing the matrix earlier than hMSCs at P5 and P10.
von Kossa staining
In Figure 3 von Kossa light microscopy images of both cell types at different passages are shown. Our results show that at P5 both hMSCs (Fig. 3C, D) and hES-MPs (Fig. 3F–H) are able to mineralize the matrix, and show highest calcium deposition after 6 weeks of culture under osteogenic conditions. At P10, instead, hMSCs are not stained until week 5 and result slightly positive to the staining after 6 weeks of culture (Fig. 3L), whereas hES-MPs start to mineralize earlier (Fig. 3N) and produce a matrix strongly positive for von Kossa staining after 6 weeks. At P15, both cell types fail to mineralize (Fig. 3Q–T and U–X, respectively). Interestingly, at P15 hMSCs exhibit altered cell morphology and reduced proliferative capacity.
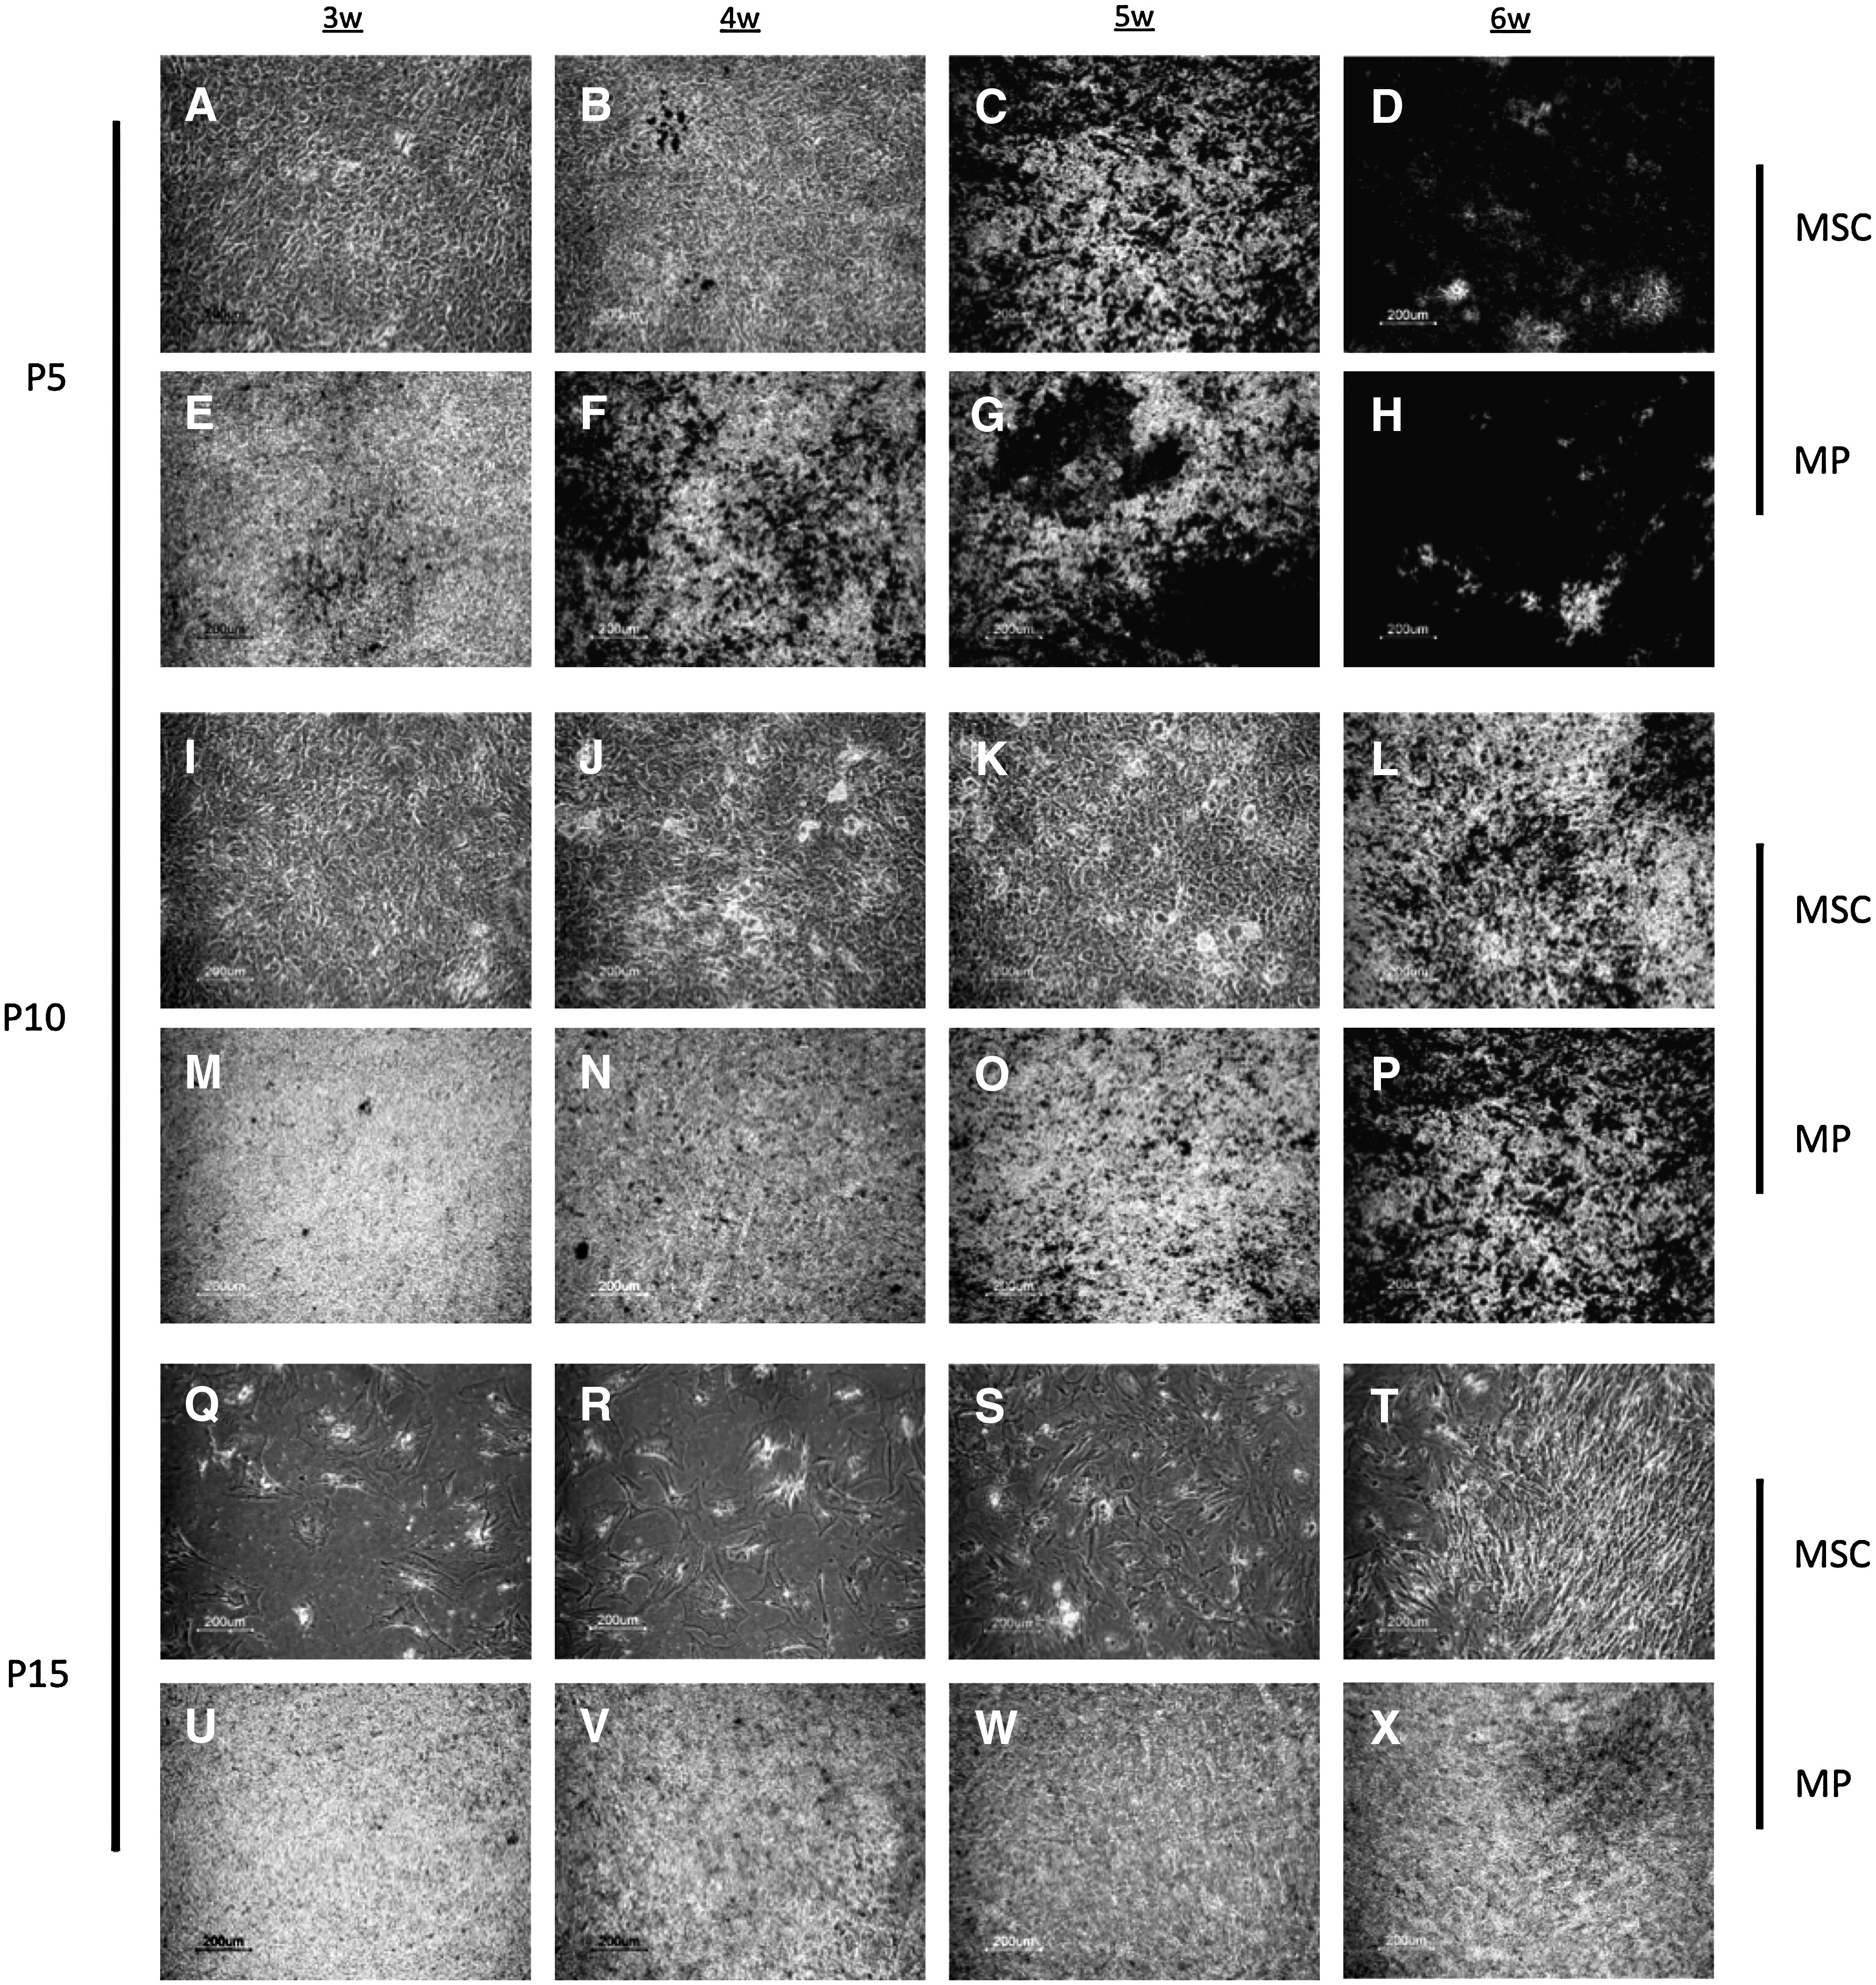
Light micrographs showing von Kossa–stained samples, after 3–6 weeks of osteoinduction, of hMSCs (
No mineralization was detected for both cell types at P20 (data not shown).
Time-of-flight secondary ion mass spectrometry
The results from depth profile measurements on undifferentiated cells as well as cells after 3 and 6 weeks of culture under osteogenic conditions are shown in Figure 4. The profile analyses indicate a strong protein-related signal at the sample outermost layer for both hMSCs and hES-MPs (Fig. 4A and B, respectively). Interestingly, weak signals were obtained for the same protein residues for undifferentiated cells (blue lines), whereas no significant differences were observed between weeks 3 and 6 per each cell type, with hMSCs presenting an overall higher signal intensity (Fig. 4A) than hES-MPs (Fig. 4B). Differently, signals representing Ca2PO3 ions display their peak intensities further down in the samples for both cell types (Fig. 4C, D), with highest value intensities acquired from samples after 6 weeks of culture under osteogenic conditions. As seen in Figure 4C, hES-MPs tend to mineralize faster than hMSCs displaying stronger signals after 3 weeks of culture, while hMSCs display higher mineralization of the matrix after 6 weeks (Fig. 4D) than hES-MPs.

Depth profiles showing the signal intensities from selected ions versus sputter time (depth). Protein-related (UI 165, m/z 164.94) (
TOF-SIMS images (Fig. 4F, G) from the depth profile measurements confirm the 3D distribution, displaying the downward localization of Ca2PO3± ions in the samples and the increase in matrix mineralization overtime (3–6 weeks) for both hMSCs (Fig. 4F, H) and hES-MPs (Fig. 4E, G). In Figure 4I, spectra from the later stage of sputtering for samples at weeks 3 and 6 are shown, which demonstrate that calcium–phosphate spectra acquired from the analyses strictly correspond to the reference spectrum for pure HA.
Gene expression
Expression of markers specific for osteogenic differentiation was evaluated by reverse transcription (RT)-PCR. In Figure 5 relative expression of RUNX2, COL1A1, OPN, and OC at P5 (Fig. 5A, C, E, G) and at P20 (Fig. 5B, D, F, H) is shown. Per each gene the higher expression value was used as baseline. The results demonstrate that at P5 the expression profiles of RUNX2 (Fig. 5A), COL1A1 (Fig. 5C), OPN (Fig. 5E), and OC (Fig. 5G) are very similar for both cell types, with corresponding variations from week 1 to 4. However, hES-MPs display significantly increased expression of RUNX2 after 1 week (Fig. 5A) and OPN after 2 weeks (Fig. 5E). On the other hand, OPN displays significantly increased expression in hMSCs than in hES-MPs after 3 and 4 weeks of culture (Fig. 5E). At P20, hES-MPs show significantly higher expression of RUNX2 at weeks 2, 3, and 4 (Fig. 5B) and COL1A1 at week 4 (Fig. 5D) after 2–4 weeks compared to hMSCs, whereas no variation can be observed in expression of OPN (Fig. 5F) and OC (Fig. 5H) genes.

Reverse transcription-polymerase chain reaction results showing expression of RUNX2, COL1A1, OPN, and OC for hMSCs and hES-MPs (
Adipogenic differentiation
Oil-red O staining was used for evaluation of adipogenic differentiation of hMSCs and hES-MPs after 25 days of culture under osteogenic conditions. The results in Figure 6 demonstrate that hMSCs are positive for the staining either with or without BMP2 treatment (Fig. 6E, F). However, in the presence of BMP2, a higher percentage of hMSCs differentiate into the adipogenic lineage, as displayed qualitatively (Fig. 6B) and quantitatively (Fig. 6I), resulting in about 10-fold increase in adipogenic differentiation. On the other hand, hES-MPs demonstrated no signs of adipogenic differentiation under the two conditions studied, as shown in Figure 6C, D, and I.

Light micrographs showing hMSCs (
HLA expression
Flow cytometry analysis for immunological markers demonstrated that hMSCs and hES-MPs are negative for CD80 (Fig. 7A, E) and CD86 (Fig. 7B, F). On the other hand, hMSCs were positive for both HLA-ABC (Fig. 7C) and HLA-DR (Fig. 7D). Unlike hMSCs, the hES-MPs are found to be negative for HLA-DR (Fig. 7H) and displayed slightly lower expression of HLA-ABC than hMSCs (Fig. 7G).

Flow cytometry analysis of CD80, CD86, human leukocyte antigens (HLA)-ABC, and HLA-DR for hMSCs (
Discussion
hMSCs have been extensively investigated for bone engineering applications due to their ability to differentiate into tissues of the mesodermal lineage, but show some important limitations as described in the introduction.12–19 On the other hand, hES-MPs derived at our laboratory highly resemble hMSCs, but display a higher proliferative ability and, unlike hESCs, do not form teratoma in vivo.26,27 Additionally, the results presented in this article demonstrate a faster mineralization of the matrix produced by hES-MPs than by hMSCs. Moreover, hES-MPs retain a good proliferation ability and display high mineralization potential also after protracted expansion, which is a fundamental requisite for bulk production of cells for tissue engineering applications. It is of importance to note that standard culture conditions, established for the osteogenic differentiation of cells of the mesenchymal lineage, were used, and that more optimal conditions for the osteogenic stimulation of hES-MPs may represent an effective strategy to augment their osteogenic potential for tissue engineering applications.
When studying the osteogenic differentiation capability of hMSCs and hES-MPs, an increased activity of ALP, which is an early marker of osteogenic differentiation, 30 was observed from week 1 onward, with peaks of intracellular ALP activity measured after 5 weeks for hMSCs and 6 weeks for hES-MPs. However, hMSCs were found to have a significantly higher ALP activity than hES-MPs, especially at a low passage. This finding is in accordance with recently published results, 31 comparing the osteogenic potential of hMSCs and human embryonic-derived MSCs, and underlines a somehow different responsiveness to the osteogenic simulation of the investigated cell types. Interestingly, we observed that both cell types displayed a substantial decrease in ALP activity after protracted expansion, with negligible ALP activity detected at P20.
The general decrease in ALP activity may be interpreted either as an actual reduction of the osteogenic potential, due to intrinsic biological factors associated with senescence, or as a decline in cell sensitivity to osteogenic factors, which determines a delay in cell differentiation after prolonged expansion. Additional studies examining the responsiveness of these cells to osteogenic factors after more weeks under stimulation are needed to better understand this phenomenon.
Despite the significantly lower ALP activity measured, hES-MPs displayed a greater mineralization ability than hMSCs, particularly considering the significantly higher contents of calcium and phosphate after 3–5 weeks of culture under osteogenic conditions. This suggests that ALP activity may not be critical for matrix mineralization of hES-MPs, and the two investigated cell types may be subjected to dissimilar signaling pathways and dynamics in relation to their differentiation toward the osteogenic lineage. Additionally, our results demonstrate that the amount of calcium and phosphate deposited in the matrix produced by both cell types was inversely proportional to the number of passages, underlining an impaired mineralization potential owing to prolonged expansion. However, hES-MPs displayed a significantly higher ability to deposit calcium and phosphate than hMSCs, with levels detectable also at P20 after 6 weeks under osteogenic stimulation. Interestingly, the extensive decrease in the mineralization properties of hMSCs after prolonged expansion was associated with a reduced proliferation ability and aberrant cell morphology, in accordance with earlier results at our lab 27 and results obtained by other groups. 19 The above changes, which usually are evidence of cell senescence, very likely account for the decrease in mineralization potential of hMSCs after protracted expansion, as previously described. 32 Although a general decrease in the mineralization potential of hES-MPs after protracted expansion was observed this was not associated with a reduction in proliferation and changes in cell morphology. 27 Hence, it is important to examine the mineralization potential of hES-MPs after more weeks under osteogenic stimulation to fully assess their potential for bone engineering applications. We therefore report a comparative advantage of hES-MPs over hMSCs in mineralization potential, which may represent optimal source of cells for bone engineering and regeneration. Boyd et al. recently reported similar results, demonstrating an increased mineralization capability of hESC-derived mesodermal progenitors, derived using EGM2-MV, which is a proprietary microvascular endothelial media containing bFGF, VEGF, EGF, R3-IGF-1, 25, and FBS, compared to hMSCs. 33 They further did not assess the osteogenic ability of the cells after protracted expansion.
To better understand whether the deposited nodules of calcium and phosphate were arranged in HA-like structures, a TOF-SIMS analysis of samples at P5 was performed. TOF-SIMS has lately been exploited for examination of matrix mineralization following osteogenic differentiation.34,35 The present data demonstrate that the calcium/phosphate spectra acquired, both after 3 and 6 weeks under osteogenic stimulation, strictly correspond to the reference spectrum for pure HA. Similarly to the calcium/phosphate and von Kossa data, TOF-SIMS measurements showed that HA-like content in the matrix increased over time, with the highest levels detected after 6 weeks of stimulation for both cell types. A similar trend was observed for protein-related signals, indicating an increase in extracellular matrix synthesis induced by osteogenic stimulation for both hMSCs and hES-MPs. Interestingly, the results obtained from depth profile measurements of stimulated samples revealed a downward localization of HA-like minerals in the samples, indicating that mineral deposition occurs beneath a superposed layer of synthesized extracellular matrix.
Expression of genes involved in the osteogenic differentiation process and characteristics of bone tissue showed a similar profile for both the investigated cell types. However, RUNX2, which is a transcriptional activator of osteoblastic differentiation, 36 displayed significantly higher expression in hES-MPs than in hMSCs after 1 week of osteogenic stimulation, which may account for the faster matrix mineralization observed. A similar trend was observed for OPN gene, whose expression was found to be higher in hES-MPs at early time point of stimulation. Increased expression of OPN in hES-MPs may be the result of significantly higher expression of RUNX2, which is known to promote expression of the major genes expressed by osteoblasts, such as COL1A1, OPN, and OC. 36 However, no increase in expression of COL1A1 and OC was observed in hES-MPs compared to hMSCs, indicating that other cofactors may be important for their expression. 37 Increased expression of RUNX2 and OPN might explain the faster mineralization detected in hES-MPs than in hMSCs. Besides, it must be considered that the expression of osteogenic marker genes may display highly variable profiles; thus, further gene expression analyses, performed at additional time points, are needed to better investigate the expression profile of the above osteogenic marker genes in the investigated cell types. After protracted expansion, when stimulated with osteogenic factors, both cell types manifested a significant reduction in expression of RUNX2 compared to the expression levels detected for cells stimulated at P5, as demonstrated by others. 38 However, hES-MPs displayed a lower decrease in the expression of RUNX2 at P20, with levels of expression significantly higher than those of hMSCs, denoting a rather higher sensitivity to osteogenic stimulation of hES-MPs after prolonged expansion. On the other hand, COL1A1 and OC genes displayed increased expression after protracted expansion in both cell types, with expression levels higher in hES-MPs than in hMSCs. The increase in expression of these genes may probably be the result of a spontaneous upregulation associated with the prolonged expansion of the cells. It is of great interest to evaluate the expression level of these genes before and after expansion without stimulation with osteogenic factors. Despite the increased expression of OC, which plays a role in bone mineralization, both cell types displayed a diminished ability to mineralize the matrix.
hMSCs are a multipotent cell type that can give rise not only to osteoblasts, but also to a range of other cell type, 11 including adipocytes. 30 The osteogenic and adipogenic differentiation pathways have been recently shown to be somewhat overlapped,39,40 and considerable evidence exists to support that unbalance in MSC differentiation toward the osteogenic and adipogenic lineages contribute to bone loss in aged patients. 41 The BMP signaling, for instance, which is critical for skeletal development and homeostasis, can also promote the adipogenic differentiation in some circumstances. 42 The observation of an incidental differentiation of hMSCs toward the adipogenic lineage, which is remarkably intensified after treatment with BMP2 (up to 10-fold), represents a negative feature, which may impact the potential use of hMSCs for bone engineering application. Unlike hMSCs, hES-MPs failed to differentiate toward the adipogenic lineage, with or without BMP2 treatment, exhibiting total osteogenic commitment when properly stimulated. We previously reported that hES-MPs displayed poor differentiation in vitro toward the adipogenic and chondrogenic lineages, 7 which are in line with findings published by others, demonstrating progressive loss of multilineage potential of progenitor cells following in vitro expansion. 43 At increasing cell doublings, mesenchymal progenitor cells were found to display a sequential loss of differentiation potential toward the adipogenic and chondrogenic lineage.
For a potential in vivo use of cells in tissue engineering applications and stem-cell-based therapies, it is of great importance to evaluate the expression of immunological markers, which are known to be involved in the immunorejection of allotransplants, such as HLA class I and II. 44 Transplantation of an allograft elicits a cascade of host responses in vivo, including secretion of IFN-γ, one of the most potent inflammatory cytokines, which further is known to stimulate the expression of HLA molecules. 45 We recently demonstrated that IFN-γ treatment stimulated the expression of HLA class II molecules in undifferentiated hMSCs but not in undifferentiated hES-MPs. 27 Interestingly, similar results were obtained for both cell types after osteogenic stimulation, with hMSCs exhibiting a significantly higher increase in expression of HLA class II molecules than hES-MPs. IFN-γ induction of HLA class II in undifferentiated and osteostimulated hMSCs has been recently reported by Le Blanc et al., 46 which corroborates our findings. These data suggest that hES-MPs might be more immunoprivileged than hMSCs and successfully used in clinical applications. However, it is crucial to further evaluate the immunological behavior of these two cell types, both in vitro and in vivo, to estimate their true potential in clinical applications.
Conclusions
hES-MPs undergo osteogenic differentiation in vitro and exhibit good mineralization ability also after protracted expansion. Further, hES-MPs express lower amount of HLA class II proteins than hMSCs after differentiation and stimulation with IFN-γ. In conclusion, the high osteogenic ability of hES-MPs, together with low expression of HLA class II proteins, makes these cells an attractive alternative for bulk production of cells for bone engineering applications.
Footnotes
Acknowledgments
The authors sincerely thank Helena Brisby for providing bone marrow samples. The authors acknowledge BIOMATCELL VINN Excellence Center of Biomaterials and Cell Therapy, Region Västra Götland, Swedish Research Council (K2009-52X-09495-22-3 and 2005-7544), and JOIN(ed)T Marie Curie Action for the financial support of the study.
Disclosure Statement
No competing financial interests exist.