




Abstract
Azobenzene photoswitches were recently reported to control the activity of neural cells and heart beat in leeches. Here, we report photocontrol of excitation of cultured cardiomyocytes that have been made light sensitive by using the addition of azobenzene trimethylammonium bromide (AzoTAB). The trans-isomer of AzoTAB reversibly suppresses spontaneous activity and propagation of excitation waves, whereas the cis-isomer has no detectable effect on the electrical properties of cardiomyocytes. Photoisomerization of AzoTAB was achieved by switching the illumination wavelength, λ, from ∼440 nm (trans-isomer) to ∼350 nm (cis-isomer). Simultaneous irradiation at two wavelengths with properly chosen intensities allowed for dynamic control of the cis-isomer/trans-isomer ratio and the level of excitability from normal to fully unexcitable. Experiments were conducted by using AzoTAB-treated confluent monolayers of neonatal rat cardiomyocytes. Excitation waves were monitored by using the Ca2+-sensitive fluorescent dye Fluo-4. By projecting two-wavelength illumination patterns onto otherwise uniform cell layers, we were able to create excitable networks with the desired topology, dimensions, and functional properties. The present article discusses potential applications of this technique for the analysis of complex patterns of electrical excitation and cardiac arrhythmias.
Introduction
In this study, we demonstrated that monolayers of neonatal cardiomyocytes treated with azobenzene trimethylammonium bromide (AzoTAB)18–22 can be rendered unexcitable when illuminated by 440-nm light and can fully recover their excitability when the illumination wavelength is switched to 350 nm. Using simultaneous illumination at two wavelengths with properly adjusted intensities, we were able to control the propagation velocity of the action potentials (APs) and the rate of spontaneous firing of cardiomyocytes. 18 Using structured illumination, we could dynamically pattern the excitable network by directing excitation waves over a defined path and creating pacemakers at desired locations. In contrast to the effects in neurons, our data suggested that AzoTAB-induced photosensitivity in cardiomyocytes involves sodium and calcium channels.
Materials and Methods
Preparation of cardiomyocyte cultures
Hearts isolated from neonatal 1-day-old Wistar rats were minced and dispersed in a collagenase type 1 solution. To remove the fibroblasts after centrifugation, the isolated cells were suspended in Dulbecco's modified Eagle's medium (with 10% fetal bovine serum, 1% penicillin streptomycin, and 1% kanamycin) and kept in a tissue culture dish for 1 h. Nonadherent cells were collected and plated on a glass-based dish (27-mm φ glass window) coated with human plasma fibronectin (Gibco) and incubated at 37°C under humidified 5% CO2 conditions for 1 day. After incubation, the medium was replaced with a minimum essential medium containing 10% calf serum, 1% penicillin-streptomycin, and 1% kanamycin; and the incubation continued for 5–8 days until confluent monolayers were formed.
Monitoring and control of excitation
Excitation waves were monitored by using the Ca2+-sensitive fluorescent dye Fluo-4 (Invitrogen). The dye was added at a final concentration of 10 μM into standard Tyrode's solution (Sigma) for 60 min before the onset of the experiments. Images were acquired using a CMOS camera (pco.1200hs; PCO AG) equipped with an image intensifier unit (C8600; Hamamatsu) and connected to a macro-view MVX10 Olympus microscope. Data were acquired at 50 frames per second using 480×480-pixel resolution. The fluorescent dye was excited at λ=490 nm using the microscope's light source unit outfitted with a mercury lamp and a blue bandpass filter. The same blue light source was used to induce the trans-conformation of AzoTAB. To induce the trans- to cis-transition, we utilized a 365-nm UV-LED module (LC-L2; Hamamatsu). The power densities of blue and UV lights at the culture level were 3.5 and 7 mW/cm2, respectively. The images were analyzed by using an ImageJ image processing system (NIH). In several experiments, we used electrical stimulation to induce an excitation wave. Rectangular pulses with amplitudes ranging from 1.5 to 4.0 V and a duration of 20 ms were delivered via a 1-mm nonpolarizing platinum electrode.
Spectral measurements
The absorption spectra of AzoTAB isomers were recorded in Tyrode's solution using a photospectrometer (U0080D; Hitachi). Before spectra recordings, the samples were illuminated for 1 min using either 490 nm blue or 365 nm UV light. To measure AzoTAB binding to the cell surface, we used a lazer Raman spectrometer (Nanofinder 30; Tokyo Instruments) with a 532-nm lazer. The laser light was tightly focused on the cell surface to maximize the signal. Before Raman spectra measurements, all cell culture samples were dried under a mild vacuum condition.
Measurement of APs
For electrical recordings, glass coverslips containing adherent neonatal rat cardiomyocytes were transferred to an experimental chamber mounted on the stage of an inverted microscope (CKX-41; Olympus). The chamber was perfused in a bath solution (pH 7.4) containing millimolar concentrations of the following chemicals: NaCl, 140; MgCl2, 1; KCl, 5; CaCl2, 2; HEPES, 5; and glucose, 10. The patch pipettes were filled with a solution containing millimolar concentrations of the following chemicals: KCl, 120; NaCl, 10; MgATP, 3; HEPES, 5 (pH 7.2); and EGTA, 10 (pH 7.2). Patch pipettes were pulled from glass capillaries (code GC150F-10; Harvard Apparatus) by using a horizontal puller (P-97; Sutter Instruments). The resistance of the filled pipettes measured 2–5 MΩ. A whole-cell current clamp method was used to control and record the membrane potential, and APs in single cardiomyocytes were generated by using electrical stimulation (2 ms; 10 mV) via the patch electrode at intervals of 2 s. All recordings were performed at room temperature (∼22°C).
Voltage and current signals were recorded using patch clamp amplifiers (Axopatch 200B; Molecular Devices). The current signals were digitized using a 16 bit A/D converter (Digidata 1440A; Molecular Devices) and stored on a personal computer. Data acquisition and analysis were performed using pClamp10 software (Molecular Devices).
Results
Light-induced isomerization of AzoTAB
The AzoTAB has two isoforms, which are schematically illustrated in Figure 1A. 21 The absorption spectrum of the trans-isomer (blue line) has a pronounced peak at 365 nm (Fig. 1B). Illumination of this isomer at its absorbance wavelength causes the transition to the cis-conformation, which is characterized by the spectrum shown in purple (Fig. 1B). The spectrum of the cis-isomer has an additional peak near 450 nm. Illumination at this wavelength causes cis-to-trans isomerization. The trans-isomer conformation is energetically more stable than the cis-isomer, and the cis-isomer spontaneously reverses to a trans-conformation in the absence of UV illumination. In addition, cis- and trans-isomers have different effects on the excitability of cardiomyocytes, which enables photocontrol of electrical excitation and dynamic patterning of excitable networks in confluent monolayers of cardiomyocytes.
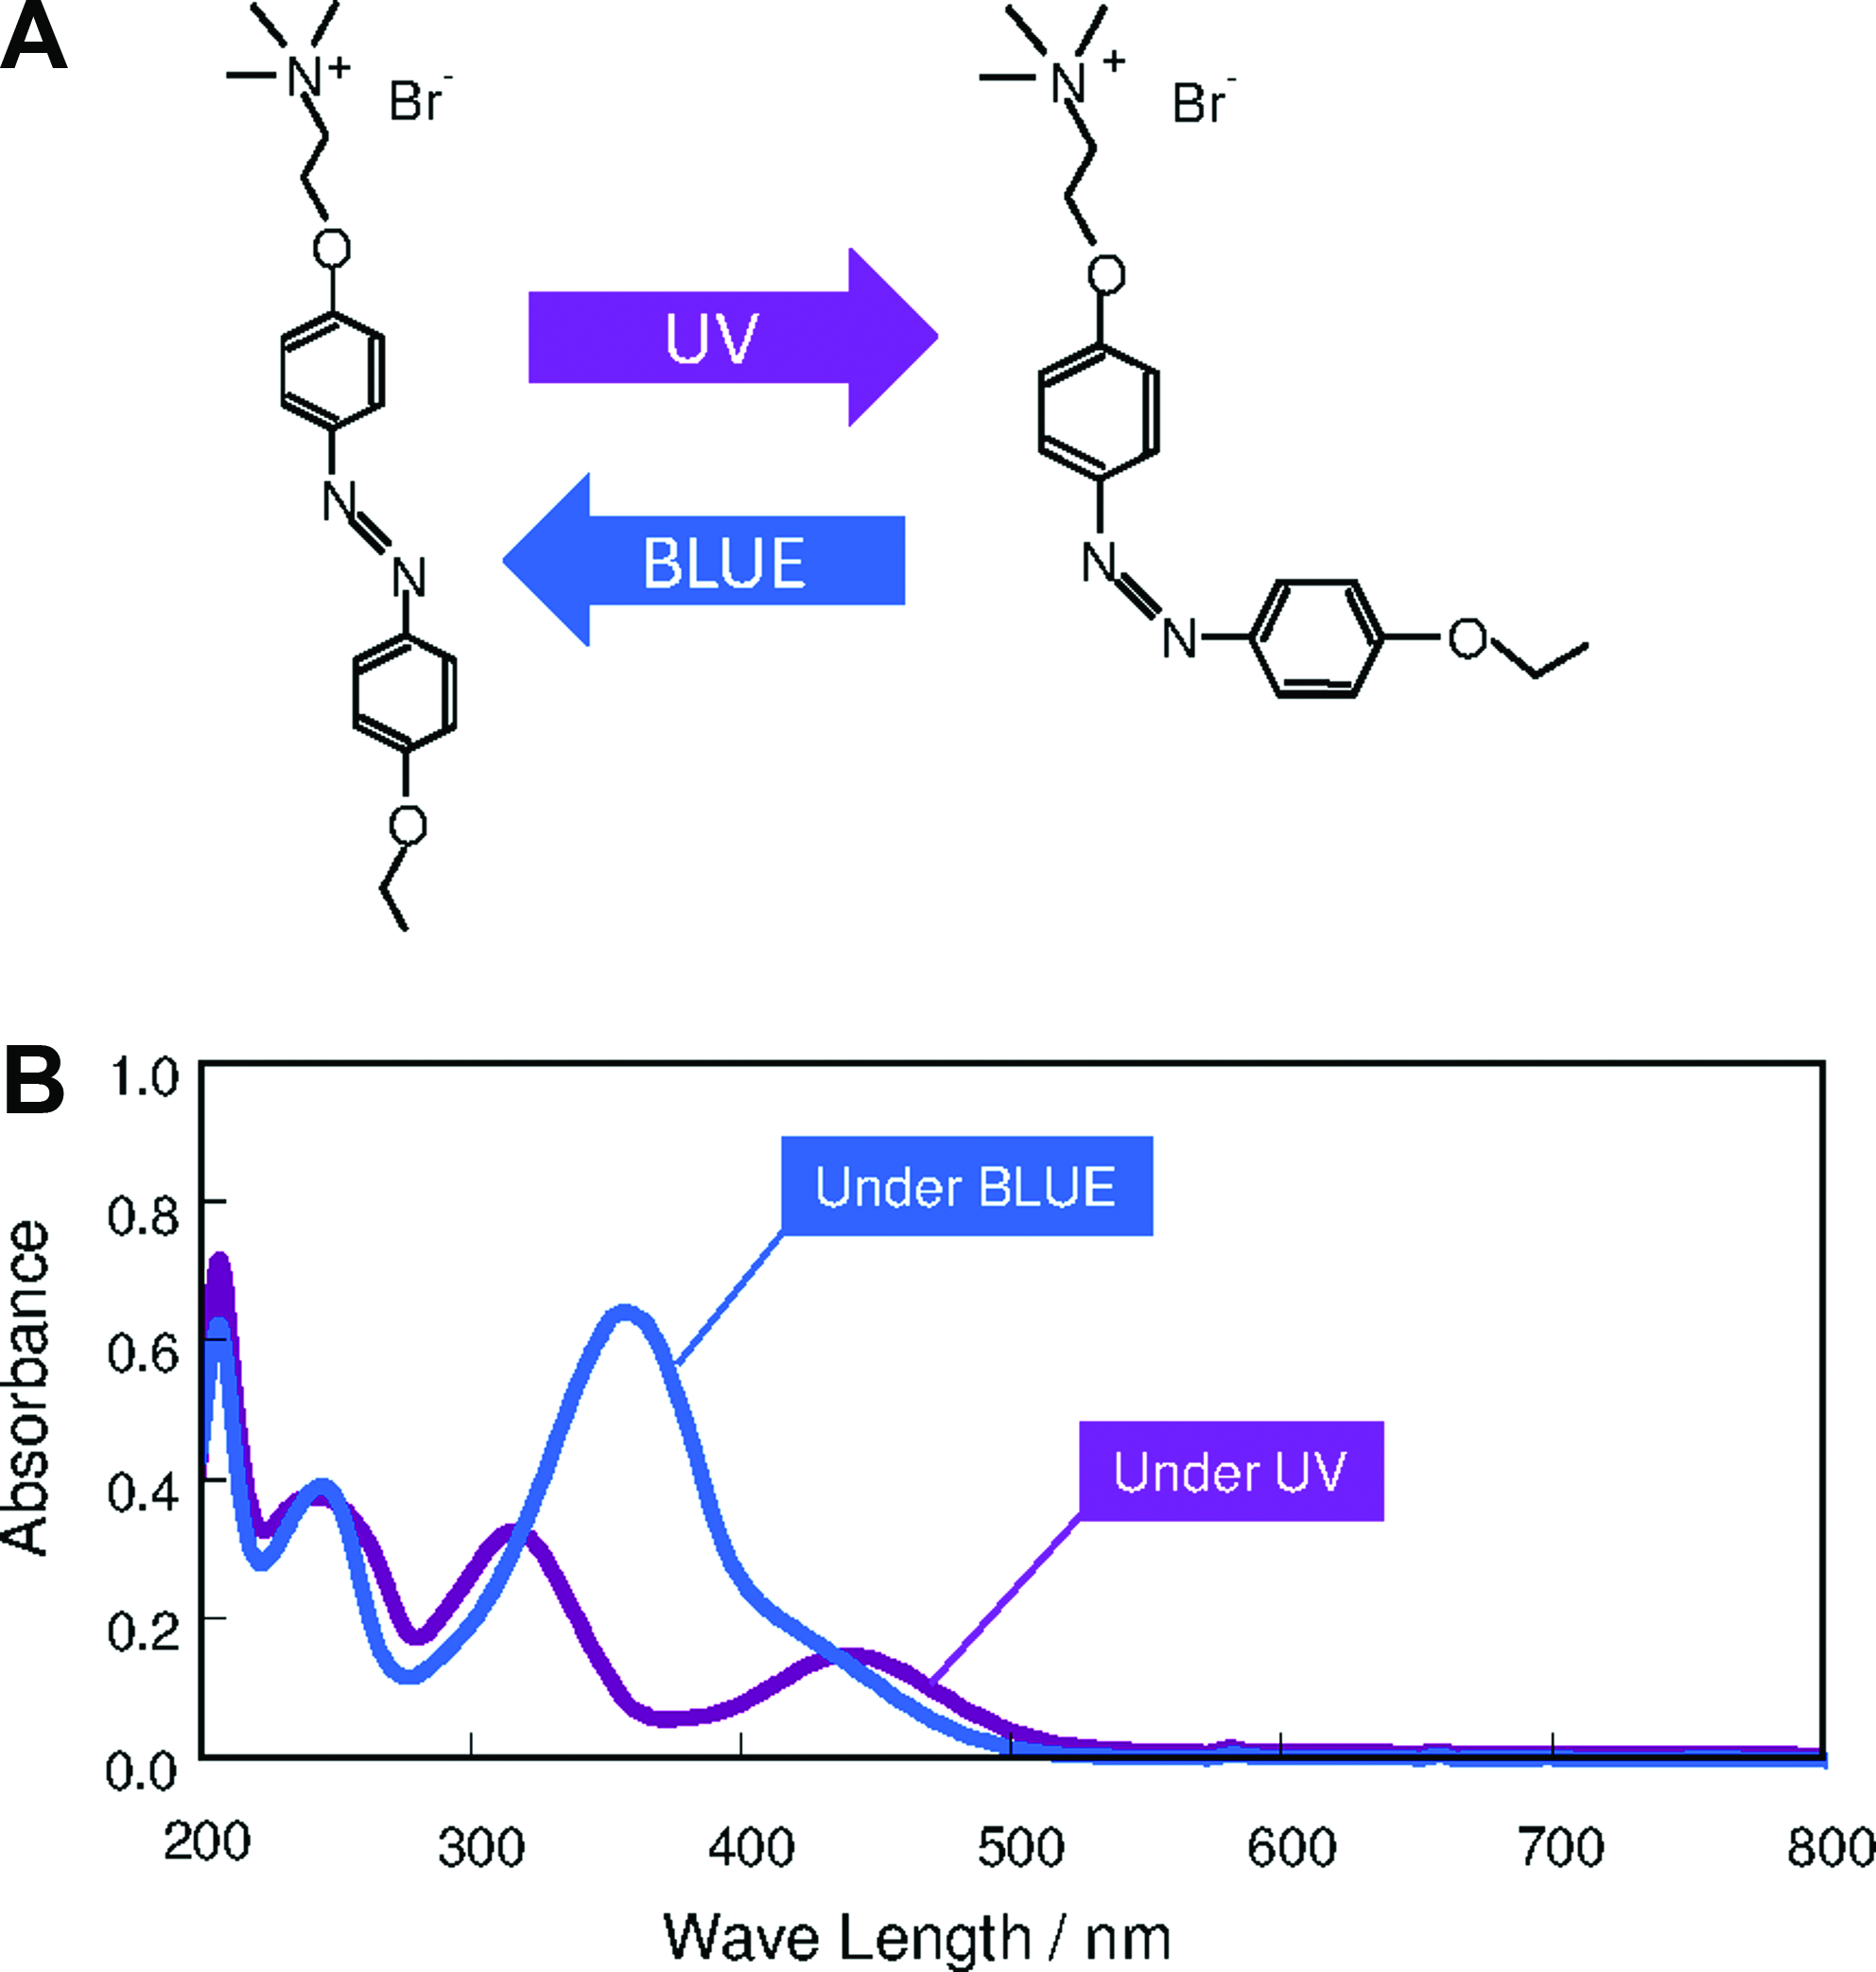
Photoisomerization of AzoTAB.
Photocontrol of wave propagation
Figure 2 shows the stimulation threshold as a function of the concentration of AzoTAB under constant blue light illumination. Increasing the AzoTAB concentration from 0.1 to 0.3 mM causes a threshold increase from 1.5 to ∼3 V. Our experiments show that concentrations of the trans-isomer of AzoTAB greater than 0.3 mM increase the excitation threshold. In addition, concentrations more than 0.5–0.6 mM cause complete blockade of AP propagation, so it was not possible to measure the excitation threshold (or it may be regarded as approaching infinite value). The spontaneous activity of cardiomyocytes is generally suppressed at lower concentrations of AzoTAB (0.1–0.2 mM) compared with the concentrations required to block the wave propagation. Interestingly, concentration-dependent changes of the excitation threshold for AzoTAB are almost identical to those observed with the local anesthetic Lidocaine (for concentrations up to 0.15 mM). In contrast, application of the potassium channel blocker tetraethylammonium chloride at concentrations up to 1 mM did not change the threshold amplitude. Since the initiation of an AP in cardiac cells is due to sodium and calcium currents, this is strong evidence that the trans-isomer of AzoTAB affects sodium and/or calcium channels. Unlike the trans-isomer, the cis-isomer of AzoTAB does not significantly affect the excitability of cardiac cells. Illumination of AzoTAB-treated cultures with UV (7.0 mW/cm2) was sufficient to restore the propagation threshold for the whole range of tested AzoTAB concentrations (0.1–0.6 mM). Importantly, the normalization of excitability under UV illumination can occur in the presence of simultaneous blue illumination at 3.5 mW/cm2.
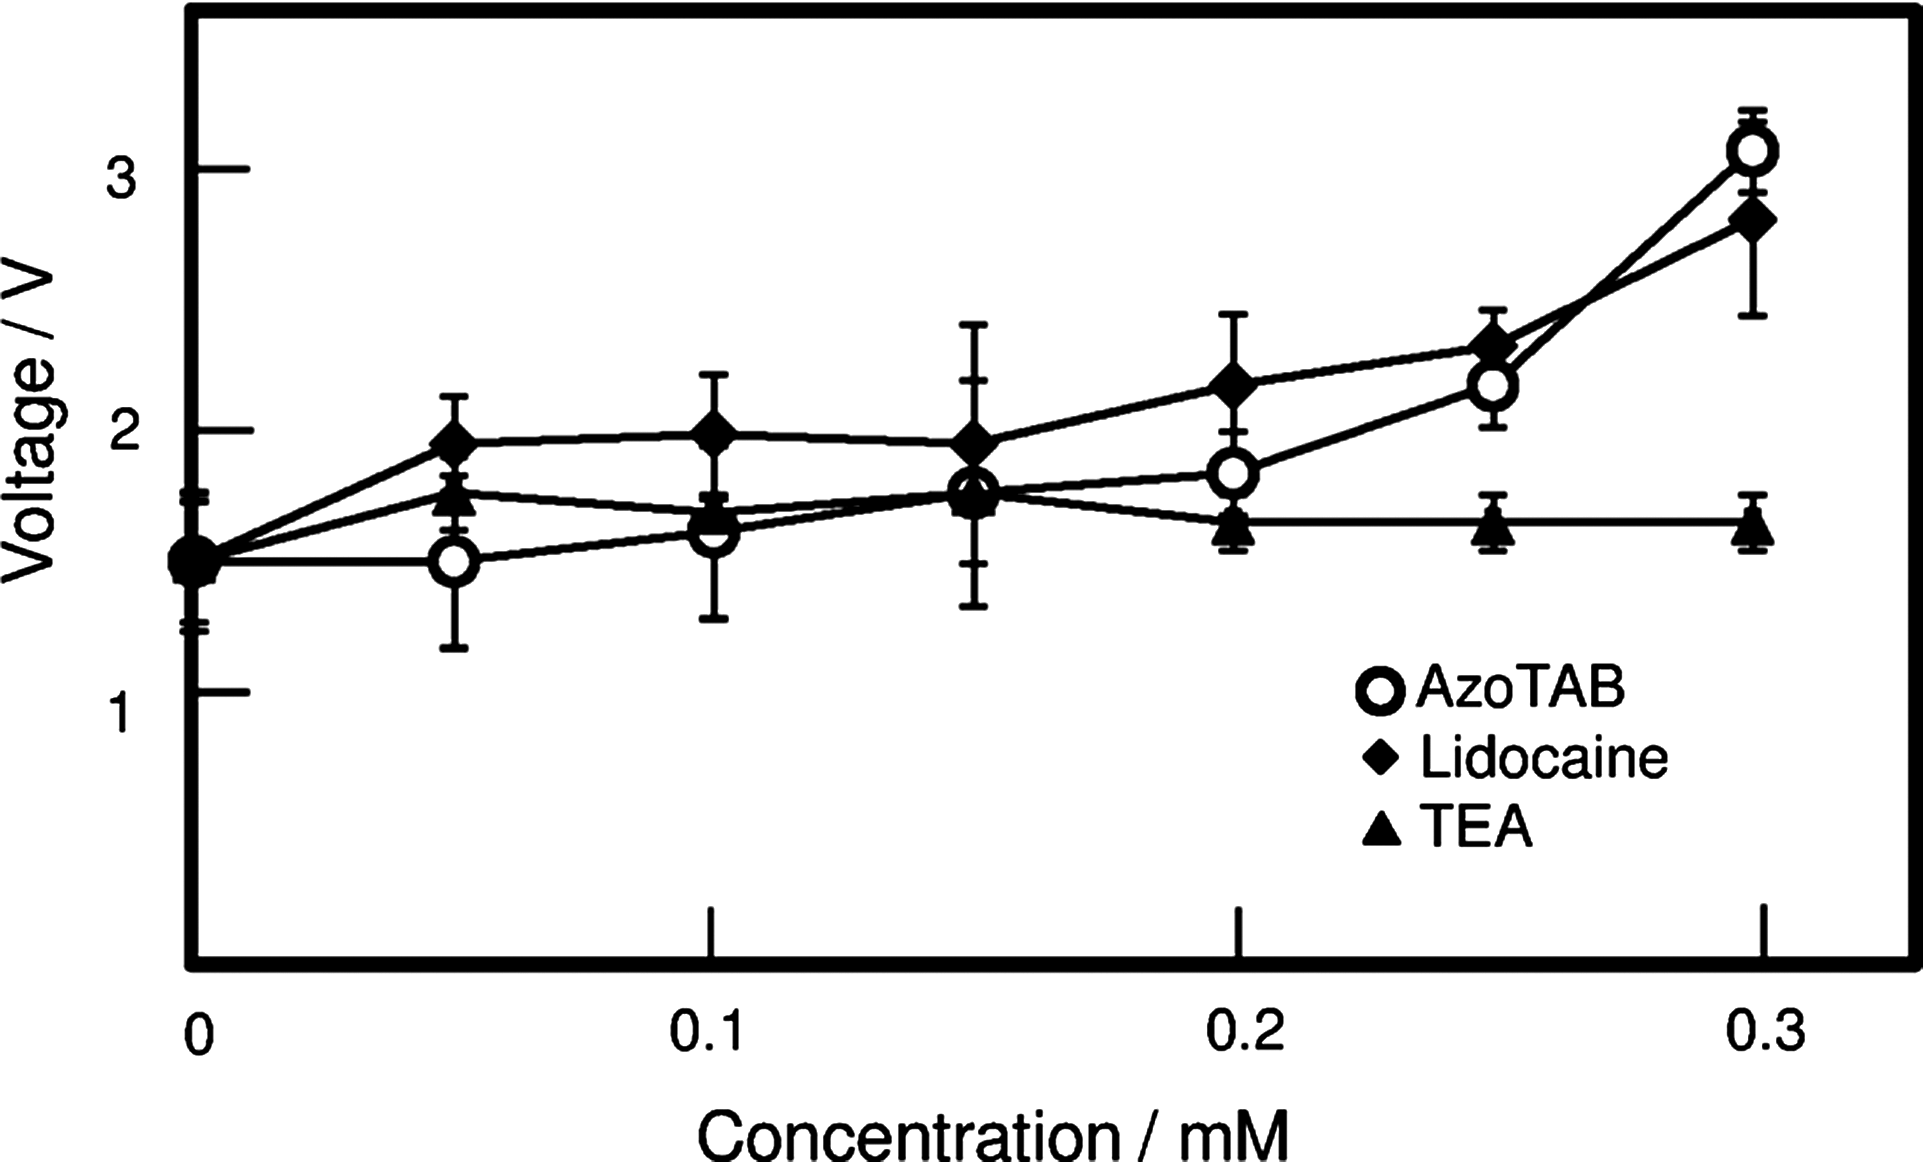
Dependence of the cardiomyocyte excitation threshold on AzoTAB, Lidocaine, and TEA concentration. We plotted the critical values of electrical potential to initiate excitation waves under blue light without UV light. An electrical pulse was applied for 20 ms with a platinum electrode, and we measured the potential to initiate a propagating wave. Although tetraethylammonium chloride (TEA) does not show an increasing threshold, Lidocaine and AzoTAB show the same trend.
Figure 3 shows AzoTAB-mediated light-dependent suppression of excitation waves in the cardiomyocyte monolayer. AzoTAB was added to the incubating Tyrode's solution to a final concentration of 0.6 mM. In this experiment, the whole Petri dish was illuminated with blue light. In addition, one half of the dish was exposed to UV light; whereas the other half was shielded from UV light using a UV-cutoff filter (Fig. 3A). Spontaneous activity and wave propagation were only present in the UV-exposed half of the monolayer. Indeed, waves failed to enter the shielded region of the tissue (upper row, Fig. 3B). Interestingly, this pattern changed dramatically when the UV filter was removed (lower row, Fig. 3B). After 7.5 s, the excitation waves started penetrating the previously shielded area, and they eventually encompassed the entire tissue layer. The detailed dynamics of this process can be seen in the spatiotemporal plot (Fig. 3C) generated based on the vertical scan line positioned at the center of the frame.
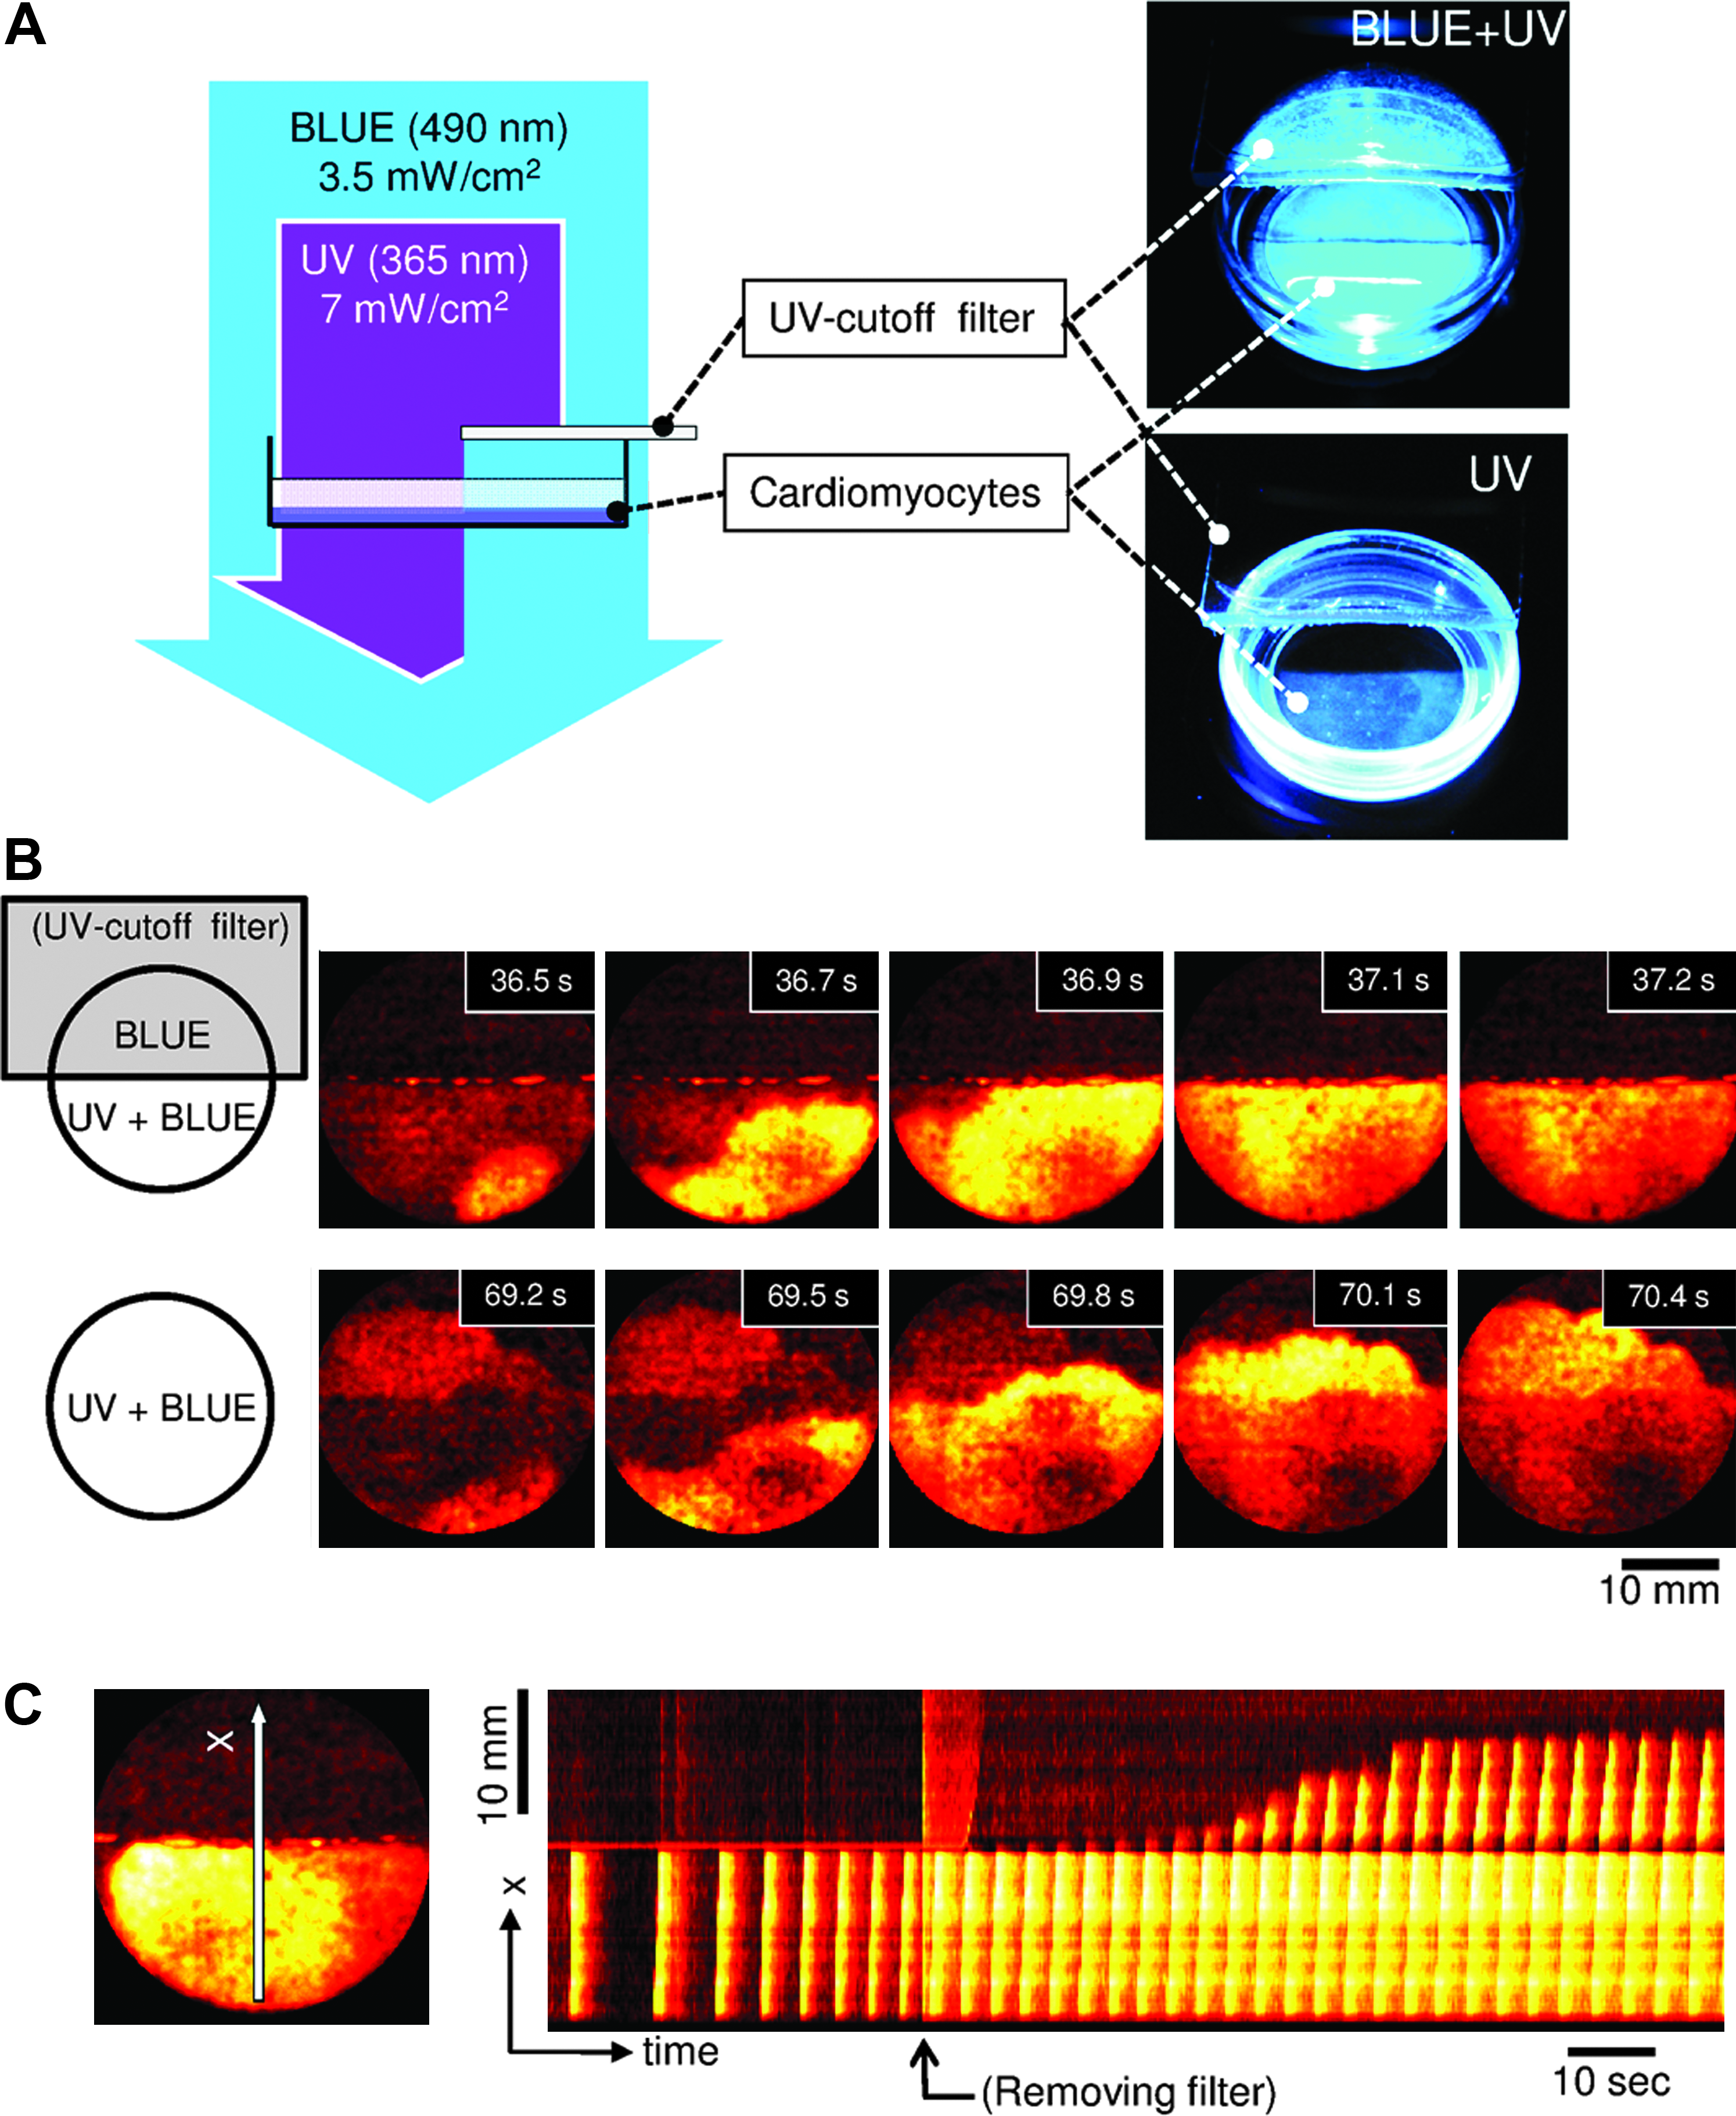
Propagation of excitation waves in the photosensitive cardiomyocyte tissue culture.
We were able to repeat the effect illustrated in Figure 3 several times by moving the UV filter in and out. Within one experiment, it was possible to observe up to 5–7 cycles of suppression and recovery. Figure 4 shows the dependence of spontaneous excitation propagation as a function of time in one representative experiment in which the UV illumination was periodically turned on and off. The duration of each cycle was ∼40 s (20 s of UV illumination followed by 20 s without UV illumination). The electrical propagation was recovered after UV illumination had been turned on, the recovery took 8 s in the first cycle and then occurred 4 s after UV illumination was turned on in the subsequent cycles. Excitation disappeared after 5–7 s when UV illumination was turned off, but there was no noticeable decreasing or increasing trend. The transitions themselves were very abrupt. After switching to the excitable state, the propagation speed almost instantly reached 60–80 mm/s with relatively small and irregular subsequent changes.

Reversible excitability by alternative light illumination. Solid circles show the speeds of the propagating waves generated by spontaneous activity (without any stimulation). Blue light (4 mW) was permanently illuminated during the experiment, and 6 mW of UV was irradiated at the violet region. The shaded portion indicates the period of spontaneous wave generation. The waves were initiated under UV irradiation and suppressed under blue light using an induction period of several seconds. [AzoTAB]=0.5 mM. Color images available online at www.liebertonline.com/tea
Dynamic control of network topology
We were able to dynamically define the network topology and its dimensions through the use of elaborate masks for UV illumination patterning. Figure 5 shows one experiment in which UV illumination was patterned in the form of the kanji character dai, which means “big” or “great” (it is the first part of the Japanese word daigaku or university). Projecting this pattern onto the confluent monolayer of cardiac myocytes produced an excitable network that had the shape of the dai character (the rest of monolayer was left unexcited). The excitation originated in the bottom left corner and gradually filled the rest of the excitable domain (red arrows indicate the direction of propagation), which revealed the overall shape of the domain.
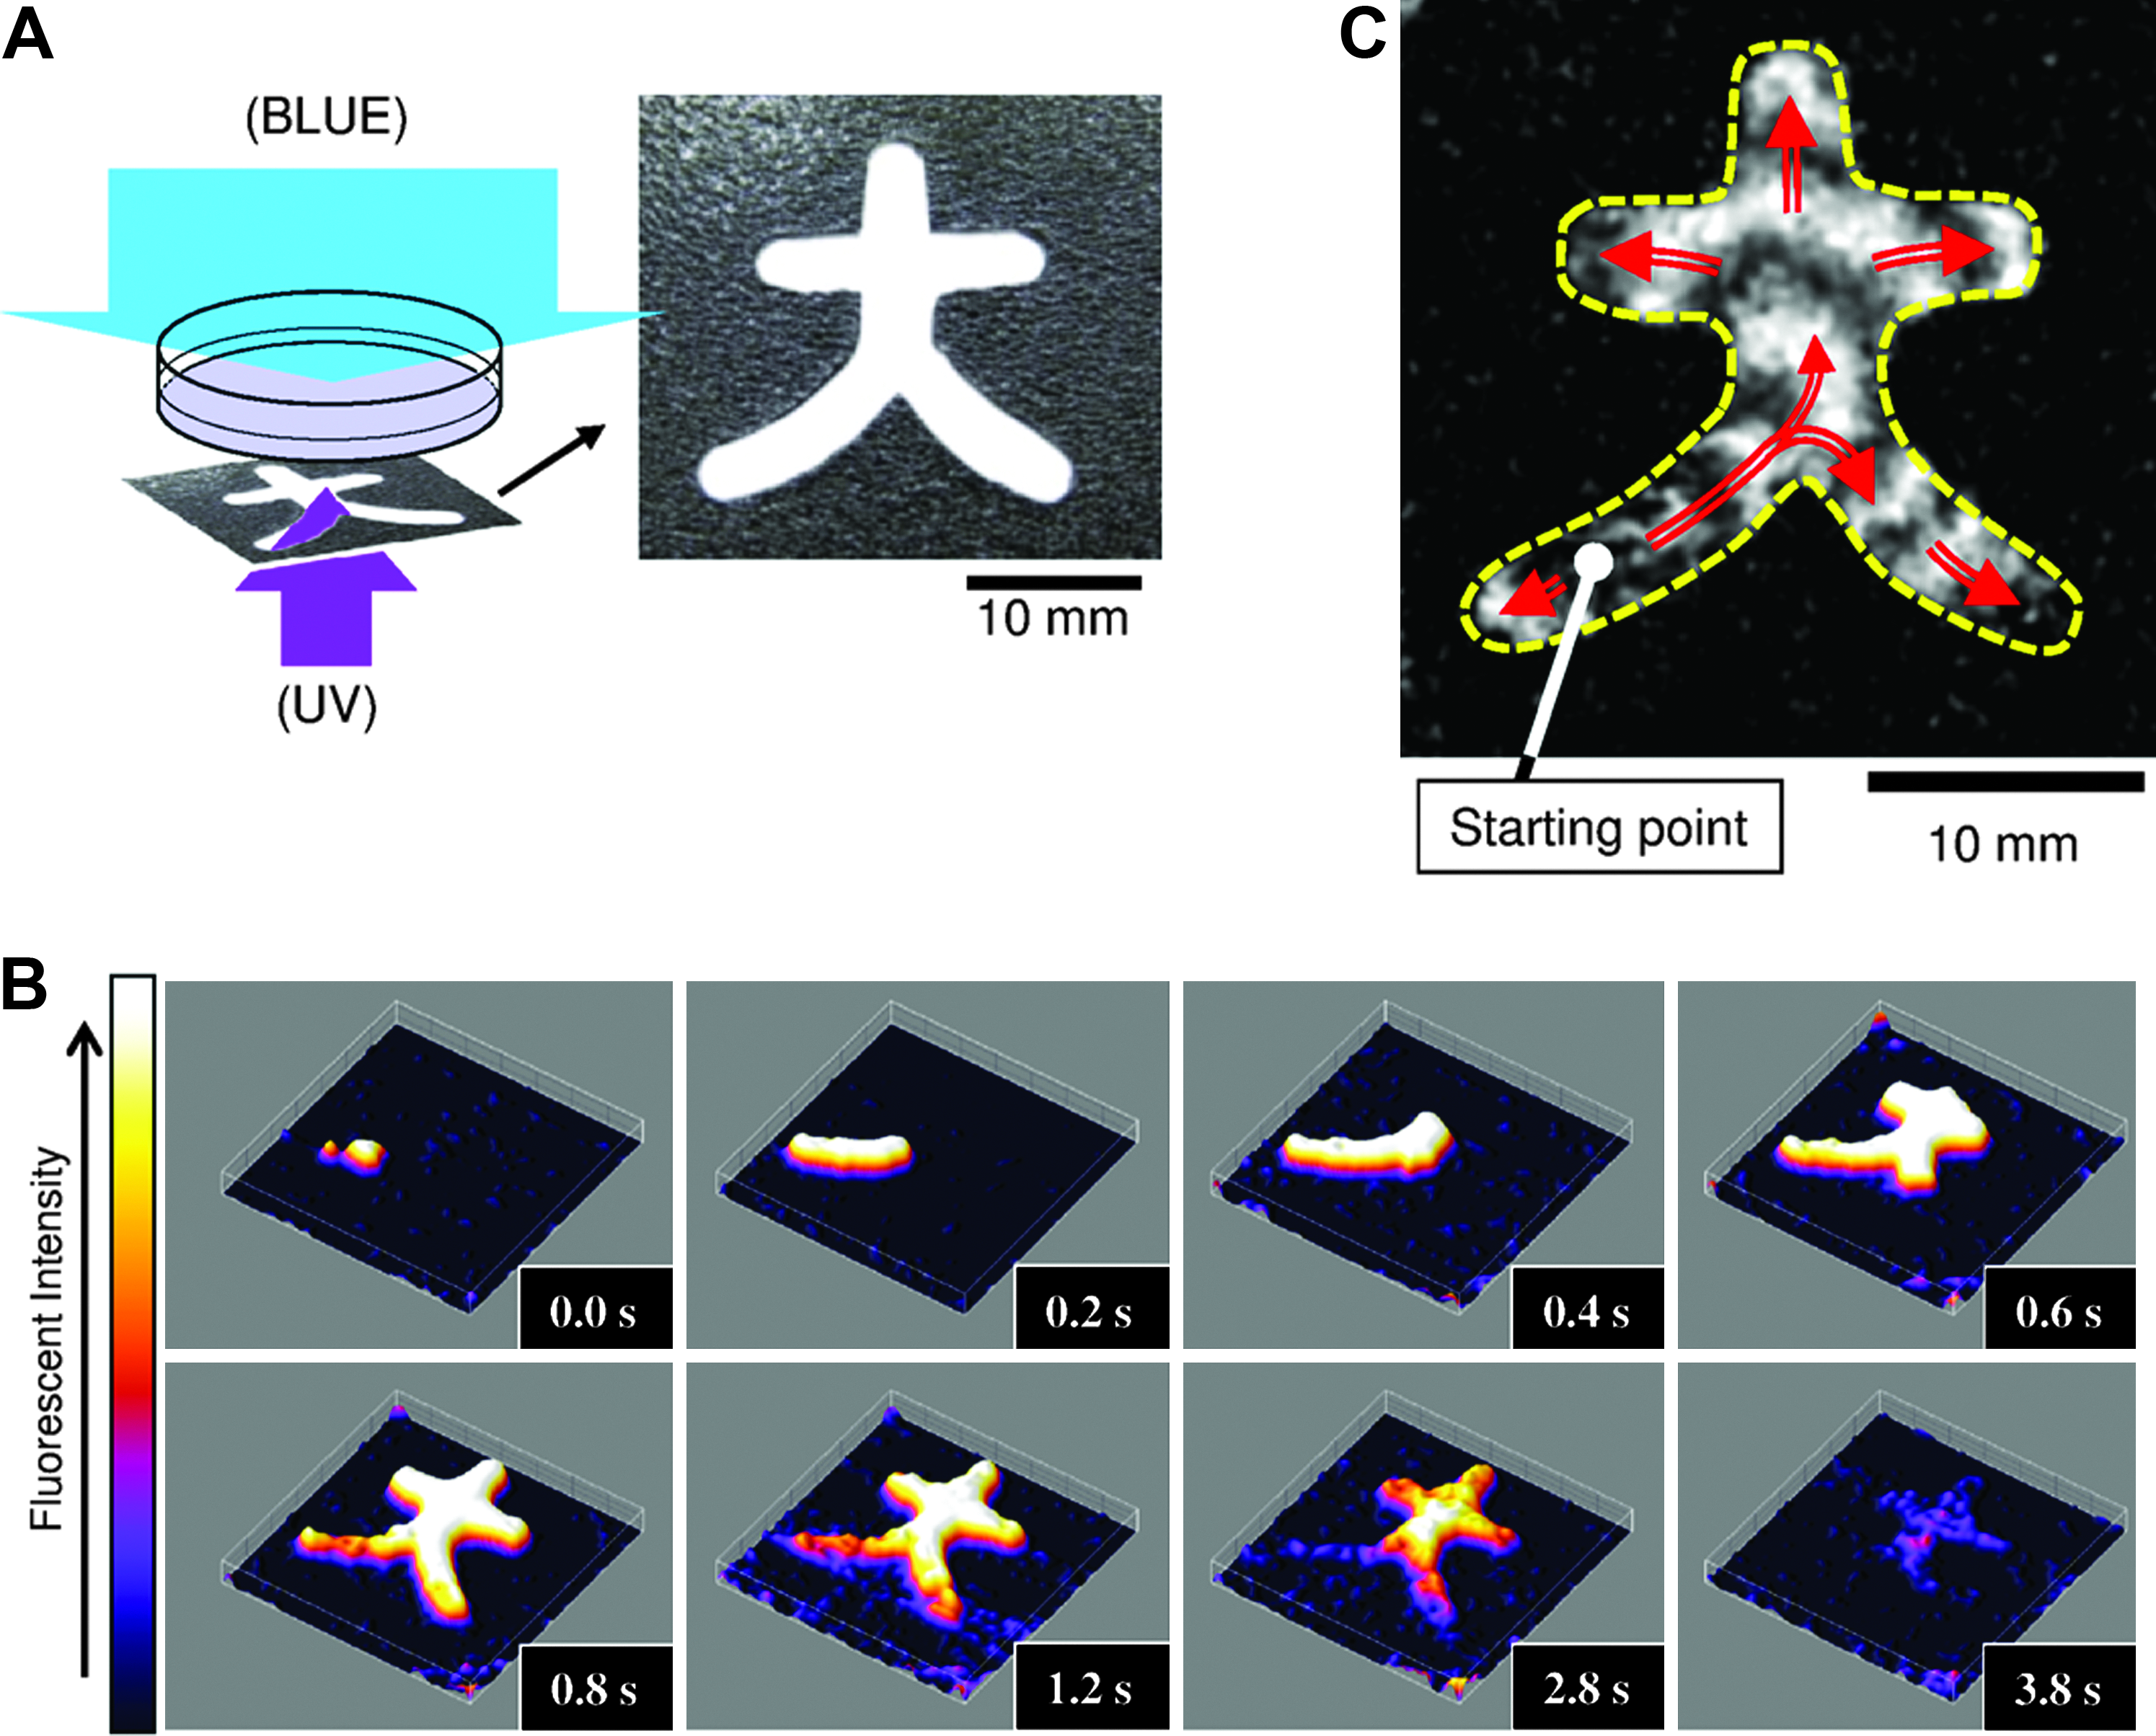
Light-controlled wave propagation path in cardiomyocyte tissue culture. (
Creation of an artificial pacemaker
Simultaneous deployment of blue and UV lights and adjustment of the irradiation power for each wavelength enabled the complete extinction of excitation in part of the tissue, as shown above. By changing the power ratio, it was also possible to create excitation sources in desired locations while keeping the entire tissue in an excitable state. Figure 6 shows the creation of a pacemaker by local UV irradiation. In this experiment, the cultured cells were treated with 0.1 mM AzoTAB (much lower than the 0.5 mM concentration used for complete blockage of excitation) and continuously illuminated with the blue light, which was sufficient to suppress any spontaneous activity without affecting propagation of the excitation waves. Subsequently, a spot of UV light was projected onto the small area of the tissue culture, whereas the entire tissue continued to be illuminated with the blue light (Fig. 6A). As shown in the sequential snapshots of the excitation wave in Figure 6B, the UV light, indicated as white and black circles, locally removed the suppression of spontaneous activity in the selected spot (i) and converted it into a pacemaker that was capable of generating excitation waves. After repositioning the UV beam from location (i) to (ii), the pacemaker stopped and moved to the new location (ii), which was determined by the UV-illuminated spot.
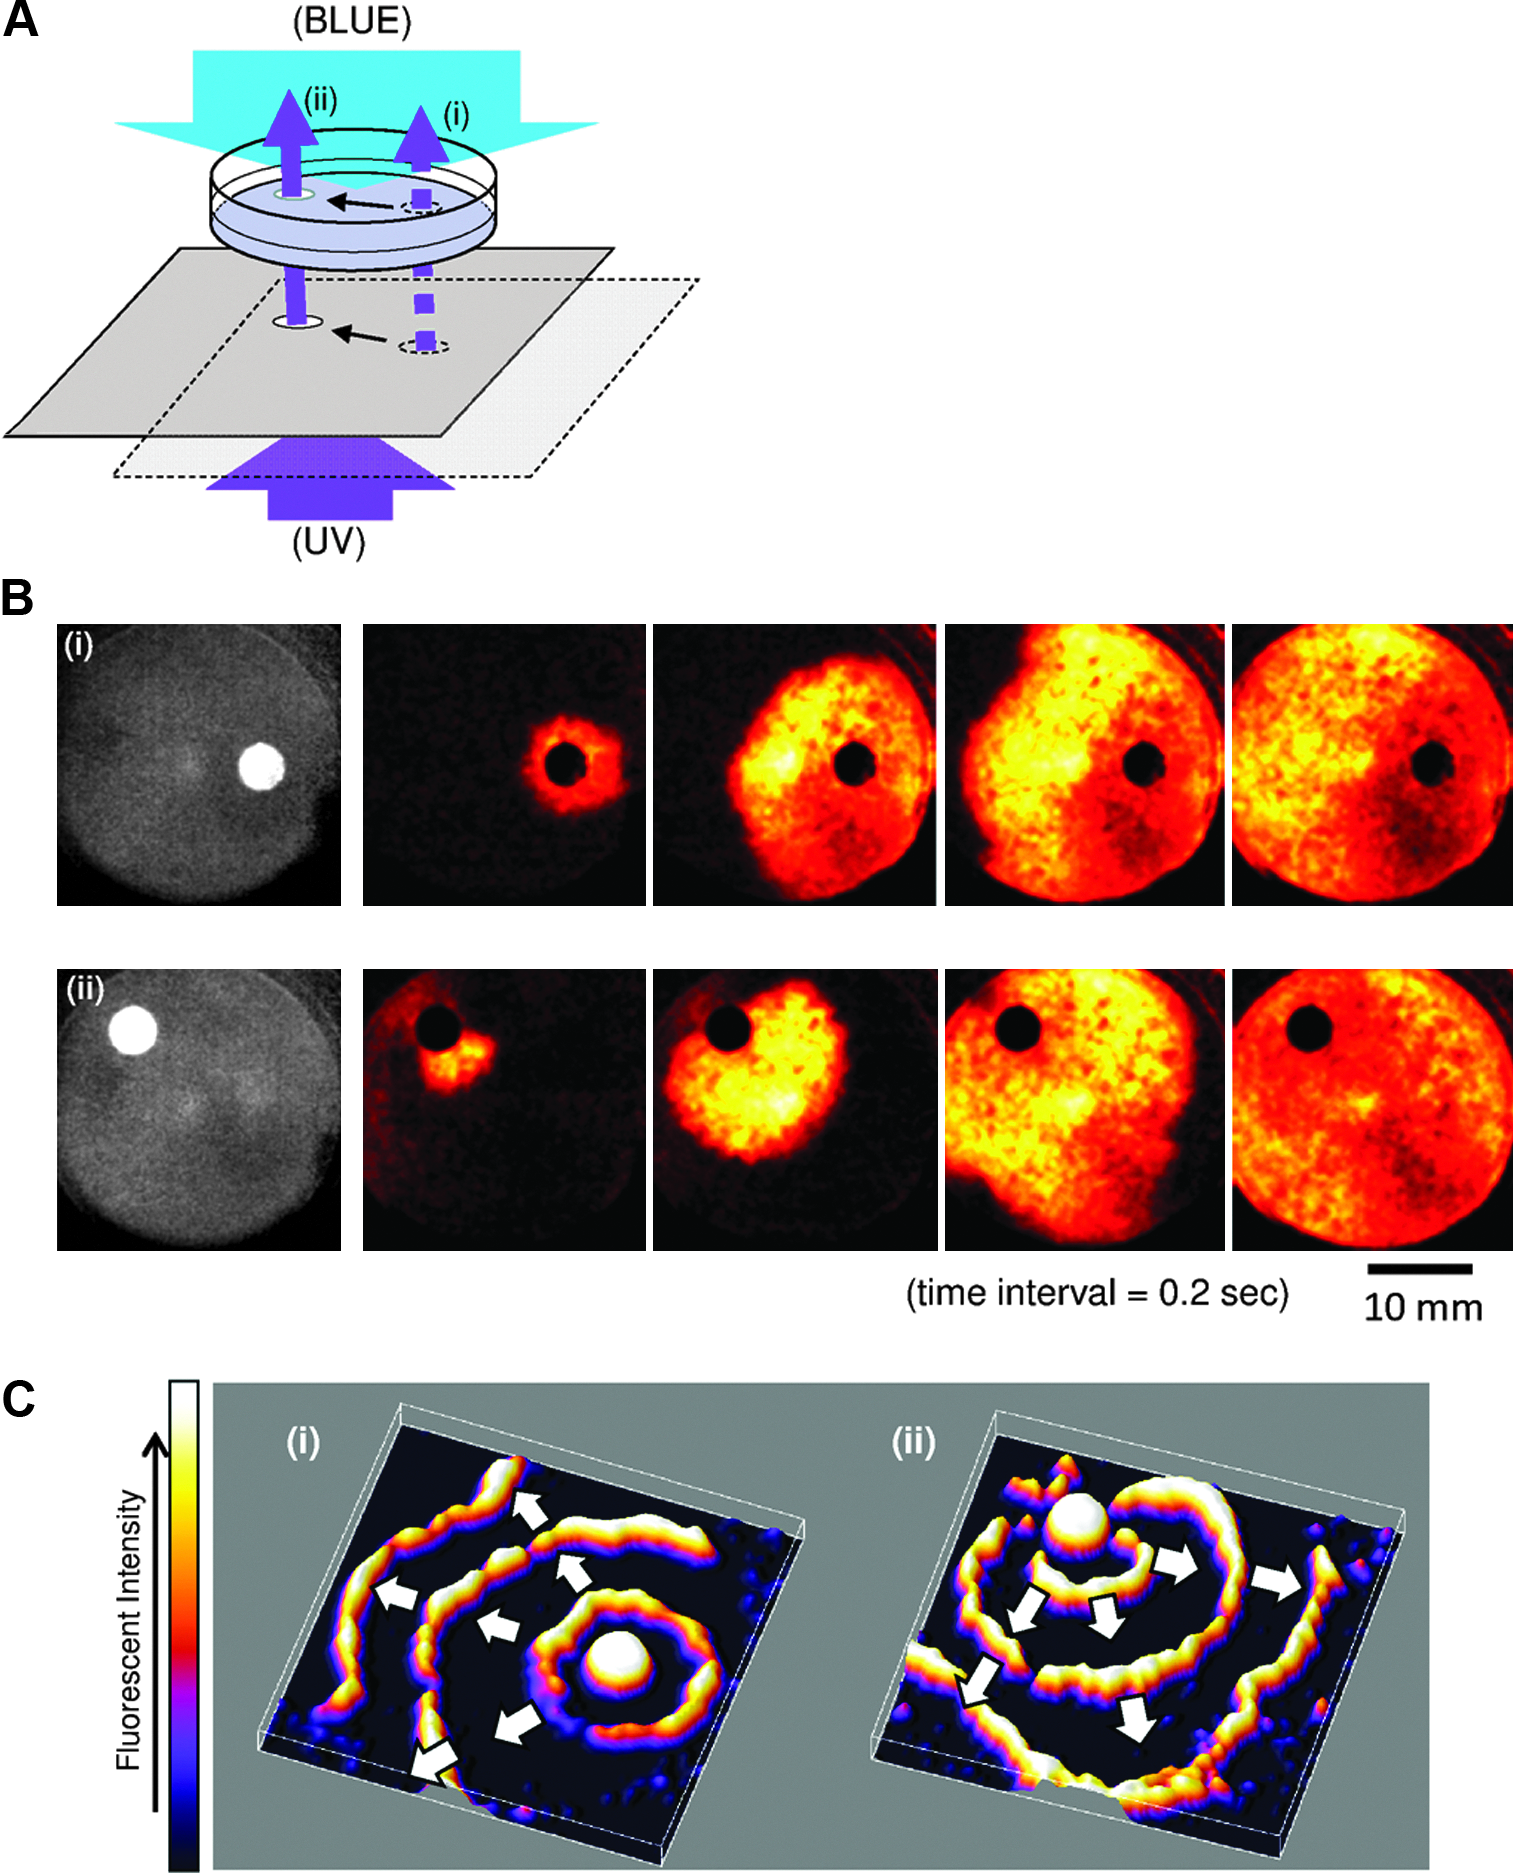
Photo positioning of the artificial pacemaker.
Binding AzoTAB isomers to the excitable membranes of cardiomyocytes
Our data suggest significant differences in binding affinities of AzoTAB isomers to the excitable membranes of cardiomyocytes. The trans-isomer, which causes suppression of excitability, is more strongly bound to the membrane than the cis-isomer. An important piece of evidence supporting this hypothesis is provided by measurements of the washout kinetics of cis- and trans-AzoTAB isomers. The trans-isomer of AzoTAB can be washed out within several minutes, whereas the cis-isomer washout kinetics were much faster (within seconds). Both cis- and trans-washout kinetics were measured after we had applied 0.5 mM AzoTAB in the trans-conformation, which caused complete propagation block. The depletion of membrane-bound AzoTAB was assessed from the degree of recovery of conduction velocity. In the case of the cis-isomer, cells were irradiated using UV light before and during the washout, which induced trans- to cis-transformation.
Figure 7 shows an experiment in which we evaluated the washout kinetics of the cis-isomer. After 60 s of UV illumination followed by 30 s of washout under UV, the UV illumination was turned off and replaced by blue light. The illumination switch did not cause propagation block, which was typical for this transition in the presence of AzoTAB (see Fig. 4). The simplest interpretation of this result is that the cis-isomer does not strongly bind to the membrane. Under UV light, AzoTAB molecules acquire the cis-conformation, detach from the membrane, and are rapidly removed from the tissue culture during washout.

Wave propagation during the addition of AzoTAB and during the washout.
Raman spectra measurements23,24 showed preferential binding of the trans-form of residual AzoTAB molecules to the cell membrane (i.e., there was a lack of binding for the cis-form) after washout (Fig. 8) We used two washout protocols: trans-isomer washout and cis-isomer washout, which were very similar to the washout protocols just described (Fig. 7). In both cases, the cultures were treated with 0.5 mM AzoTAB in Tyrode's solution and irradiated with blue light for 60 s to establish identical initial conditions. The trans-isomer washout was conducted under 15 mW/cm2 blue light illumination. The culture was rinsed thrice with AzoTAB-free Tyrode's solution for 1 min and dried under vacuum conditions. The cis-isomer washout protocol included irradiation using 15 mW/cm2 of UV light for 60 s before the washout. Raman spectra of cells that were not exposed to AzoTAB and AzoTAB solution (in the absence of cells) were used as negative and positive controls, respectively.
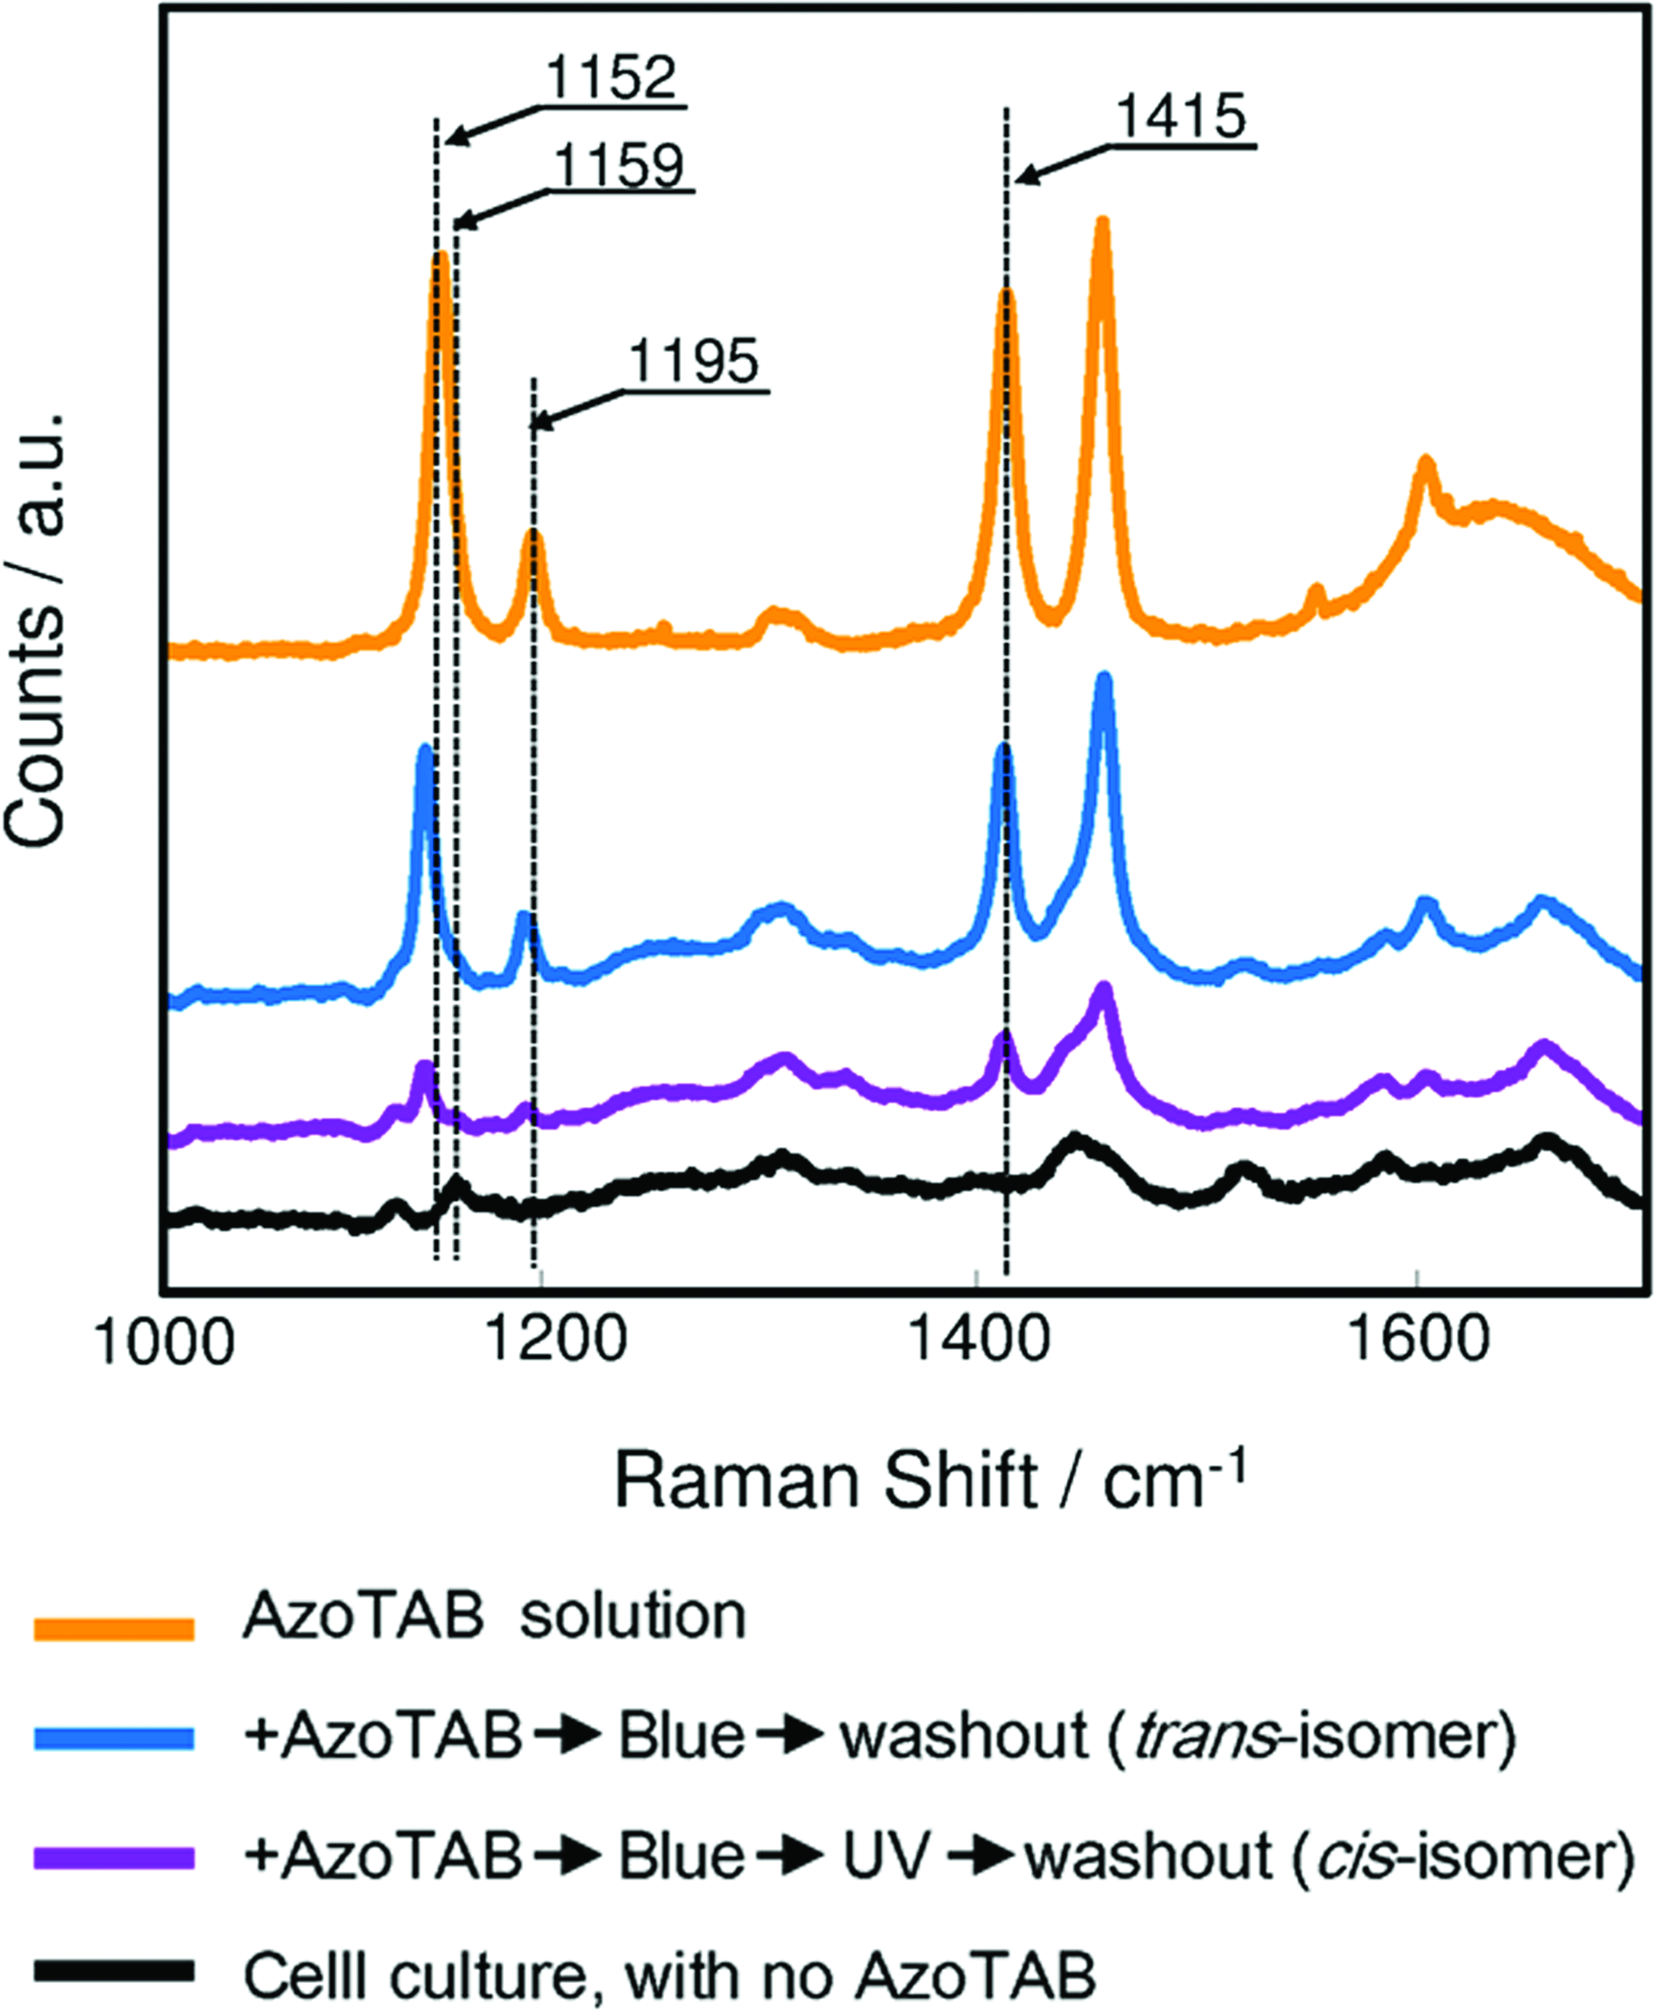
Raman spectra of the monolayer surface after AzoTAB washout. The spectrum of AzoTAB (2 mM) in Tyrode's solution (orange) and the spectrum of untreated cultures (black) were used as positive and negative controls, respectively. Blue and purple lines show the spectra after different washout protocols. The blue line corresponds to the case in which the washout was conducted under blue light (trans-isomer washout). The purple line corresponds to the case when we used a UV illumination protocol (cis-isomer washout). The amplitude of AzoTAB-specific spectral lines in the case of cis-isomer washout (purple) was significantly lower compared with the trans-isomer washout (blue). Color images available online at www.liebertonline.com/tea
Figure 8 compares Raman spectra of the residual amount of AzoTAB after washout in the trans- and cis-forms. Raman peaks of AzoTAB clearly decreased in intensity in cells irradiated with UV light compared with cells irradiated with blue light. To quantify these differences, we normalized the spectra using the intensity of the 1638 cm−1 Tyrode's solution line. The comparison of normalized spectra showed that the residual AzoTAB in the case of the cis-washout protocol was 70%–100% lower than the case of the trans-washout protocol. The spectral analysis confirmed that the cis-isomer of AzoTAB was easily removed from the cells during incubation of the cell layer in AzoTAB-free Tyrode's solution. The Raman spectrum of the AzoTAB molecule dissolved in Tyrode's solution (0.5 mM) was compared with the spectra of AzoTAB pure powder. We observed four intense lines at 1152, 1159, 1195, and 1415 cm−1 in both the powder and solution spectra. To verify that we could use these lines to track the molecule in either the cis or trans conformation, we checked the effect of alternately irradiating a solution sample using blue and UV lights for 60-s pulses. Although the color of the solution clearly changes after each exposure from pale yellow under blue light to dark yellow under UV light, no change in the Raman spectrum was observed. We also noticed a broad and intense line at 1638 cm−1, which was a result of the Tyrode's solution.
Ionic currents involved in AzoTAB-mediated effects
To gain insight into the AzoTAB-mediated changes in excitability, we recorded APs in isolated AzoTAB-treated cardiomyocytes under various illumination conditions. Figure 9 shows AzoTAB-induced changes in APs recorded from a single cardiomyocyte paced at a constant frequency of 0.5 Hz using the whole-cell current clamp method. In control conditions, we recorded APs with upstrokes from −70 mV resting potential to +40 mV with an ∼500 ms AP duration (black line). Application of AzoTAB (0.5 mM) caused complex changes in AP morphology. Within 2 min after AzoTAB administration, AP duration decreased to ∼100 ms, which was accompanied by a substantial delay in upstroke formation indicated by a reduction of its slope (orange line) and a reduction of its slope. Further exposure to AzoTAB led to a complete suppression of the AP (red line). All these effects of AzoTAB were readily reversible by UV radiation for 1.5 to 2 min (30 mW/cm2, green line). When UV irradiation was initiated 11 min after the application of AzoTAB, the AP recovered within 30 s; however, this recovery was suppressed by the termination of UV exposure.

Effect of AzoTAB on AP formation in rat neonatal myocytes. Superimposed representative traces of APs recorded within the same rat neonatal myocyte in control conditions and during exposure to AzoTAB. AP, action potential.
Discussion
Sensitization of voltage-gated channels to light25–27 provides a powerful tool for precisely controlling tissue excitability at a single-cell level. 28 Among the prospective methods for light sensitization (e.g., optogenetics29–32 and use of caged molecules 33 ), studies suggested the application of photoswitches, such as derivatives of azobenzene.10,11 Azobenzene compounds have been shown to reversibly block acetylcholine receptors,12–14 to block/unblock potassium channels by switching the irradiation wavelength, 6 and to control patterns of neural activity.15,16
The suggested mechanism of light-dependent blockade of ion channels is based on the concept that photoisomerizable molecules of azobenzene derivatives consist of an azobenzene group flanked by a covalent attachment group and a group able to “plug” and block open ion channels (quaternary ammonium group).10,15 According to this scheme, the covalent attachment group binds with the channel complex protein; whereas the “plug” blocks the channel. While undergoing a trans- to cis-transition, the molecule bends and pulls the “plug” from the channel.10,15 Thus, the photoswitching molecule should exhibit specificity in both binding to the channel protein complex and plugging the corresponding ion channel. The length of the molecule should also fit precisely in the ion channel. In addition, covalent binding should result in a relatively strong connection of the azobenzene complex to the surface of the cell.
Our data demonstrated that the mechanism of AzoTAB interaction with ion channels for cardiac cells might be significantly different than other cell types. The trans-configuration of AzoTAB elicited the maximal effect, which greatly affected (a) spontaneous electrical activity in cardiac tissue, (b) the propagation speed of excitation, with a modest effect on the maximal captured frequency in the tissue (data not shown), and (c) the delayed upstroke shape of the AP, which indicates suppression of fast sodium channels. These data suggest that AzoTAB may affect voltage-gated fast sodium channels and/or calcium channels in cardiomyocytes; thus, AzoTAB could serve as a reversible, light-controlled excitation inhibitor. We suspected that the cis-isomer of AzoTAB weakly binds to the ion channels, because it is easily washed out. In the trans-form, the AzoTAB molecule is less polarized and might bind to the membrane via hydrophobic interactions; whereas the cis-form is suspended in the surrounding solution. We propose the following hypothesis of nonspecific AzoTAB binding with the surface of the cells: in the trans-form, AzoTAB nonspecifically attaches to the cell membrane and globally interferes with the functioning of ion channels, whereas the cis-form of AzoTAB leaves the membrane, which restores ion channel activity. Interestingly, a previous study reported that the interfacial tension of AzoTAB in water changes depending on the conformation of AzoTAB. 20 Since AzoTAB molecules adsorb on the cell surface, changes in interfacial tension may affect cell activity, earlier it was shown that changes in interfacial tension may affect functioning of voltage-gated ion channels.34,35 Further data on the mechanism of AzoTAB-mediated light sensitivity of cardiomyocytes can be obtained from single-cell experiments.
Conclusion
Our experiments demonstrated the possibility of sensitizing cardiomyocytes to light illumination using AzoTAB. In a light-sensitive tissue, we could execute dynamic patterning of the excitable network. We could reversibly suppress excitation waves, create a desired patterned of excitation, and produce artificial pacemakers. Although AzoTAB is not directly suitable for biomedical applications, one immediate potential application of our method is the modeling of various geometrical and time-dependent excitation patterns in cardiac tissue by using light instead of the complex and unstable process of patterned plating of cardiac cells. Light-controlled cardiomyocytes may also be used in artificial excitable networks for lab-on-a-chip systems.
Footnotes
Acknowledgments
The authors thank Prof. K. Yoshikawa, Kyoto University, and Dr. D. Baigl, Ecole Normale Supérieure, for their helpful discussions. They would also like to thank Prof. S. Murata, Dr. A. Zinchenko, and Mr. Y. Kuroda, Nagoya University, for the synthesis of the azo compound. This work is partially supported by KAKENHI-21340120 (Japan Society for the Promotion of Sciences).
Disclosure Statement
No competing financial interests exist.