
Abstract
Earlier, we demonstrated that local electrical stimulation (ES) improved bone and peripheral nerve regeneration. To determine how ES induces the regeneration of different kinds of tissues, we studied the initial ES-induced regeneration process by investigating the expression of chemokines and growth factors from human mesenchymal stromal cells (hMSCs). In particular, we assessed the responses of hMSCs grown in three-dimensional (3D) culture on a collagen sponge, as 3D culture techniques induced cell behavior that was similar to in vivo cell behavior. We also compared the gene expression patterns of monolayer hMSCs with those of 3D hMSCs under the condition that cells in either culture are exposed to the same type of ES. Biphasic pulses did not affect the proliferation of hMSCs in 3D culture significantly at the magnitude applied in previous animal studies showing improved bone and peripheral nerve regeneration. However, ES enhanced the gene expression of growth factors (BMP-2, IGF-1, and VEGF), chemokines (CXCL2, interleukin (IL)-8), and chemokine receptors (CXCR4 and IL-8RB) from hMSCs grown in 3D culture. A particular difference between the 3D and monolayer cultures was found in the expression of chemokine receptors, CXCR4 and IL-8RB, which is related to the homing capabilities of mesenchymal stromal cells. These genes were expressed by cells in 3D cultures, but were not or expressed at extremely low levels by cells grown in monolayer cultures. ES led to a significant increase in the expression of CXCR4 and IL-8RB in both monolayer and 3D hMSCs, but the increase in the monolayer culture was detected at an extremely low level. These results demonstrate that ES increased the expression of a variety of growth factors and chemokine genes from 3D hMSCs, which may explain increased tissue regeneration in vivo, independent of the tissue type. A culture-dependent expression of the CXCR4 gene suggested that cell response to external stimulus in 3D systems may be more accurately reflected in in vivo findings than in monolayer cultures.
Introduction
Bone and other tissues have a natural capacity to heal injuries and regenerate defects. Each tissue has a unique self-repair capability, but this capability is characterized by multiple common steps involving complex interactions between cells, growth factors, and the ECM.6,20 During the repair process, local and systemic factors interact with the many cell types that are recruited to the injury or surgical site from the surrounding tissues and circulation. 21 The immediate step after injury involves an inflammatory response that leads to the recruitment of mesenchymal stromal cells (MSCs) which act in an autocrine–paracrine fashion, regulating the microenvironment through the release of growth factor and cytokines and resulting in the differentiation of MSCs into the specific cell type of the damaged tissue.20–22 A variety of chemokines and growth factors are thought to play a leading role in the regeneration cascade through a series of processes including chemotaxis, mesenchymal cell proliferation/differentiation, angiogenesis, and ECM synthesis. 23
When attempting to elucidate the molecular mechanisms underlying the response to certain stimuli, cell culture-based studies cannot directly duplicate the in vivo conditions and somtimes yield results that conflict with the in vivo observations. These conflicting results can be attributed to different doses applied at different frequencies, different intensities of the stimulus, and the exposure protocols used. For example, in ES studies, the cell response depends on the mode, strength, and duration of the ES.24,25 Another critical factor is the cellular microenvironment, which is determined by cell-to-cell contacts and relationships between other cells. 26 To mimic in vivo conditions, three-dimensional (3D) tissue culture techniques are preferable to monolayer cultures, because the cellular environment in 3D cultures is more similar to that in vivo.26,27 Further, there are more cell–cell contacts and cell interactions with the ECM when cells are grown in 3D culture, thus allowing cells to adopt their native morphology, which may influence signaling activity. 27
Numerous studies have shown that BEC stimulation improves the self-repair capability of recipient tissues.6,7,12 In our previous in vitro investigations, we demonstrated that BEC not only increased the proliferation of osteoblasts and human mesenchymal stromal cells (hMSCs), but also upregulated osteogenesis-related cytokines including BMP-2, IGF-1, and VEGF.28,29 However, these results were obtained using monolayer cultures of cells. Therefore, in this study, we investigated the effects of BEC stimulation of 3D cultures of hMSCs to investigate the in vivo behavior of hMSCs. Porous collagen scaffolds were used to create a 3D environment, and ES was delivered at the same magnitude as that used in animal studies, using the same stimulator Integrated Circuit chip as was used in our previous studies.13–15 In particular, we investigated the expression profiles of chemokines and their corresponding receptors; these receptor-ligand pairs play critical roles in the initial stage of the healing process by recruiting other types of cells such as MSCs and endothelial cells.30,31 In addition, we examined the expression of certain growth factors as well as ECM genes.
Materials and Methods
Isolation and culture of hMSCs
Bone marrow cells were harvested from subjects with consent, and the study was approved by the local ethics committee (IRB of Seoul National University Dental Hospital, Nr: CRI05008) according to the legal regulations for human tissue and organs in Korea. Primary hMSCs were isolated from bone marrow from two healthy donors (a man and a women aged 19 and 22 years old, respectively) as previously described. 32 The marrow suspension was collected in a syringe containing 6,000 U/mL heparin and was mixed with phosphate buffered saline (PBS) solution in the same volume ratio and centrifuged at 2,500 rpm for 10 min. After aspiration of the upper PBS layer, the marrow suspension was layered on Ficoll-paque (Amersham Biosciences) in a 1:5 ratio, and then centrifuged at 1,200 g for 30 min. The nucleated cells concentrated at the interface were collected and washed with PBS. Adherent cells were plated at a density of 2×10⁶ cells/100 mm plate and cultured in an expansion medium containing low-glucose Dulbecco's modified Eagle's medium (DMEM), 100 units/mL of penicillin, 100 μg/mL of streptomycin, and 10% heat inactivated fetal bovine serum (FBS) under a humidified atmosphere of 5% carbon dioxide (CO2) at 37°C. The medium was changed every 3 or 4 days. Cells were passaged when they reached 70% confluence, and second-passage cells were used for all the experiments described in this article.
BEC stimulation of hMSCs
The BEC stimulator was modified from the previously reported system so that various electrical current parameters such as duration, amplitude, and pulse rate could be delivered with precise resolution using the chip. The in vitro culture system that we used was the same as the one described in detail in our previous study.15,29 An Au-deposited silicon plate 3.4 cm in diameter was used as a stimulating electrode as well as a culture plate due to its biocompatibility, excellent cell attachment, and high conductivity. All components of the in vitro culture system were handled as described in our previous study (Supplementary Fig. S1; Supplementary Data are available online at www.liebertonline.com/tea). hMSCs were plated at a cell density of 1.7×10⁴/cm2 on a gold plate for the monolayer culture. After the cells had reached confluence, they were exposed to an ES of 1.5 μA/cm2 amplitude, 250 μs duration, and 100 pulses/s. For the 3D culture, the hMSCs were inoculated onto a collagen sponge with a diameter of 5 or 8 mm, depending on the experiment. After an approximately 3-h incubation, high-glucose DMEM supplemented with 10% HIFBS was added to the cells. The next day, 3D cells seeded on a collagen sponge were placed between two gold plates and exposed to an electric field formed by the flow of current from an upper cathode plate to a lower anode plate. There was no need to connect the collagen matrix with the BEC stimulator, because the surrounding media played a role as a conductor to deliver an electrical current to the cells attached to the nonconductive matrix. BEC was set at the magnitude of 125 μs duration with 100 pulses/s at varying amplitudes of 10, 20, or 40 μA/cm2. The proliferation of 3D hMSCs exhibited an additional measurement at 1.5 μA/cm2 amplitude, 250 μs duration, and 100 pulses/s, which was the same magnitude seen in the monolayer culture.
Proliferation of 3D hMSCs
A collagen sponge 2–3 mm in thickness was prepared from the cross-reaction of chondroitin-6-sulfate (Sigma Chemical Company) and type I collagen (Bioland Co.) as previously described. 33 hMSCs were inoculated with either a low or high number that amounts to 2.5×10⁴ cells, or 1.5×10⁶ cells in 20 μL of HIFBS on a 5 mm diameter sponge, respectively. After an approximately 3-h incubation, high-glucose DMEM supplemented with 10% HIFBS was added to the cells, and cultured under a humidified atmosphere of 5% CO2 at 37°C. After 1 day, the cells were continuously exposed to BEC for an observation period. The proliferation of 3D hMSCs was assessed at days 2 or 4 using a Cell Counting Kit-8 (Dojindo Laboratories), which employs the tetrazolium salt, WST-8 [2-(2-methoxy-4-nitrophenyl)-3-(4-nitrophenyl)-5-(2,4-disulfophenyl)-2H-tetrazolium, monosodium salt] according to the manufacturer's protocol. The amount of yellow-colored product was measured at a wavelength of 450 nm using a microplate reader and is directly proportional to the number of viable cells in a culture media. The optical density (OD) values of samples represent an index of cell proliferation. This assay was repeated for three or four independent samples (n=3–4).
Reverse transcription-polymerase chain reaction and quantitative real-time reverse transcription-polymerase chain reaction
1.5×10⁶ hMSCs in 40–50 μL HIFBS were inoculated onto a collagen sponge with a diameter of 8 mm, and continuously exposed to 20 μA/cm2. After 2 or 4 days, the collagen sponge was washed with PBS solution and chopped into small pieces. After adding 0.5 mL of TRIzol reagent (Invitrogen, Life Technologies) directly to the chopped sponge, total RNA was extracted and then subsequently treated as prescribed in the manufacturer's instructions. Total RNA was extracted by adding 0.5 mL of TRIzol reagent (Invitrogen, Life Technologies) directly to the chopped sponge. One microgram of RNA from each sample was subjected to cDNA synthesis using SuperScript™ Reverse Transcriptase II (Invitrogen) and oligo (dT)12–18 primer (Invitrogen) in a 20 μL reaction volume according to the manufacturer's instructions, and RNA complementary to the cDNA was removed using E. coli RNase H (Invitrogen). One microliter of cDNA was then subjected to a polymerase chain reaction using the following amplification profile: predenaturation at 94°C for 40 s, amplification (denaturation at 94°C for 40 s; annealing at 60°C for 40 s; extension at 72°C for 1 min) for 30 cycles, followed by a final extension step at 72°C for 10 min. PCR was performed in a DNA thermal cycler (model PTC-200; MJ research, Inc.). Ten microliters of each of the PCR products was electrophoresed on a 1.5% agarose gel in the presence of ethidium bromide, and the bands were visualized using a Gel Documentation System (Vilber Lourmat).
For quantitative real-time reverse transcription-polymerase chain reaction (qRT-PCR), total RNA isolation and cDNA synthesis were carried out using the same methods as described for reverse transcription-polymerase chain reaction (RT-PCR). SYBR® Green PCR Master Mix (Applied Biosystems) was used to detect the accumulation of PCR products during cycling on the ABI Prism 7700 Sequence Detection System (Applied Biosystems). The thermocycling conditions were as follows: predenaturation at 95°C for 10 min, 30 cycles of amplification with denaturation at 95°C for 15 s, and annealing and extension at 60°C for 1 min with a final dissociation cycle at 95°C for 15 s, 60°C for 1 min, and 95°C for 15 s. qRT-PCR reactions were carried out in triplicate in three independent experiments (n=3). Oligonucleotide primers for real-time RT-PCR were designed to amplify products smaller than 200 bp in size using Real-Time PCR System Sequence Detection Software v1.3 (Applied Biosystems). The primers were purchased from Bionics. Fold differences in the levels of each gene were calculated for each treatment group using normalized CT values of the housekeeping gene, β-actin, according to the Applied Biosystem instructions. The human-specific primers used are shown in Table 1.
IGF-I, insulin-like growth factor-I; BMP-2, bone morphogenic protein-2; VEGF, vascular endothelial growth factor; bFGF, basic fibroblast growth factor; TGF-β1, transforming growth factor-beta 1; NGF, nerve growth factor; FN, fibronectin; Col I, type I collagen; SDF, stromal cell-derived factor; IL-8, interleukin-8.
Scanning electron microscope
The sponges were washed thrice with PBS. Adhered cells on the sponges were fixed with 2.5% glutaraldehyde. After washing thrice with PBS, the adhered cells were dehydrated in an ethanol-graded series and allowed to dry on a clean bench at room temperature (RT). The sponges were then coated by Au-Pd sputtering method. Scanning electron microscope (SEM) observation was done with a Hitachi s-4700 field emission SEM at 30 kV.
Western blotting of CXCR4 protein expression
hMSCs were lysed in RIPA buffer described by Kim et al. 28 Cell lysates (20 μg/lane) were subjected to a 10% SDS–polyacrylamide gel and transferred to PolyScreen PVDF membrane (PerkinElmer Life Sciences). The membranes were blocked with 5% nonfat dry milk in TBST buffer (0.1M Tris-buffered saline [pH 7.5]/0.1% Tween) and probed with antibodies. The following antibodies were used in this study: polyclonal rabbit anti-CXCR4 antibody diluted 1:200 (Abcam) and monoclonal anti-α-Tubulin diluted 1:500 (Santa Cruz Biotechnology). Primary antibodies were detected after incubation with HRP-conjugated anti-rabbit IgG (Santa Cruz Biotechnology) for CXCR4, HRP-conjugated anti-mouse IgG (Dako) for α-Tubulin, and finally with an enhanced chemiluminescence detection system ECL (Amersham Biosciences) according to the manufacturer's instructions.
Histochemical staining and immunohistochemical staining
Cultured collagen sponges were dehydrated in 70% ethanol and embedded in paraffin. For histochemical staining, the paraffin sections were cleaned for 10 min with xylene and stained with hematoxylin and eosin (H&E) for the detection of cells and nuclei. Digital images of the stained sections were collected using a transmission and polarized light Axioskop Olympus BX51 microscope (Olympus Corporation).
For the immunohistochemical (IHC) staining of fibronectin (FN) expression, monolayer hMSCs were plated at an average cell density of 3,000 cells per coverslip. Cells were washed thrice with PBS, fixed in 4% paraformaldehyde for 30 min, and blocked in a blocking solution for 30 min. For the preparation of 3D hMSCs, the cultured sponge was embedded in paraffin and cut vertically and horizontally to a 3–4 um thickness (LEICA RM2245; Leica Biosystems Nussloch GmbH). Paraffin sections were cleaned for 10 min with xylene, and the de-paraffinized sections were treated with an undiluted serum solution. Specimens prepared from monolayer and 3D cells were treated with the same protocol to stain anti-FN-antibody and incubated with FN ([anti-rabbit; Sigma-Aldrich] [1:400]) for 1 h at RT, washed twice with PBS, and then incubated with secondary antibody labeled with HRP (anti-rabbit IgG using a vectastain kit; Vector Laboratories) according to the manufacturer's instructions (Vector Laboratories). Sectioned images of the stained cells were captured using an Olympus Fluoview FV300 confocal laser scanning microscope and Fluoview software (Olympus optical Co. Ltd.).
Enzyme-linked immunosorbent assay
VEGF-A/BMP-2/interleukin-8 (IL-8) levels in the culture supernatants were determined using enzyme-linked immunosorbent assay (ELISA) kits (Quantikine®; R&D Systems) according to the manufacturer's instructions. Cell culture supernatants at days 1, 2, 3, and 7 (VEGF) or days 3 and 7 (BMP-2) after ES either in osteogenic or growth medium were added to 96-well ELISA plates after centrifugation. Standards for cytokines (0–2,000 pg/mL) were run in each series. After incubation, aspiration, and washing, either human VEGF-A conjugate (100 μL/well), mouse/rat/human BMP-2 conjugate (200 μL/well), or human IL-8 conjugate (100 μL/well) were added based on the manufacturer's instructions. The OD of each well was determined within 30 min using a microplate reader set to a 450-nm wavelength correction for optical imperfections in the plate. The ELISAs were repeated in triplicate for three or four independent samples (n=3–4).
Statistical analysis
All data are presented as means±standard errors of the mean. Statistical analyses were performed using SAS 9.1.3 software (SAS Institute, Inc.). Groups were compared by the two-tailed Student's t-test or one-way ANOVA with post hoc multiple comparison Tukey's tests. Differences with p<0.05 were considered significant.
Results
Gene expression profile of monolayer hMSCs after exposure to ES
Before investigating the effects of ES on 3D hMSCs, we examined the expression of several genes in hMSCs grown in a monolayer culture that were exposed to continuous BEC stimulation for 4 days. hMSCs were exposed to BEC of a magnitude of 1.5 μA/cm2 (amplitude) and a duration of 250 μs (duration). These parameters were demonstrated to increase cell proliferation in a previous study. 29 Expression levels of genes were assessed at days 2 and 4 after BEC stimulation to determine the effects of long-term stimulation. The genes of interest were divided into three groups: growth factor genes [BMP-2, IGF-I, VEGF, NGF, and TGF-β1], chemokines [stromal cell-derived factor-1 (SDF-1/CXCL12), interleukin-8 (IL-8/CXCL8), CXCL2], and ECM genes [FN]. RT-PCR results for NGF, TGF-β1, SDF-1, CXCL2, and FN revealed that BEC stimulation did not have an effect on the transcript levels of these genes (Fig. 1A). The expression of the chemokine, IL-8, and the growth factors IGF-1, VEGF, and BMP-2, increased in the ES group. qRT-PCR analysis was used to confirm the expression pattern detected by RT-PCR; the qRT-PCR results were consistent with the RT-PCR results (Fig. 1B). The expression of IGF-1, VEGF, and IL-8 was significantly increased at 4 days after ES 4.64-fold for IGF-1, 2.12-fold for VEGF, and 4.89-fold for IL-8, compared with the control group. However, the slight increase in BMP-2 expression observed in the ES group was not significantly different from BMP-2 expression in the control group. No changes in the expression patterns of SDF-1 and NGF were observed in this study.
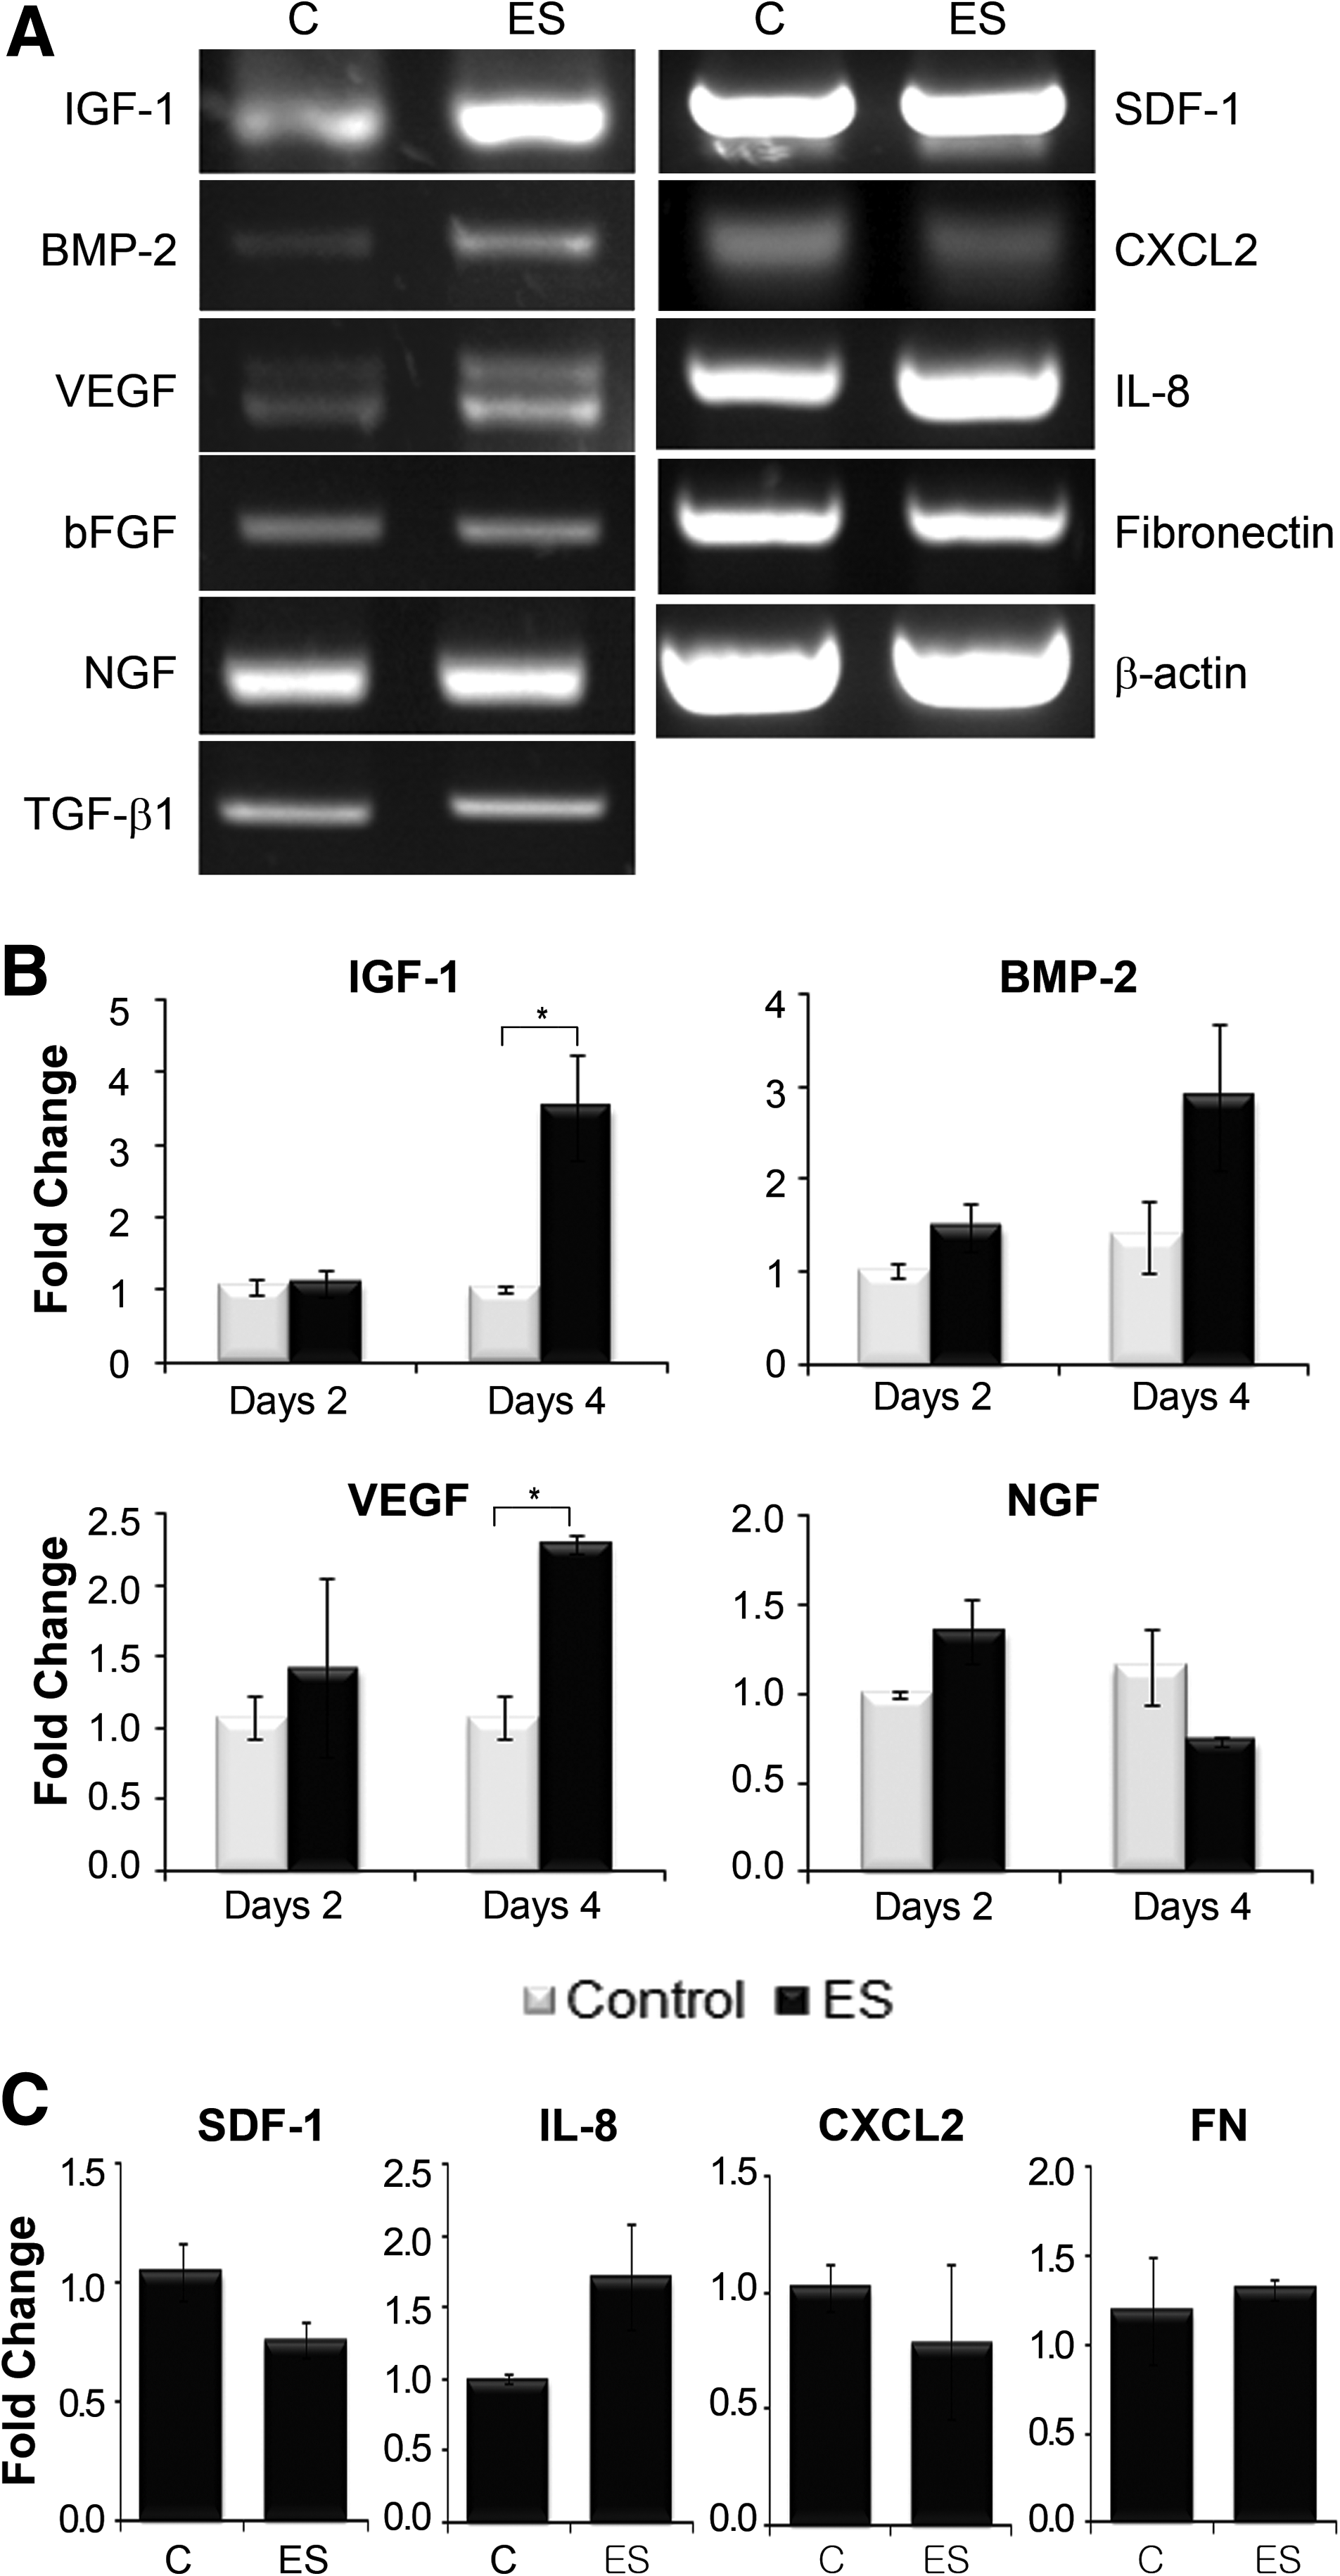
Gene expression by monolayer hMSCs after BEC stimulation.
Cell proliferation of hMSCs in 3D culture exposed to ES
For 3D culturing of hMSCs, we used a collagen sponge, which provides a natural collagen matrix and is an excellent scaffold for bone formation and wound healing. 33 To examine whether BEC also had a proliferative effect on cells grown in 3D culture, we measured the cell growth with a low number of hMSCs (2.5×10⁴ cells) after BEC stimulation using various combinations of parameters: those used in previous monolayer culture studies (1.5 μA/cm2, 250 μs, 100 pulses/s; I), those used in previous animal studies (20 μA/cm2, 125 μs, 100 pulses/s; III), and 10 (II) or 40 μA/cm2 (IV) for 125 μs at a frequency of 100 pulses/s (Fig. 2A). Contrary to our expectations that BEC would promote cell proliferation similar to monolayer culture studies, the growth of hMSCs in the 3D culture did not increase in the ES group for the current magnitudes of 10 and 20 μA/cm2, or at the current magnitude used for the monolayer culture. However, the OD value, an index of cell proliferation, increased by 28% at 40 μA/cm2 compared with the unstimulated control group. Under the BEC parameters (20 μA/cm2, 125 μs, 100 Hz) used in previous animal studies, we further examined the effect of ES on the proliferation of 3D hMSCs inoculated with a high number of cells (1.5×10⁶ cells) at days 2 and 4 poststimulation to estimate the ES effect if a high number of hMSCs were transplantated in regenerative medicine. Cell proliferation at day 4 occurred over time versus the culture at day 2 despite the high cell density. However, ES did not increase either the cell growth of 3D culture with a high number of cells or with a low number of cells.
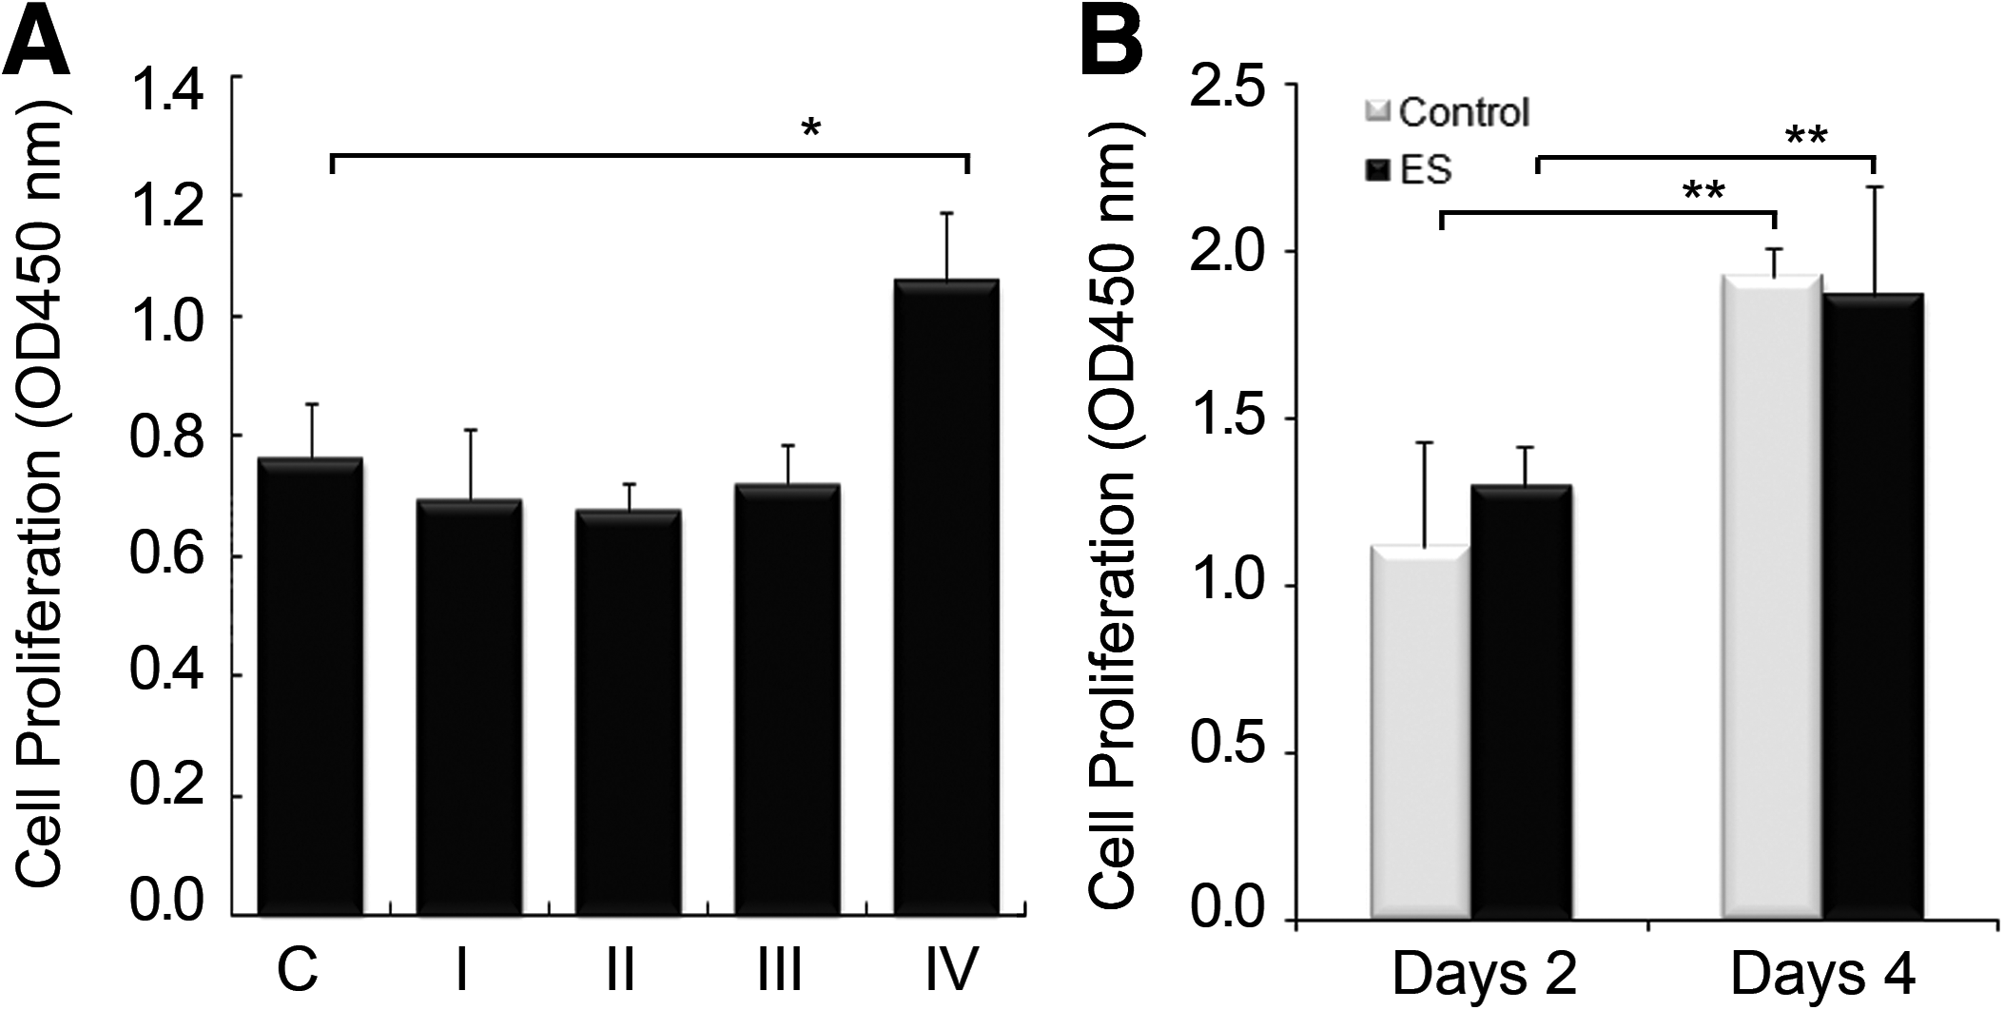
Proliferation of 3D hMSCs after BEC stimulation.
Gene expression by 3D hMSCs stimulated with BEC
Although the 3D hMSCs were not induced to proliferate at a current magnitude of 20 μA/cm2, we examined gene expression to determine the effects of BEC on cells, as animal studies have demonstrated that BEC enhances tissue regeneration at this current density.13,14 BEC stimulation of 3D hMSC cultures resulted in a significant up-regulation of certain growth factors and chemokines (Fig. 3A). ES increased the expression of IGF-I by 60% at day 2, whereas the other genes showed a delayed response to ES. Their levels increased above the control levels at day 4. The transcript levels of VEGF, BMP-2, TGF-β1, and bFGF were increased by 130%, 324%, 230%, and 147% compared with the unstimulated group, respectively. Similarly, the chemokine, IL-8, and the CXCL2 gene were significantly up-regulated in the ES group at day 4 (182% and 150% increases compared with the unstimulated control, respectively), whereas the ES did not affect the expression of another chemokine, SDF-1. There was no change in the expression of NGF, which plays a critical role in nerve regeneration. The ELISA results for VEGF, BMP-2, and IL-8 were consistent with the patterns observed with qRT-PCR (Fig. 3B). BEC stimulation for 4 days increased the extracellular release of VEGF, BMP-2, and IL-8 by 13%, 15%, and 80%, respectively, compared with the unstimulated control cells.
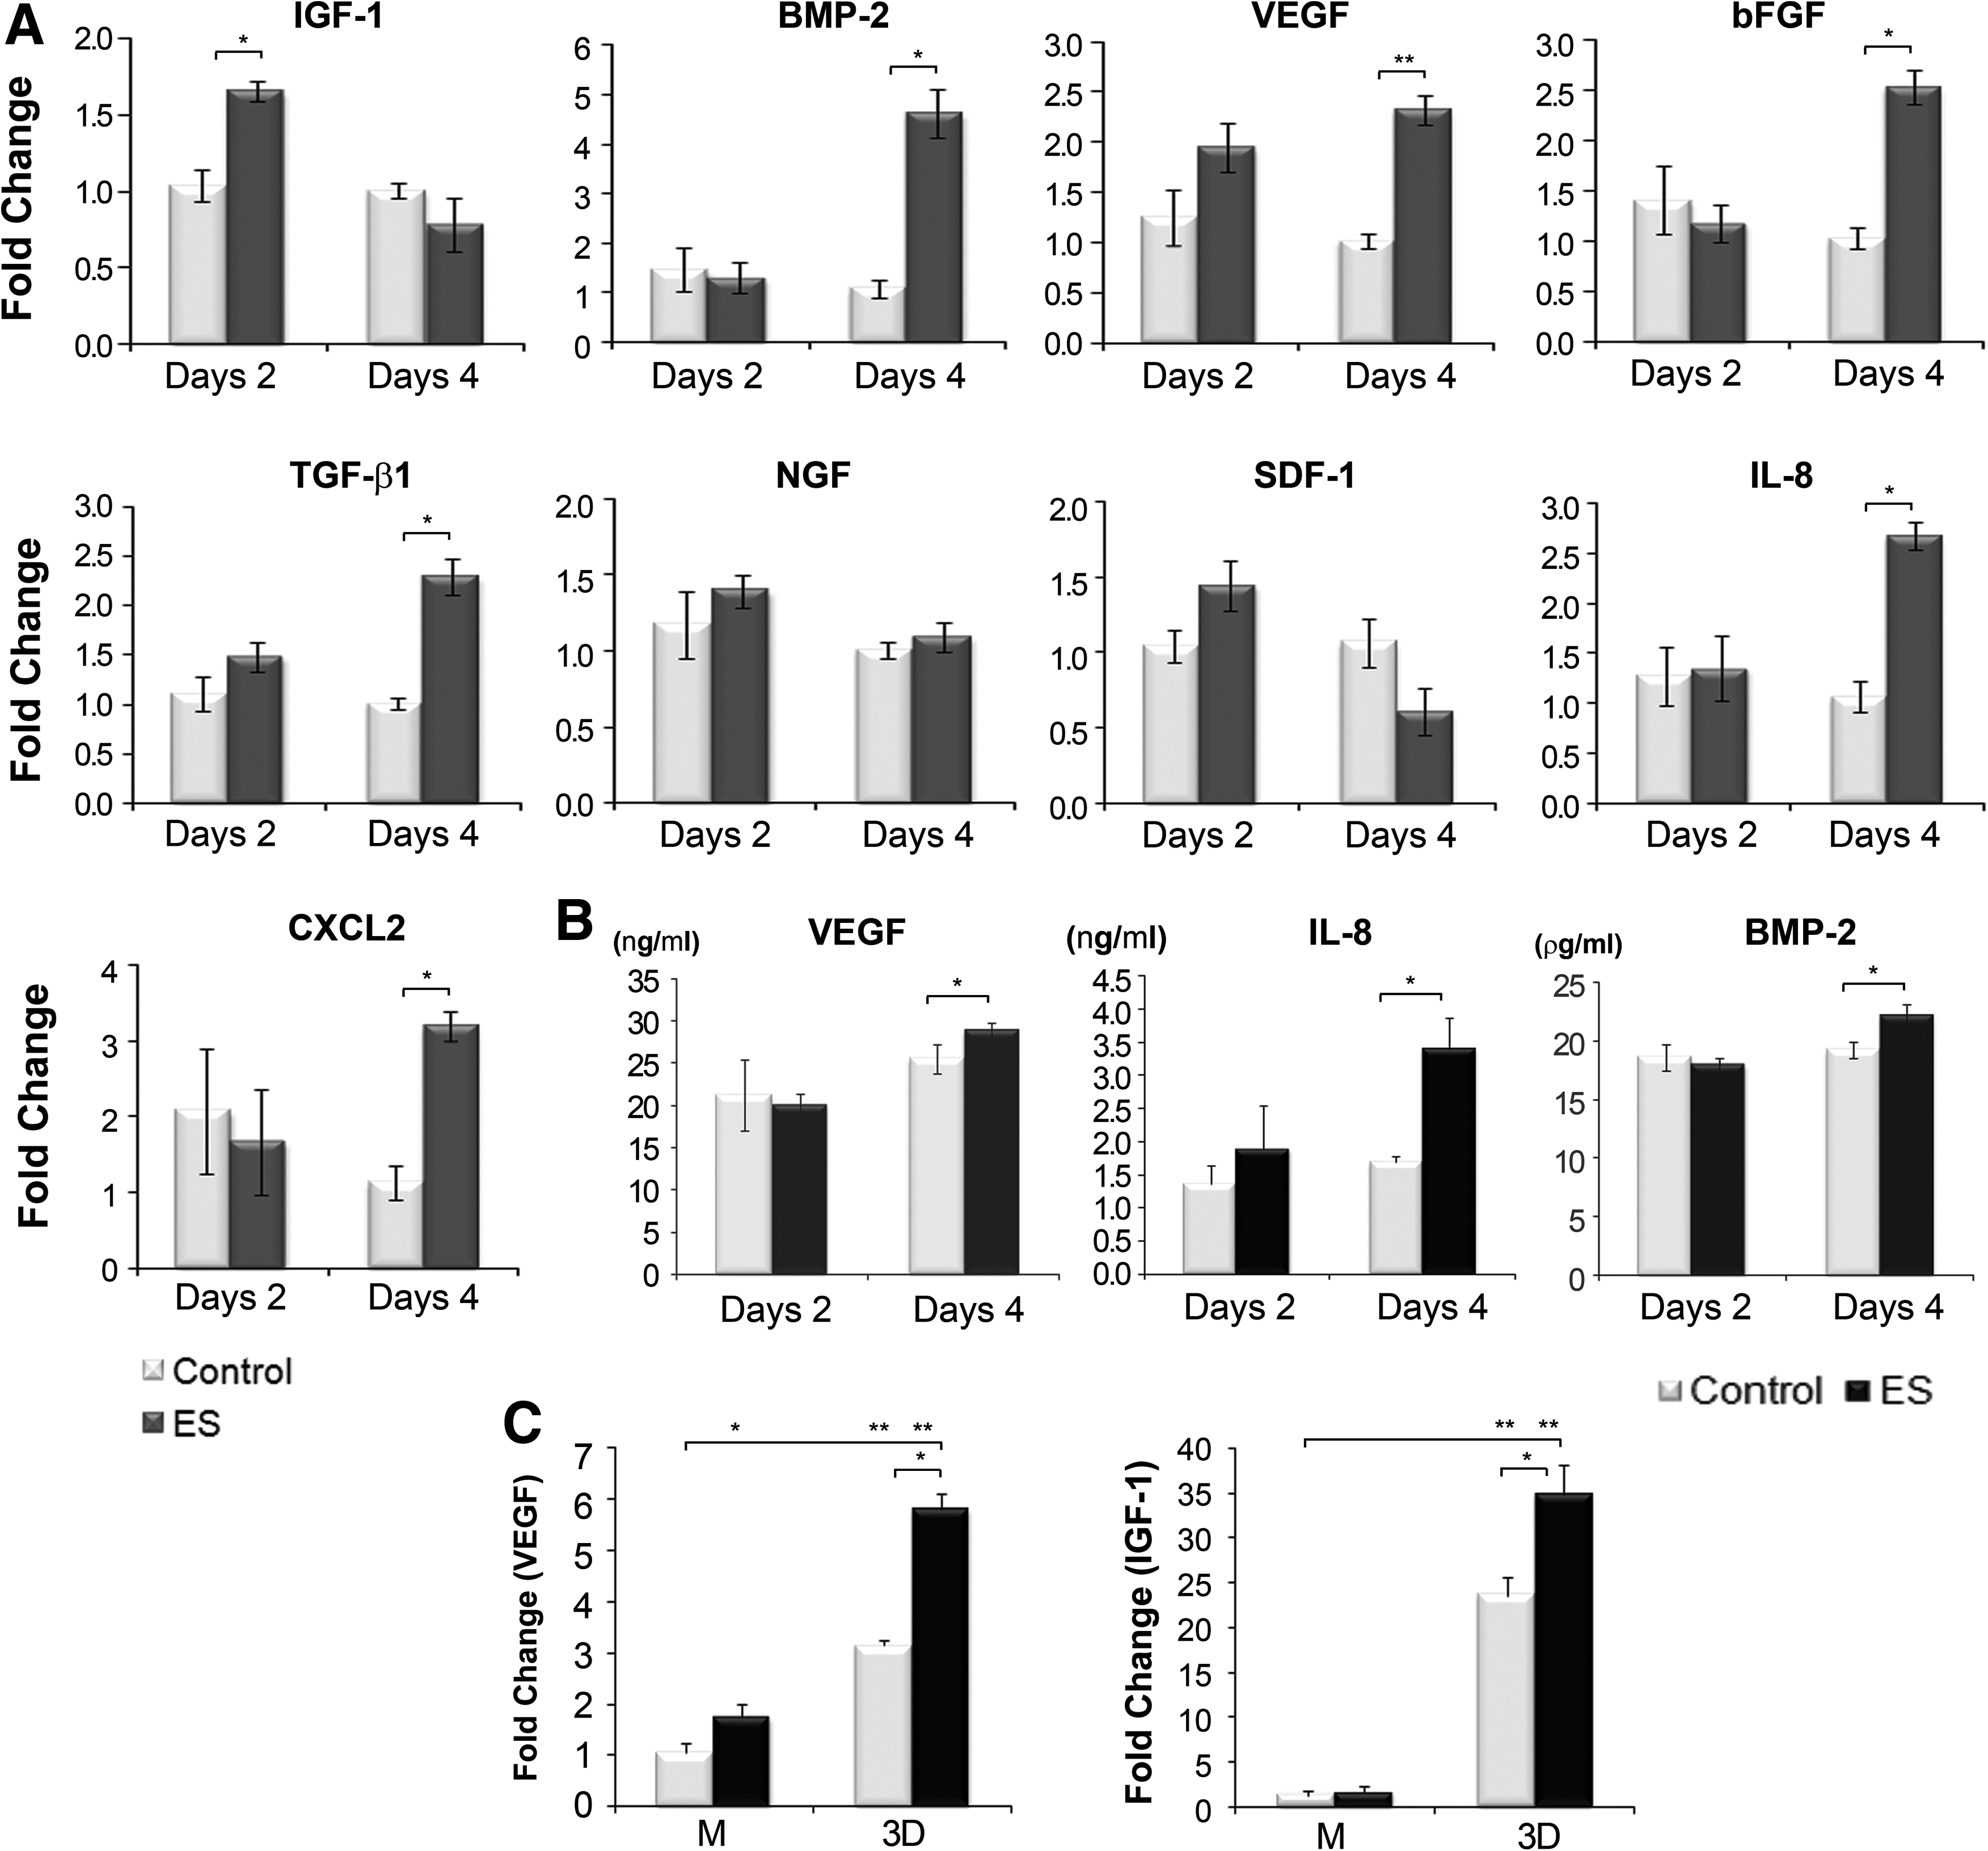
Gene expression of 3D hMSCs after BEC stimulation.
To confirm the observed trend, we repeated some experiments using hMSCs derived from another person. Cells from a second donor (hMSCs #2) showed a similar tendency for VEGF and IGF-1 expression with those from the first donor (hMSCs #1) described in Fig. 1B at the observation of monolayer culture, and in Fig. 3A at 3D culture (Fig. 3C). VEGF expression showed uniform results, independent of specimens and culture methods, although there were some differences in the change level, probably due to the individual property. Transcript level of VEGF in electrically stimulated hMSCs #2 groups was higher by 65% and 85% in monolayer and 3D cultures, respectively, compared with the unstimulated group, which was similar in hMSCs #1. However, the ES effect on IGF-1 expression showed a slightly different pattern with that seen in hMSCs #1. There was no increase by ES in monolayer hMSCs of hMSCs #2, compared with increased expression in hMSCs of hMSCs #1. However, ES increased IGF-1 expression in 3D hMSCs of hMSCs #2 at days 4, whereas the increase was seen at day 2, not at day 4 in 3D hMSCs #1. Notable appearance in the gene expression of IGF-1 and VEGF is that the expression level of 3D hMSCs #2 is much higher than that of monolayer cells by 18.4-fold and 3-fold, respectively. hMSCs #1 also showed culture method dependency in IGF-1 expression, but little in VEGF expression (data not shown).
ECM formation by 3D hMSCs on a collagen sponge after BEC stimulation
At the same condition as in Figure 3, we examined the gene expression of ECM-related genes, FN, and type I collagen (Col I) (Fig. 4A). The FN gene exhibited no change in expression at day 2, but a slight increase was seen at day 4 after ES, which was not significant. There was no change in the expression of the Col I gene. SEM images showed that the collagen sponge was highly porous, with a loose network of collagen fibrils and an approximate pore size of 80–150 μm (Fig. 4B). hMSCs were cultured in the collagen sponge for 4 days with or without ES, during which the pores in the sponge became filled with hMSCs and secreted ECM to form a matrix layer, thus resulting in the virtual disappearance of the pores. Even though the difference in matrix formation between the control and ES groups is not remarkable, the ECM built by hMSCs exposed to ES seemed to form denser fibers that were aligned in parallel to the horizontal axis of the surface layer. Histological observation of the cultured sponge showed cells that were attached along the fiber or created cell-cell contacts in both the surface area and interior sponge in the ES and control groups (Fig. 4C). In H&E-staining of the vertical and horizontal sections, we identified colonized cells that were sporadically interspaced in the network of collagen fibers. This image demonstrates that the 3D culture allowed cells to create cell-cell contacts through ECM proteins. IHC staining for FN, a representative ECM protein, was performed to visualize the matrix network and showed a uniform pattern with H&E staining. Positively stained regions with anti-FN antibody corresponded to the interspaced regions in fibers where cells were colonized, whereas the negative control showed none-stained regions in the staining without treatment of primary anti-FN antibody.
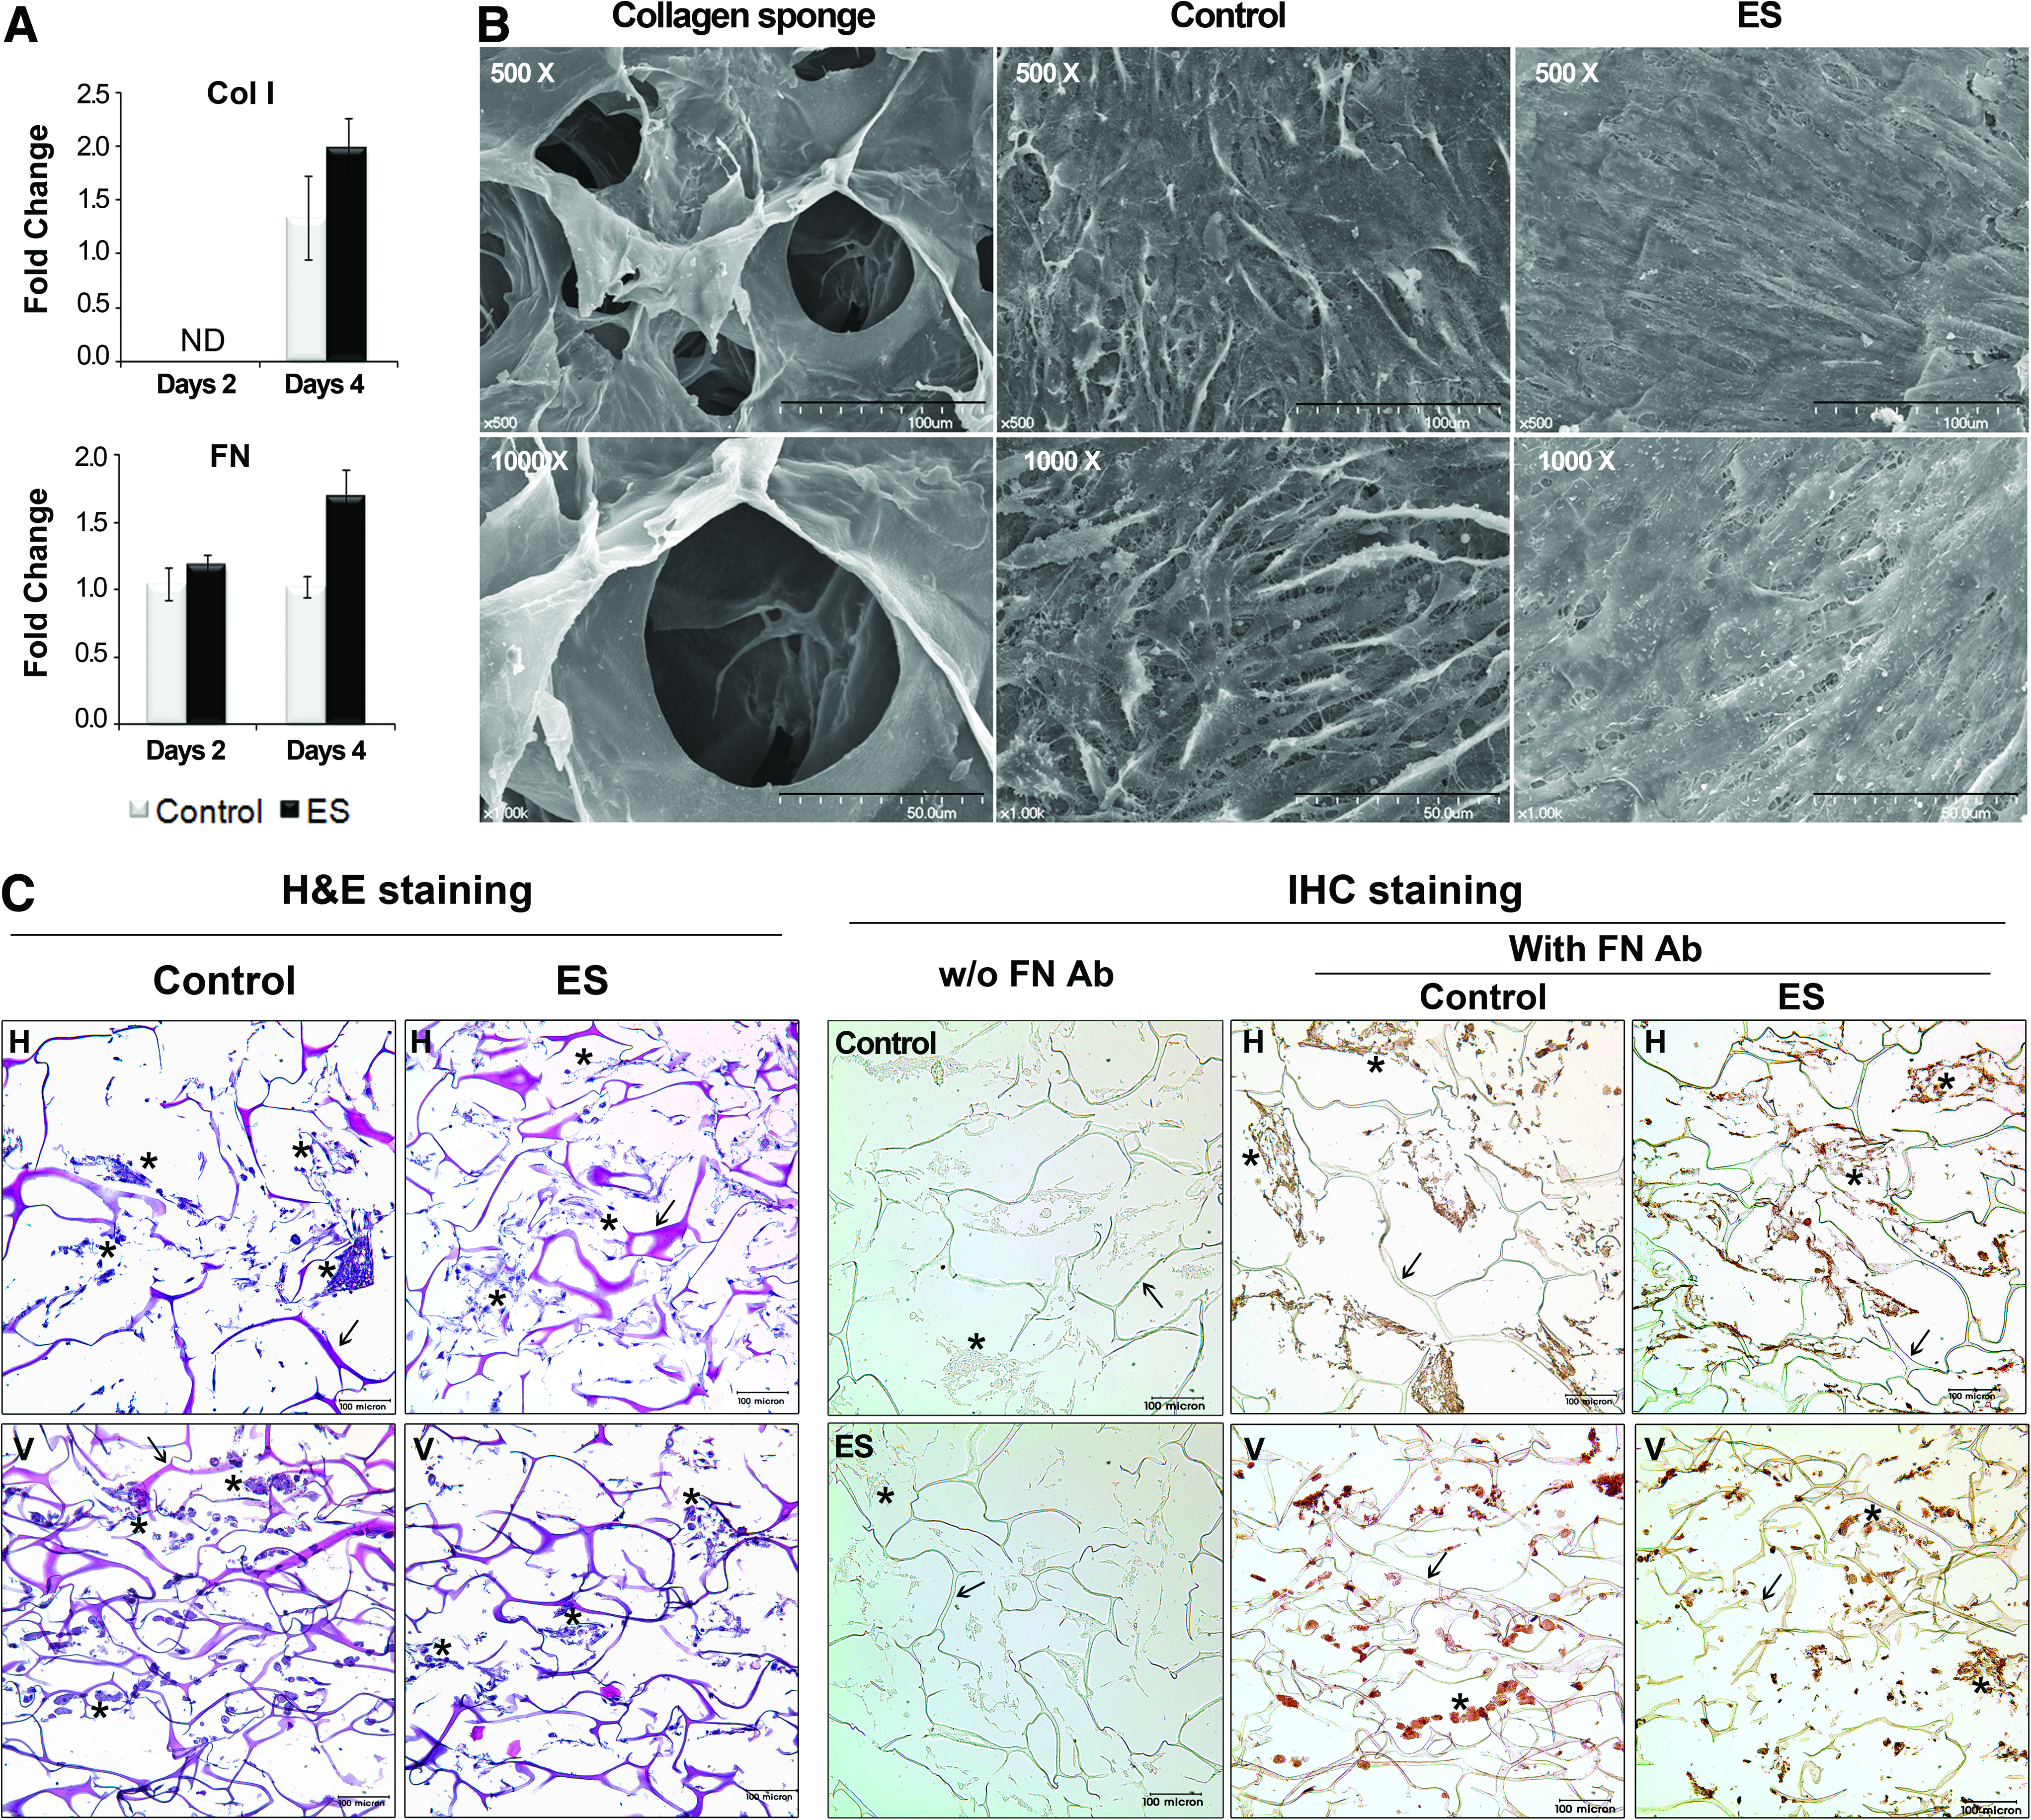
ECM formation of 3D hMSCs on collagen sponge with or without ES.
Characteristics of chemokine receptor (CXCR4, IL-8RB) expression in 3D and monolayer hMSCs
Interestingly, the expression of the chemokine receptor CXCR4 for chemokines, SDF-1, and CXCL2 differed markedly between the 3D and monolayer hMSC cultures. None or extremely low CXCR4 expression was detected in monolayer hMSCs cultured on Au-coated plates (Fig. 5A). The gene expression of IL-8RB, receptor for IL-8, was extremely low in both monolayer and 3D hMSCs. In 3D hMSCs, relative transcript levels of CXCR4 and IL-8RB genes were increased by 6.42 and 6.34-fold at 4 days after ES, compared with the unstimulated group, respectively. Despite extremely low expression in monolayer hMSCs, the expression of both genes showed an increasing pattern as a response to ES, but the changed level of IL-8RB expression was not significant (Fig. 5B). qRT-PCR analysis proved that expression levels of the chemokine receptors CXCR4 and IL-8RB increased significantly in response to ES in 3D hMSCs. To investigate whether the low-level expression of CXCR4 or IL-8RB in the monolayer culture is due to the surface composition, we examined the gene expression of both genes after culturing on the nonconductive conventional plastic plate. The result exhibited the same tendency as seen in monolayer cells cultured on a conductive gold plate (Fig. 5C). There was no difference in CXCR4 expression between culture on plastic surface and gold surface. However, it was significantly up-regulated at a greater level more than 20-fold in 3D culture, compared with monolayer culture on a gold plate. This trend observed in CXCR4 expression was repeated in IL-8RB expression, which was higher in monolayer culture on a gold plate, compared with that on a plastic plate.
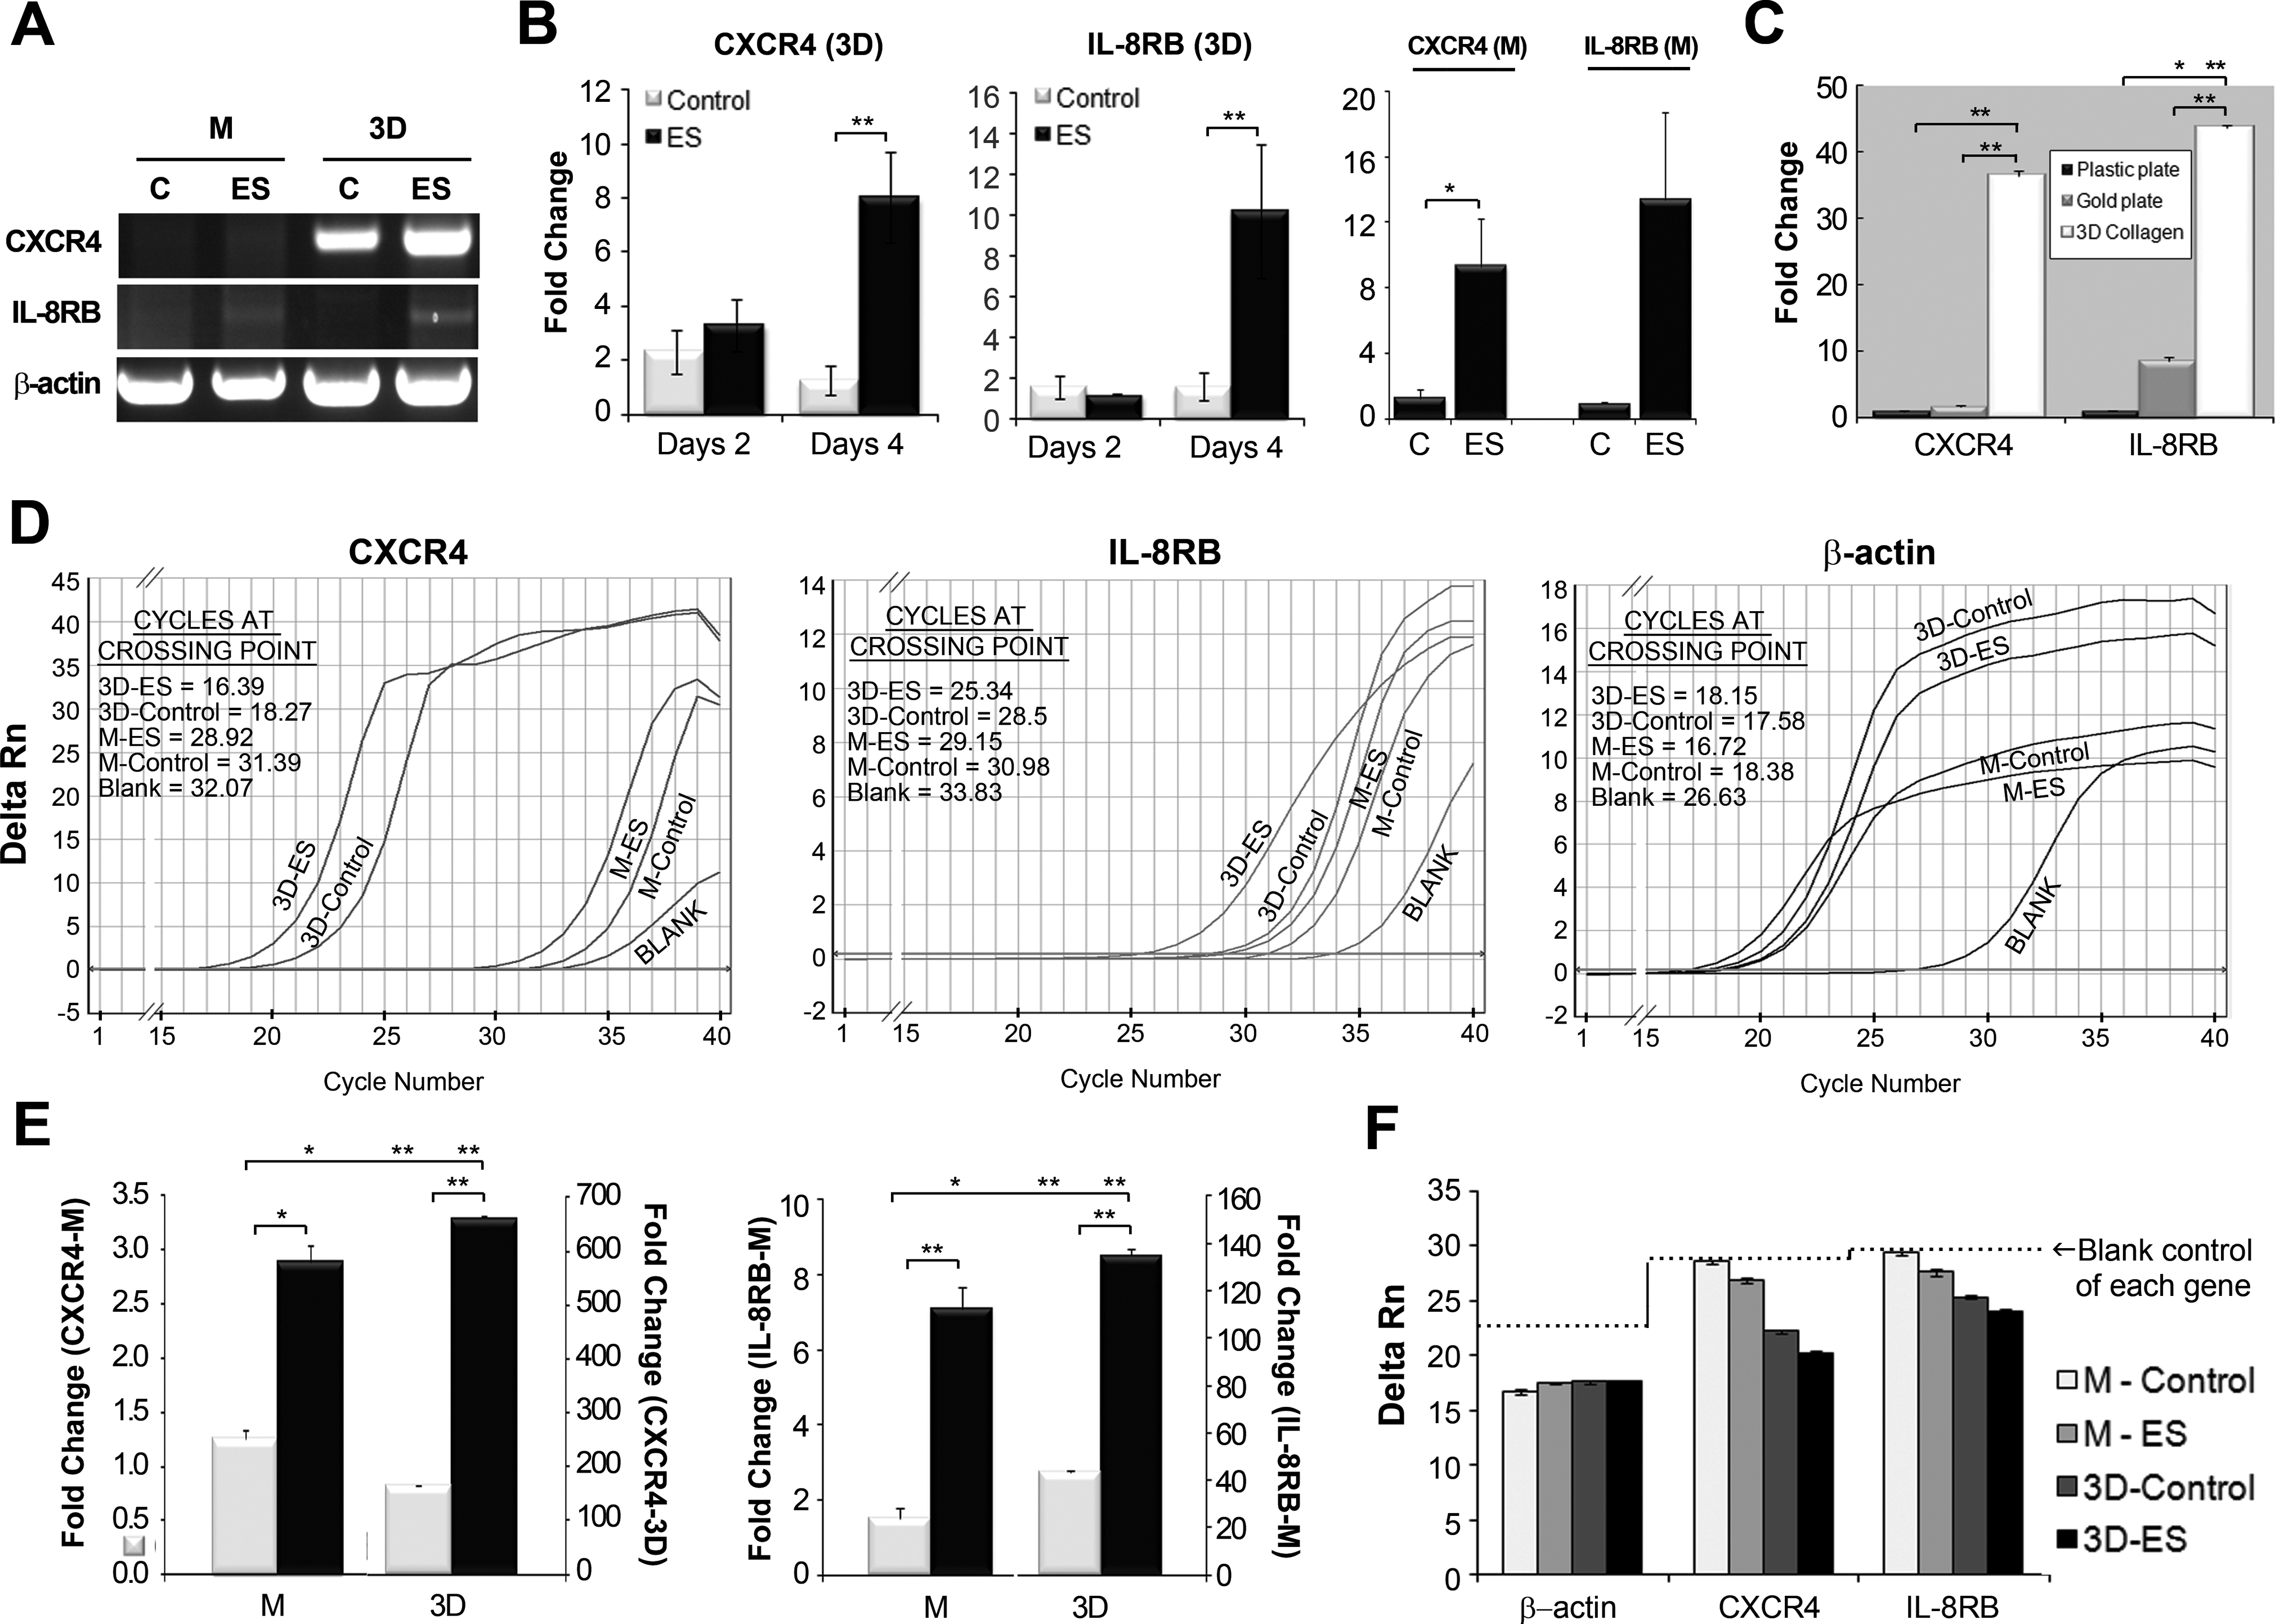
Comparison of the expression of the chemokine receptors, CXCR4, and IL-8RB, between 3D and monolayer hMSCs.
A clear difference in the CXCR4 or IL-8RB expression according to culture method was analyzed in qRT-PCR by comparing the cycle number of CXCR4 amplification with that of the blank control, which was qRT-PCR reaction mixes without cDNA (Fig. 5D). The cycle number at which product fluorescence crosses the fluorescence threshold is the crossing point. Larger amounts of initial mRNA result in detectable fluorescence at a lower crossing point. CXCL4 amplification from cDNA from the monolayer cultures occurred around the 31st cycle, similar to the blank, whereas CXCR4 amplification occurred around the 16th cycle when cDNA from 3D hMSC cultures was used as a template. In contrast, the qRT-PCR results for IL-8RB were similar for both monolayers and 3D hMSCs: the first amplification cycle for IL-8RB occurred around the 28–31th cycle and in the blank, it occurred around cycle 33. Thus, IL-8RB was expressed at low levels in hMSCs cultured in both monolayers and 3D cultures. The cycle numbers of β-actin amplification were distributed in a similar range between cycles 16–18th, independing on culture methods or ES as a gene appropriate to internal control. The cycle number for each gene indicated that the amount of mRNA from each ES group is larger than the unstimulated group, independent of what hMSCs were cultured on a 3D collagen sponge or on a gold culture plate.
As mentioned earlier, the expression pattern of CXCR4 and IL-8RB genes was re-examined using cells from second donor (hMSCs#2). ES increased the transcript levels of CXCR4 by 2.29 in the 3D hMSCs #2, and by 4-fold in monolayer cells, compared with the control group (Fig. 5E). Similarly, the expression of IL-8RB gene was significantly increased by 4.65-fold and 3.09-fold in electrically stimulated monolayer and 3D hMSCs #2, compared with unstimulated cells, respectively. Moreover, a great difference was also found in the expression of these genes between 3D and monolayer cultures. Transcript levels of CXCR4 and IL-8RB were 525 and 89-fold higher in a 3D culture, compared with a monolayer culture, respectively. In addition, we confirmed that CXCR4 or IL-8RB expression in monolayer hMSCs #2 was almost lacking in the comparison of the cycle number of CXCR4 or IL-8RB amplification with that of a blank control (Fig. 5F). Lack of the expression of chemokine receptor, CXCR4, or IL-8RB was common in monolayer culture, independent of hMSCs from different donors.
Protein expression of CXCR4
The expression of CXCR4 was observed in protein level at day 4 after ES from the monolayer (on the gold plate) and 3D hMSCs by western blotting and IHC staining. In western blotting, CXCR4 protein from 3D hMSCs was positioned at a size of 45 kDa parallel to the positive control from MG63, osteosarcoma cell line (Fig. 6A). Interestingly, CXCR4 protein of monolayer hMSCs did not consistently appear with mRNA expression despite a clear detection of α-Tubulin protein used as an internal positive control (Fig. 6B). Moreover, the image of western blotting shows that CXCR4 expression of the 3D cells is enhanced by ES. IHC staining of monolayer cells was performed by only using cells on the plastic plate, because monolayer cells on a gold plate are impracticable for IHC staining due to the nontransparency of the gold plate. IHC staining revealed uniform results with western blotting and qRT-PCR which stated that most of the 3D cells were intensively stained with anti- CXCR4 antibody, whereas most of the monolayer cells show only minimal staining and stained region was lacking in nontreatment with anti-CXCR4 antibody of each group (Fig. 6B).

Protein expression of CXCR4.
Discussion
The previous results from animal studies have indicated that BEC can induce the regeneration of two completely different tissue types, bone and nerve.13,14 Therefore, we investigated the effects of BEC on the release of chemokines and growth factors from hMSCs, addressing the initial cellular events in tissue regeneration. In a continuation of our monolayer culture study, we investigated the effects of ES on cells grown in an in vitro 3D culture system using the same ES parameters used in our previous animal study, because cells grown by the 3D culture technique act more similarly to cells in vivo. 34 Our results indicated that ES increased the release of chemokines and growth factors from 3D hMSCs. This may accelerate chemotaxis and increase the populations of certain cell types, thereby triggering the regeneration cascade. Comparisons of MSCs grown in 3D versus monolayer cultures revealed altered expression of certain genes, and different responses to ES ES. This finding indicates that 3D culture of cells in vitro is a suitable experimental model for investigating the in vivo cellular responses of hMSCs.
The use of 3D cell cultures are increasing because of the accumulating evidence showing significant differences between the cellular phenotypes and biological responses of cells cultured in a monolayer compared with the in vivo cellular phenotypes and biological responses.26,34 Frith et al. used microarray analyses to demonstrate differences in gene expression between monolayer and spinner flask MSCs, including widespread changes to the cellular architecture of the cells and the ECM. 26 Several studies have reported that MSCs cultured on a more natural matrix adhere better, which improves their ability to differentiate. 35 Further, the surface properties of cells grown in an elastic culture matrix are different to those of cells grown on a rigid plastic surface, which can affect stem cell fate.36,37 We have already examined hMSCs responses to BEC stimulation using monolayer culture system and identified signaling factors that were upregulated in response to BEC stimulation in a previous study. 29 In contrast with previous findings focusing on ES effect on osteoblast differentiation of hMSCs, the present study addressed the initial responces of cells after exposure to ES, using the 3D culture method. To provide a 3D environment, we used a porous collagen sponge that allowed hMSCs to adhere only to other cells and the collagen matrix, which is a major component of their natural ECM. In the present study, we compared the cell response to ES, depending on the cell culture method. The results of the present study repeated a similar tendency in the gene expression of VEGF, IGF-1, and BMP-2 from monolayer hMSCs with those of a previous study despite different sources of cells. However, the experimental designs of the present study have some controversial points including surface properties and current amplitude in comparison between monolayer assay and 3D assay.
In terms of surface properties including surface mechanics, composition, and so on, a major difference consists of the conductivity; collagen fiber in the 3D culture is not only nonconductive but also not connected to the electric stimulator, where the gold surface in the monolayer culture is a highly conductive material. However, we hypothesized that the different property of surface materials between monolayer and 3D culture might have limited implications in the present study, because histochemical staining of 3D hMSCs shows that cells have more contact with other cells or ECM rather than collagen fibers, thus indicating that the contact of cells with collagen fibers does not play a critical role during culture after cells attach to collagen fibers in initial seeding. We also hypothesized that conductivity does not play a critical role in gene expression pattern. This hypothesis could be supported by the finding that the lack of CXCR4 gene expression in a monolayer culture was repeated, independent of whether the surface is composed of conductive gold or nonconductive material, indicating that the conductivity of surface material exerts little influence on at least CXCR4 expression. Instead, it might be attributed to the flat adhesion of cells, but the relevance between lack of CXCR4 expression and flat adhesion remained to be solved. In addition, it is still unclear about the possibility whether surface property influences cell response to ES.
Another issue is a biologically effective dose of electric current that cells respond to. Monolayer cultures on gold plates were directly exposed to BEC; current flows over these plate evenly with little loss of current. However, 3D hMSCs on a collagen sponge were exposed to an electric field formed by the flow of current from an upper cathode plate to a lower anode plate. Nevertheless, the cells attached on fibers can sense electric current, because a cross-cellular potential is typically induced by application of an electric field to the conductive surrounding medium. Thus, either monolayer or 3D cells are influenced by the same type of electric current. However, the threshold current required for stimulation of cells depends strongly on the size of the electrode and on the distance between the electrode and the cell. Namely, large distances between the cells and closely spaced electrodes result in cross-talk between neighboring electrodes, and the need for a high-charge density and power for cell stimulation.38,39 This basis is the reason that we investigate the gene expression pattern at a higher magnitude of electric current in 3D assay than the monolayer assay. An in vitro 3D culture exposed to ES is very similar to the in vivo environment exposed to ES in that cells are not stimulated via direct contact of electrodes but with an electric field formed between the cathode and anode. Our data suggest that the biologically effective dose is different in monolayer and 3D culture in the aspect of cell proliferation, as shown in the result at a dose of 1.5 μA/cm2 with proliferative versus little effect in monolayer culture versus 3D cells. Although the increase of cell proliferation in 3D cells was observed at 40 μA/cm2, we investigated the in vitro 3D cell response at 20 μA/cm2, where the positive result was shown in vivo tissue regeneration of peripheral nerve and bone, because it is expected that this magnitude influenced other kinds of effect on tissue regeneration despite little efficiency in cell proliferation. Therefore, the current comparison between monolayer and 3D assay can be reasonable not only because surface property may be a matter of small importance in the present study, but also because both monolayer and 3D cells are influenced by the same type of electric current.
It is a very notable finding that CXCR4 expression is suppressed in monolayerhMSCs, whether it is cultured on conductive, gold-coated surface or a plastic culture plate. However, CXCR4 was abundantly expressed in hMSCs cultured on a 3D collagen matrix. Rapid loss of CXCR4 expression has also been reported during isolation and sub-culturing of mesenchymal stem cells. This receptor is responsible for lymphocyte and hematopoietic stem cell homing. Interestingly, culturing of hMSCs as 3D aggregates (hMSC spheroids) restored CXCR4 functional expression.26,40 Our results showed a similar tendency in CXCR4 expression pattern; CXCR4 expression was lost during monolayer expansion but was restored by 3D culture on a collagen sponge, even without any mechanical stimulation and even in hMSCs derived from different donors. Another receptor, IL-8RB, was expressed at low levels in both monolayer and 3D hMSCs, thus indicating that these hMSCs would not be able to respond strongly to IL-8, which is known to recruit inflammatory cells such as neutrophils. However, hMSCs probably migrate to IL-8 when they are exposed to ES, because the expression of its receptor, IL-8RB, is increased. ES effect on CXCR4 and IL-8RB mRNA expression was variable, independently of hMSCs source if cells are cultured in monolayer condition, whereas it showed constant trend to up-regulation in 3D cells. Therefore, the present findings provide support for the hypothesis that cells grown in 3D culture in vitro behave similarly to cells in vivo. This highlights the importance of using 3D cell cultures for the accurate estimation of in vivo cell responses to certain stimuli or drugs using the same doses as those applied in vivo. Recent reports about the loss of the chemokine response of ex vivo-expanded hMSCs are of concern in stem cell therapy for tissue regeneration because of the impaired homing ability of the hMSCs.26,40,41 However, hMSCs ex vivo-expanded on a monolayer culture may have a substantial therapeutic role if they are well placed within the ECM in vivo, because CXCR4 expression can be restored by culture in a 3D matrix. Further study is required for the signaling mechanism or differentiation potentials related with CXCR4 expression of hMSCs which shows that a culture is method dependent, contrary to the in vitro results.
To investigate the effects of ES on tissue regeneration, we focused in particular on the chemoattractive role of BEC, because chemokine expression plays a critical role in tissue regeneration by inducing the recruitment of other cells such as MSCs or endothelial cells from neighboring microenvironments. 42 Once a tissue is damaged, chemokines are secreted and function to recruit cells from the environment to the injury site. The chemotactic response (migration of cells) is mediated by chemokine receptors and their ligands. We examined the expression patterns of the chemokines SDF-1, CXCL2, and IL-8, and their corresponding receptors (CXCR4 for SDF-1, CXCL2 and IL-8RB for IL-8) in response to BEC. CXCR4 and its ligand, SDF-1, are believed to be key players in the colonization of the bone marrow by hematopoietic stem cells. 43 The interaction between SDF-1 and CXCR4 mediates chemotaxis of endothelial and neuronal cells, and homing of transplanted rat MSCs to the site of injury.40,44 IL-8 and CXCL2 recruit neutrophils,45,46 which play a critical role in acute inflammation together with monocytes and macrophages by removing necrotic tissue or cellular debris and releasing cytokines to modulate chemotaxis. 47 Neutrophils have been reported to contribute to both inflammation and healing in muscle regeneration by removing tissue debris from the injured area and activating satellite cells.47,48 Our results showed that ES did not affect the expression of SDF-1 but increased the expression levels of the chemokines, IL-8 and CXCL2, and the chemokine receptors, CXCR4 and IL-8RB. IL-8 is a potent mitogenic, motogenic, and chemotactic chemokine, and a strong inducer of angiogenesis. 49 Moreover, IL-8/CXCL8 has been reported to recruit human MSCs. 50 Although the in vivo microenvironment is more complex than the in vitro 3D culture, because of the interactions of diverse cell types in the in vivo microenvironment, we hypothesize that IL-8 and CXCL2 act in an autocrine and paracrine manner near and within the area exposed to ES. A possible target of these cytokines would be MSCs, endothelial cells, or inflammatory cells that express CXCR4 or IL-8RB. The ES-induced transient increases in IL-8 and IL-8RB levels may promote rapid vascularization, which would accelerate the regeneration process. IL-8 and CXCL2-induced recruitment of cells might play a vital role in the initial stage of the tissue healing process, and accelerate subsequent cellular events. 46 This effect would probably increase cell populations in vivo even though ES did not increase the proliferation of 3D hMSCs in our study. However, it has also been reported that elevated IL-8 levels are correlated with a poor prognosis, malignant melanoma, 51 lymphoma, 52 and joint inflammatory disease, 53 and that CXCL2 induces osteoclast differentiation. 54 In other words, these cytokines have conflicting functions in cells, depending on the microenvironment and their cellular concentrations. Despite the reports that IL-8 is a marker of severe inflammation, the BEC-induced increase in IL-8 may not result in undesirable effects under in vivo conditions; little inflammation was observed in tissues exposed to BEC for 1 or 4 weeks in our previous animal studies.13,14
External stimuli can trigger the release of growth factors/cytokines from various cells to promote tissue regeneration. Growth factors or cytokines promote cell survival and proliferation of stem/progenitor cells residing in the damaged tissue, and stimulate the survival and regeneration of differentiated cells.55,56 BEC stimulation increased the expression of several growth factors and chemokines in hMSCs, which was more efficient and stable in 3D hMSCs, because the 3D culture method showed a higher expression including IGF-1, CXCR4, or IL-8RB than the monolayer method. Whether the different modes of cell adhesion between monolayer and 3D cultures modified the effects of ES is unclear. However, based on the report that cell-3D matrix interactions result in enhanced cell biological activity relative to cell-two dimensional (2D) matrix interactions, the signaling pathways activated by ES are probably dependent on the cell adhesion characteristics of 3D culture. 27 We showed in a previous study that the BEC-mediated increase in proliferation and VEGF release from hMSCs involved the activation of mitogen-activated protein kinase (MAPK) (Erk and p38) and calcium channels. 29 There is also evidence to suggest a link between calcium influx and the MAPK pathway via growth factor receptor signal transduction; calcium influx is thought to induce tyrosine phosphorylation of EGFRs to levels that can activate the MAPK signaling pathway. 57 Accumulated studies have demonstrated that integrins link cell adhesion to ECM with intracellular signaling via MAPKs pathways or other mediators, thus resulting in altering gene expression. 58 Our present findings indicate that BEC-mediated signaling pathways related to cytokine expression may be activated more efficiently in cells cultured in a 3D environment because of increased cell-to-cell and/or cell-to-ECM interactions compared with cells grown in monolayers.
In conclusion, we cultured hMSCs in a 3D in vitro culture environment and investigated the molecular mechanisms underlying the in vivo regenerating effects of BEC by assessing chemokine/growth factor expression by 3D hMSCs. We found that BEC stimulation enhanced the expression of the chemokines IL-8 and CXCL2, and their receptors CXCR4 and IL-8RB, respectively, as well as several kinds of growth factors, all of which are known to locally and systematically accelerate tissue formation. The hMSCs grown on a collagen sponge had different characteristics to monolayer hMSCs. These characteristics included CXCR4 expression, which was remarkably suppressed during 2D expansion of hMSCs, and enhanced expression of chemokines and growth factors. Local, temporal BEC stimulation of cells and tissues can improve the microenvironment, and thereby promote healing by endogenous cells. Our findings suggest that investigations using 3D cell cultures in preanimal experiments may provide greater insight into the potential effects of external stimuli in in vivo animal experiments.
Footnotes
Acknowledgments
This research was supported by a grant from the Basic Science Research Program through the National Research Foundation of Korea funded by the Ministry of Education, Science, and Technology (2011-0003649).
Disclosure Statement
The authors confirm that there are no known conflicts of interest associated with this publication, and there has been no significant financial support for this work that could have influenced its outcome.
References
Supplementary Material
Please find the following supplemental material available below.
For Open Access articles published under a Creative Commons License, all supplemental material carries the same license as the article it is associated with.
For non-Open Access articles published, all supplemental material carries a non-exclusive license, and permission requests for re-use of supplemental material or any part of supplemental material shall be sent directly to the copyright owner as specified in the copyright notice associated with the article.