
Abstract
Objectives:
Human adipose-derived stem cells (ASCs) show gene expression of chondrogenic markers after three-dimensional cultivation. However, hypertrophy and osteogenic transdifferentiation are still limiting clinical applications. The aim of this study was to investigate the impact of small GTPases (Rac1 and RhoA) on transforming growth factor (TGF)-β1-mediated chondrogenic differentiation of ASCs and compare it with BMP-2-induced hypertrophy, by assessing effects on intracellular and extracellular matrix.
Methods:
In a novel experimental approach we characterized differentiation of living stem cells by single-cell elasticity measurements using atomic force microscopy. Results were matched with single-cell size measurements (diameter and volume) and quantitative real time-polymerase chain reaction for osteogenic and hypertrophic (alkaline phosphatase [ALP], collagen type X) as well as chondrogenic (collagen type II) gene expression. Intracellular F-actin expression was visualized by phalloidin staining of alginate-embedded ASCs. Statistical analysis was performed using analysis of variance (ANOVA) and two-sided t-test.
Results:
Nontreated two-dimensional cultured ASCs (2D ASC) showed a significantly lower deformability than chondrocytes (Young's modulus: 294.4 vs. 225.1 Pa; ANOVA: p<0.001). Standard chondrogenic stimulation decreased stem cell elasticity to chondrocyte values (221.7 Pa). All other chondrogenic differentiated ASCs presented intermediate elasticity (BMP-2 stimulation: 269.1 Pa; Rac1 inhibition: 279.8 Pa; RhoA inhibtition: 257.8 Pa; p<0.05 compared to 2D ASC). F-actin fluorescence was visually decreased in Rac1-inhibited cells and increased in BMP-2-stimulated cells. Cell volume of 2D ASCs (6382.3 fL; p<0.001) was significantly higher than in all stimulated samples (BMP-2: 3076.7 fL; RhoA inhibition: 3126.0 fL). Volume of stem cells after standard chondrogenic stimulation (2590.0 fL) was not significantly different from chondrocyte volume (2244.9 fL). Rac1-Inhibitor reduced stem cell volume significantly below chondrocyte volume (1781.1 fL). Regarding mRNA expression, Rac1-Inhibitor reduced late hypertrophic transdifferentiation (collagen type X), while collagen type II production slightly increased (p<0.05). RhoA-Inhibitor increased osteogenesis (ALP) and slightly decreased collagen type II production (p<0.05).
Conclusion:
Biologically relevant nanomechanical parameters contribute to the evaluation of stem cell differentiation, in view of increased deformability of stem cells after chondrogenic stimulation. Regarding gene expression, Rac1 inhibition reduced hypertrophic chondrogenic differentiation and RhoA inhibition increased osteogenic transdifferentiation. Thus, the control of small GTPases is promising for cartilage tissue engineering purposes of stem cells.
Introduction
With respect to chondrogenic differentiation, extracellular matrix and intracellular cytoskeleton organization are of extraordinary importance; hence, both reflect differentiation grade and hypertrophy.6,7 Main regulators are small GTPases, 8 which impact cell size and shape. 9 Small GTPases are involved in signal transduction pathways and gene expression, as well as cell cycle progression, including apoptosis, proliferation, and differentiation. 10 RhoA and Rac1 are among the most characterized GTPases.11,12 Recent studies revealed evidence that both factors seem to play a particular role in chondrocyte differentiation. They are known to either suppress (RhoA 13 ) or induce (Rac/Cdc42 14 ) chondrocyte hypertrophy, although the detailed effect is not entirely understood. Knowledge of their role in adult stem cell differentiation in vivo and in vitro is still limited.
In the context of biomechanics of joint and cartilage functioning, nanomechanical properties during chondrogenic stem cell differentiation are essential. Differences between stem cells, chondrocytes, and osteocytes, as well as direction of cell lineage specification by matrix elasticity, have previously been detected and described for example by Discher et al. and other groups.15–17 In this study, the nanotechnique atomic force microscopy (AFM) has been used to determine cellular elasticity instead of matrix elasticity. Elasticity is representing an important biophysical marker for the resistance of a material to deformation.18,19 AFM allows to image surfaces of cells at nanometer resolutions.20,21 In contrast to stiffness, elasticity (elastic modulus) is used to describe materials, if the relationship between stress and strain (the amount of deformation) is linear and the deformation of a constituent material is completely reversible. The elastic modulus is an intensive property and therefore independent of size, shape, mass and boundary conditions of the material. 22 Increasing elasticity (roughly equivalent to a decreasing deformability) for chondrocytes derived from osteoarthritic joints as well as for increasing culture periods of bovine chondrocytes was described previously, which demonstrates the important functional role of this parameter.23,24
Purpose of this study was to evaluate the differentiation grade of three-dimensional (3D) cultured ASCs by their elasticity. Results were matched with fluorescence staining of intracellular matrix component F-actin, single-cell diameter (μm), cell volume (fL), as well as with chondrogenic, hypertrophic, and osteogenic extracellular matrix mRNA production. We hypothesize that small GTPases have an impact on transforming growth factor (TGF)-β1- and BMP-2-mediated hypertrophic transdifferentiation of ASCs.
Materials and Methods
Isolation of ASCs
Human adipose-derived stem cells (ASCs) were isolated from subcutaneous adipose tissue, obtained from abdominoplastic surgery (n=4; n=2 male, n=2 female; mean age of donors: 49 years [SD:±6]). Cells were isolated and cultured as previously described according to standard protocol for adipose stem cell isolation.25,26 Briefly, under sterile conditions, fat tissue was cut into small pieces; washed with phosphate buffered saline (PBS w/o Ca2+/Mg2+; Biochrom AG); digested with collagenase type II (Biochrom AG; 1016 U/mL diluted in the culture medium containing 10% fetal bovine serum [FCS; Biochrom AG] and 1% penicillin/streptomycin [p/s; Invitrogen™]) at 37°C under continuous shaking for 60 min; and then washed, centrifuged, and separated. Adipocytes, collagenase, and the medium were separated from the stromal cell fraction. Cells were counted using Casy cell counter (Casy 1; Model TT Cell counter, Schärfe-System GmbH) and seeded at a density of 4000 cells/cm2 in tissue culture flasks (225 cm2; Costar; Corning Incorporated). The expansion medium, as well as the control medium for two-dimensional (2D) cultured ASCs, was Dulbecco's modified Eagle's medium/F12+GlutaMAX™-I (Gibco, Invitrogen), containing fetal calf serum (FCS) 10% and P/S 1%. The medium was exchanged completely every second day. ASCs were incubated at 37°C, 5% CO2, and 95% air humidity. Once adherent cells had grown to confluence, cells were trypsinated (5% trypsin-ethylenediaminetetraacetic acid [EDTA], Gibco, Invitrogen) for passaging. ASCs were used for the following experiments in passage 4. The four donor-cell-groups were pooled each time before performing the experiments. 27
Characterization of ASCs
ASCs were detached with trypsin-EDTA, after twice reaching confluence. They were washed with PBS and stained with fluorescent antibodies. Antibodies were against human CD34, CD45, CD73 (Becton Dickinson), CD90, and CD105 (PharMingen) and corresponding isotype controls for flow cytometric analysis.
Isolation of chondrocytes
Chondrocytes were harvested from femoral heads obtained from healthy donors who underwent joint replacing hip surgery after medial femoral neck fracture. Degree of osteoarthritis was evaluated on plain hip radiographs by using Kellgren and Lawrence (KL) grading system. Specimens presenting osteoarthritis grade II or more according to KL were excluded (n=4 [2 men, 2 women]; mean age of donors: 68 years [SD:±4]). Femoral heads were kept buffered at 48°C. Within 8 h postsurgery, cartilage was minced into small pieces and digested with collagenase type II at 37°C under continuous shaking for 16 h. Cells were filtered, washed, and seeded at a density of 4000 cells/cm2 in tissue culture flasks. Expansion and differentiation media used for chondrocytes (=positive control; group 6) was Ham's F-12 medium containing 10% FCS and 1% P/S. The medium was exchanged every second day. Cells were incubated at 37°C, 5% CO2, and 95% air humidity. Chondrocytes were used for the following experiments in passage 2. For each experiment, the four different donor-cell groups were pooled.
Alginate bead culture system
ASCs and chondrocytes were removed with trypsin-EDTA and suspended in 1.2% alginate (Sigma) at a concentration of 2×10⁶ cells/mL. Using a 21G needle with a 10-mL syringe spherical alginate beads were created by dropping alginate cell suspension from the tip into a bath of either BaCl2 (102 mM) for fluorescence imaging (Histology) or CaCl2 (102 mM) for every other experiment. After several washing steps with PBS, beads were incubated in a different culture medium. Alginate beads were cultured for 14 days at 37°C, 5% CO2, and 95% air humidity under different stimulation conditions (see below). The standard differentiation medium for stem cells was high-glucose Dulbecco's modified Eagle's medium (Gibco, Invitrogen) containing sodium pyruvate (100 mg/L),
Group 1 consisted of untreated, 2D cultured ASCs (negative control), cultured in expansion medium. All other groups were cultured in 3D alginate beads. Group 2 (standard chondrogenic stimulation) was treated with the standard differentiation medium. Group 3 was treated with the standard differentiation medium and with BMP-2 (50 ng/mL; Recombinant Human BMP-2; R&D Systems). Group 4 was treated with the standard differentiation medium and with Rac1-Inhibitor (50 μg/mL; InSolution™; Calbiochem; Merck KGaA). 28 Group 5 was treated with the standard differentiation medium and with RhoA-Inhibitor. Group 6 was represented by chondrocytes (positive control) and was cultured in Ham's F-12 medium containing 10% FCS and 1% P/S. RhoA-Inhibitor consisted of C3 fusion toxin (Clostridium botulinum C3 ADP-Ribosyltransferase; 50 ng/mL) combined with binding/transport component C2II of the C. botulinum C2 toxin (100 ng/mL). In this construct, the C2II protein acts as a pore forming protein, which increases the efficient transmembraneus transport of the C3 protein to the intracellular compartment.29,30 The effectiveness with inhibition of RhoA by this exact construct has previously been shown. 31
During the experiment, the medium including all factors/inhibitors as described was exchanged completely every second day. After 14 days in culture cells were isolated. Three-dimensional cultured cells were erased from alginate using a digestion buffer containing 150 mM NaCl, 55 mM Sodium Citrate, 2 mM
Atomic force microscopy
Cells were seeded on plastic cover slips (Science Services; diameter 15 mm; 30,000 cells per cm2) and cultured for 48 h under identical culture conditions as before, since slight attachment was necessary for single-cell AFM measurements. Care was taken to confirm that differentiated cells maintained their spheric/round shape and stem cells their spindle-cell like shape directly before performing elasticity measurements by light microscopy and additionally by AFM surface imaging on a nanometer level. The elasticity of living cells of six differently stimulated groups (each n=4 experiments; n=4 donors; amount of cells measured for each group as mentioned in the Results section) was determined using the nano-indentation technique as described before.32–34 Basically, in this technique, the AFM tip is pressed against the cell surface and the force needed to indent for a certain depth is measured, resulting in force versus indentation curves (Fig. 1). Measurements were performed with a Multimode-AFM equipped with a Nanoscope IIIa controller (Veeco Instruments). All measurements were carried out in 2-(4-(2-hydroxyethyl-1-piperazine-ethanesulfonic acid (HEPES) buffer using a fluid cell at 37°C (MMFHTR-2 Air and Fluid Sample Heater; Veeco Instruments). Colloidal probe cantilevers with a sphere radius of 5 μm were used for this work (PT.PS; Novascan Technologies). Cantilevers were calibrated with a Nanoscope V controller (Veeco Instruments) by measuring the thermally induced motion of the unloaded cantilever. Spring constant of cantilevers used in this study was 0.019 N/m. Before the measurements, we calibrated the cantilever deflection sensitivity on a bare plastic coverslip immersed in buffer solution. Probes were placed under optical control (OMV-PAL, Veeco Instruments) over the center of the cells. Cells were indented with a maximum loading force of 2 nN. The approach velocity was limited at 1 μm/s since larger velocities result in artificially high elasticity. 35 Force–indentation curves were processed using a linear implementation of the Hertz-Model, 19 which allows to calculate Young's modulus (measured in Pa). For each cell, elasticity was measured once, and the first 200 nm of the resulting curve was used for elasticity analysis. AFM data were processed using Nanoscope v5.13 software (Veeco Instruments) and analyzed with the Protein Unfolding and Nano-Indentation Analysis Software (PUNIAS; http://punias.voila.net/punias11.htm).

Nanomechanical elasticity measured by atomic force microscopy (AFM). Single-cell elasticity measurements are demonstrated for a less deformable cell (upper curve; e.g., stem cells) and a deformable cell (lower curve; e.g., chondrocytes). The AFM tip approaches the cell surface, which is intended depending on the elasticity of the cell. The cantilever is deflected and reflection of the laser beam (e.g., positions A–D) results in a typical force versus deformation curve. Exemplarily 4 steps (1–4) are demonstrated.
Cell diameter and volume
Cell quantity of samples of six differently stimulated groups (each n=4 donors, n=4 experiments) was counted using Casy cell counter (Casy 1; Model TT Cell counter, Schärfe-System GmbH; mean amount of cells: n=5443.9 [SD:±352.6]) and mean single-cell diameter (μm) and mean single-cell volume (femtoliter (fL)=10−15 L=10−18 m3). Using this technology, parameters were determined only of living cells. By applying a low-voltage electric field and scanning each cell with a high frequency several times, area analysis accounted for cell volume and size measurements.
RNA isolation and quantification
Trizol reagent was used according to the manufacturers' instructions (Invitrogen Life Technologies). After reaction with amylalcohol-chloroform, isolated RNA phase precipitated with isopropyl alcohol. The cell pallet was washed with 75% ethanol and then resuspended in DEPC-H2O. Total mRNA concentration was assessed with ND-1000 spectrophotometer (Nano drop, D-Erlangen).
Quantitative real-time polymerase chain reaction
For real-time-polymerase chain reaction (PCR), four experiments (n=9 samples; n=4 donors) were performed at different time points. Two micrograms of total mRNA was treated with 1 U deoxyribonuclease I (DNase I; Invitrogen Life Technologies). One microgram of total mRNA was used as negative control and 1 μg was treated with cDNA synthesis kit (Stratagene; Affinity Script™ Multi Temperature) according to the manufacturers' instructions. A Random-Primer was used for cDNA synthesis.
TaqMan PCR assays were performed in 96-well optical plates on an ABI Prism 7700 Sequence Detection System (Applied Biosystems) using Absolute QPCR ROX Mix (Abgene) according to the manufacturer's instructions. Assays were run in triplicates for each sample and the mean value was used for analysis. Oligonucleotide primers and TaqMan probes were designed using Primer Express (Applied Biosystems) according to company guidelines—glyceraldehyde-3-phosphate dehydrogenase (GAPDH): forward primer 5′-TGGGCTAC ACTGAGCACCAG-3′, reverse primer 5′-CAGCGTCAAAG GTGGAG GAG-3′, probe 5′-FAM-TCTCCTCTGACTTCAA CAGCGACACCC-TAMRA-3′; ALP: forward primer 5′-ATG CCCTGGAGCTTCAGAAG-3′, reverse primer 5′-TGGTGGA GCTGACCCTTGAG-3′, probe 5′-FAM-CGTGGCTAAGAAT GTCATCATGTTCCTGG-TAMRA-3′; α1-collagen type X (col X): forward primer 5′-TCCTTGAACTTGGTTCATGGAGT-3′, reverse primer 5′-ACTGTGTCTTGGTGTTGGG- TAGTG-3′, probe 5′-FAM-CGCTGAACGATACCAAATGCCCACA-TA MRA-3′; α1-collagen type II (col II): forward primer 5′-GAG ACAGCATGACGCCGAG-3′, reverse primer 5′-GCGGATG CTCTCAATCTGGT-3′, probe 5′-FAM-TGGATGCCACAC TCAAGTCCCTCAAC-TAMRA-3′. Concerning the thermal cycling conditions, activation for 15 min at 95°C was followed by 50 cycles of acquisition mode (95°C for 15 s and 60°C for 50 s) and 10 s of cooling (40°C).
Histology
Alginate beads complexed with BaCl2 were dehydrated before embedding in liquid paraffin. After setting, sections were cut from the blocks (5 μm) using a Leica RM 2165 microtome (Leica Corporation). Cells were permeabilized with 0.2% Triton X-100 and blocked with 3% bovine serum albumin in PBS. F-actin-staining dye (Phalloidin-Alexa Fluor 488; Invitrogen) was applied for 1 h at room temperature. After washing with phosphate buffered saline (PBS), sections were mounted with the Vectashield mounting medium containing 4′,6-diamidino-2-phenylindole (DAPI; VectaShield; Vector Laboratories Inc.). Cells were photomicrographed with a Cool Snap™ HQ Camera (Photometrics) on a Nicon Eclipse TE2000-E microscope (Nikon 60×/1.4 oil Plan-Apochromat; Technical Instruments). Fluorescence data were processed using NIS-Elements AR 2.30 (Nikon Instruments Inc.).
Statistical analysis
Statistical processing was performed with JMP software Version 7 (SAS Institute). Data are shown as mean (±standard deviation [SD]) unless otherwise stated. Bilateral t-test was used for comparison of groups individually as mentioned in the Results section. Additionally, a multivariate regression analysis accounting for the effect of all six groups was performed using one-way analysis of variance (ANOVA). Significance is marked by an asterisk in bar graphs. Results were considered as significant if p-value was smaller than 0.05 (*p<0.05).
Results
AFM elasticity measurements
Multivariate regression analysis (ANOVA) revealed an overall p<0.001 for AFM elasticity measurements. For 2D cultured control stem cells, a Young's modulus of 294.4 Pa (SD:±10.5; p<0.001) was measured, presenting the highest elasticity of all samples. Chondrocytes showed elasticity values of 225.1 Pa (±7.2; p<0.001). Standard chondrogenic stimulation resulted in the largest decrease in elasticity (221.7 Pa±20.8; p=0.003; not significantly different to chondrocytes; t-test p=0.842). All additionally chondrogenic stimulated cells presented mechanical elasticities in between ASCs and chondrocytes (t-test: p<0.05), but were not significantly different to each other (t-test: p>0.05). Young's moduli of 257.8 Pa (±8.4; p=0.980), 279.8 Pa (±8.8; p=0.027), and respective 269.2 Pa (±14.8; p=0.332) was determined for RhoA-inhibited, Rac1-inhibited, and respective BMP-2-stimulated stem cells (Fig. 2).
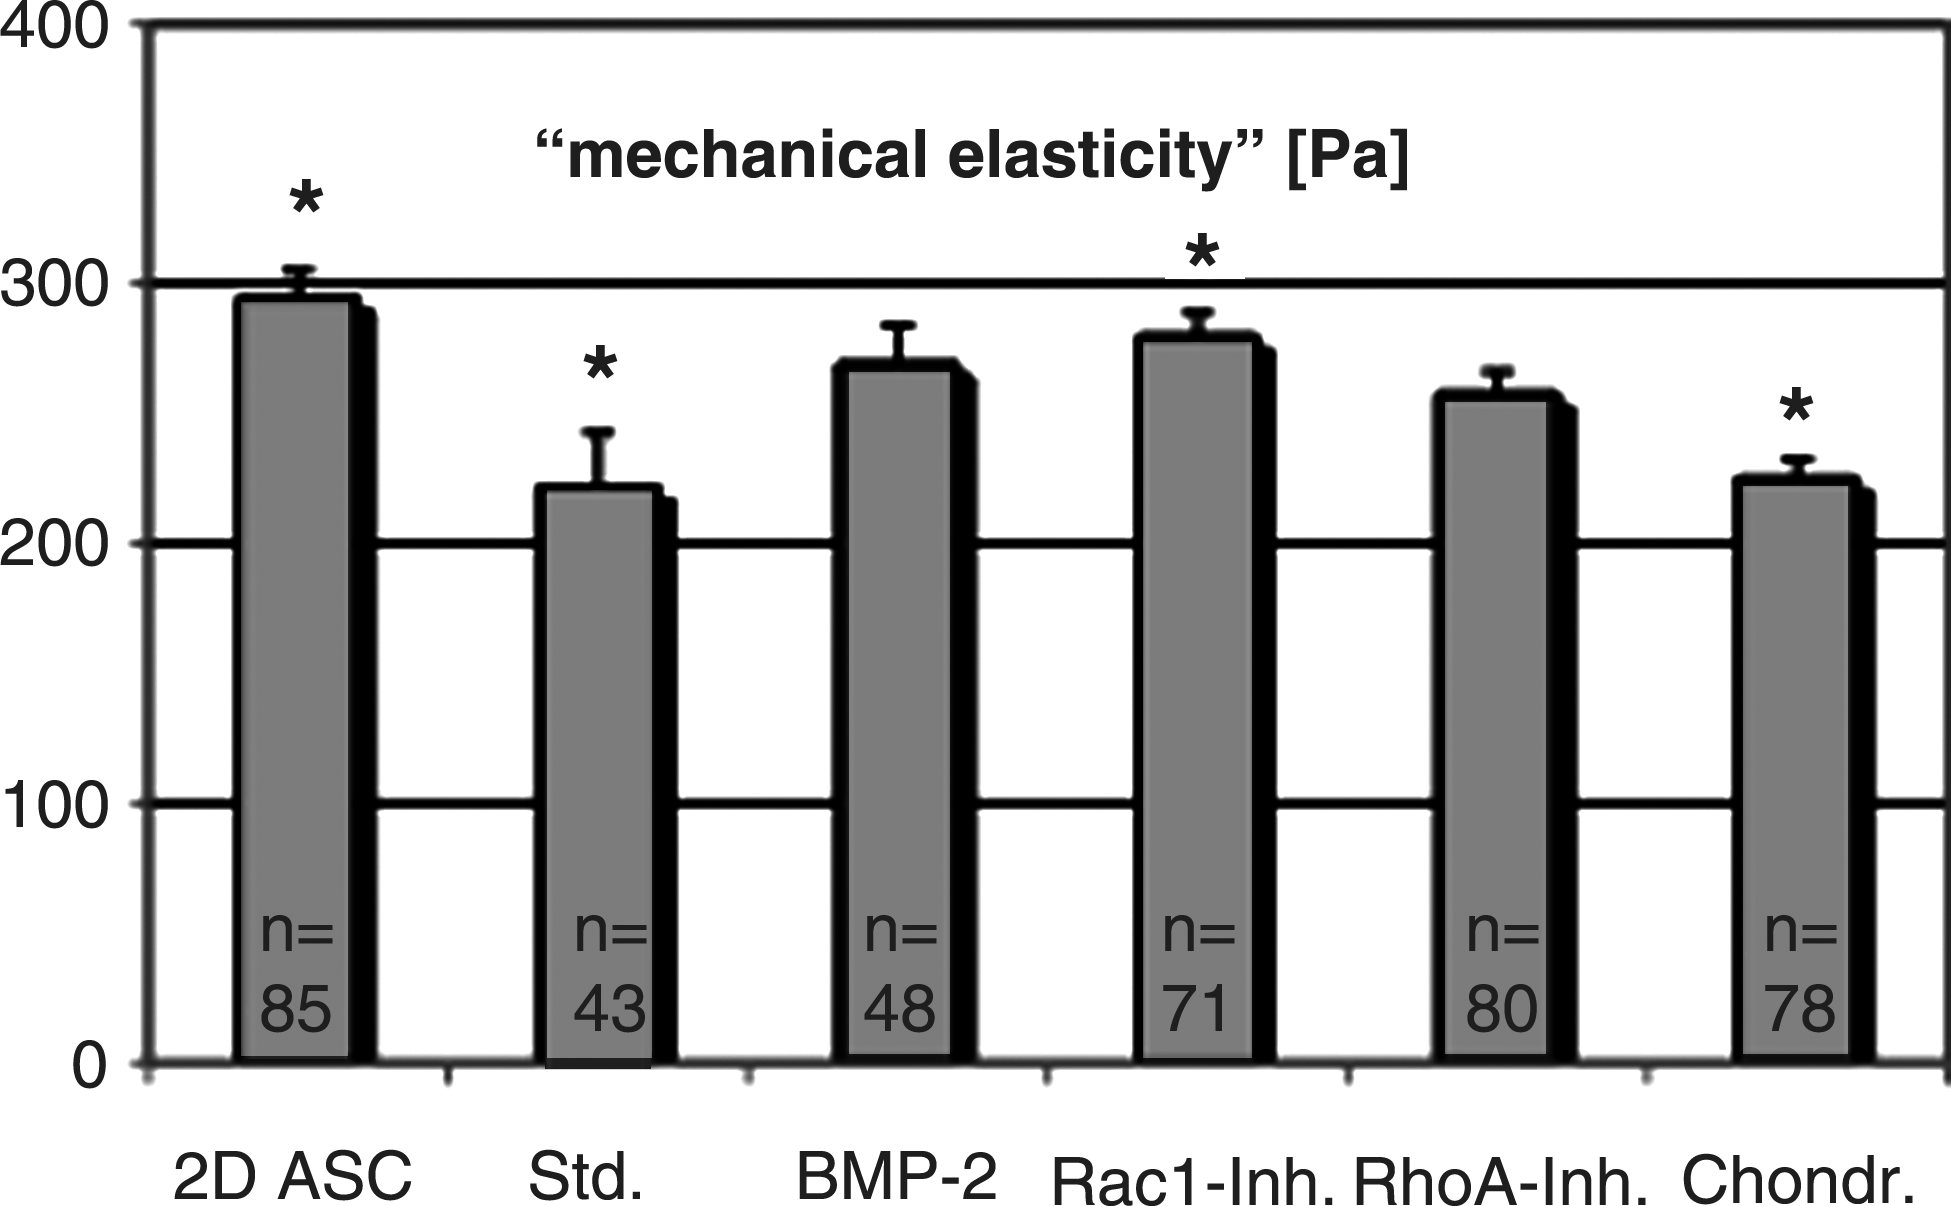
Elasticity of living chondrogenic differentiated adipose-derived stem cells (ASCs), measured by AFM. Elasticity of (1) two-dimensional (2D) grown ASCs (n=85) is compared to 3D cultured ASCs exposed to (2) the standard chondrogenic stimulation medium (n=43), or additionally (3) BMP-2 (50 ng/mL; n=48), (4) Rac1-Inhibitor (Rac1-Inh.; 50 μg/mL; n=71), or (5) RhoA-Inhibitor (RhoA-Inh.; C2IIa 100 ng/mL; C3 fusion toxin 50 ng/mL; n=80), as well as to (6) chondrocytes (chondr.; n=78). Results are given as Young's modulus (Pa). Mean values±standard deviation (SD) are shown. Asterisks indicate statistically significant differences according to the multivariate regression model (*p[ANOVA]<0.05). All results were significantly different compared to group (1) (p<0.05). The number of analyzed individual cells (n) is shown in the bars.
Cell diameter and cell volume
ANOVA revealed an overall p-value<0.001 for both diameter and volume (Fig. 3). Chondrocytes (diameter: 15.4 μm±0.6; p<0.001) were significantly smaller in diameter than ASCs (21.8 μm±0.2; p<0.001) and all stimulated cells were significantly smaller than ASCs (p<0.05). Standard chondrogenic stimulation (15.7 μm±1.1; p<0.001) decreased cell size to chondrocyte diameter. These two groups were not significantly different (t-test: p=0.312). Rac1-Inhibitor reduced stem cell diameter significantly below chondrocyte size (14.2 μm±0.2; p<0.001). Addition of BMP-2 (16.9 μm±0.3; p=0.990) and RhoA-Inhibitor (17.1 μm±0.1; p=0.494) resulted in significant larger cells compared to chondrocytes (t-test: p<0.05). BMP-2 addition and RhoA inhibition were not significantly different (t-test: p=0.669; Fig. 3).

Cell diameter (μm) and cell volume (fL) of chondrogenic stimulated ASCs. Two-dimensional grown, nontreated ASCs (2D ASC) (1) were compared with three-dimensional cultured ASCs stimulated with (2) the standard chondrogenic stimulation medium (Std.), or additionally (3) BMP-2 (50 ng/mL), (4) Rac1-Inhibitor (Rac1-Inh.; 50 μg/mL), or (5) RhoA-Inhibitor (RhoA-Inh.; C2IIa 100 ng/mL; C3 fusion toxin 50 ng/mL), as well as to (6) chondrocytes (chondr.). Asterisks indicate statistically significant differences according to the multivariate regression model (*p[ANOVA]<0.05).
Single-cell volume changed in an assimilable manner to cell diameter. Cell volume of nontreated ASC (6382.3 fL±176.3; p<0.001) was significantly reduced in all 3D cultured samples. Standard chondrogenic stimulation significantly reduced single-cell volume to 2590.0 fL (±437.1; p<0.001), addition of BMP-2 to 3076.7 fL (±107.1; p=0.228) and RhoA-Inhibitor to 3126.0 fL (±132.6; p=0.375). Rac1-Inhibitor reduced stem cell volume significantly below chondrocyte volume (1781.1 fL [± 205.7; p<0.001] vs. 2244.9 fL [± 333.7; p<0.001]).
Quantitative real time PCR
Gene expression (mRNA) of extracellular matrix molecules α1-collagen type II (col II), α1-collagen type X (col X), and ALP was analyzed (n=4 donors; n=9 samples). Data were assessed using the relative standard curve method, each sample being normalized to the housekeeping gene GAPDH. Data are expressed as arbitrary units and relative values compared to negative control (p[ANOVA] overall for each gene p<0.001; Fig. 4).

Quantitative real-time polymerase chain reaction (PCR). mRNA expression of three-dimensional cultured ASCs treated with (2) the standard chondrogenic stimulation medium (Std.), or additionally (3) BMP-2 (50 ng/mL), or (4) Rac1-Inhibitor (Rac1-Inh.; 50 μg/mL), or (5) RhoA-Inhibitor (RhoA-Inh.; C2IIa 100 ng/mL; C3 fusion toxin 50 ng/mL) as well as mRNA expression of (6) chondrocytes. Results are given as relative values compared to (1) 2D cultured, nontreated ASCs. Gene expression levels of collagen type II, collagen type X, and alkaline phosphatase using quantitative real-time (RT)-PCR were ascertained relative to gene expression of the housekeeping gene GAPDH. Asterisks indicate statistically significant differences according to the multivariate regression model (*p[ANOVA]<0.05).
ALP expression was significantly higher in the BMP-2 group with 16.6 (SD:±2.2) than in all other groups (p=0.002). The value of 1.4 (±0.2) in the RhoA-Inhibitor group was also significantly different to all other values (p=0.002). The standard chondrogenic differentiation group (0.6±0.1; p=0.372) and the Rac1-Inhibitor group (0.5±0.2; p=0.129) induced presented a comparable (nonsignificant different) ALP gene expression to chondrocytes (0.7±0.1; p=0.327).
Col X was significantly increased by BMP-2 stimulation (1725.0±275.7; p<0.001) and enhanced by the standard chondrogenic stimulation (831.3±116.0; p=0.001)-induced osteogenic hypertrophy of stem cells. Col X-mRNA expression was still significantly increased after addition of RhoA-Inhibitor (301.7±31.0; p=0.021) compared to chondrocytes (140.8±44.7; p=0.010). Rac1-Inhibitor (59.7±17.4; p<0.003) reduced col X mRNA expression below chondrocyte values.
Gene expression of col II was observed in all treatment groups compared to nontreated ASCs. BMP-2 reached the highest increase in col II mRNA expression (16.9±2.5; p=0.030). Col II expression under standard chondrogenic stimulation (5.8±0.7; p=0.019) was slightly diminished by RhoA inhibition (4.8±1.6; p=0.023) and slightly increased by Rac1 inhibition (6.1±2.5; p=0.021).
Histology
Paraffin-embedded sections of alginate-encapsulated ASCs and chondrocytes were stained for actin (phalloidin) and the nuclei were counterstained with DAPI (Fig. 5A–E). All beads showed a homogenous distribution of cells and consistent size of beads. Compared with standard chondrogenic stimulation, ASCs additionally inhibited for Rac1 as well as chondrocytes demonstrated very few actin content, while ASCs additionally stimulated with BMP-2 contained a higher amount of actin and appeared to be larger.

Discussion
Mesenchymal stem cells are able to differentiate into a chondrogenic phenotype.25,36 Although progress has been made in developing a protocol for differentiation of adult ASCs into chondrogenic gene expressing cells, optimization and identification of influential growth factors to diminish hypertrophic dedifferentiation is still needed. 37 Both extracellular and intracellular matrix constitution and resulting nanomechanical cell properties are essentially implicated in regulation of cell differentiation and were assessed in the present study. The influence of extra- and intracellular matrix regulating GTPases (RhoA and Rac1) and BMP-2 on TGF-β-mediated chondrogenic differentiation of ASCs was analyzed.
Of particular interest recently has been the identification of such biomarkers that can be used to determine specific phenotypic characteristics of stem cells that separate them from primary differentiated cells. Due to the immense relationship between cell shape, cell size, chondrocyte physiology, and chondrocyte differentiation, 38 it was a challenge to discover biomechanical changes during chondrogenic differentiation of adult stem cells. AFM has become a perfectly suitable method for evaluation of nanomechanical parameters. 39 Different cell types have previously been examined, including endothelial cells, 40 chondrocytes, 41 osteoblasts, and mesenchymal stem cells. Surprisingly little is known about mechanical properties of stem cells during chondrogenic differentiation process in vitro, despite the fact that cellular mechanical properties provide an important marker for the differentiation state of a cell. 42 In this work, for the first time elasticity measurements have been applied on differently stimulated ASCs after 3D culture in alginate beads. Initially, comparing the two cell types, ASCs and chondrocytes, a significant difference has been identified. Confirming that stem cells initially show a very high elasticity, 15 we showed that stem cells have a higher elastic modulus than chondrocytes. This might be due to the typical spindle-cell-like shape, which favors a stiffer cell surface compared with chondrocytes, which appear smaller and round, with minimal protrusions. Regarding this nanomechanical cell membrane parameter, we further performed AFM single-cell elasticity measurements to determine the grade of chondrogenic differentiation of stem cells. In our experiments we were able to show that standard chondrogenic stimulation reduced stem cell elasticity to chondrocyte elasticity. All additional stimuli (BMP-2, RhoA-, and Rac1-Inhibitor) developed a similar mechanical elasticity in between untreated ASCs and chondrocytes. Since collagen type X and ALP production was increased by BMP-2, as it has already been shown for MSCs, 43 BMP-2 is known for osteogenic differentiation. Consequently, increase of cell elasticity seems obvious because osteoblasts are stiffer than chondrocytes. 42 Also, both small GTPase inhibitors lead to an increase in elasticity compared to standard chondrogenic stimulation. Reduced cell size of Rac1-inhibited cells could be one of the influencing factors and partly responsible for the reduced softening of stem cells after Rac1 inhibition. Rac1 is known to regulate cytoskeleton and cell shape; inhibition consequently reduced cell size.
In this work, diminished cell diameter and diminished cell volume was verified for all chondrogenic stimulated samples compared to stem cells. Since reflecting the cell cycle status of the stem cells, this indicates a switch from proliferation to differentiation status. Rac1-Inhibition reduced cell size to lower values than standard chondrogenic stimulation, even to lower values than chondrocyte size. Consequently, Rac1-Inhibitor concentration might be adapted in future investigations. A shrinking of the cells correlating with parallel increased elasticity has previously been detected in chondrocytes and endothelial cells.23,44 Despite, other groups reported a weak association between cell membrane and cytoskeleton for mesenchymal stem cells. 45 Also, in this present study, no explicit correlation could be found between cell size and cell elasticity; however, cell shrinking may be responsible for the increase in elasticity of Rac1-inhibited cells compared to standard stimulation. These findings suggest more complex underlying regulation mechanisms of elasticity than correlation with gene expression or actin-myosin activity. Therefore, this underlines the importance of additionally assessing nanomechanical parameters, which substantially complement other observations during stem cell differentiation.
Regarding intracellular changes of actin cytoskeleton, conditions that favor actin skeleton disassembly promote chondrogenesis and those that favor actin assembly inhibit chondrogenesis. 46 Consistent observations have been visualized by fluorescence microscopy in our present study, despite the limitation of using barium-alginate-embedded cells instead of calcium-alginate-embedded cells for feasibility reasons. Rac1 inhibition caused a decrease of actin fibers in terms of increased chondrogenesis, while addition of BMP-2 more likely showed more actin fibers than standard chondrogenic stimulated stem cells.
With respect to extracellular matrix constitution, inhibition of Rac1 led to a reduction of extracellular protein mRNA expression of the hypertrophy marker collagen type X, while chondrogenic differentiation (col II) slightly increased. This is consistent with the observation that Rac1 influences the TGF-β-effector pathway 47 and Rac1 activation inhibits chondrogenesis. 48 These two mediators, Rac1 and TGF-β1, seem to interact not only with each other, but also with RhoA. 49 In C3H10T1/2 murine mesenchymal stem cells, RhoA activation, and actin tension have been found to be negative regulators of both adipogenic and chondrogenic differentiation. Yet, in MSCs RhoA activation has been observed not to change during differentiation to chondrocytes, and in our study RhoA inhibition was identified as osteogenic inductive (ALP overexpression).
In our experiments, measurements were performed in human cells, which may mean an easier progression to clinical applications in the future. By sorting and separating progenitor cells by their nanomechanical properties, the cell extraction could be enriched by potent chondrogenic cells. AFM has been applied in vitro on cover slips, but also on trephine bovine cartilage biopsies 50 and directly on alginate beads, containing chondrocytes. 24 Recently, progress has been made in developing an intraoperatively applicable AFM. 51 This may have an influence on treatment options for osteoarthritis, based on nanomechanical properties of cartilage in situ.
There are several limitations of this study. First, four donor cell groups were pooled, as previously reported,27,52 to account most precisely for inter-individual differences of the donors. However, other groups analyzed each donor cell group separately, 53 arguing that pooling may abolish the possibility of analyzing each donor cell group as one statistical unit. Second, the efficacy of the applied Rac1-Inhibitor was only proven indirectly by the presented results. Last, by dissolving the cells from alginate using EDTA, attachments to their produced extracellular matrix remain. These may influence our results. However, all five groups underwent the 3D culturing procedure and remain comparable. The significant difference to the 2D cultured ASC control for the parameters cell size and elasticity may be underestimated. Since, to our knowledge, we were the first to examine single-cell elasticity by AFM after 3D culture, the comparison of elasticity after different 3D culturing techniques needs further investigations.
In conclusion, biologically relevant morphological and biomechanical factors, including single-cell elasticity measured by AFM, reveal novel cell features and interrelationships, which should be implicated in evaluating chondrogenic differentiation of stem cells. Resuming, samples of chondrogenic differentiated ASCs presented reduced nanomechanical elasticity compared to nontreated stem cells. Standard chondrogenic stimulation reduced elasticity to chondrocyte values. Small GTPases were identified to impact TGF-β1-mediated chondrogenic stem cell differentiation of human ASCs (Fig. 5F): inhibition of Rac1 promoted chondrogenesis and reduced hypertrophy; inhibition of RhoA promoted osteogenic transdifferentiation. Consequently, these observations might have important application in chondrogenic differentiation of stem cells for the purpose of tissue engineering.
Footnotes
Acknowledgments
The authors thank the Department of Plastic and Hand surgery, Freiburg University Hospital, Germany, for performing the abdominoplastic surgeries and the donors of the abdominoplastics. The authors are grateful to M. Wälte (Institute of Physiology II, Münster, Germany) and B. vom Hövel and N. von Podewils (Department of Plastic and Hand surgery, Freiburg, Germany) for excellent technical assistance. We thank Dr. Tracy Richmond McKnight, Ph.D. (Department of Radiology and Biomedical Imaging, University of California, San Francisco, CA), for assistance with fluorescence microscopy.
Disclosure Statement
No competing financial interest exists.