
Abstract
Current hepatocyte models do not mimic the human liver morphology and functions properly and, therefore, drug metabolism, excretion, and toxicity in the liver are inadequately predicted. In this study, we established three-dimensional (3D) hepatic cell cultures in hydrogels of peptide nanofibers. The aim was to establish an improved 3D phenotype of HepG2 cells. In 3D hydrogel cultures, HepG2 cells formed multicellular spheroids that displayed filamentous actin accumulation and large tubular bile canalicular structures indicative of apicobasal cell polarity. Confocal imaging revealed the multidrug resistance-associated protein 2 (MRP2) and the multidrug resistance protein 1 (MDR1) localization on the bile canalicular membrane, and vectorial transport of fluorescent probes into bile canalicular structures. We conclude that 3D HepG2 cultures exhibited structural and functional polarity, suggesting that this model may be useful in drug research. This study shows the potential of 3D peptide nanofiber biomaterials in optimizing the cellular phenotype in organotypic cultures.
Introduction
In the liver, drug elimination by polarized hepatocyte cells is a co-operative action of cytosolic metabolizing enzymes (phase 1 and 2) and membrane transporters with influx and efflux functions. Interspecies differences of drug metabolism and transport impair the clinical predictability of the experiments that use animals and isolated animal cells as models. Therefore, freshly isolated or cryopreserved human primary hepatocytes are preferred in drug metabolism studies, 3 but these cells lose their polarity and related directional functions within few days after isolation. Limited availability and batch-to-batch variations further reduce the usefulness of primary hepatocytes.
Cell lines provide an unlimited cell source that is easy to maintain. HepG2 is the most frequently used liver cell line, but these cells show normally only low expression of the metabolizing CYP450 enzymes (CYPs). Fortunately transporters and CYPs are inducible in HepG2 cells.4–6 HepaRG, another hepatocyte cell line, shows a set of liver-specific functions, such as induction of CYPs. 7 However, HepaRG is a proprietary cell line that is not freely available for the scientific community. Overall, relevant and predictive hepatocyte models are needed for chemical testing and drug discovery.
In the liver, hepatocytes are polarized and their three-dimensional (3D) arrangement includes functionally distinct plasma membrane domains: sinusoidal, lateral, and bile canalicular. The 3D phenotype of hepatocytes develops under the influence of the neighboring cells and extracellular matrix (ECM). Therefore, many cell culture techniques mimicking the in vivo interactions have been established to improve the phenotype of cultured hepatocytes. The methods include coculture with another cell type, 8 culture with ECM, 9 culture with an ECM components like fibronectin, 10 sandwich culture between two collagen layers, 11 culturing in alginate gels, 12 polymer scaffolds,13,14 and peptide hydrogels.15–17
Several approaches have been used to grow hepatocytes in 3D: cell embedding to hydrogel, 15 cell introduction on a scaffold surface,13,14 and cell culturing in a bioreactor.5,12 Several reports indicate that culture environment may alter the expression of drug metabolizing enzymes in HepG2 cells.5,6,14,18 Improved expression of metabolic enzymes in HepG2 has been shown in the bioreactor5,18 and microspace cultures. 6 However, the influence of microenvironment on membrane transporter expression and localization in hepatocytes is poorly understood. Previously, 3D culture of HepG2 cells led to upregulated expression of the multidrug resistance-associated protein 1 (MRP1, ABCC1) in the bioreactor culture system 5 and increased expression of the breast cancer resistance protein (BCRP, ABCG2) in the rotating culture system. 19 Sandwich culturing evoked the localization of P-glycoprotein (multidrug resistance protein 1 [MDR1], ABCB1) and multidrug resistance-associated protein 2 (MRP2, ABCC2) to appropriate hepatocyte domains. 11
We evaluated peptide hydrogels as hepatocyte 3D matrices for hepatocyte culture. The HepG2 cell line was selected, since it is widely used and a well-documented cell line, easy to maintain, and shows inducible CYP450 activity. RAD16-I peptide, with repeating RAD amino acid sequences, self-assembles in a cell culture medium to nanofibers. It is known to maintain differentiated functions of porcine hepatocytes 16 and primary rat hepatocytes, 17 and it promotes differentiation of rat hepatocyte progenitors. 15 In this study, we evaluated the capability of RAD16-I hydrogel to improve liver-specific morphology, polarity, and functions of HepG2 cells. In particular, formation of bile canalicular membranes and canalicular efflux transport were investigated.
Materials and Methods
Cell cultures
A self-assembling peptide hydrogel (RAD16-I, PuraMatrix; BD Biosciences) was investigated as a support material for HepG2 polarization and function. This peptide with repeating RAD amino acid sequence spontaneously assembles into gel when exposed to salt solutions, such as culture media. To achieve the 3D hydrogel cell culture, the subconfluent human hepatoma HepG2 cells were harvested with 0.25% trypsin-EDTA (Gibco) and washed with 10% sucrose solution in phosphate-buffered saline (PBS). After washing the medium salts away, the cells were resuspended in 10% sucrose, and the existing cell clusters were broken down by passing the suspension through a 300-μL pipette tip. The uniform cell suspension and 0.25% peptide solution (1% PuraMatrix™ stock diluted with water and 20% sucrose solution) were mixed in a 1:1 ratio to ensure uniform density. The mixture with 106 cells/mL and 0.125% of peptides was placed on well plates, objective glasses, and 35-mm Petri dishes. The culture medium, consisting of the Dulbecco's modified Eagle's medium with high glucose 4.5 g/L (Gibco), 10% heat inactivated fetal bovine serum (Gibco; inactivation at 56°C for 30 min), 2 mM L-glutamine (Gibco), and penicillin 100 IU/mL streptomycin 100 μg/mL (Gibco), was slowly added starting from the edge of the dish. After the gel formation, the pH was equilibrated by repeated medium renewal following the manufacturer's instructions (PuraMatrix manual). To obtain conventional HepG2 culture for a phenotype comparison, HepG2 cells were placed on well plates, Petri dishes, glass coverslips, and objective glasses. All cell cultures were maintained at 37°C in an atmosphere containing 5% CO2.
Cell viability
Cell viability was determined daily. To inspect membrane integrity, the cells were exposed to 0.4% trypan blue (Gibco) for 5 min (mixing 1:1 volumes) and microscopic images were taken. Viability was investigated also with a resazurin assay (alamarBlue® reagent; Invitrogen). After 4 h exposure to resazurin, the fluorescence in the wells was measured with fluorometer (Varioskan Flash; Thermo Fisher), using excitation at 560 nm, emission at 590 nm, and excitation bandwidth of 5 nm. Viability and proliferation between culturing days were calculated.
Real-time-quantitative polymerase chain reaction
Total RNA was extracted from HepG2 cells using Tri-reagent (Sigma T-9424) according to the manufacturer's instructions. RNA pellets were dissolved in DEPC-treated water (Fermentas), including RNase inhibitor 1 U/μl (RiboLock™; Fermentas), and stored at −75°C. Before reverse transcription, samples were treated with DNase I (DNA™ free treatment; Ambion) according to the manufacturer's instructions. The concentration and purity of RNA were analyzed with a NanoDrop spectrophotometer (ND-1000 V3.7.0; Thermo Scientific). Reverse transcription was performed on 2.5 μg of total RNA using random hexamer primers in a final volume of 20 μL (the Quick Protocol of RevertAid™ H Minus First Strand cDNA Synthesis Kit; Fermentas).
Polymerase chain reaction (PCR) amplification was performed in a reaction mixture containing Power SYBR Green PCR master mix (Applied Biosystems), 40 ng cDNA, and 1.5 pmol of each primer set (Supplementary Table S1; Supplementary Data are available online at www.liebertpub.com/tea) in 15 μL final volume. Most of the primer sequences were designed with Primer3 program 20 and their validity was ensured with Blat. The primers were synthesized by solid-phase phosphoramidite chemistry followed by reversed phase chromatography purification (Oligomer Oy).
The cDNA levels of the various genes were measured in an optical 96-well plate (MicroAmp®; Applied Biosystems) by quantitative PCR (ABI PRISM 7000 sequence detector with 7000 system SDS Software; Applied Biosystems). The PCR program was 50°C for 2 min and 95°C for 10 min, followed by 40 cycles of 15 s at 95°C, and 60 s at 60°C. The specificity of all primers was validated with a melting profile (15 s at 95°C, 20 s at 60°C, and 15 s at 95°C) and with an electrophoresis gel (2% agarose gel 100 V).
Expression of each gene was analyzed with two independent experiments both having three independent cultures, and all these samples were run twice with quantitative real-time (RT)-PCR. The expression level of the studied genes was normalized against the selected reference genes; beta actin and glyceraldehyde 3-phosphate dehydrogenase (GAPDH), and the relative quantification was calculated against the calibrator sample, cDNA from two-dimensional (2D) cell cultures. Nontreated control, as well as the other controls from reverse transcription (reaction without polymerase and reaction without RNA), was present on each PCR plate.
Determination of cell polarity and canalicular proteins localization
In the liver, the canalicular bile secretion of many therapeutic compounds is mediated by ATP-binding cassette (ABC) transporters in canalicular membrane: MDR1, MRP2, bile salt export pump (BSEP), and BCRP. To analyze the location of these proteins, the 2D and 3D cell cultures were fixed in 3% paraformaldehyde (in PBS) for 30 min. After washing with PBS (three times), cells were permeabilized with 0.1% Triton X-100 (in PBS) for 15 min and subsequently incubated with a blocking buffer (10% goat serum, 0.2% bovine serum albumin, and 0.2% Triton X-100 in PBS) for 12 h at 4°C. Next, cells were incubated with a primary antibody, anti-MDR1 (Abcam ab3365; Sigma P7965), anti-MRP2 (Abcam ab3373), anti-BSEP (Abcam ab71793; Sigma HPA019035), or anti-BCRP (Abcam ab3380), in a blocking buffer overnight at 4°C. Cells were washed with the blocking buffer to remove the unbound primary antibody, followed by incubation with a goat anti-mouse or a goat anti-rabbit antibody conjugated with Alexa Fluor 488 (diluted 1:200 in the blocking buffer) for 4 h at room temperature. After washing with PBS (four times), Alexa Fluor 594-labeled phalloidin (Invitrogen A12381; diluted 1:100 or 1:50 in PBS) was introduced to visualize cellular distribution of the filamentous actin (F-actin) cytoskeleton and cell polarity. After the nuclei staining with 1 μg/mL Hoechst 33258 in PBS for an hour at room temperature, the cells were washed and the samples were built on objective glasses with spacers (nro 2 glass), coverslips (nro 0 glass), and Prolong gold antifade reagent (Invitrogen P36934). In control dishes, goat serum was used instead of the primary Abs.
Immunostained samples were analyzed using a Leica TCS SP5 confocal laser scanning system with the Leica DM5000 upright microscope, the HCX APO 63x/1.30 (glycerol) corr CS 21 objective, and the TD 488/561/633 beam splitter. Images were acquired via three channels excited with the laser diode 405 nm/50 mW (to visualize nuclei), the laser OPSL 488 nm/270 mW (to visualize the Alexa 488), and the DPSS 561 nm/20mW (to visualize Alexa 594).
Analysis on functional polarity
Hepatobiliary transport was investigated with fluorescein diacetate, a marker of efflux transport in hepatocytes.21,22 Fluorescein diacetate enters the cells easily and is subsequently hydrolyzed by intracellular esterases to fluorescein, a polar fluorescent metabolite. Then fluorescein, a MRP2 substrate, is actively transported into the canalicular space. In addition, the function of canalicular membrane was monitored by rhodamine 123, a substrate of MDR1 transporter.
The HepG2 cells in hydrogels were exposed to the probe compounds at a final concentration of 10μM. DMSO concentration was 0.1%. Imaging was started either immediately or after an incubation at 37°C. After incubation, the 3D cell cultures were washed with PBS before imaging. The cell nuclei were visualized with a red fluorescent cell-permeable DNA probe Draq5™, 5 μM (Biostatus Limited).
The cells were observed in a serum-free medium or a buffer over 60 min with a Leica TCS SP5 confocal laser scanning system with the Leica DM5000 upright microscope with HCX APO L 63x/0.90 W (water, dipping) objective and an incubator box with an air heater system (Life Imaging Services) or Leica TCS SP2 AOBS with the Leica DM IRE2 inverted microscope with HC PL APO 20x/0,7 CS (air) objective. Images were taken every 2 min from two channels excited with laser OPSL 488 nm/270 mW or argon 488 nm/35 mW (to visualize the metabolite of fluorescein diacetate), and with HeNe 633 nm/12 mW (to visualize the Draq5™). Also the transmitted light was collected.
Image analysis
The confocal images were analyzed with Imaris 6.4 or 7.0 (Bitplane). Separately imaged Hoechst channel was combined to Alexa 488 and Alexa 594 channels, and either slice, section, or surpass images were constructed. Also, animated serial sections were created with same software. No deconvolution was done.
Results
Cell growth and viability
In hydrogels, HepG2 cells exhibited nonexponential growth based on the resazurin metabolism-based assay (data not shown) and observations with a microscope. The cells spontaneously formed spherical aggregates, spheroids, within 3 days of culture (Fig. 1). Spheroids grew in size from day 3 to 7 of culture (Fig. 1). The culture consists of spheroids with diverse sizes, but the average diameter was below 100 μm during the 7 days of culture. In spheroids, most cells had an in vivo-like polyhedral shape (Fig. 2 and Supplementary Video S1). In 2D culture, the HepG2 cells did not form spheroids. Instead, the cells were flat and grew as clusters in a monolayer (Fig. 3).
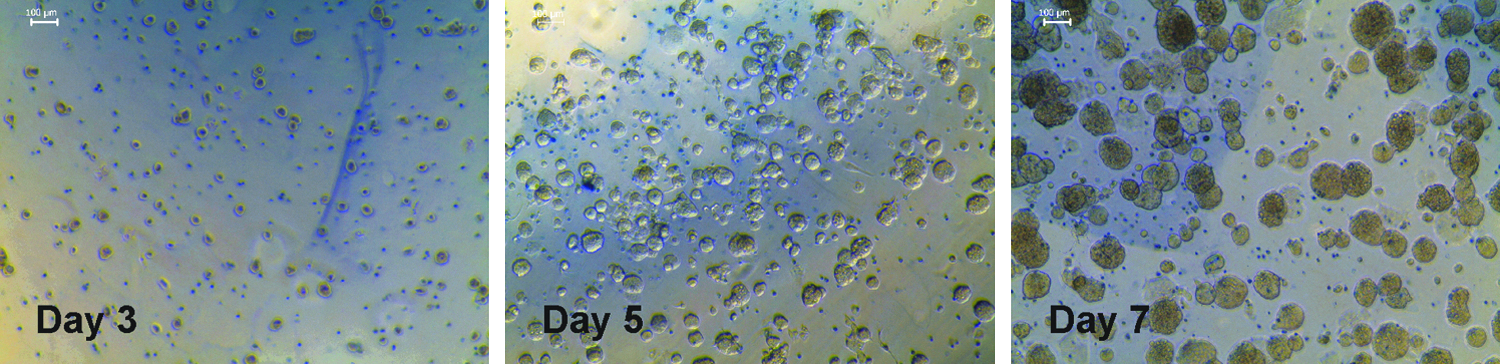
Growth and viability of HepG2 cells in a peptide-hydrogel. HepG2 spontaneously form spherical shape aggregates, spheroids, by culturing day 3. By culturing day 7, the average diameter of spheroid was >50μm. Trypan blue treatment indicated that spheroids consisted of viable cells, but there were also individual dead cells (blue) in the matrix. Scale bars: 100μm. Color images available online at www.liebertpub.com/tea
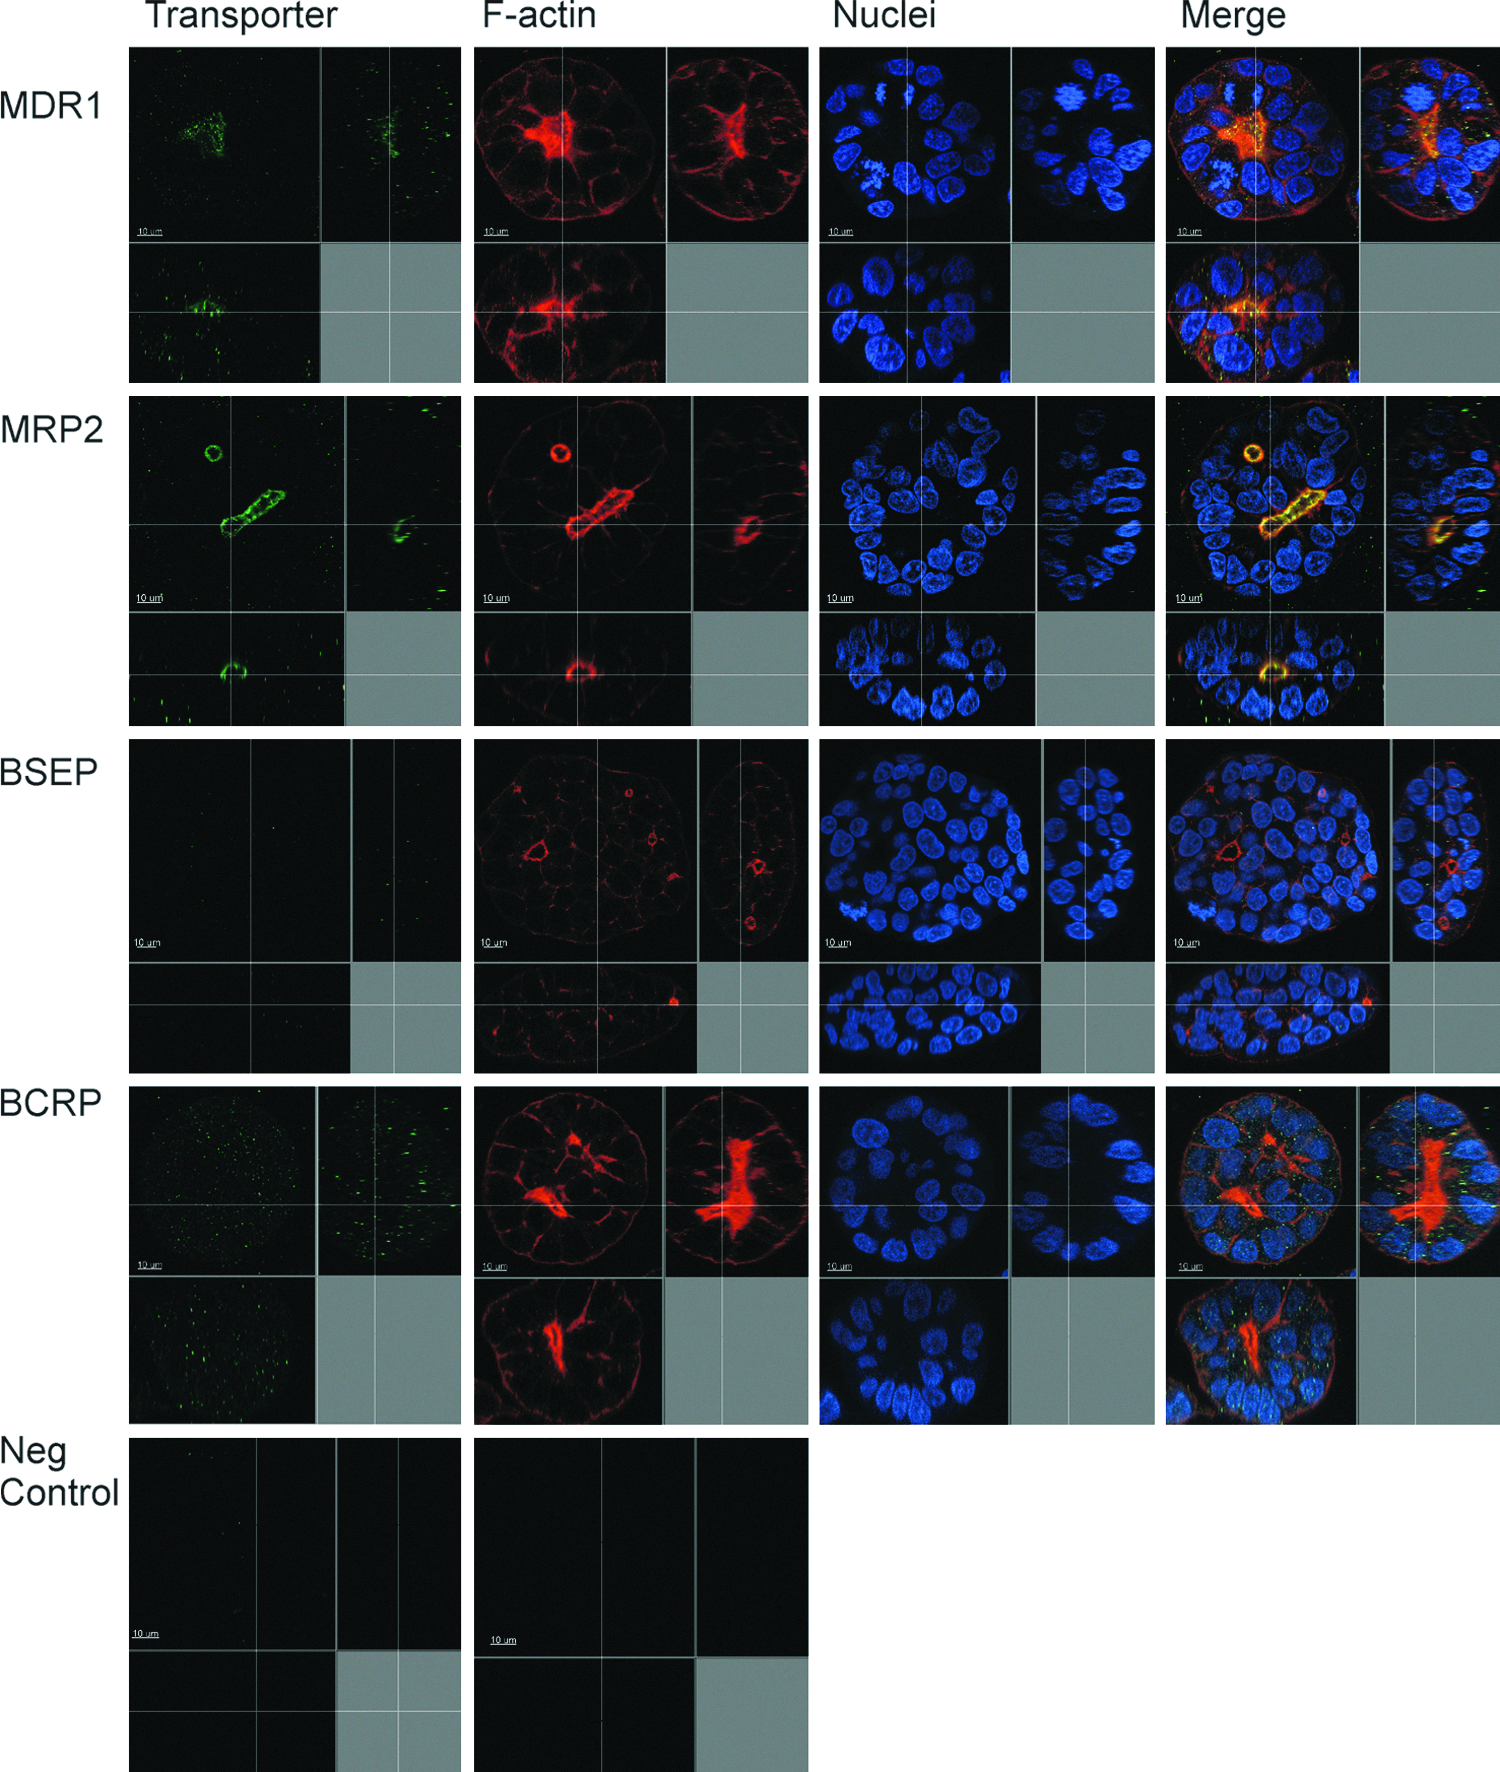
Morphology of representative HepG2 spheroid and localization of hepatobiliary transporters. Cells were cultured in a peptide-hydrogel for 7 days, followed by immunostaining either with anti-MRP2, anti-MDR1, anti-BCRP, or anti-BSEP antibodies (green). Filamental actin and nuclei were visualized with Alexa fluor 594-phalloidin (red) and Hoechst 33258 (blue), respectively. Bile canaliculi are shared by several cells. The MRP2 and MDR1 proteins were localized in the canalicular membrane. Other canalicular transport proteins, BCRP and BSEP, were dislocated. The control staining with a secondary antibody only gave negative signals, both anti-rabbit and anti-mouse antibodies. In the images, you see the horizontal and depth planes of the spheroid. A cross section of the spheroid with an axial depth of 0.2 μm. Scale bar: 10 μm. MDR1, ABCB1, the multidrug resistance protein 1, ATP-binding cassette subfamily B member 1; MRP2, ABCC2, the multidrug resistance-associated protein 2, ATP-binding cassette subfamily C member 2; BCRP, ABCG2, the breast cancer resistance protein, ATP-binding cassette subfamily G member 2; BSEP, ABCB11, the bile salt export pump, ATP-binding cassette sub-family B member 11. Color images available online at www.liebertpub.com/tea

Morphology of HepG2 and localization of hepatobiliary transporters in the conventional 2D culture. Cells were cultured on coverslip for 7 days, followed by immunostaining either with anti-MRP2, anti-MDR1, anti-BCRP, or anti-BSEP antibodies (green). Filamental actin and nuclei were visualized with Alexa fluor 594-phalloidin (red; arrowhead in upper panel) and Hoechst 33258 (blue), respectively. The MRP2 protein was localized in the canalicular membrane also in 2D culture (arrowhead in lower panel). Other naturally canalicular transport proteins were dislocated and the formation of canalicular poles was negligible. A cross section of the spheroid with an axial depth of 0.2 μm. Scale bar: 10 μm. In the images, you see the horizontal and depth planes of the culture. Arrowheads indicate filamental actin and/or MRP2 location in the canalicular membrane. Color images available online at www.liebertpub.com/tea
We investigated the cell viability with trypan blue exclusion (Fig. 1) and resazurin metabolism (data not shown) assays. HepG2 cells in the entire spheroids, also in the cores, were viable during the whole culture time and were not colored by trypan blue (Fig. 1). A few dead cells, trypan blue stainable, were seen in the beginning of the culture, but these cells were not located in the spheroids (Fig. 1).
Expression of metabolizing enzymes, transport proteins, and albumin
The mRNA expression of MDR1, BCRP, MRP2, BSEP, OATP1B1, OATP1B3, CYP 3A4, CYP 2D6, and albumin were compared between the HepG2 cultured in hydrogel and in the conventional culture. Quantitative RT-PCR revealed that the phase I metabolizing enzymes and transporters were expressed at similar levels in 3D and 2D cultures (Supplementary Fig. S1). The expression was maintained at the same level from day 4 to 7 of culture (data not shown). Reference genes, beta actin and GAPDH, were stably expressed during the culture period.
Polarity of HepG2 cells and canalicular lumen formation
Polarity of the hepatocytes is needed for proper hepatic functions. Therefore, we investigated the location and accumulation of F-actin in HepG2 spheroids. Within 2D and 3D cultured HepG2 cells, F-actin was stained along the plasma membrane illustrating cell cytoskeleton and shape.
The spheroids were polarized as evidenced by spherical and tubular lumens surrounded by F-actin expressing canalicular membranes (Fig. 2). The F-actin-enriched lumen structures were centrally located in the spheroids (Fig. 2 and Supplementary Video S1) and they had an ellipsoid (Fig. 2 and Supplementary Videos S1 and S2) or a circular shape (Fig. 2 and Supplementary Video S2). Accumulation of F-actin expresses the apical-basal polarization and presents the formation of the bile canaliculi onto the canalicular plasma membrane (Fig. 2 and Supplementary Videos S1 and S2). About 60%–80% of the spheroids formed canalicular structures. In some spheroids, F-actin was accumulated all over the spheroid constituting the branching conduit; bile canaliculi network (Fig. 2). In conventional 2D culture, F-actin accumulation sites were smaller and rare and lumen formation was not detected (Fig. 3).
Localization of canalicular transport proteins
The characteristics of the canalicular plasma membrane were studied by immunostaining the target proteins. We verified that the MRP2 protein is localized in the canalicular membrane as shown by colocalization with F-actin. The colocalization of MRP2 and F-actin was seen both in 2D and 3D cultures, but 2D cultures did not show bile canalicular structures (Figs. 2 and 3 and Supplementary Video S2). MDR1 was colocalized with F-actin only in 3D cultures. Other studied canalicular resident proteins, BCRP and BSEP, were expressed mostly intracellularly both in 2D and 3D cultures (Figs. 2 and 3). BSEP did not show preferable localization to the bile canalicular membrane domains (the result was achieved with two different antibodies). In some spheroids, BCRP was localized to the canalicular domains (data not shown).
Functional activity of the canalicular membrane
The vectorial excretion activity of 3D cultured HepG2 cells was examined using fluorescein diacetate as a marker. Immediately after adding fluorescein diacetate to the cultured cells, strong intracellular fluorescence was seen (Fig. 4A). This fluorescence originates from fluorescein, a metabolite of fluorescein diacetate, and this result informs about the metabolic activity and viability of the HepG2 cell–hydrogel matrix. Live-cell imaging in real-time demonstrated fluorescence translocation into the round vesicle-like structures between adjacent cells in the spheroids (Fig. 4B). This fluorescein accumulation suggests that MRP2 is functionally active in the canalicular vacuoles and bile canaliculus-like structures.21,22 The canalicular domain activity was further shown with an MDR1 substrate, rhodamine 123 (Fig. 4C).
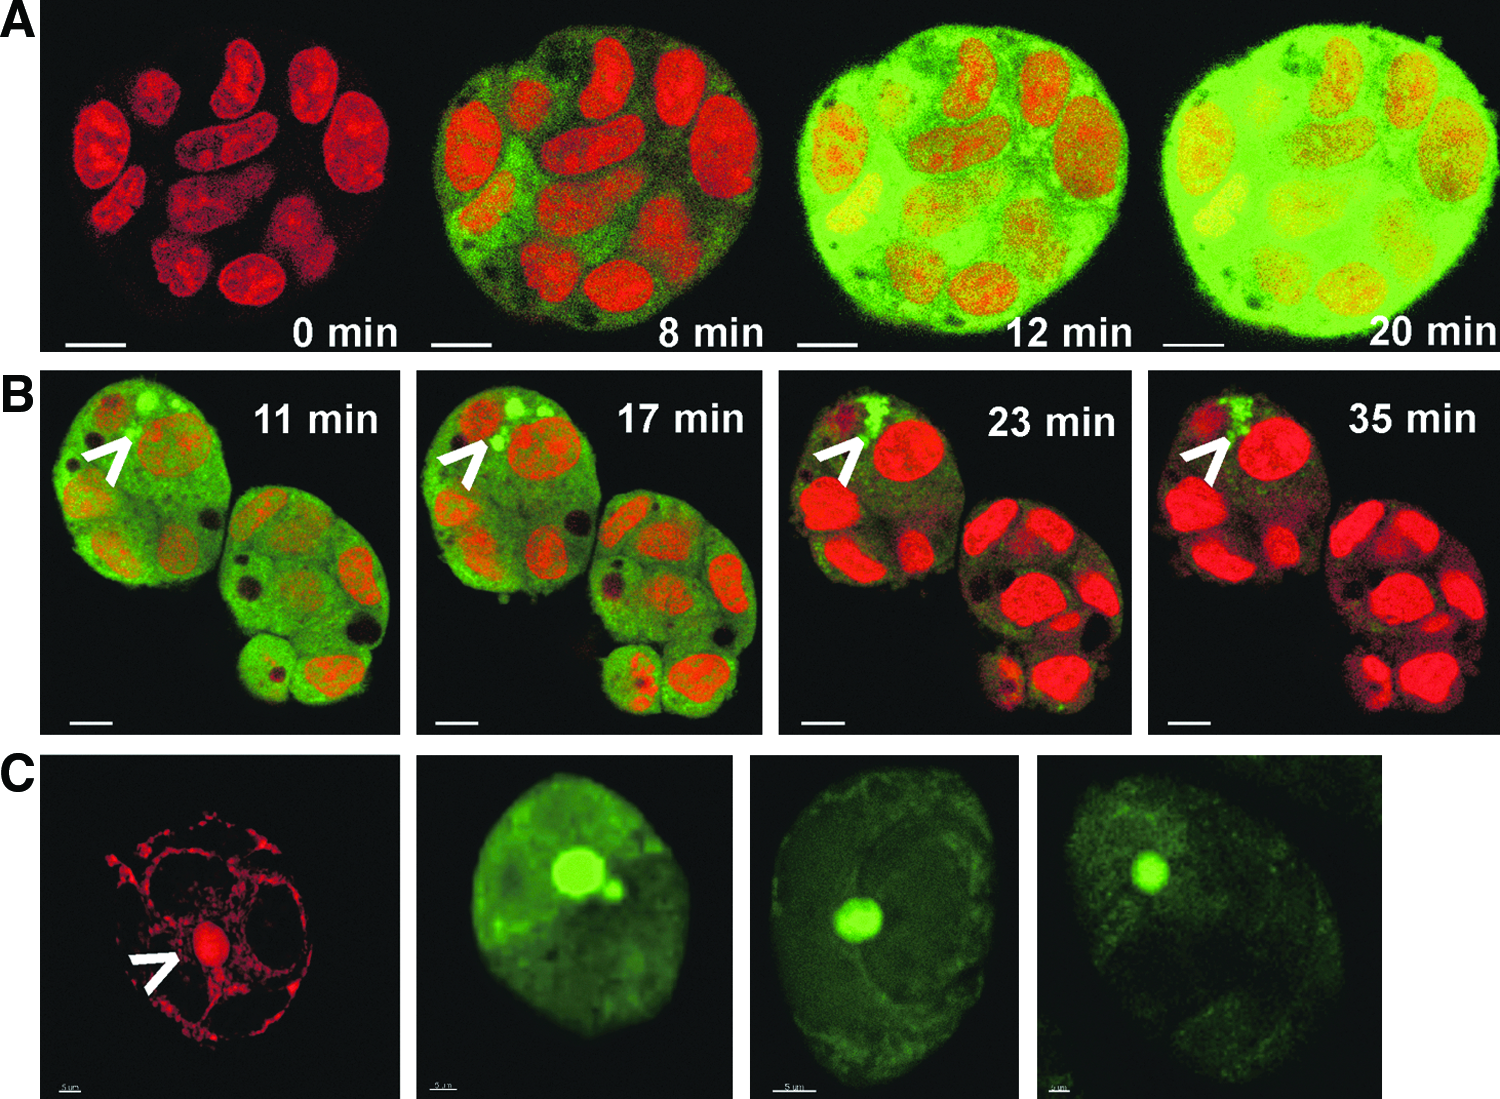
Directional transport of the fluorescent probe in the HepG2 cell line cultured in a peptide-hydrogel. The living cells were incubated with 10 μM fluorescein diacetate, which gets internalized by HepG2, cleaved by intracellular esterases, and excreted into the bile canalicular-like structures by hepatobiliary transporters. Nuclei were stained with Draq5™ (red). Both the formation of fluorescent metabolite of fluorescein diacetate (green) within cytosoles
Discussion
Inadequate functionality of the current liver cell models has promoted the development of new cell culture techniques. Especially different biomaterials11,13 or bioreactor culture-5,12,23 related methods have resulted in improved cell culture models compared to standard 2D cultures. Here we demonstrate that peptide nanofibers-based hydrogel produces 3D HepG2 spheroids with apicobasal polarity and specialized canalicular structures in the core of spheroids. The improved phenotype was achieved by embedding the cells in the peptide nanofiber matrix. Previously, this peptide hydrogel has been shown to promote differentiation of rat hepatocyte progenitors, 15 and to maintain differentiated functions of both porcine hepatocytes 16 and primary rat hepatocytes. 17
HepG2 cells formed in peptide nanofiber hydrogels smooth round spheroids, different from the published 3D cultures of HepG2 cells that included irregular cellular aggregates18,23–25 or cell layer on the scaffold surface. 13 These studies analyzed neither cell viability nor the liver-specific functions of the cells. The present study illustrates the influence of 3D culture environment on cell polarity and plasma membrane domain formation, in particular, the localization and function of canalicular drug transporter proteins.
The changes in the cytoskeleton and F-actin expression on the apical cell side are hallmarks of in vivo-like polarity and bile canaliculus formation. Previously, elongated canalicular structures spanning multiple HepG2 cells have been observed only in the cells cultured on predeposited ECM9 or in the presence of Rho kinase or myosin-II ATPase inhibition. 9 The small canalicular structures (2–5 μm in length) in standard 2D HepG2 culture are typically shared only by a couple of cells,9,26 but chemical inhibition may result in bigger canalicular structures of about 10 μm in length. 9 However, in our study much bigger canalicular structures of 20–35 μm in length were achieved (Fig. 2). In primary hepatocyte cultures, formation of elongated (10–50 μm) bile canalicular structures is more common.10,11,21,27 Thus, HepG2 cells in 3D peptide nanofiber matrix seem to develop structures that resemble primary cells in sandwich culture and liver tissue in vivo.
The physiological localization of hepatobiliary transporter proteins, MRP2 and MDR1, to the canalicular plasma membrane domains of the spheroids confirms the cell polarization. In 2D cultures, MDR1 staining was not seen in the canalicular structures, suggesting a nonpolarized phenotype. The other canalicular efflux proteins, BSEP and BCRP, were intracellularly located, which is in agreement with a previous study with HepG2.26,28 The transporter localization in HepG2 spheroids was investigated previously by Vander Borght 2008. 19 They found out that BCRP was correctly localized, but MDR1 was not, while MRP2 was not investigated.
Compared to conventional culture, the 3D culture in peptide nanofiber matrix did not result in upregulation of metabolizing enzymes and transporters. The mRNA expression remained the same level in both 2D and 3D cultures from culturing day 4 to 7. This is a surprising and important result that indicates that the in vivo mimicking cell morphology and polarized functions do not guarantee correct expression of metabolizing enzymes.
We demonstrate that the directional functions of biomaterial-embedded cells can be visualized. Previously, hepatic transport has been visualized in standard culture, 22 in sandwich culture, 11 and in perfusion culture. 27 In the current study, efflux transport of 3D cultured HepG2 was followed for the first time by real-time imaging and with two transporter probes, fluorescein diacetate, and rhodamine 123. Fluorescein diacetate is a nonfluorescent compound that is internalized, transformed to fluorescein, and excreted into bile canaliculi by MRP2. Therefore, the fluorescein diacetate probe informs about the esterase-mediated metabolism (from fluorescein diacetate to fluorescein) and active excretion of fluorescein into the bile compartment. Instead, fluorescent rhodamine 123 as such is the substrate for canalicular transporter MDR1. Translocation of fluorescein and rhodamine into the canalicular space suggests that the correctly located MRP2 and MDR1 are functional. Our study indicates that vectorial efflux transport into bile canaliculi can be followed in real-time. To our best knowledge, this is a first study showing real-time 3D imaging of hepatic transport function.
Our findings confirm that multicellular patterning and elongated canalicular lumen formation in hepatocyte cell line culture can be achieved by a simple change in culture geometry, without any specific chemical treatment. We also illustrate the importance of ECM mechanical pressure (shear stress) on the cell morphology by comparing the HepG2 cultures inside and on the matrix surface. After cell seeding on matrix surface, the cells formed 2D morphology similar to standard culture and no spheroid formation was observed (data not shown).
Conclusions
These results illustrate that the peptide nanofiber scaffold improves properties of HepG2 cells in culture. RAD16-I hydrogel promoted the spheroidal morphology, cellular polarity, multicellular patterning, and bile canalicular surface remodeling. The canalicular structures were larger than previously reported with HepG2 cells, and resembled in vivo bile canalicular structures with F-actin accumulation, MDR1 and MRP2 localization, functional hepatobiliary efflux, and physically separated canalicular space. Furthermore, we demonstrated that canalicular transport can be visualized in 3D biomaterial-based cell cultures. These findings are promising and indicate that self-assembling peptide scaffolds may have potential in the development of functional liver cell models for investigations of drug transport and interactions at the level of canalicular efflux transport.
Footnotes
Acknowledgments
We thank Kimmo Tanhuanpää, Ph.D., and Mr. Mika Molin from the Light Microscope Unit, the University of Helsinki for excellent technical guidance in confocal imaging. This work was supported by the Graduate School in Pharmaceutical Research and EU FP7 Project “Liv-ES, HEALTH-F5-2008-223317.”
Disclosure Statement
No competing financial interests exist.
References
Supplementary Material
Please find the following supplemental material available below.
For Open Access articles published under a Creative Commons License, all supplemental material carries the same license as the article it is associated with.
For non-Open Access articles published, all supplemental material carries a non-exclusive license, and permission requests for re-use of supplemental material or any part of supplemental material shall be sent directly to the copyright owner as specified in the copyright notice associated with the article.