




Abstract
Controlling cell differentiation and proliferation with minimal manipulation is one of the most important goals for cell therapy in clinical applications. In this work, we evaluated the hypothesis that the exposure of myoblast cells (C2C12) to nonionizing radiation (tuned at an extremely low-frequency electromagnetic field at calcium-ion cyclotron frequency of 13.75 Hz) may drive their differentiation toward a myogenic phenotype. C2C12 cells exposed to calcium-ion cyclotron resonance (Ca2+-ICR) showed a decrease in cellular growth and an increase in the G0/G1 phase. Severe modifications in the shape and morphology and a change in the actin distribution were revealed by the phalloidin fluorescence analysis. A significant upregulation at transcriptional and translational levels of muscle differentiation markers such as myogenin (MYOG), muscle creatine kinase (MCK), and alpha skeletal muscle actin (ASMA) was observed in exposed C2C12 cells. Moreover, the pretreatment with nifedipine (an L-type voltage-gated Ca2+ channel blocker) led to a reduction of the Ca2+-ICR effect. Consequently, it induced a downregulation of the MYOG, MCK, and ASMA mRNA expression affecting adversely the differentiation process. Therefore, our data suggest that Ca2+-ICR exposure can upregulate C2C12 differentiation. Although further studies are needed, these results may have important implications in myodegenerative pathology therapies.
Introduction
Theoretical models of chemical reactions 12 and in vitro studies reported that a moderate intensity of static magnetic fields is able to affect a number of biological processes that are strongly linked to the properties of membrane channels.13–17 These results have been explained as membrane Ca2+-flux alterations, due to the diamagnetic anisotropic properties of membrane phospholipids.
In particular, the electromagnetic fields (EMFs) affect cellular growth18–21 and differentiation processes,22–24 as demonstrated by us in murine neuronal cells.25,26 Recently, we have shown a lineage-specific commitment in human cardiac stem cells after an EMF exposure, 27 and changes in second-messenger concentration, such as inositol trisphosphate and Ca2+ions, were also reported.26,28–30 A major effect on the calcium efflux was observed when the nervous tissue was exposed simultaneously to a static magnetic field combined to a low-frequency sinusoidal magnetic field, tuned at calcium-ion cyclotron resonance (Ca2+-ICR) frequency.31,32
In the present study, we used an exposure system inside a μ-metal-shielded room to work in totally controlled and reproducible conditions. We hypothesized and then demonstrated that a combination of static and sinusoidal EMFs, corresponding to the Ca2+-ICR, can act on the C2C12 cell differentiation without any pharmacological or genetic manipulation.
Materials and Methods
Exposure system description and characterization
The equipment for EMF production (solenoid) is setup in the μ-metal-shielded room located in our laboratories (Fig. 1A, B). This apparatus includes a cellular incubator, made of polymethylmethacrylate, and a diamagnetic material that has a relative permeability<1, where temperature (37°C±0.1°C), atmosphere composition (5% CO2), and humidity regulation are provided, continuously controlled, and recorded by a lab-view program (control system). 27

Schematic representation and quantitative description of the exposure apparatus for calcium-ion cyclotron resonance (Ca2+-ICR) electromagnetic field generation.
The main body of the home-produced solenoid is a cylinder in polyvinyl chloride, 5-mm thick, with a diameter of 33 cm, and is 3.3 m long. It is made of 3300 turns of 1-mm-diameter copper wire. It is driven by three amplifiers and a signal generator that create static and alternate current for EMF production. This equipment is able to produce a frequency from 0.01 Hz to 1 kHz and a magnetic flux density whose magnitude spans between 10 nT and 1mT; the maximum output voltage of the voltage supplier, which feeds the solenoid is 33 mV root mean square (RMS).
The solenoid is placed in a μ-metal-shielded room (Vacummshmelze Gmbh). The room measures 4.346×3.346×2.800 mm internally and consists of a high-permeability μ-metal shell with a double-partition wall built with 10 sheets of 1-mm-thick μ-metal, shielding factor 1.000 at 1 Hz. The solenoid has a length/diameter ratio of 10:1, sufficient to ensure extreme high uniformity over the middle. It was used to generate both the static as well as the parallel time-varying fields through the expression: B=μ0IN/L, where B is the magnetic flux density, μ0 is the magnetic permeability of the free space, I the current, and N/L the ratio of total turns to the length. Thus, the static field of 18 μT was generated using a current of 13 mA, and the alternate field was generated using a superimposed current of 2.5 mA. Static and alternate magnetic fields were continuously recorded by a three axial sensor type Bartington MAG 03MC (Bartington), with a measuring range±70 μT, bandwidth of DC- 3 kHz, linearity error <0.0015%, and offset error±5 nT.
The control experiment was run in twin diamagnetic incubators, outside the shielded room; this second incubator was set in a place in which the geomagnetic field resulted to be 18 μT, while the positive control cell experiments were run in a normal cell incubator ThermoForma 3111 (Thermo scientific). In both diamagnetic incubators, the atmosphere, humidity, and temperature were simultaneously and electronically controlled and recorded.
Ca2+-ICR exposure parameters
The exposure parameters were calculated based on the following Lorentz's equation:
where q and m are, respectively, the ion's charge and mass; |
We applied a very low intensity of EMF (in the range of μT), since at a resonance condition, it is hypothesized that a maximum energy transfer occurs, enabling us to see a biological effect. Under these conditions, the amount of heating due to the Joule effect was negligible, and all the effects reported after cell exposure are related to the Ca2+-ICR exposure.
In our study, C2C12 cells were continuously exposed up to 5 days to a static MF (18 μT) and a sinusoidal ELF-EMF (2.5 μT RMS of intensity) at 13.75 Hz, matching the cyclotron frequency corresponding to the charge/mass ratio of Ca2+-ICR. The exposure parameters were chosen according to our previous results showing a differentiation effect on human cardiac stem cells. The experiment with cells that were not exposed (control cells) was carried out in a twin diamagnetic cell incubator where the temperature (37°C±0.1°C), atmosphere composition (5% CO2), and humidity regulation were remotely controlled by a lab-view program such as the one exposed into the solenoid. All experiments have been performed under single-blind conditions, and the samples (exposed and control not exposed cells) were numbered, and the operator did not know which ones were being used. The exposure system has been described in our previous publication. 27
Cell culture and differentiation
C2C12, a subclone of the C2 mouse myoblast cell line,3,4 was obtained from the American Type Culture Collection (CRL-1722). The cells were cultured in a growth medium (GM) composed of the high-glucose Dulbecco's modified Eagle's medium (DMEM; PBI international), supplemented with 10% heat-inactivated fetal bovine serum (FBS; Invitrogen), 4 mM
The C2C12 cultures were split and seeded into three flasks at 5×10⁴ cells/flask at the same passage, and the experiments (exposed and nonexposed cells and positive control) were run simultaneously.
The differentiation levels of all three samples were studied by four different methods: fluorescence-activated cell sorter (FACS); fluorescent staining of actin; reverse transcriptase–polymerase chain reaction (RT-PCR), and Western blot analysis. They were analyzed at different stages of their differentiation after plating: undifferentiated (1 day); low (3 days), and high-differentiation point (5 days).
The exposed sample (up to 5 days to Ca2+-ICR) and the control nonexposed sample were grown in GM.
The C2C12 cells used as positive control
2
were grown for 5 days in a differentiation medium (DM). In this last sample, the medium containing 10% FBS (GM) was replaced with the DM composed of DMEM (PBI international), 2% horse serum (Invitrogen), 4 mM
FACS analysis
C2C12 cells grown in absence or presence of the EMF were washed twice with phosphate-buffered saline (PBS) and fixed in 100% cold ethanol. Fixed cells were stained daily with propidium iodide (40 μg/mL; Sigma) and treated with RNase A (50 μg/mL; Sigma) for 30 min at room temperature.33,34 About 2×10⁴ cells were analyzed for DNA content on an FACSCalibur (Becton Dickinson).
Bromodeoxyuridine incorporation assay
C2C12 DNA synthesis was quantified by a bromodeoxyuridine (BrdU) incorporation method 35 using a fluorescein isothiocyanate (FITC) BrdU Flow Kit (Becton-Dickinson), according to the manufacturer's instructions. BrdU was then detected using a method with DNase cell treatment and an FITC-conjugated anti-BrdU antibody. 36 Exponentially growing myoblast cells, cultured for 5 days in absence (control) or in presence (exposed) of the magnetic field, were incubated with 10 μM BrdU for 30 min. Then, the cells were fixed and permeabilized before treatment with DNAse (300 μg/mL) for 1 h. Afterward, cells were incubated with FITC-coupled anti-BrdU for 20 min and later counterstained with 7-amino-actinomycin D (7-AAD) to show the total DNA content. About 5×10⁴ were analyzed cells using Cell Quest pro Software Version 5.2 and an FACSCalibur flow cytometer (Becton-Dickinson).
Cell morphology and fluorescence-staining analysis of actin
C2C12 myoblasts were seeded on cover glasses and cultured in a GM in an incubator for 5 days in absence (control) or in presence (exposed) of Ca2+-ICR. Cells were washed in PBS, fixed in paraformaldehyde 4% in PBS for 15 min, and tested by both phase-contrast microscopy to visualize the cell morphology and by direct fluorescence for the presence of actin filaments. C2C12 cells were incubated with phalloidin tetrametylrhodamine isothiocyanate conjugated (1:500), an anti-actin toxin (Sigma), in a PBS buffer for 1 h. Cells were washed three times with PBS, stained for nuclei localization with Hoechst 33342 (trihydrochloride–trihydrate), and examined. The fluorescence was monitored using the fluorescence microscopy technique (Olympus IX51; RT Slider SPOT—Diagnostic Instruments).
RT-PCR analysis
C2C12 myoblasts cultured in a GM (in absence—control—or in presence— exposed of Ca2+-ICR) or in a DM (positive control) were pretreated or not with Nifedipine and studied at 1, 3, or 5 days. Total RNA was extracted from all samples using TRIzol reagent (Invitrogen), according to the manufacturer's instructions. RT-PCR analysis was performed as described previously. 25 cDNA was amplified in a controlled manner, so that the products of the PCR remained proportional to the amount of the mRNA target in the cells (before the products reach the plateau). The RT-PCR exponential phase was determined on 22–30 cycles to allow semiquantitative comparisons of cDNAs and used to evaluate relative mRNA levels. One μg of total RNA was used to synthesize the first strand of cDNA with random primers, using 100 U of ImProm-II RT-PCR kit (Promega). The specific primers used for PCR are the following: MYOG (forward 5′-GGG GAC CCC TGA GCA TTG-3′; MYOG reverse 5′-TCG CGC TCC TCC TGG TTG-3′), muscle creatine kinase (MCK forward 5′-GTG GCC GGC GAT GAG GAG-3′; MCK reverse 5′-TGG AGA TCA CGC GGC GGT G-3′), ASMA (forward 5′-ATT GAA CAT GGC ATC ATC ACC-3′; ASMA reverse 5′-GCA GCT CAT AGC TCT TCT CC-3′), and β-actin (forward 5′-TGT TAC CAA CTG GGA C-3′; β-actin reverse 5′-AAG GAA GGC TGG AAA AGA G-3′). Ribosomal protein S7 (RPS7) was used as an endogenous control to demonstrate an equal efficiency among each sample preparation (forward 5′-CTG TGA GCT TCT TGT ACA CAC-3′; RPS7 reverse 5′-GTA CCA GTT CCT CAG CTT AAA-3′). The thermocycling conditions for each pair of primers were denaturation at 94°C for 2 min, followed by amplification at 94°C for 30 s, annealing for 30 s at 60°C, elongation for 30 s at 72°C (MYOG 25, MCK 35, ASMA 25, β-actin 19, and RPS7 25 cycles), and a final polymerization step at 72°C for 7 min.
The samples were run in a 1% agarose gel in a Tris-acetate-EDTA 1× buffer. After acquisition of the UV-illuminated gel by the VersaDoc model 1000 gel-imaging system (BioRad Richmond), the semiquantitative analysis was performed by VersaDoc model 1000 using Quantity One software-4.4.0 (BioRad), and the relative density was calculated compared to the housekeeping internal control mRNA. RPS7 is a component of the 40S ribosomal subunit belonging to the S7E family of ribosomal proteins.
Western blot analysis
C2C12 myoblasts were seeded on Petri dishes and cultured in the GM in the incubator for 1, 3, or 5 days in absence (control) or in presence (exposed) of Ca2+-ICR. We used the C2C12 cells differentiated in the DM condition as positive control. Whole proteins were extracted with a lysis buffer (150 mM NaCl, 50 mM Tris–HCl, pH 8, 0.5 mM ethylenediaminetetraacetic acid [EDTA], 0.1 mM ethylene glycol tetraacetic acid [EGTA], and 1% Triton X-100), and the concentrations were determined by the Bradford assay, and equal amounts of proteins from control and exposed cells were loaded in each lane. Electrophoresis was carried on 7% and 12% sodium dodecyl sulfate–polyacrylamide gels, according to Laemmli, 37 that were subsequently transferred on nitrocellulose membranes (BioRad). Membranes, after the block in 5% fat-free-milk for 1 h at room temperature, were incubated with the following antibodies: anti-MYOG (Santa Cruz Biotechnology; 1:200), anti- MHC, clone MF20 (1:20), anti-ASMA (Sigma; 1–1000), and anti-β-actin (βACT, 1:5000; Sigma), and anti-RPS6 (a 40S ribosomal protein belonging to the S6E family of ribosomal proteins) was used as control (RPS6, 1:1000; Cell-Signaling,). The antibody signal was revealed by a chemiluminescence (ECL) system (GE Healthcare Europe) and by autoradiography using an X-ray film.
Protein expression levels were determined semiquantitatively by a densitometric analysis with Quantity One software-4.4.0 (BioRad) using scanned autoradiographic images. The X-ray film was exposed in the linear density response region to optimize comparisons between bands and the relative density. The control RPS6 protein was used to calculate the relative density.
Statistical analysis
Data were statistically analyzed using the Student's t-test, with p≤0.05 as the minimum level of significance. Data are shown as mean±standard deviation. For the results of the cell-cycle analysis, RT-PCR, and Western blot analysis, we performed the three independent experiments at the same experimental condition every time (n=3). For data reported in Figure 7, before performing the analysis of variance (ANOVA) test, we checked the homogeneity of variance within each of the populations by Levene's test. Using Med Calc, 38 we carried out a two-way ANOVA test to verify the statistical significant difference among different groups (control, control-nifedipine, exposure, and exposure-nifedipine). In the case of statistical significance difference, a subsequent Student-Newman-Keuls test (p<0.05) was used for multiple comparisons (pairwise).
Results
Ca2+-ICR exposure affects C2C12 cell cycle and DNA synthesis
After assigning gates to obtain a single-cell population, we highlighted that the percentage of exposed cells at day 1 in the S phase and at day 2 in the G2/M2 phase increased. We also estimated an increase in the G0/G1 phase compared to the control cells, and this difference was statistically significant after the 3rd, 4th, and 5th day of exposure (Fig. 2).

Changes in cell-phase population proportions during Ca2+-ICR exposure. The G0/G1, S, and G2/M phases in control (ctr) and in exposed (exp) cells. Statistical evaluation was assessed with the Student's t-test with p≤0.05 as the minimum level of significance. Data are shown as mean±standard deviation (SD). Asterisk identifies statistical significance (p<0.05).
C2C12 cell (5×10⁴) cycle phases and DNA synthesis were also analyzed after day 1 and 5, studying the total DNA content and the incorporation of BrdU (Fig. 3). As shown, by analyzing the correlated expression of total DNA (with 7-AAD) and incorporated BrdU levels (with FITC anti-BrdU), the S phase at day 1 in the exposed C2C12 cells increase up to 38% compared to 31.5% of the control cells.
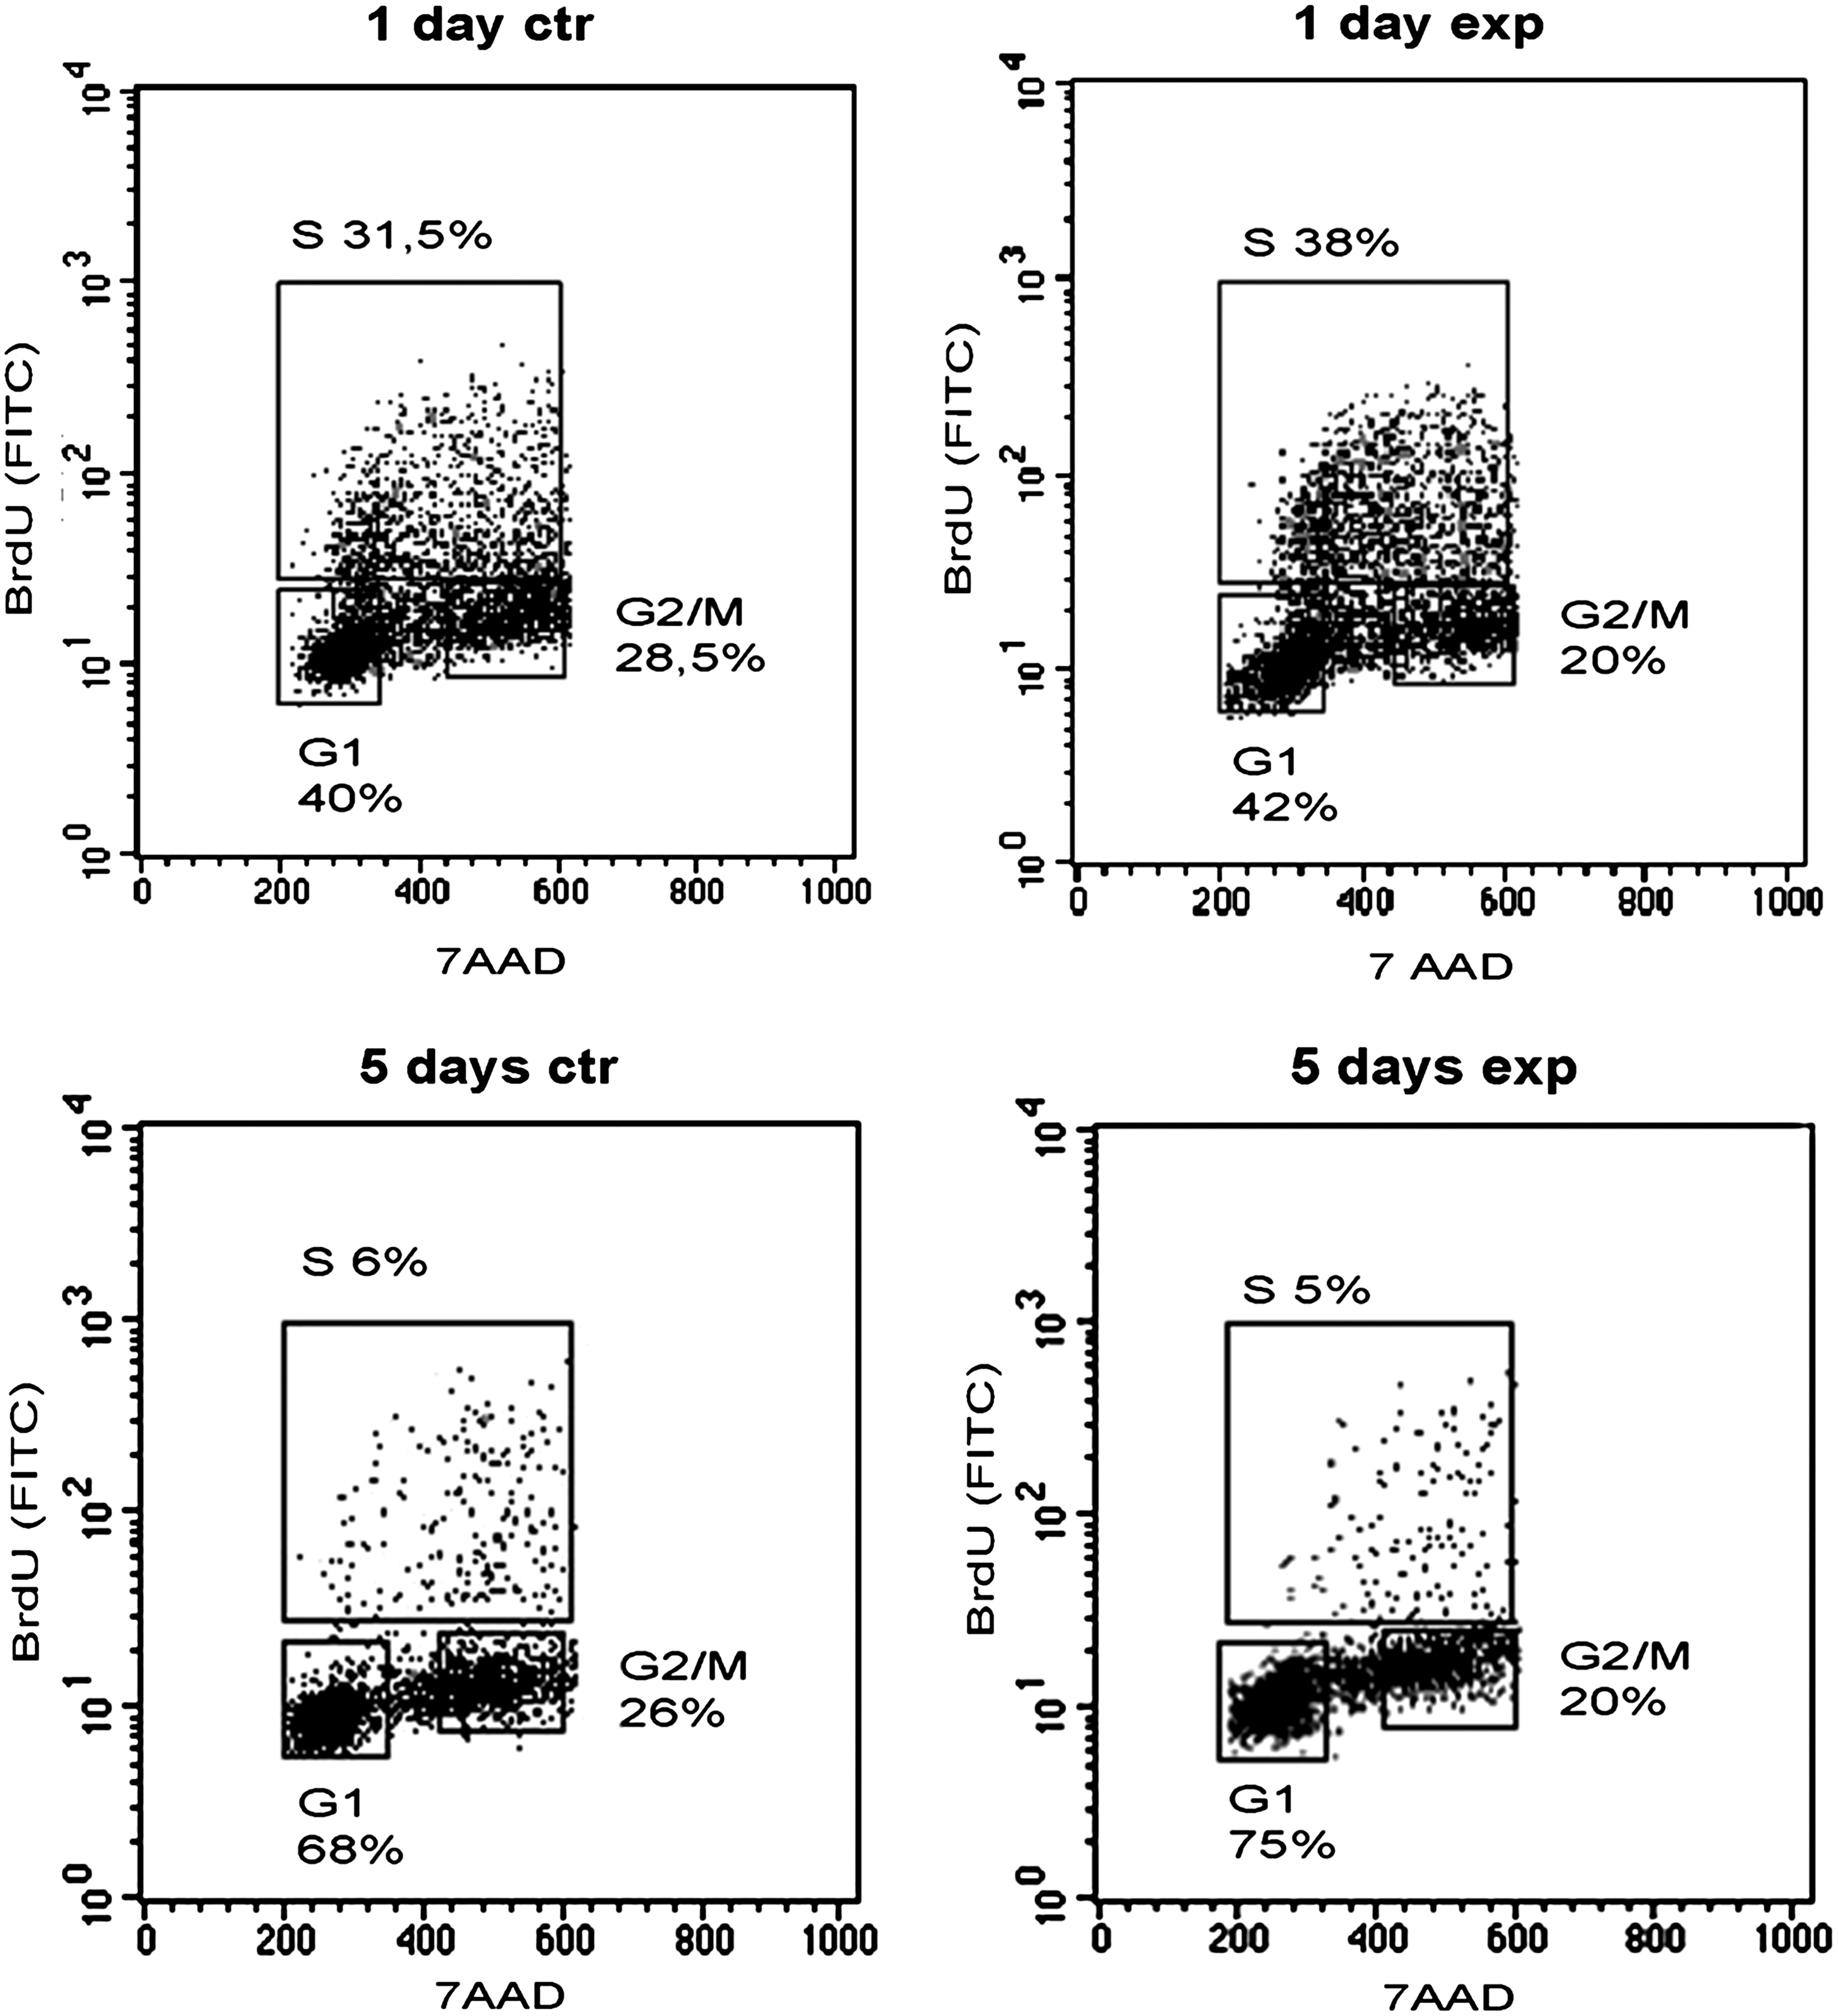
Effect of Ca2+-ICR exposure on cell cycle stages of C2C12 cell growth. Cell cycle positions and DNA synthetic activity of control (ctr) and exposed (exp) C2C12 cells are determined by analyzing the correlated expression of total DNA (with 7-amino-actinomycin D [7-AAD]) and incorporated bromodeoxyuridine (BrdU) levels (with fluorescein isothiocyanate [FITC] anti-BrdU).
In the same way, the G0/G1 phase at day 5 in the exposed C2C12 cells increased up to 75% compared to 68% of the control cells. This result demonstrates that the Ca2+-ICR frequency plays a role in regulating cell cycle progression in exposed C2C12 cells. The increase of cell proliferation at an early time followed by the increase of the G0/G1 phase at a later time after Ca2+-ICR exposure may suggest the beginning of the differentiation process.
Ca2+-ICR exposure affects cell morphology and filamentous actin production
Figure 4 shows a change from a polygonal into a linear configuration in C2C12 cells grown in a GM and exposed for 3 and 5 days to Ca2+-ICR. At day 3 of exposure, the cells became elongated and started to orientate in one direction. This effect became more evident at day 5 of exposure, and in addition, at this time, the formation of multinucleated myotubes started to be evident. Fluorescent staining analysis (Fig. 5) of filamentous actin (F-actin) in cells growing in presence or absence of the EMF revealed reorganization and an increase in F-actin in cells exposed for 3 and 5 days, compared to the control cells. More importantly, the observed increase was similar to that found in cells differentiated for 5 days in a DM (positive control). The EMF exposure can induce a morphological change and actin cytoskeletal reorganization, indicating a progression of C2C12 cells in the myogenesis process.
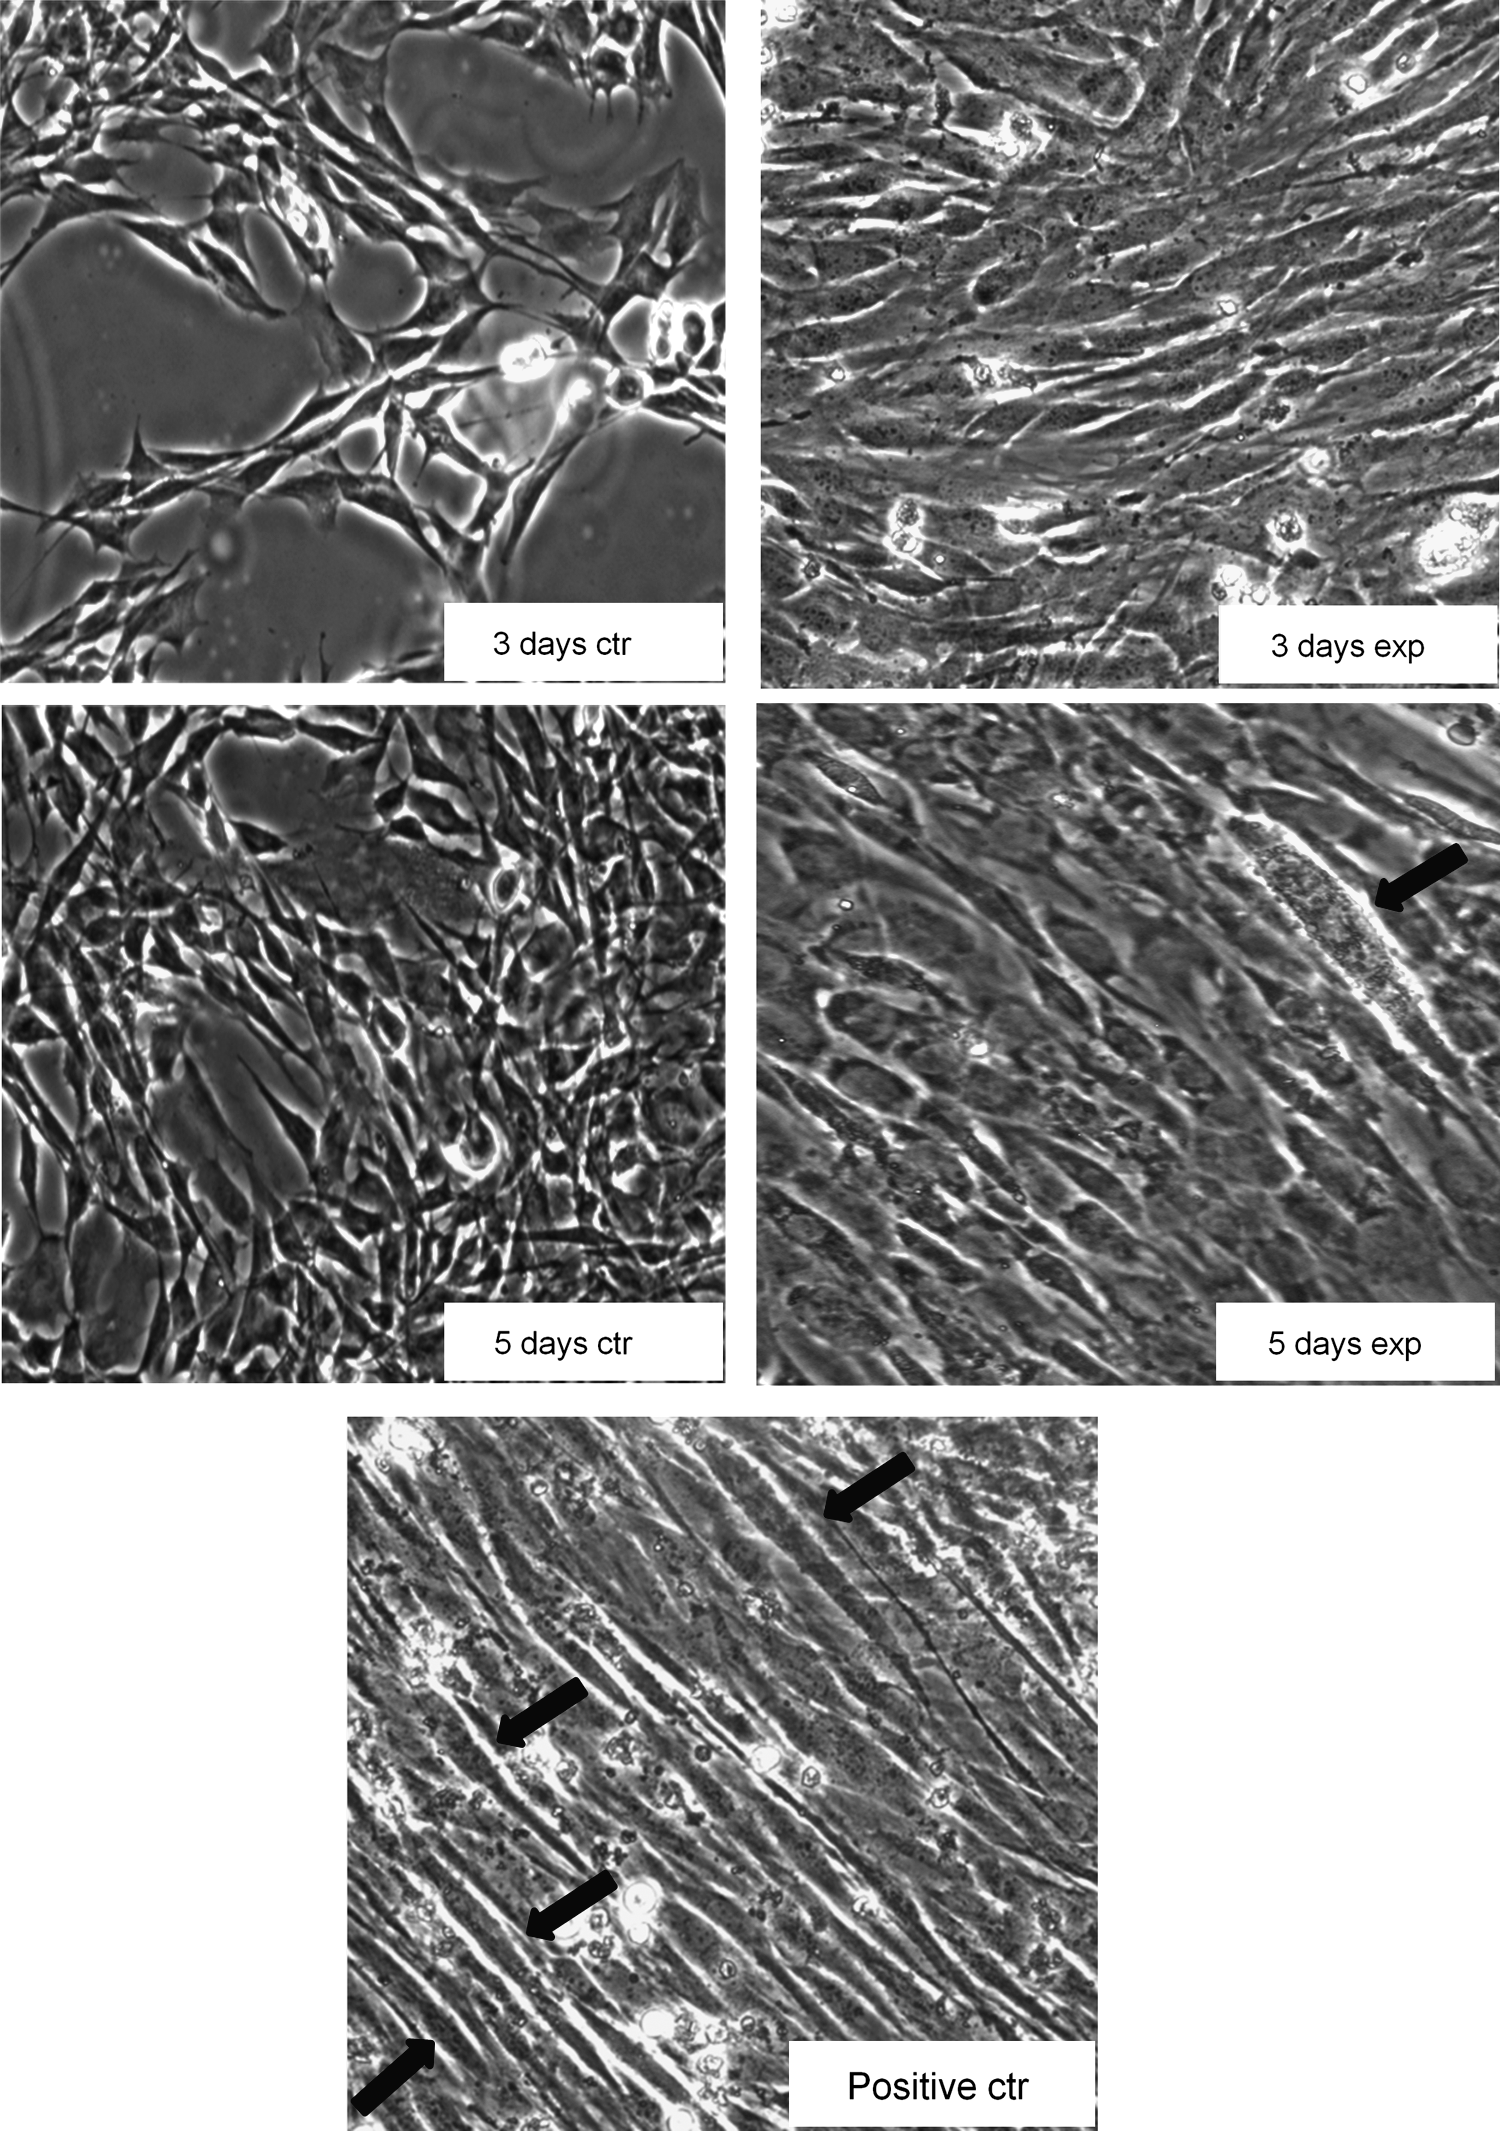
Effect of Ca2+-ICR exposure on C2C12 cell morphology by phase-contrast microscope analysis. Morphological analysis of control C2C12 cells, (3-day control and 5-day control) and exposed C2C12 cells (3 days exposed and 5 days exposed) cultured in a growth medium. The arrows show the presence of multinucleated myotubes. Morphological analysis of C2C12 cells cultured for 5 days in presence of a differentiation medium (positive ctr; ×40 objective).
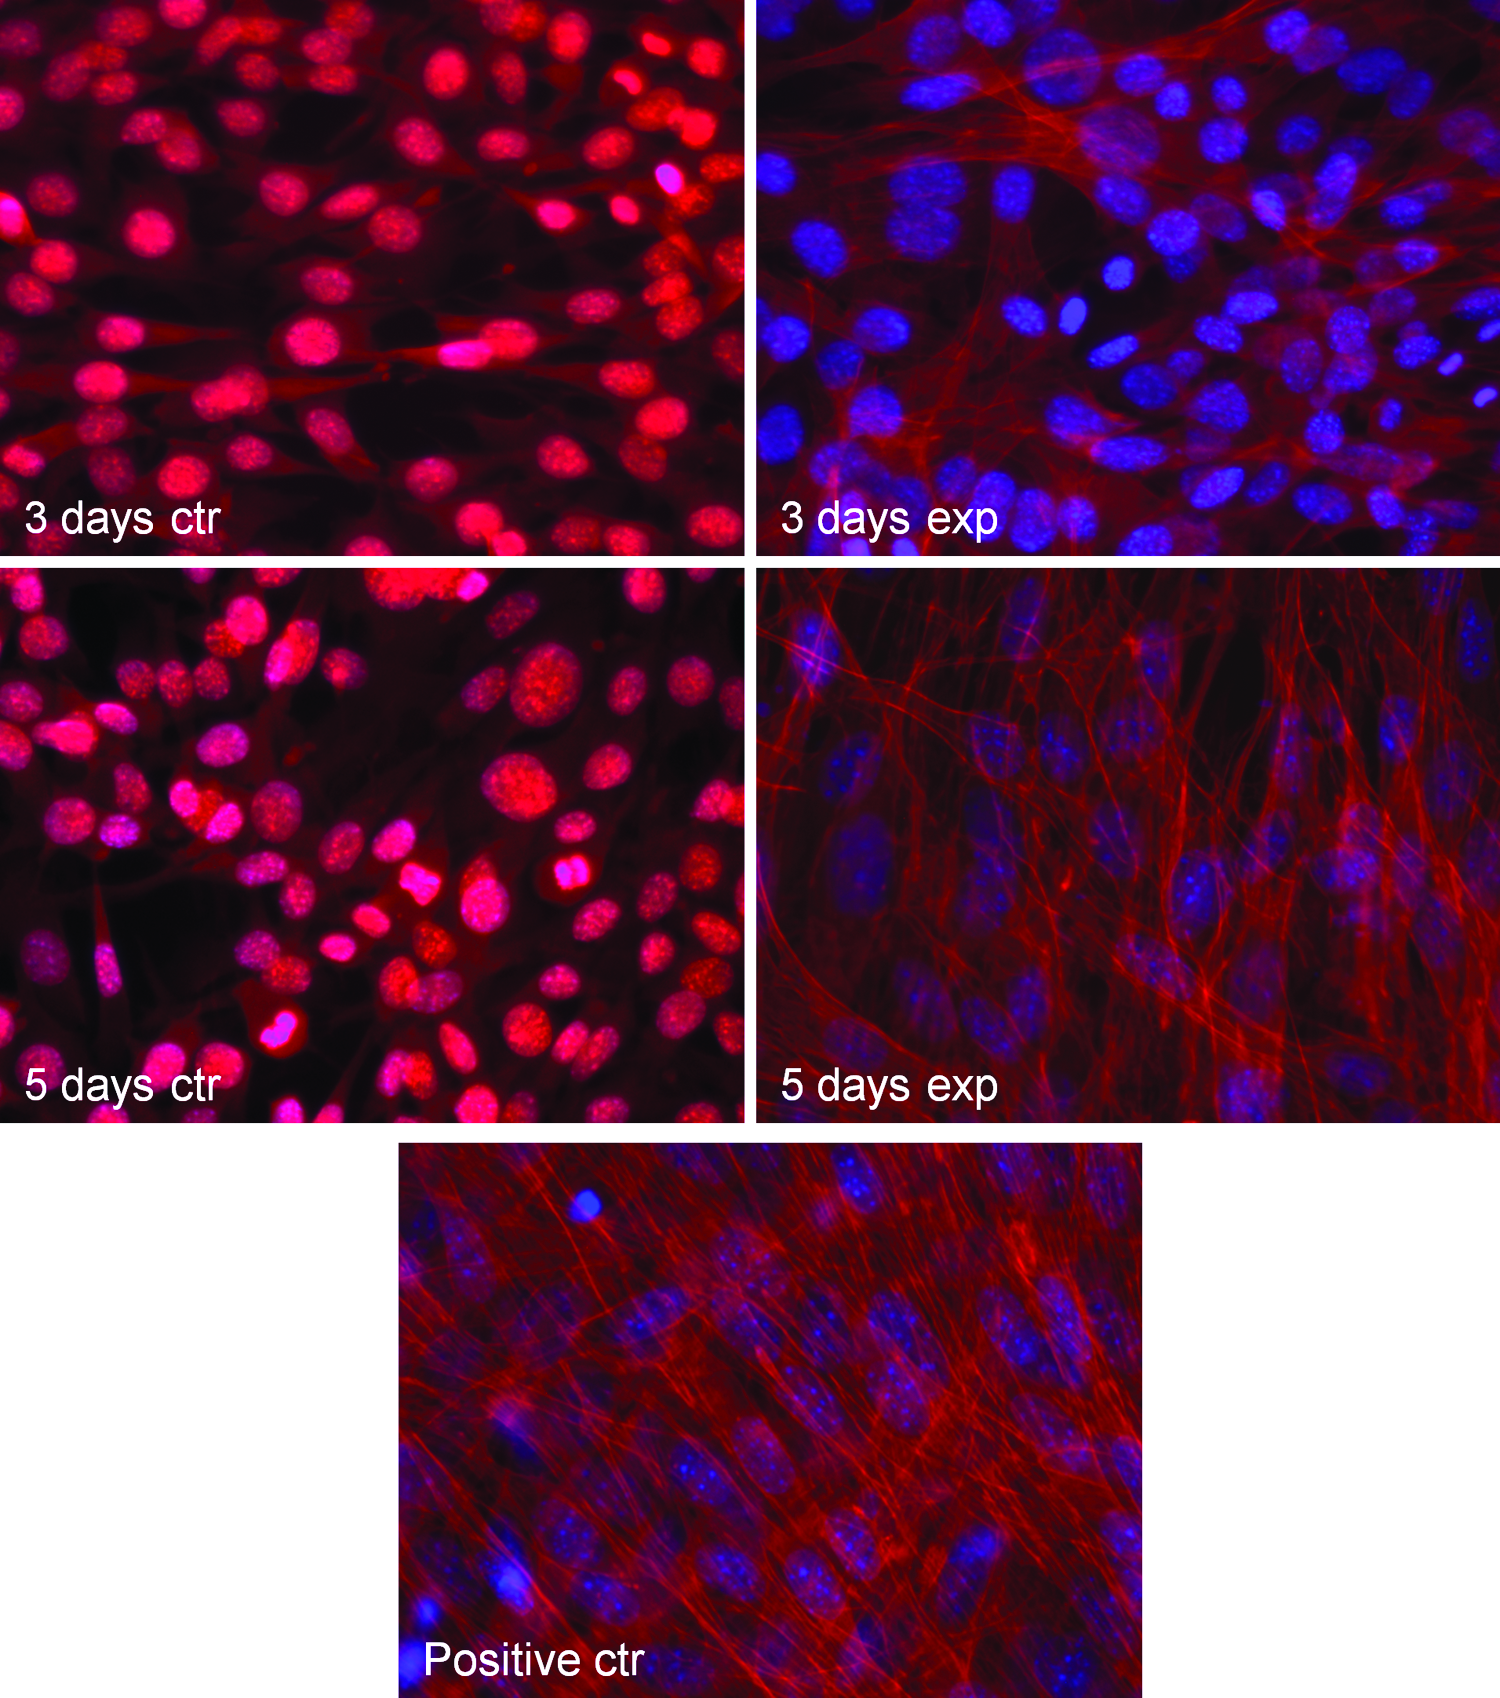
Effect of Ca2+-ICR exposure on C2C12 cells of actin distribution by fluorescent staining analysis. Phalloidin fluorescent staining (red) of C2C12 cells exposed, nonexposed at day 3 and 5 of culture, and cultured for 5 days in presence of a differentiation medium (positive ctr). Nuclei are counterstained with Hoechst (blue; X40 objective). Color images available online at www.liebertpub.com/tea
Ca2+-ICR exposure modulates C2C12 gene expression
To establish if the reorganization of F-actin induced by Ca2+-ICR exposure was involved in myogenesis, we measured by RT-PCR analysis the expression of early and late skeletal muscle differentiation markers at diverse differentiation levels: undifferentiated (day 1), low (day 3), and high (day 5). An increase in MCK and MYOG mRNAs was observed in cells exposed for 3 and 5 days to Ca2+-ICR. ASMA appears upregulated after 5 days of exposure, compared to control cells, whereas β-cytoskeletal actin (β-actin) was downregulated starting from day 3, showing a constant decrease along the time course considered (Fig. 6A, B). Ribosomal protein S7 was used as housekeeping internal control mRNA (RPS7). The positive control (cells grown for 5 days in the DM) was loaded in the last lane. These results report an increase of mRNAs of the myogenesis markers hinting the differentiation effect of Ca2+-ICR exposure on the C2C12 cells.
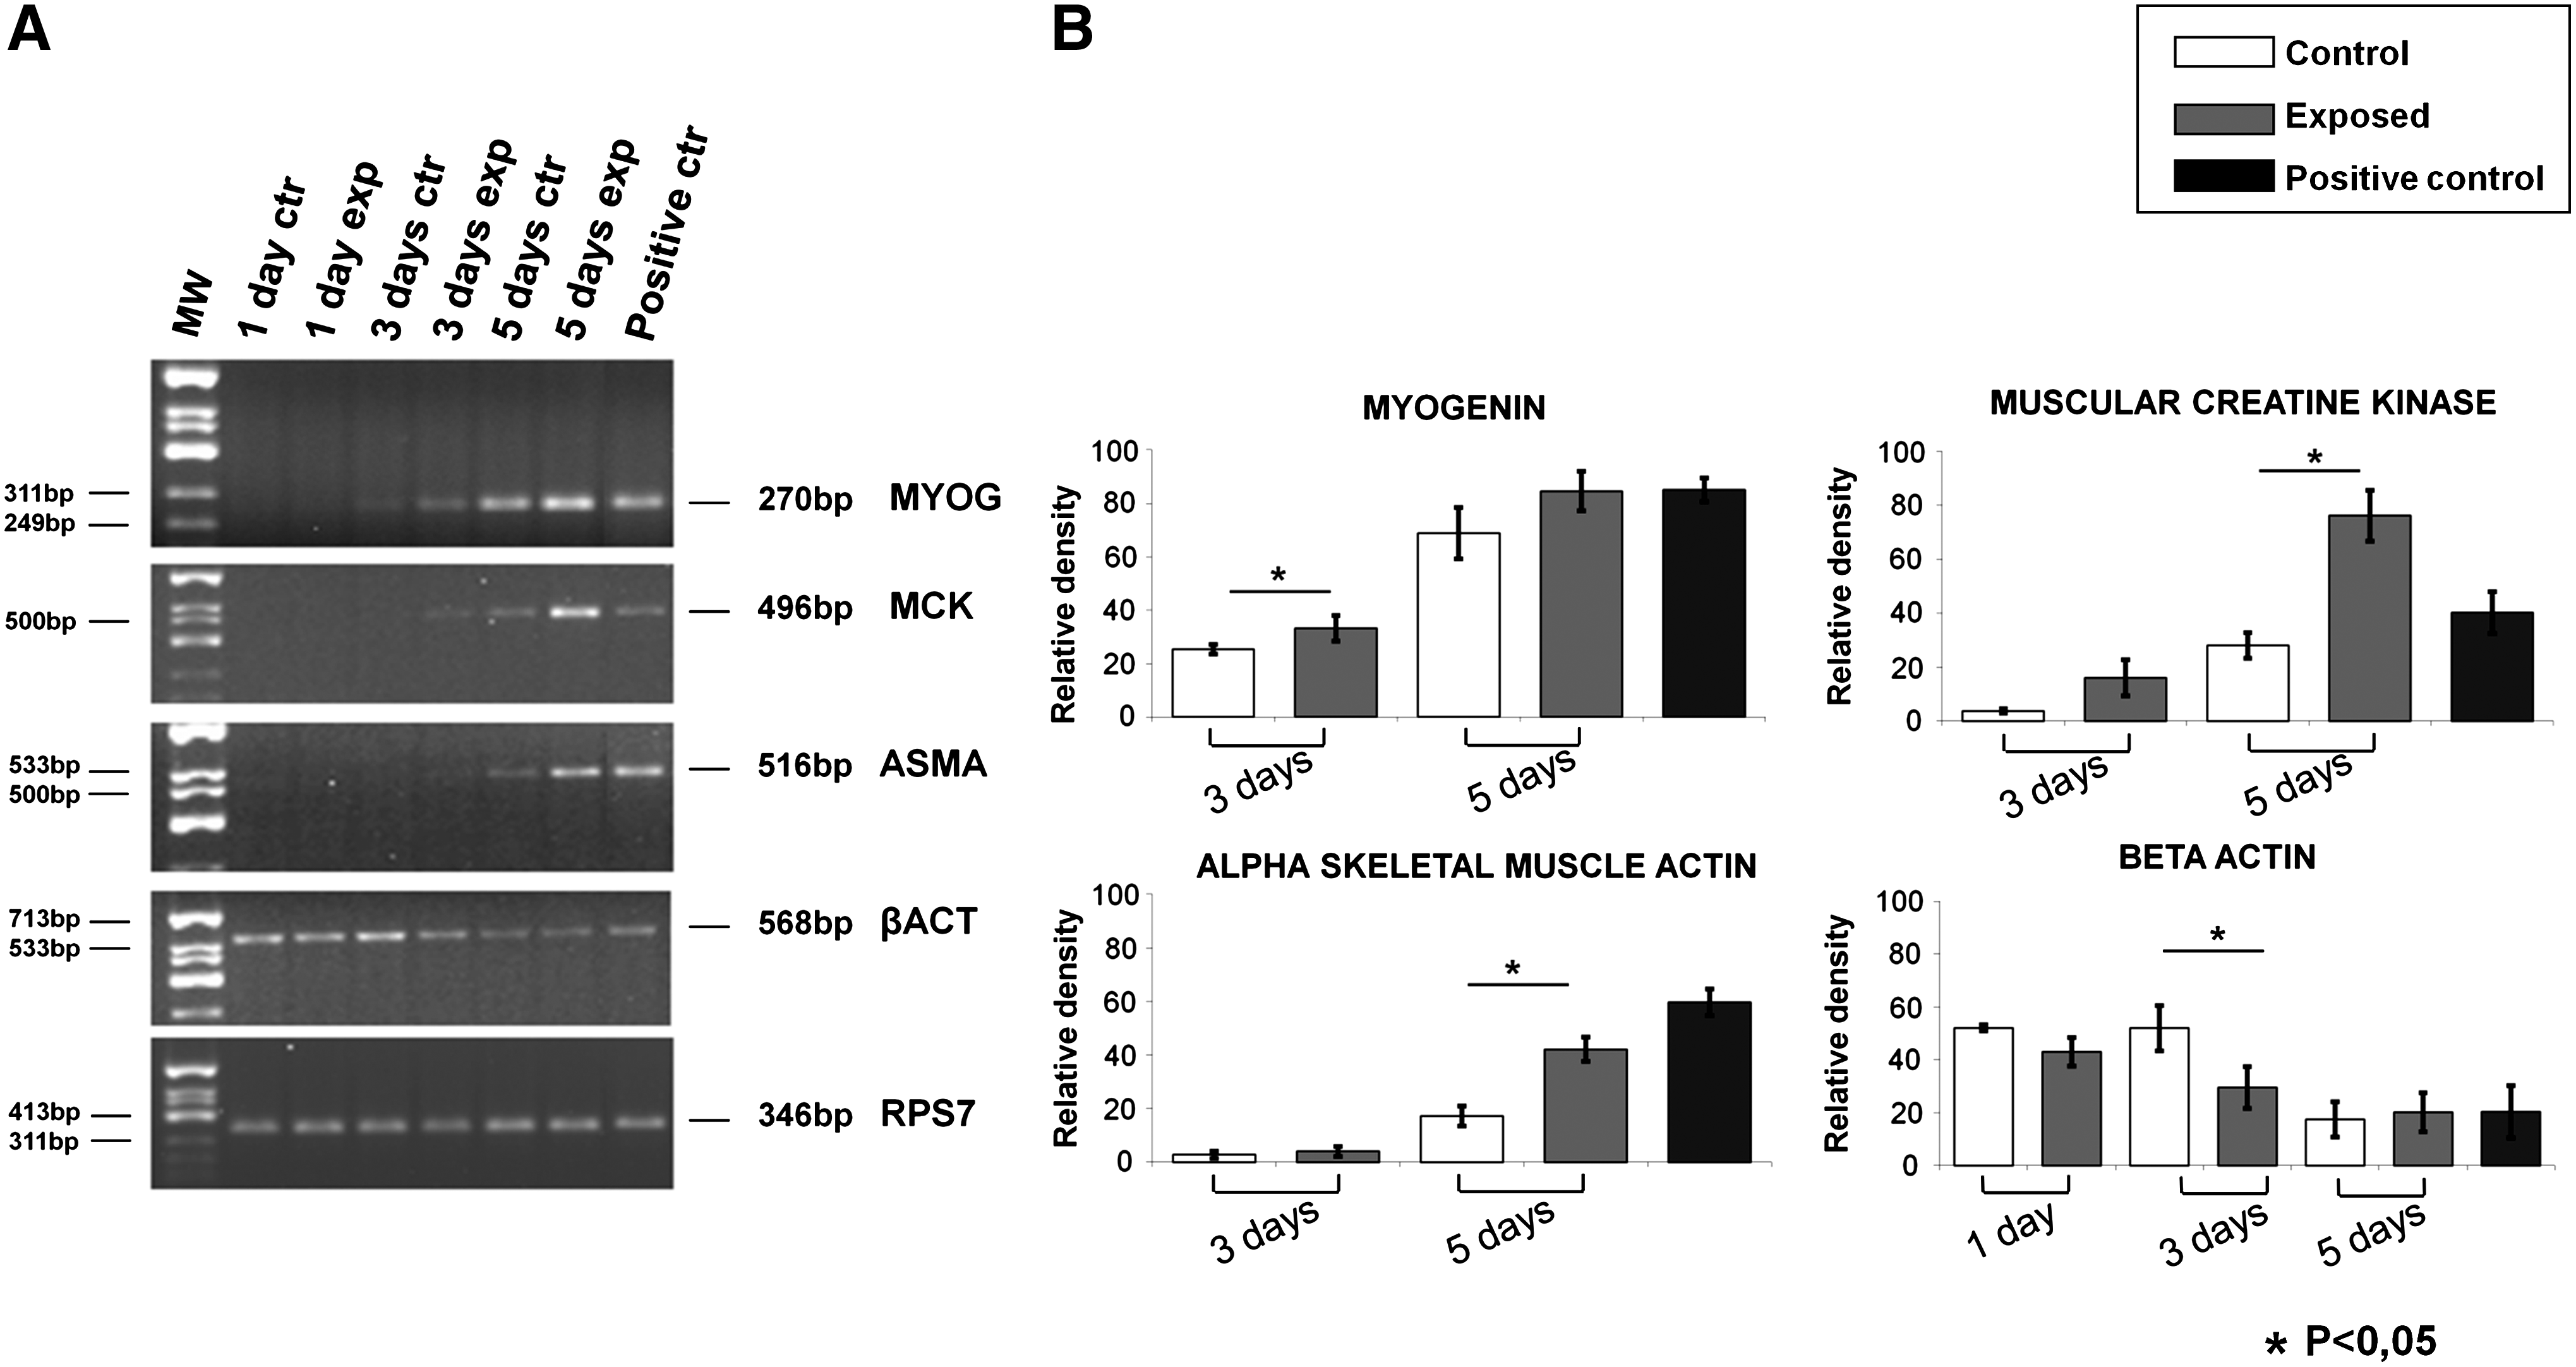
Effect of Ca2+-ICR exposure on C2C12 cell mRNA expression of myogenic differentiation markers.
Ca2+-ICR exposure acts on L-type Ca2+ channels
Myoblast differentiation is controlled by the increase of intracellular calcium concentration. Ca2+ ion and calcineurin protein regulate the expression of the MYOG gene at the transcriptional level, and the L-type Ca2+ channels are involved in this process. 19
We wanted to establish whether the induction of C2C12 differentiation by Ca2+-ICR exposure was correlated to modulation of L-type VGCC. For this reason, control and exposed C2C12 cells were pretreated with nifedipine, an L-type Ca2+ channel blocker, and the gene expression was studied at day 1, 3, and 5 by RT-PCR analysis. The results reported in Figure 7A and B show that nifedipine prevented the upregulation of MYOG, MCK, and ASMA that was previously induced by Ca2+-ICR exposure at 3 and 5 days. Nifedipine pretreatment inhibits the effect of Ca2+-ICR exposure, suggesting that L-type Ca2+ channels play an important role in the C2C12 differentiation process.

Effect of Ca2+-ICR exposure and nifedipine treatment on C2C12 cell differentiation: role of L-type Ca2+channels.
Ca2+-ICR exposure affects the skeletal muscle differentiation proteins
To confirm our mRNAs findings, MYOG, MHC, ASMA, and β-actin protein expression at diverse differentiation levels (undifferentiated, low, and high) was investigated. The MHC and MYOG protein levels showed an increase at 3 and 5 days of exposure (Fig. 8A), resulting statistically significant at day 3 for MHC and at day 5 of exposure for MYOG (Fig. 8B). As reported by the densitometric analysis, ASMA protein synthesis increased, whereas β-actin proteins did not change along the time course (Fig. 8B). Taken together, these results confirm that the C2C12 cell differentiation process is induced by Ca2+ -ICR.
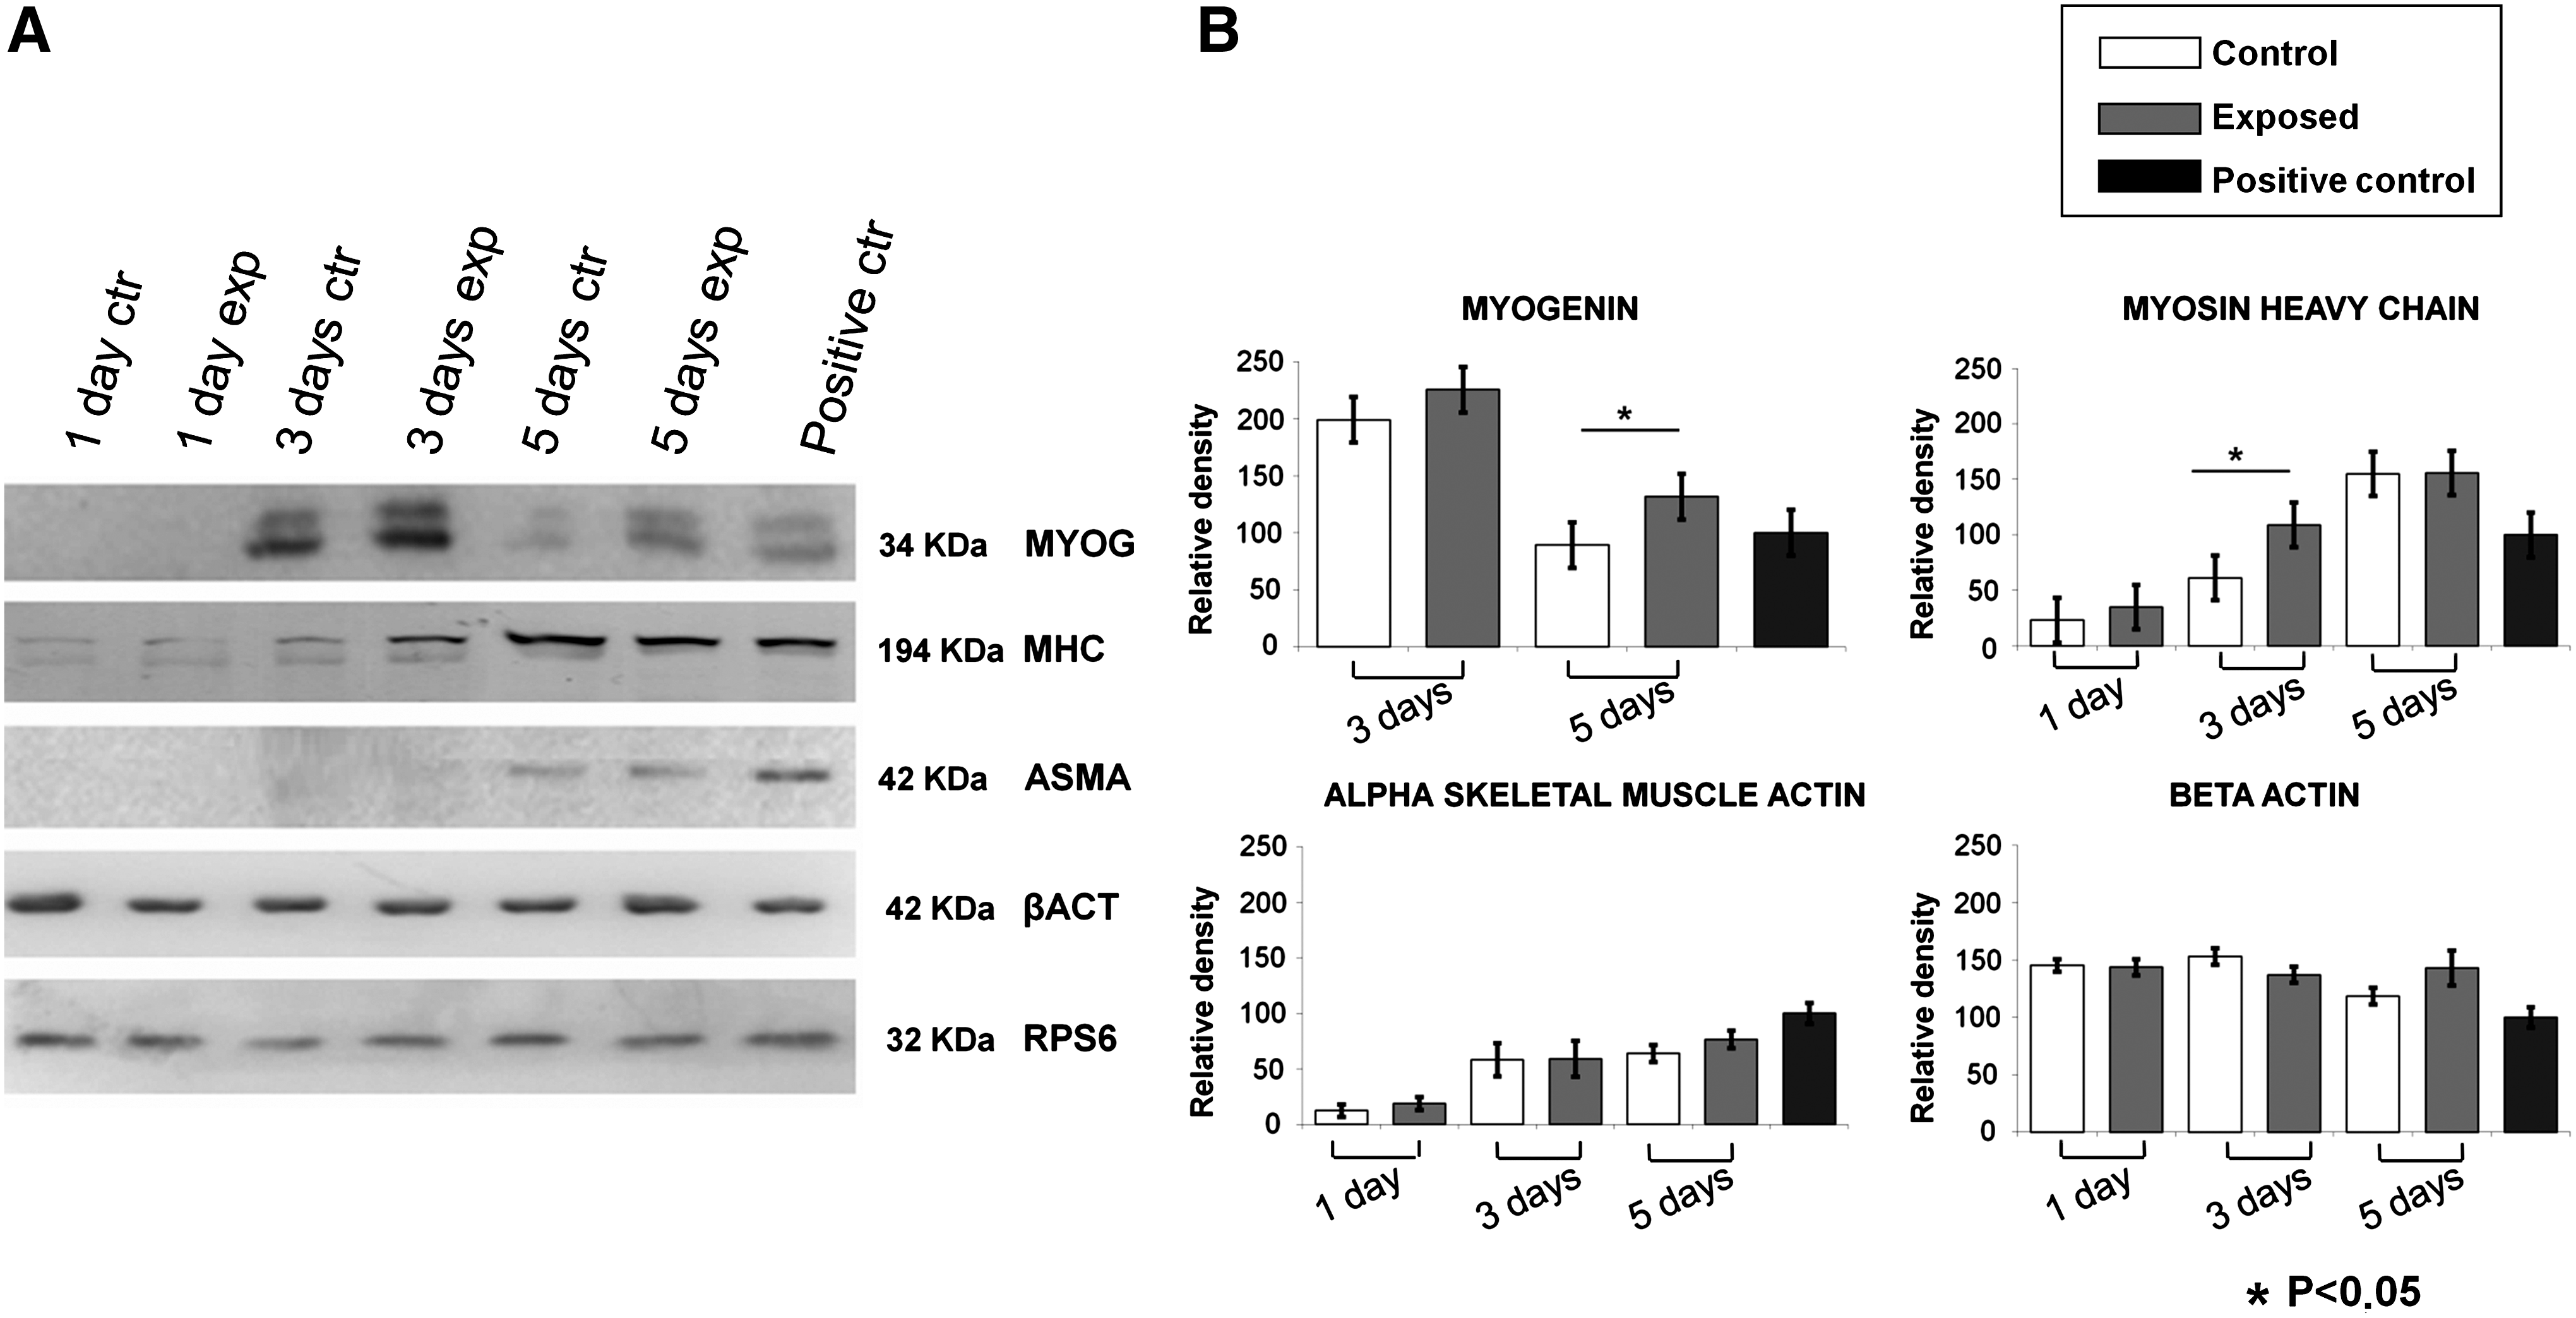
Effect of Ca2+-ICR exposure on C2C12 cell protein expression of myogenic differentiation markers.
Discussion
For a long time, international research groups have studied how biological systems could be affected by EMFs. Nevertheless, results and possible mechanisms involved are still being debated because of the lack of reproducibility and characterization. Lednev reported that reorientation of the membrane phospholipids during the exposure to EMFs could result in the deformation of embedded ion channels, altering their dynamics. He considers as a dipole, an ion in its protein-binding site; when the ion is exposed at its ICR frequency, the energy from the exposure is transferred to the dipole, and as a consequence, the ion could be released in the solution. 39 Accordingly, to this hypothesis and supported by our previous results,26,27 we studied the effect of combined static and sinusoidal EMFs, corresponding to the Ca2+-ICR frequency, on the differentiation of a murine myoblast C2C12 cell line. During skeletal myogenesis, calcium-signaling pathways play a pivotal role; 11 moreover, a direct interaction between cytoskeletal remodeling and ion channel activity is required 40 in this process. In particular, the L-type VGCCs directly affect cytoskeletal remodeling, and the expression of specific myogenic markers such as MYOG, 11 ASMA,41,42 and MCK 43 is also controlled by calcium ion mobilization. 44 It has been reported that C2C12 cell differentiation appears after 5 days of culture in the DM condition by a progressive change in the cell shape and monolayer organization. Fluorescent staining analysis of the differentiating cells reveals a gradual change in the shape and in the bundles of thin filaments, known as the primordial actin anchoration sites, coupled to the actin and myosin protein arrangement.2,45 In our experiments, C2C12 cells growing in a GM show a change from a polygonal to a fusiform morphology after only 3 days of continuous exposure to the Ca2+-ICR frequency. The cells become elongated and oriented in one direction, and at 5 days of exposure, a multinucleated myotube formation appears (Fig. 4). Filamentous actin diffusely distributed all through the cytoplasm in control cells appears much more abundant and concentrated underneath the cell membrane in 3-day exposed cells. A different orientation of the actin network that acquired a more parallel pattern was observed after 5 days of exposure (Fig. 5). These results indicate a possible correlation between the actin cytoskeleton reorganization and the myogenic process induced by Ca2+-ICR exposure.
During the early stages of the differentiation process, the C2C12 cells began to synthesize a large amount of α-actin mRNAs, whereas the β-actin mRNAs decreased.2,46 The above-reported results that suggested the initiation of the differentiation process after Ca2+-ICR exposure were also confirmed at the transcriptional and translational level (Figs. 6 and 8). Indeed, the early and late differentiation markers such as MYOG, MCK, and ASMA were upregulated, whereas β-actin was downregulated with no change in protein synthesis (Fig. 8). The constant expression level of the β-actin protein during the differentiation process is due to its property of being one of the most highly conserved proteins.
Furthermore, the FACS analysis revealed modification of the cell cycle progression, where the exposed cells showed a statistical increase in the G0/G1 phase at day 3, 4, and 5 as a consequence of the increase in the S phase at day 1 and in the G2/M phase at day 2 if compared to control C2C12 cells (Fig. 2).
The increase of the cell percentage at day 1 in the S phase (31.5%) and at day 5 in the G0/G1 phase (75%), compared to control cells (38%, S phase and 68%, G0/G1 phase), was also confirmed by the BrdU assay (Fig. 3). All these results highlighted that in the C2C12 cells, the accelerated withdrawal from the cell cycle at a late time results from the initial proliferative effect of Ca2+-ICR exposure.
One of the most well-defined effects of EMF on biological systems is the Ca2+ homeostasis process acting on the physical regulation of skeletal repair.47,48
Liboff et al.13,14 reported that the Ca2+-ICR exposure modulated the Ca2+ channels on the cellular membrane; subsequently, Rozek et al. 49 highlighted that the enhancement of intracellular Ca2+ due to Ca2+-ICR exposure could be antagonized by nifedipine treatment. This effect was verified a few years later by our own group on pituitary cells, 26 demonstrating that the increase in calcium ions can modulate AtT20 cell differentiation and that during the process, the L-type Ca2+ channels play a pivotal role. The present study provides further evidence that the enhancement of the C2C12 cell differentiation, upregulated by Ca2+-ICR exposure, is correlated to the L-type Ca2+ channels. As reported in Figure 7, C2C12-exposed cells pretreated with nifedipine show downregulation of early and late muscle differentiation markers, previously upregulated by Ca2+-ICR exposure, confirming an involvement of Ca2+-mediated mechanisms.
In conclusion, we demonstrated that Ca2+-ICR exposure is able to drive C2C12 cell myogenesis both at transcriptional and translational levels through the increase of cell proliferation. These results suggest that a physical agent such as Ca2+-ICR can be used as a new tool in regenerative medicine. The advantage is that it is able to trigger stem cell differentiation, without all the negative side effects due to genetic or pharmacological manipulations in cell transplant protocols.
Footnotes
Acknowledgments
We thank Dr. Emanuela Rosola for her help in cell culture, Dr. Maurizia Caruso for supplying mAb MF20, and Mr. Francesco Reale and Marco Chiacchierini for technical support. Moreover, the authors are grateful to Antonella Greco for copyediting/proofreading the English in this article.
Disclosure Statement
No competing financial interests exist.