
Abstract
To determine the signal transduction pathways involved in chondrocyte migration and their effects on cartilage integration in autologous chondrocyte implantation. Articular chondrocytes were divided into three inhibitor groups pretreated with different inhibitors to Src, phospholipase Cγ1 (PLCγ1), and extracellular signal-regulated kinase (ERK)1/2 signaling pathways and one control group pretreated with vehicle. The effect of these pathways on chondrocyte migration was first explored by Boyden chamber assay, and then by an in vitro cell/ring integration model. Chondrocyte migration was visualized and quantified by cell tracking, and the activity of Src, PLCγ1, and ERK1/2 was determined by Western blotting. The effect of these pathways on cartilage integration was evaluated histologically, biochemically, and biomechanically. Boyden chamber assay revealed that the number of migrated cells was significantly increased in the control group without inhibitors. In an in vitro integration model, the implanted chondrocytes were observed to migrate through the interface and infiltrate into the native cartilage. Additionally, chondrocyte migration could be improved in the absence of inhibitors After 4 weeks of culture, the control group demonstrated a significantly higher cellularity, larger amount of chemical content deposition, stronger extracellular matrix staining in the integration zone, and higher integrative strength as compared to the inhibitor groups. Western blotting demonstrated that the Src-PLCγ1-ERK1/2 signaling pathway was promoted in the integration process. This study is the first to show that the Src-PLCγ1-ERK1/2 signaling transduction pathway is involved in cartilage tissue integration by affecting chondrocyte migration. Our results raise the importance of the chondrocyte migration enhancement therapy or the development of new agents specifically targeting the pathways to ensure long-term functionality of the restored joint surface.
Introduction
Some methods, such as collagenase predigestion of host cartilage 6 and growth factor (for example, platelet-derived growth factor, insulin growth factor) stimulation,7–9 have been advocated to facilitate chondrocyte migration into the native cartilage. Ng et al. 4 found that the polyvinyl alcohol scaffold could promote chondrocyte migration and interface formation in an in vitro cartilage defect model. Thus, chondrocyte migration can be accelerated by altering the extracellular environment, but chondrocyte migration is also regulated by a network of intracellular signaling pathways. 10 To our knowledge, the exact intracellular molecular mechanism involved in chondrocyte migration in the context of cartilage integration has not been reported.
Many intracellular signal pathways have been reported to be involved in chondrocyte migration. 10 Extracellular signal-regulated kinase (ERK) is a serine and threonine kinase and its activity has been found to be associated with the migratory ability of chondrocytes. Src is a tyrosine protein kinase, which regulates many downstream signaling proteins. Whitney found that chondrocyte migration could be enhanced by ultrasound through a mechanotransduction pathway involving Src and ERK, and Src was an upstream mediator of ERK. 11 Phospholipase Cγ1 (PLCγ1) is one of the serine threonine kinases of PLC and it's activation has recently been found to be associated with improved chondrocyte migration under periodic mechanical stress with Src as an upstream activator and ERK as a downstream target. 12 Up to date, it remains unknown whether the Src-PLCγ1-ERK1/2 signaling pathway is also involved in chondrocyte migration in an in vitro cartilage integration model.
Based on the above findings, we hypothesize that the Src, PLCγ1, and ERK1/2 signaling proteins are responsible for the implanted chondrocyte migration, which then will have a beneficial effect on cartilage integration. As the effects of these signaling proteins on cartilage integration are determined, a new treatment regimen, which enhances the targeting protein expression by a gene transfer technique or Micro RNA intervention, will be available so as to improve the clinical results of autologous chondrocyte implantation (ACI).
Materials and Methods
Cartilage integration construct assembly and culture
An established construct in a cartilage-ring model was applied as described previously. 13 Articular cartilage was aseptically harvested from the femoropatellar joints of young pigs (7 months old). Cartilage rings (Ø 6×2 mm thickness) with a 3-mm inner hole were created as cartilage explants. The cartilage tissues, left after harvesting the explants, were used for chondrocyte isolation. Cells were expanded in a monolayer for 1 week and for all the experiments, cells from passage 2 were used. Cartilage rings and chondrocytes were harvested from 20 different animals, and each integration construct was formed from one same animal. The explants and cells were incubated in the Dulbecco's modified Eagle medium (DMEM)-F12 culture medium supplemented with 10% fetal bovine serum (FBS; Gibco), 200 mM glutamine, 50 μg/mL ascorbate, penicillin, and streptomycin in an incubator at 37°C and 5% CO2. In some experiments, the chondrocytes were given a 30-min pretreatment with the Src inhibitor PP2 (10 μM; Cayman; PP2 group), PLCγ1 inhibitor U73122 (10 μM; Enzo; U73122 group), ERK1/2 inhibitor PD98059 (50 μM; Enzo; PD98059 group), or an equivalent amount of solvent control dimethylsulfoxide (DMSO, 0.1% v/v; Sigma; control group), respectively. About 10 μL of them (1.25×10⁶) was then added into the central hole of the explant rings. These cell-pretreated hybrid constructs were then cultured in the same culture medium as described above, except that the inhibitors or control solvent was added 30 min before the addition of the culture medium. In the other experiments, the explant rings were pretreated with one of the three inhibitors for 7 days, and then the chondrocytes were added. These ring-pretreated hybrid constructs were then cultured in the culture medium with no inhibitors added. For all the experiments, the medium was changed every 2 days for the duration of 28 days of culture.
Assessment of chondrocyte migration and optimization of inhibitor concentration by Boyden chamber assay
A 24-well chemotaxis chamber (8-μm pore size; Coring) was used. Before performing the migration assay, the passage 2 chondrocytes were serum-starved for 12 h, followed by pretreatment with the different inhibitors or DMSO. A volume of 100 μL (1×10⁶ cells/mL) from each sample was added to the upper chamber. The medium containing 1 mL of the DMEM with 10% FBS was added to the bottom chamber. After a 16-h incubation, the cells on the lower surface of the membrane were quantified by staining the cells with 0.1% (w/v) crystal violet dye.
Cell labeling and analysis of chondrocyte migration
After pretreated with different inhibitors or DMSO, the chondrocytes were labeled with the fluorescent dye PKH26 (4 μM; Sigma) following the manufacturer's description. Briefly, 10×106 cells were resuspended into 1 mL of dilution buffer in the labeling kit. The cell suspension was mixed with the same volume of the labeling solution containing PKH26. The labeling reaction lasted for 7 min before being stopped by adding 1 mL of FBS. The chondrocytes were then readjusted to the above-described concentrations and seeded into the defect of the explant ring.
After 4 weeks of culture, cryosections of the integration constructs were visualized using a confocal laser scanning microscope (Zeiss; LS710). The chondrocyte migration capacity was analyzed by histomorphometry using Aim Image Brower Software and evaluated by two indices: the maximum cell migration distance index and the maximum migrating cell number index. The maximum cell migration distance was determined by drawing a circular perimeter from the inner edge of the explant ring and then extending a radius from the circle to the labeled cell that was judged to have migrated the farthest to the native cartilage. The labeled cells located in a 0.2×0.2-mm square-shaped area centered over the integration interface, were counted. Five randomly chosen fields per section were calculated and the maximum measurement was recorded.
Histology and immunohistochemistry
Samples for histology were stained with hemotoxylin and eosin (HE) and Safranin O. Immunohistochemical staining was performed to verify the presence of collagen II and collagen I. Briefly, slides were rinsed with phosphate-buffered saline (PBS), quenched of peroxidase activity, and blocked with goat serum for 2 h. Sections were then incubated overnight with mouse monoclonal anti-collagen I (clone ab90395, 1:400 dilution; Abcam) or mouse monoclonal anti-collagen II (clone ab3092, 1:100 dilution; Abcam), followed by a 1-h treatment with the secondary goat anti-mouse polyclonal antibody. Then, the sections were exposed to the Peroxidase DAB substrate kit (Vector Laboratories). The first antibody was replaced by PBS to serve as a negative control and the chondrocytes from the normal cartilage were used as a positive control.
Western blot analysis
After 4 weeks of culture, the engineered cartilage tissues were harvested and homogenized in the RIPA lysis buffer. Homogenates were clarified by centrifugation (13,000 g) for 10 min at 4°C, and the supernatants were removed and analyzed for protein concentrations using a Bradford assay. Protein samples were resolved by sodium dodecyl sulfate–polyacrylamide gel electrophoresis and transferred to nitrocellulose membranes. The blots were probed with the indicated primary antibodies (anti-Src, anti-phospho-Src, anti- PLCγ1, and anti-phospho-PLCγ1 antibody, 1:1000 dilution; Santa Cruz; as well as anti-ERK1/2, anti-phospho-ERK1/2 antibody, 1:1000 dilution; CST) at 4°C overnight, followed by the horseradish peroxidase-conjugated secondary antibody at room temperature for 1 h. Finally, proteins were detected using the Gel Imaging System (UVP Company) and measured using Gel-Pro Analyzer software (Media Cybernetics).
Mechanical testing
The integrative strength of the native/engineered tissue interface was measured by the push-out test, performed using the ELF3200 system (Enduratec) and was calculated as the failure stress. Briefly, the integration construct was rested on a custom-made rigid ring with a 4-mm-diameter central hole (Changzhou Orthopedics Instrument Factory). The regenerated core was then pushed out by a plunger with a diameter (2.5 mm) slightly less compared with the core. The maximum force recorded before separation of the interface was normalized to the lateral surface area of the core, and the resulting value was considered the failure stress.
Biochemical assay
The engineered cartilage cores, separated from the explant rings after mechanical testing, were prepared for biochemical assay. The core was first cut with a 2-mm dermal punch, and a peripheral ring (3-mm outer diameter and 2-mm inner diameter) was generated and defined as the integration zone. Both the entire core and the integration zone were analyzed. All samples were digested by papain (125 μg/mL) at 60°C for 18 h. The glycosaminoglycan (GAG) content was quantified by the 1,9-dimethylmethylene blue dye binding assay kit (Biocolor Ltd.). The DNA content was determined by the Hoechst 33258 dye method using the DNeasy blood tissue assay kit (QIAgen). The total collagen content was determined by measuring the hydroxyproline content, using a hydroxyproline-to-collagen ratio of 1:7.69. Each constituent (DNA, GAG, and collagen) was normalized to the tissue wet weight.
Gene expression analysis by quantitative reverse transcription–polymerase chain reaction
RNA was extracted from the central cores using Trizol (Invitrogen) according to the manufacturer's protocol. The primer sequences specific for the target genes (MMP-1, MMP-3, MMP-13, ADAMTS-4, ADAMTS-5 and ColII, ColI, AGN) and the internal control gene (glyceraldehyde-3-phosphate dehydrogenase) were designed based on GenBank cDNA sequences. Briefly, the mRNA was converted to cDNA, and the real-time polymerase chain reaction (PCR) was performed in an ABI 7500 (Applied Biosystems) with One Step SYBR PrimeScript reverse transcription–polymerase chain reaction (RT-PCR Kit; TaKaRa) under respective conditions, and the fluorescence intensity was recorded for 40 cycles. The comparative 2−ΔΔCт method was used to calculate the relative expression of each target gene.
Terminal deoxynucleotidyl transferase dUTP nick end labeling staining and flow cytometry quantification for chondrocyte apoptosis
After 4 weeks of culture, samples were collected to evaluate the chondrocyte apoptosis, which was determined by terminal deoxynucleotidyl transferase dUTP nick end labeling (TUNEL) assay using a kit from Nanjing KeyGEN Biotech Co. Ltd. Apoptotic chondrocytes were quantified by fluorescence-activated cell sorting (FACS) analysis using the Annexin V-PE apoptosis detection kit (Nanjing KeyGEN Biotech Co. Ltd.). All experiments were performed according to the manufacturer's protocol.
Statistical analysis
The mean±standard error was calculated for each group of samples and all data were assessed for normal distribution using the Anderson–Darling test (p>0.05). Statistical significance was calculated using a one-way analysis of variance and post-test, where p<0.05.
Results
Effects of Src, PLCγ1, and ERK1/2 pathways on chondrocyte migration during Boyden chamber assay
To elucidate the dose–response effects of the inhibitors on chondrocyte migration, the cells were pretreated with different concentrations of inhibitors for 30 min and were then added to the upper chamber. The number of migrated cells within 0.25 mm2 field of the undersurface of the membrane was calculated. As shown in Figure 1, increasing the concentration of each inhibitor resulted in decreased numbers of migrated cells until a plateau was reached. In all of the three cases, chondrocyte migration suppression reached a plateau at a concentration of 10 μM PP2, 10 μM U73111, and 50 μM PD98059, whereafter no or only a slight decrease of migration could be observed (Fig. 1A). Therefore, in all subsequent experiments, 10 μM PP2, 10 μM U73111, and 50 μM PD98059 were used. The number of migrated chondrocytes was decreased in the presence of the Src inhibitor PP2 and PLCγ1 inhibitor U73111 when compared with the control group without inhibitors (p<0.05), especially, the ERK1/2 inhibitor PD98059 had the greatest inhibitory effect with nearly 50% decline of the migrated chondrocyte number (Fig. 1B, C, p<0.01).
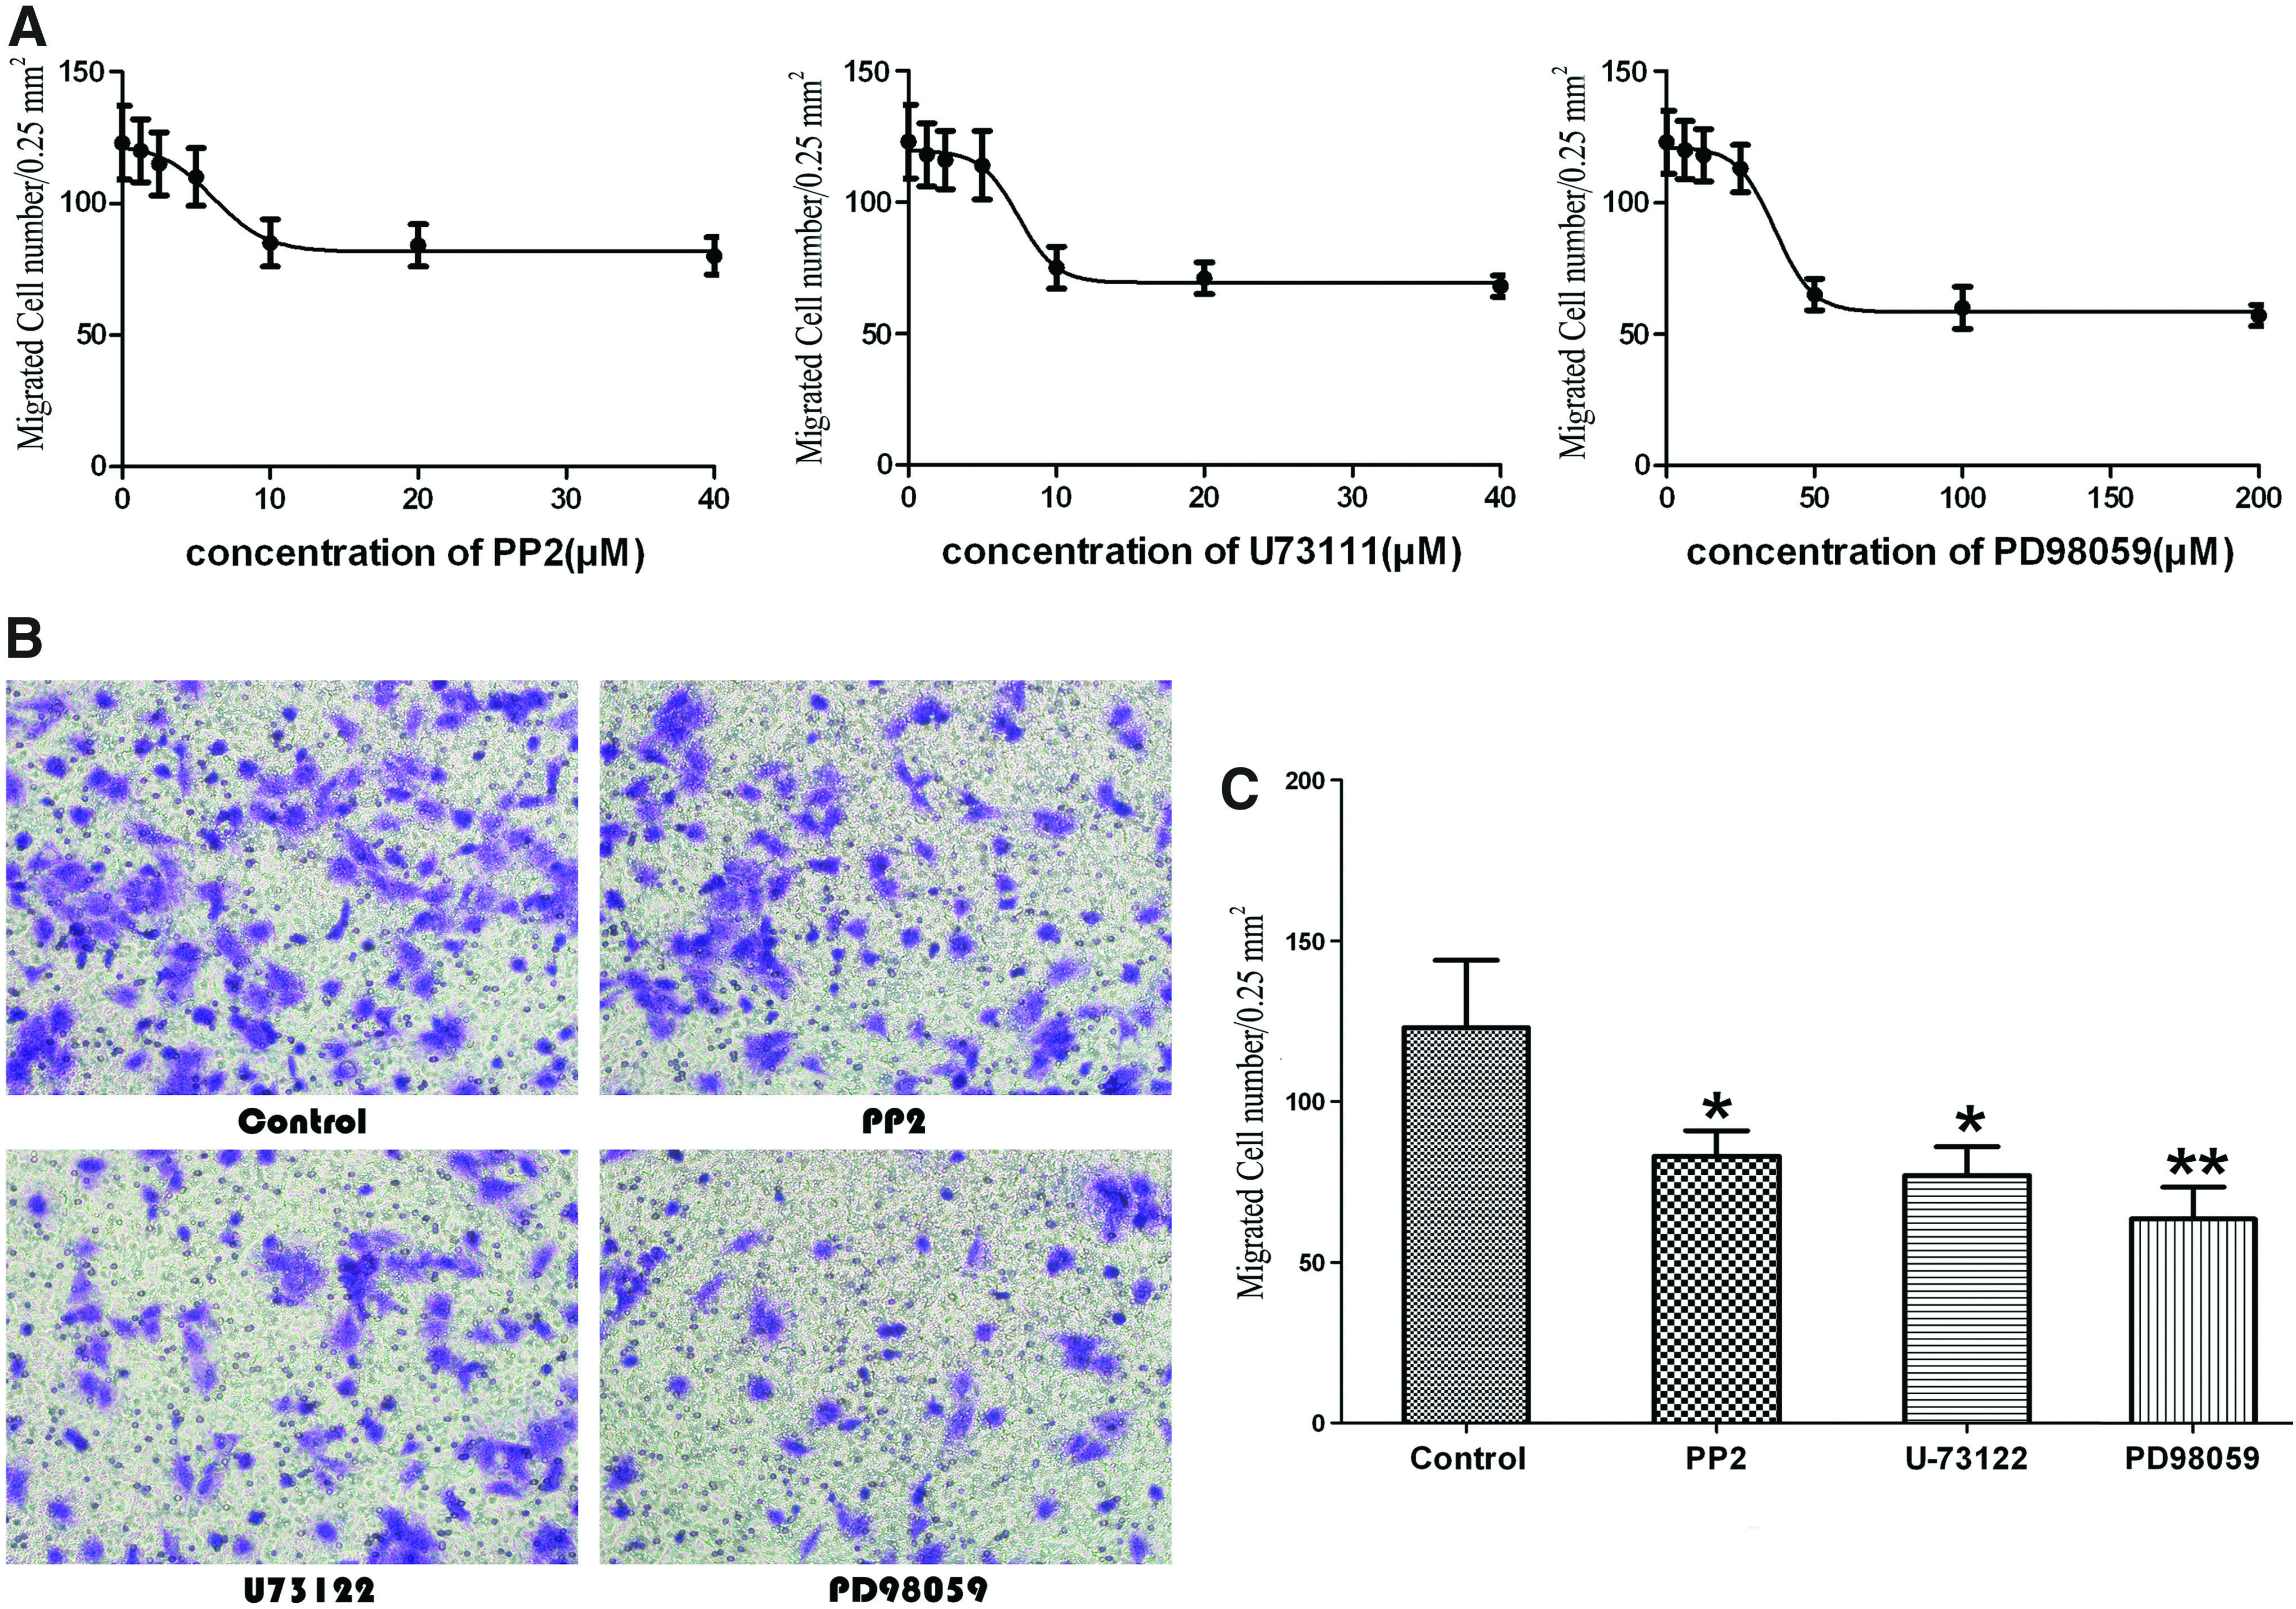
Effects of Src, phospholipase Cγ1 (PLCγ1), and extracellular signal-regulated kinase (ERK)1/2 on chondrocyte migration by Boyden chamber assay.
Effects of Src, PLCγ1, and ERK1/2 pathways on chondrocyte migration in the in vitro integration model
To determine the extent of cell migration into the native cartilage rings, chondrocytes were labeled with PKH26 and monitored using fluorescence microscopy. By 2 weeks of incubation, almost all of the PKH-labeled chondrocytes were observed to be within the central defect in the four groups, but differences still existed as the chondrocytes in the control group migrated close to the integrative interface. After another 2 weeks of culture, the labeled chondrocytes were observed to have migrated across the interface and infiltrated into the host explants in all four groups (Fig. 2A). In contrast to the other three groups with inhibitors to Src, PLCγ1, and ERK1/2, the control group not only achieved a higher maximum migrating cell number index (p<0.05, Fig. 2B), as shown by the number of labeled cells in the integration region (Fig. 2A), but also had a higher maximum cell migration distance index (p<0.05, Fig. 2C), as shown by the largest distance that the labeled cells infiltrated into the native cartilage (Fig. 2A). A similar trend was also found by histological analysis. For HE and Safranin O staining, much more chondrocytes were observed near the interface in the control group without inhibitors (Fig. 2D).
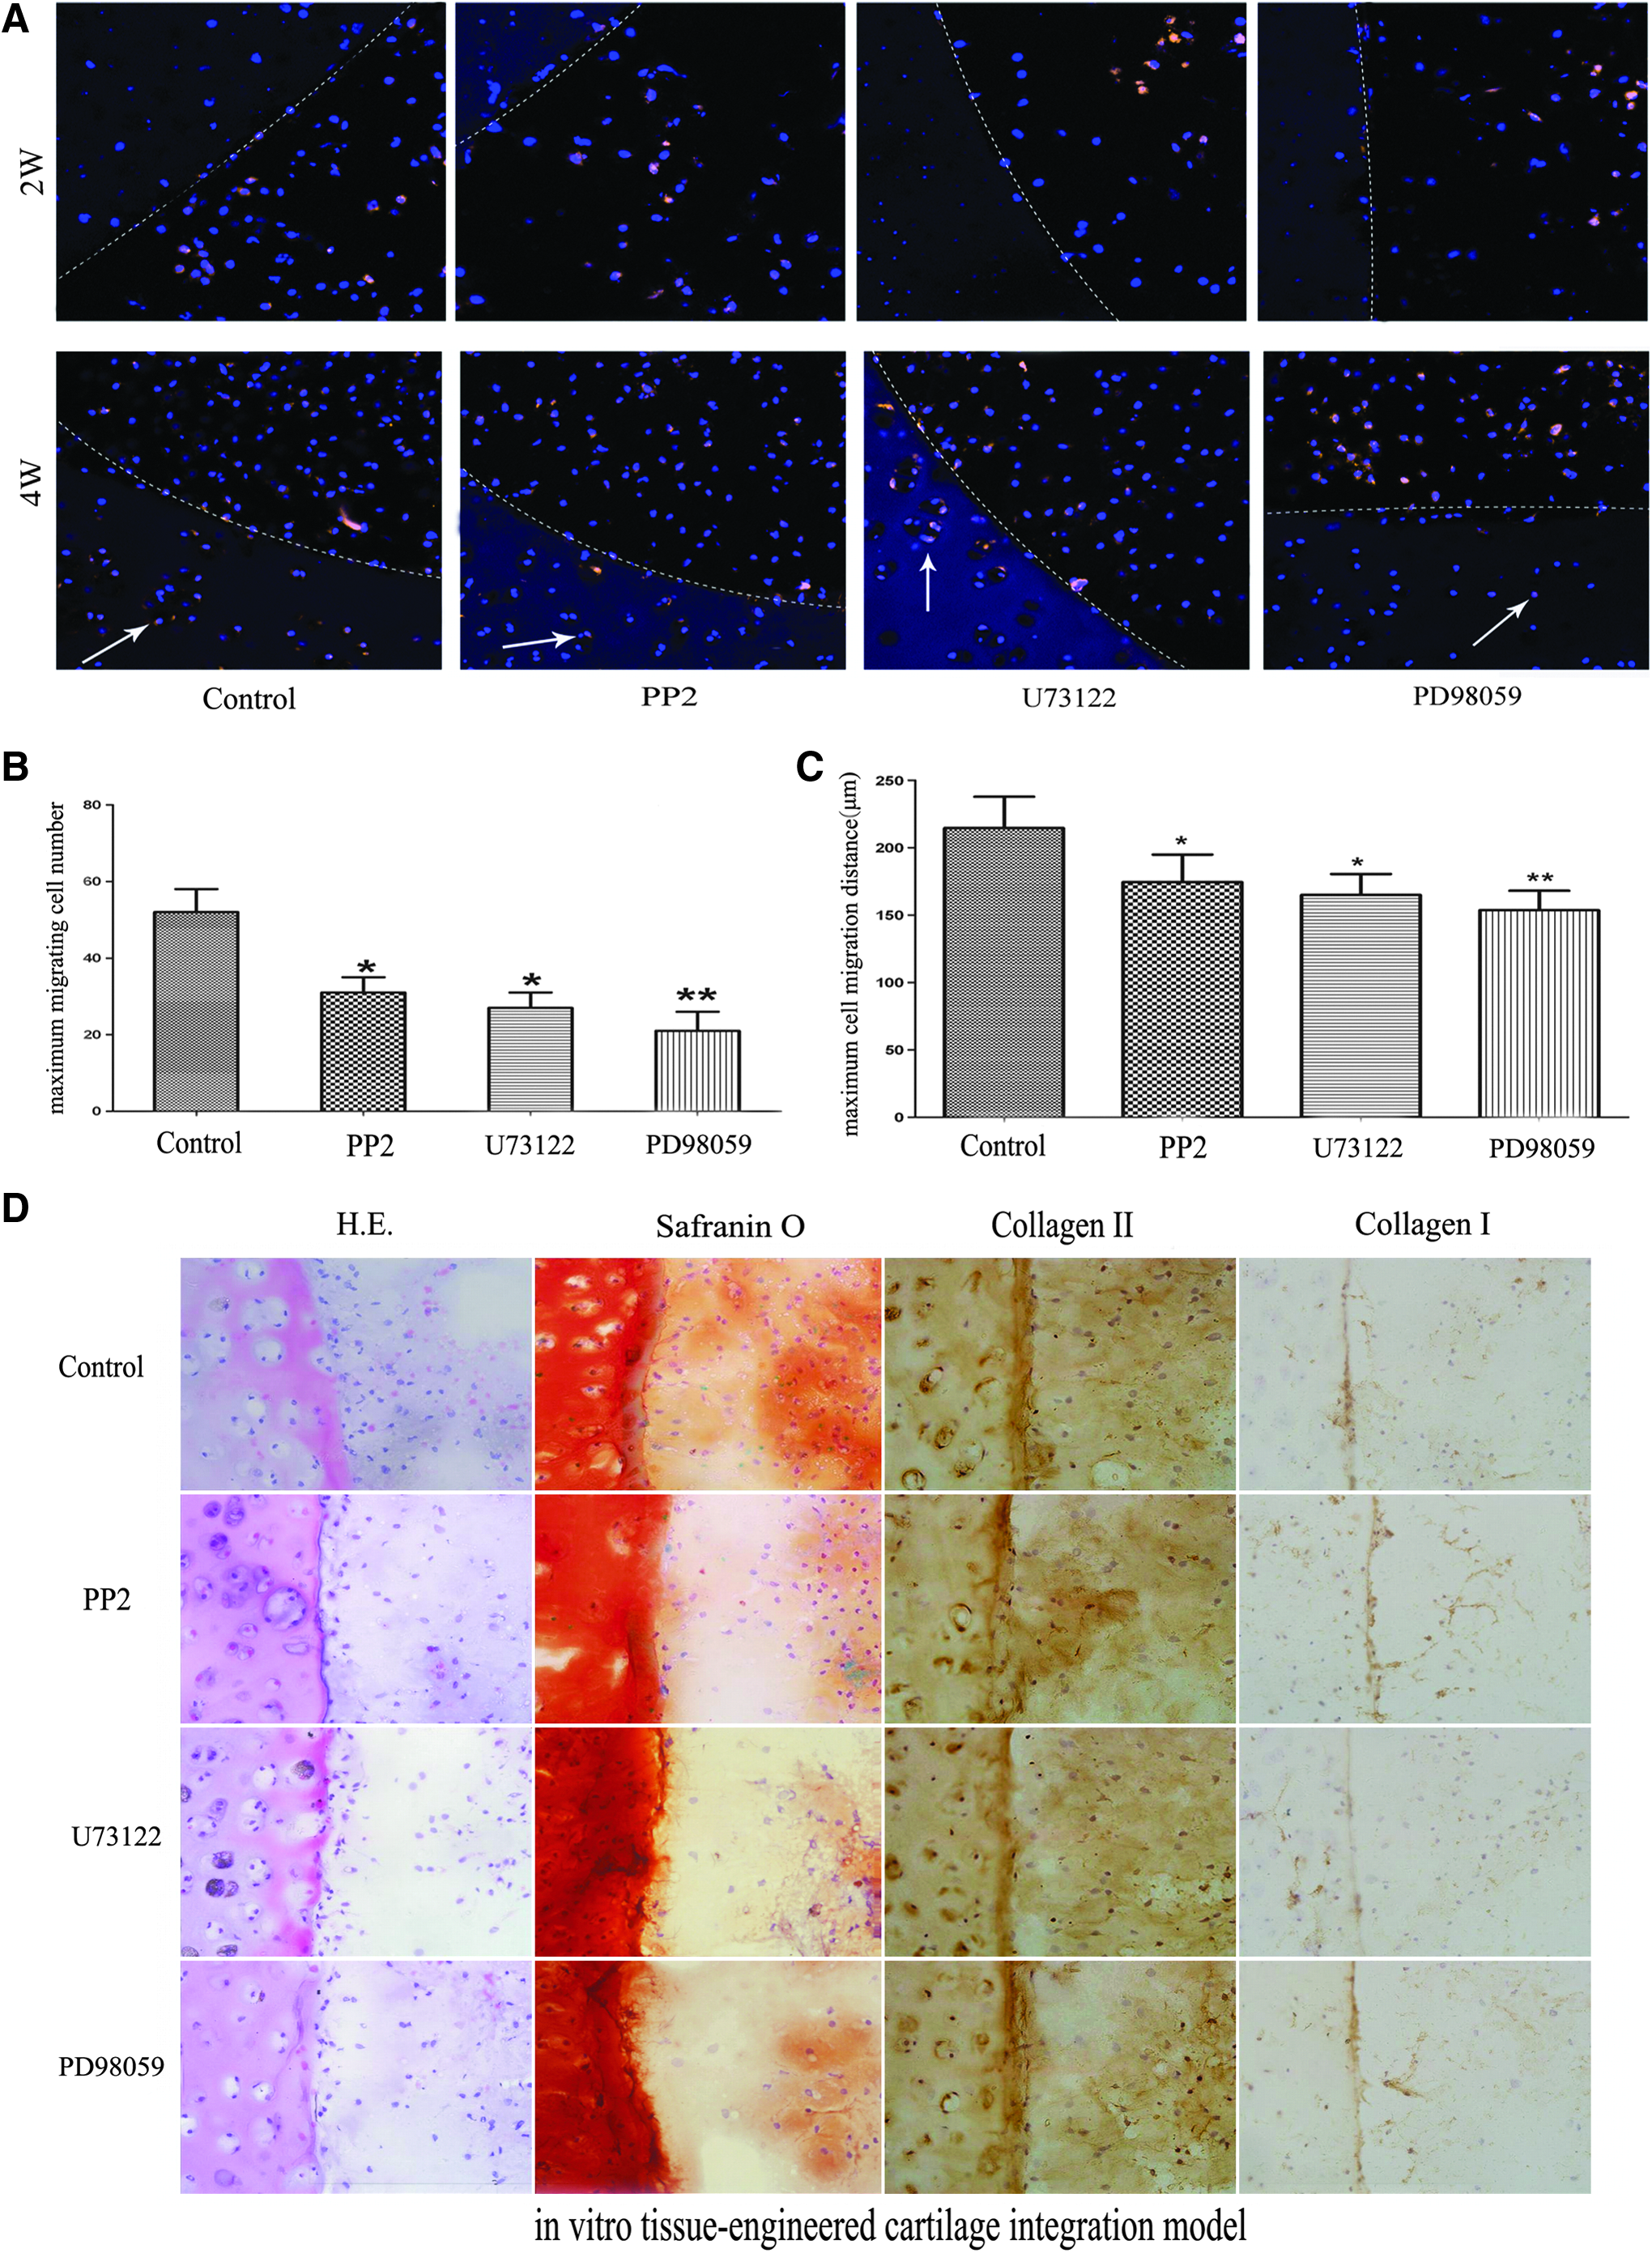
Effects of Src, PLCγ1, and ERK1/2 on chondrocyte migration
Effects of Src, PLCγ1, and ERK1/2 pathways on the biochemical properties of the engineered cartilage in the integration zone
After 4 weeks of culture of the hybrid construct, the regenerated tissues in the central defect were harvested for the gene level and protein level analysis. No difference was found in terms of the mRNA expression levels of the cartilage constituent (collagen and aggrecan) of the entire regenerated cores between the four groups with or without inhibitors (p>0.05, Fig. 3A). The ratio of the collagen II to collagen I mRNA expression level was also found to be identical (p>0.05, Fig. 3A). Similar to the RNA results, the collagen and GAG contents of the entire cores remained unchanged between the four groups (p>0.05, Fig. 3B). However, both the collagen and GAG contents of the integration zone were adversely reduced in any of the inhibitor-treated groups (PP2, U73111, and PD98059) as compared with the inhibitor-free control group (p<0.05, Fig. 3B). Although no differences of total DNA contents of the entire cores were seen between the four groups (p>0.05, Fig. 3B), differences could still be found of the integration zones with higher DNA contents achieved by the control group without inhibitors (p<0.05, Fig. 3B). To explore the role of the cartilage ring on integration, the explant rings were pretreated with one of the inhibitors (PP2, U73111, and PD98059) or with the DMSO vehicle for 7 days, and then the cells were seeded. The hybrid constructs were cultured without inhibitors. Surprisingly, no differences were found of the three composites (collagen, GAG, and DNA) of the entire cores between the ring-pretreated groups and the cell-pretreated groups or the control group (p>0.05, Fig. 3B). Although the three composites of the integration zone in the ring-pretreated group were slightly less compared with the control group without inhibitors, the differences were not significant (p>0.05, Fig. 3B). The ring-pretreated group demonstrated a significantly higher collagen, GAG, or DNA content accumulation in the integration zone as compared to the cell-pretreated group with the same inhibitor (PP2, U73111, or PD98059) applied (p>0.05, Fig. 3B). The ratios of GAG to DNA content remained steady between any of the above-mentioned groups when different inhibitors (control, PP2, U73111, or PD98059) or different pretreatment (cell or ring) as well as different locations (entire core or integration zone) were evaluated (p>0.05, Fig. 3B). Histological analyses were consistent with the biochemical results. Intensive staining of Safranin-O (indicating the presence of proteoglycan) and collagen II was shown surrounding the interface in all of the four groups with or without inhibitors, but a much more intensive staining around the interface was only visualized in the control group without inhibitors (Fig. 2D). Although collagen I staining at the interface region was relatively weak in any group, the control group still had a little bit stronger staining when compared to the other inhibitor-free groups (Fig. 2D).
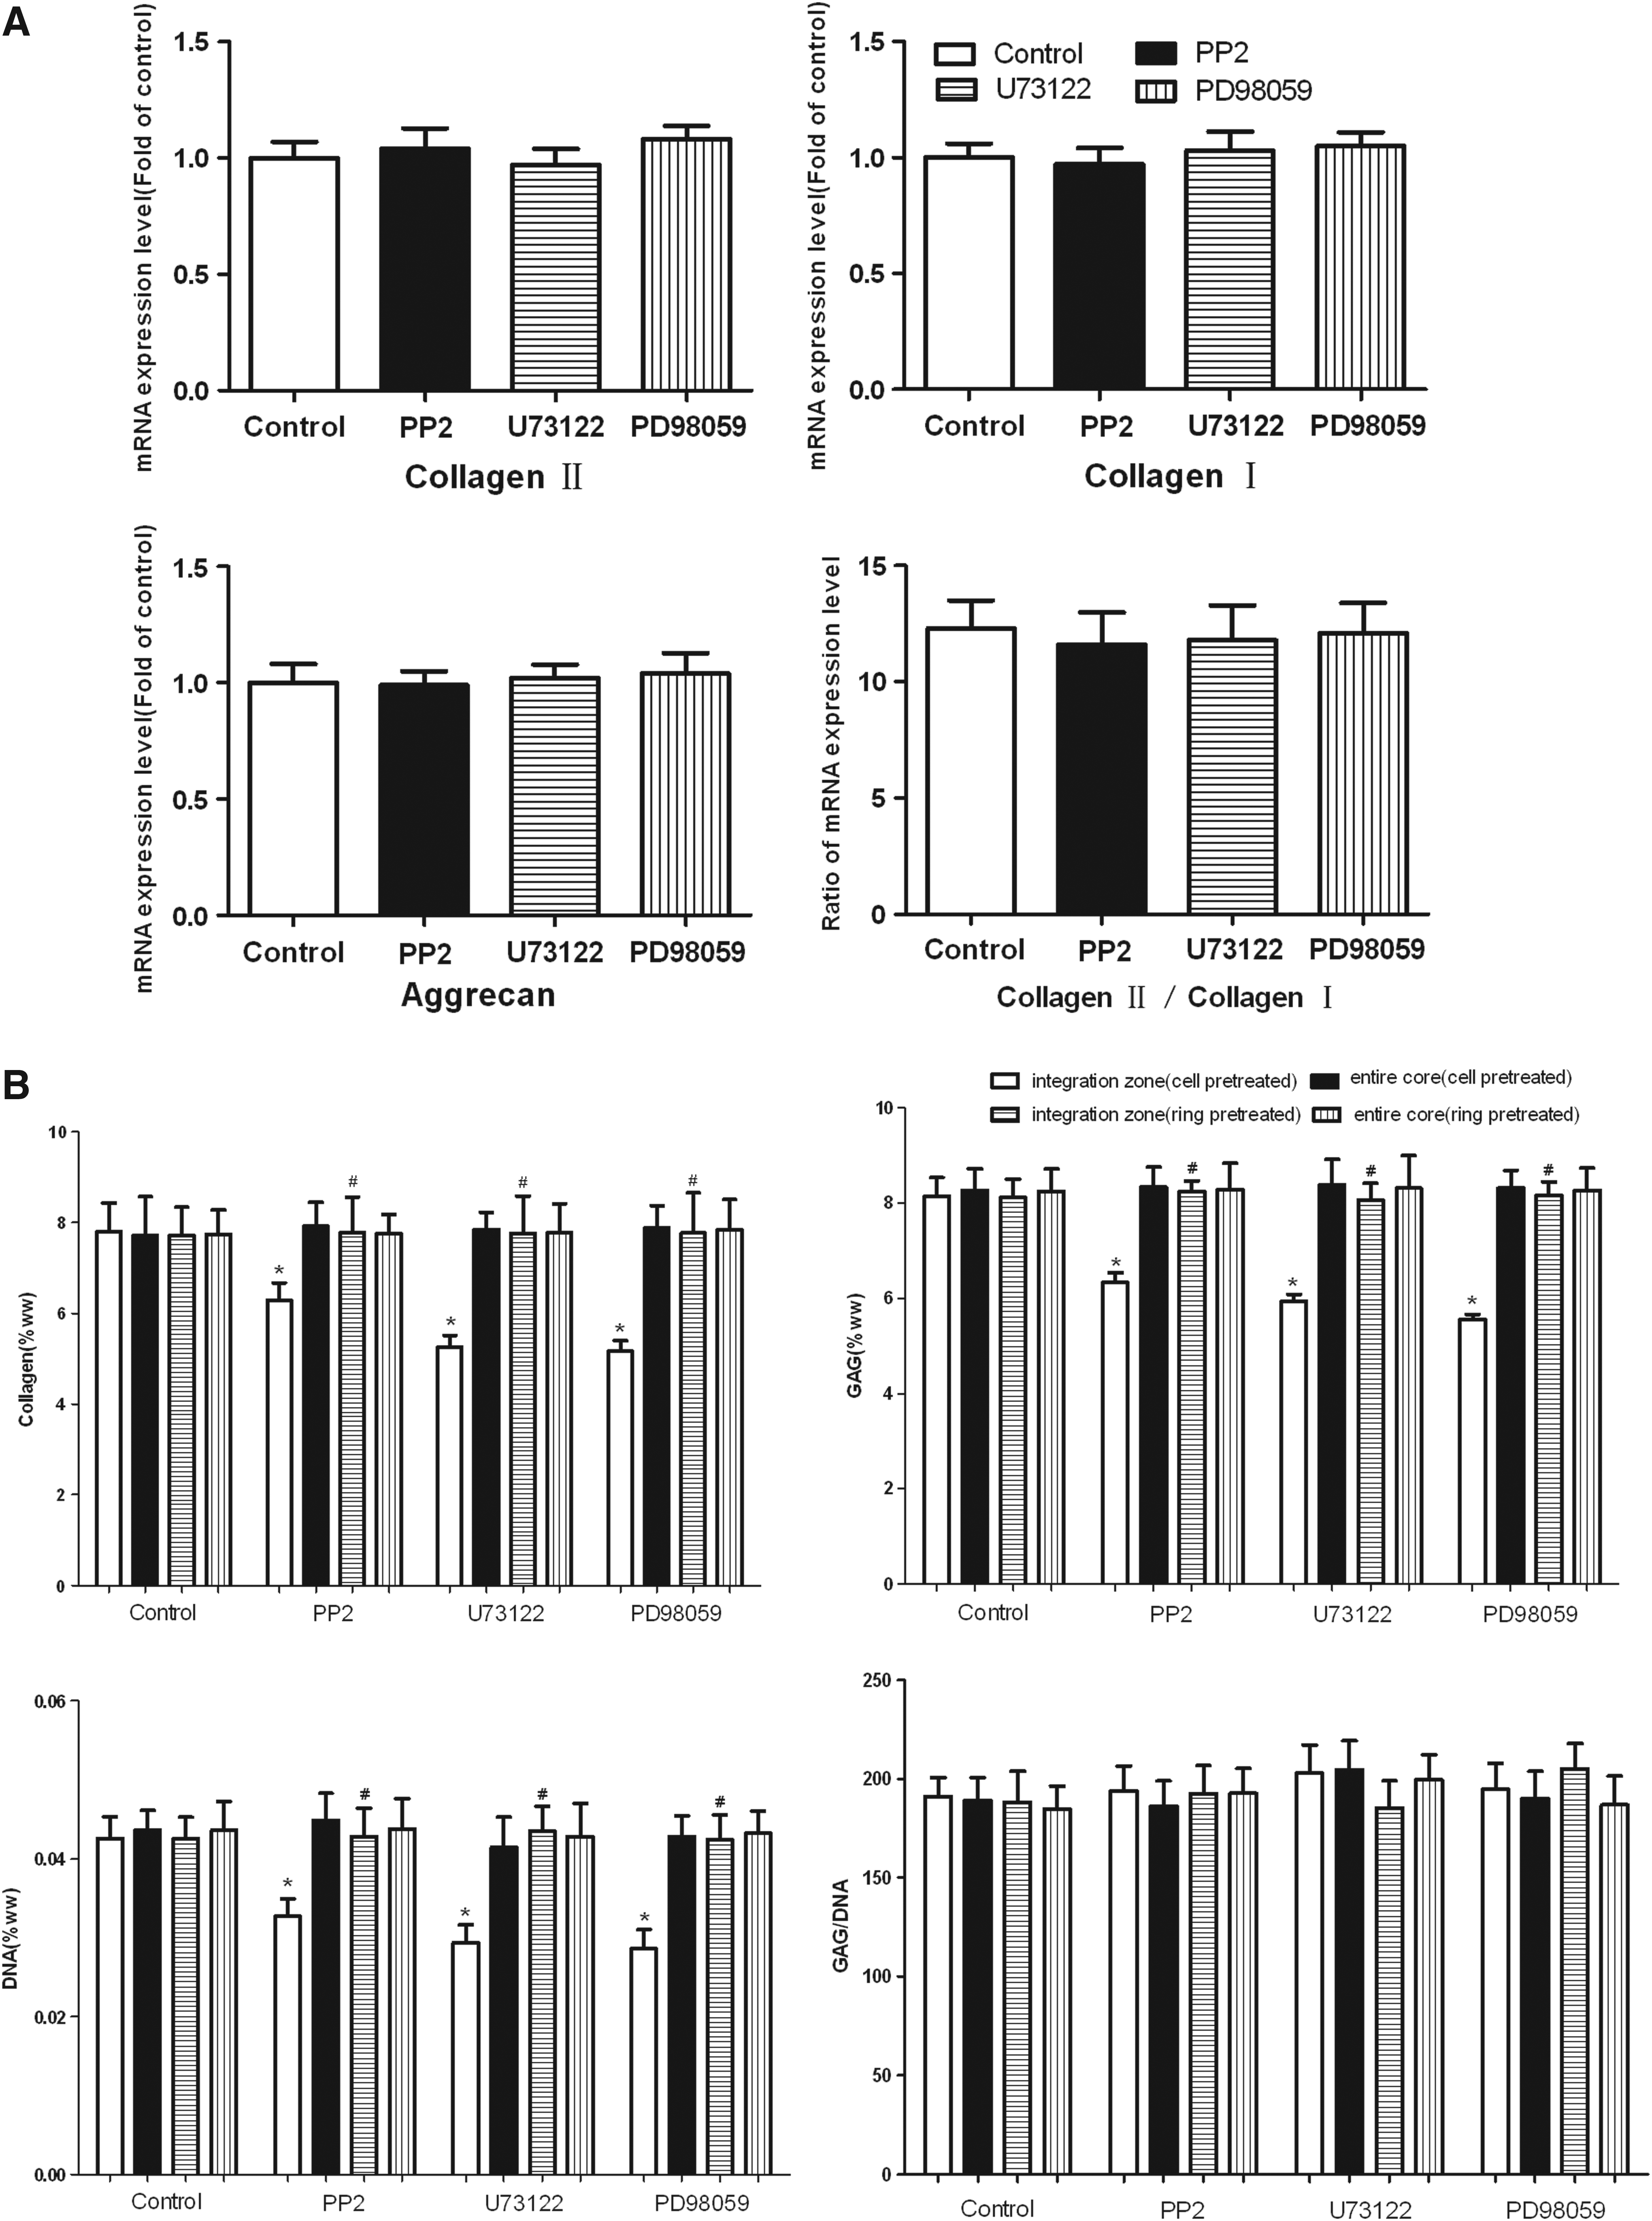
Effects of Src, PLCγ1, and ERK1/2 pathways on the biochemical properties of the engineered cartilage.
Effects of Src, PLCγ1, and ERK1/2 pathways on tissue integration of the engineered cartilage
The integration strength of the control group without inhibitors was higher than any of the other groups with inhibitors to the Src, PLCγ1, and ERK1/2 pathways (p<0.05, Fig. 4). Some explant rings were pretreated with inhibitors (PP2, U73111, or PD98059) for 7 days before implantation of the cells. As compared to the integration strength of the cell-pretreated groups, the ring-pretreated groups achieved significantly higher values, which were also as same as that of the control group (p>0.05, Fig. 4). In histology, after 4 weeks of culture, the interface demarcation line in the control group became faint as the regenerated tissue and the native cartilage was slowly integrated to be a tissue continuum. In contrast, the interface demarcation line was still visible in the other three groups with inhibitors. Extracellular matrix remodeling on the explant interface was visualized in many samples, especially, universally viewed in the inhibitor-free group, which facilitated the chondrocyte infiltration into the native cartilage. Interestingly, the cells attaching to the interface had a similar morphology as the implanted cells, while the cells invading the explant gained a similar morphology as the resident cells because the morphology of all cells in the explant ring was almost identical. Importantly, all of the cells in all samples showed sphere-shaped morphology mimicking the characteristics of chondrocytes. (Fig. 2A, D).
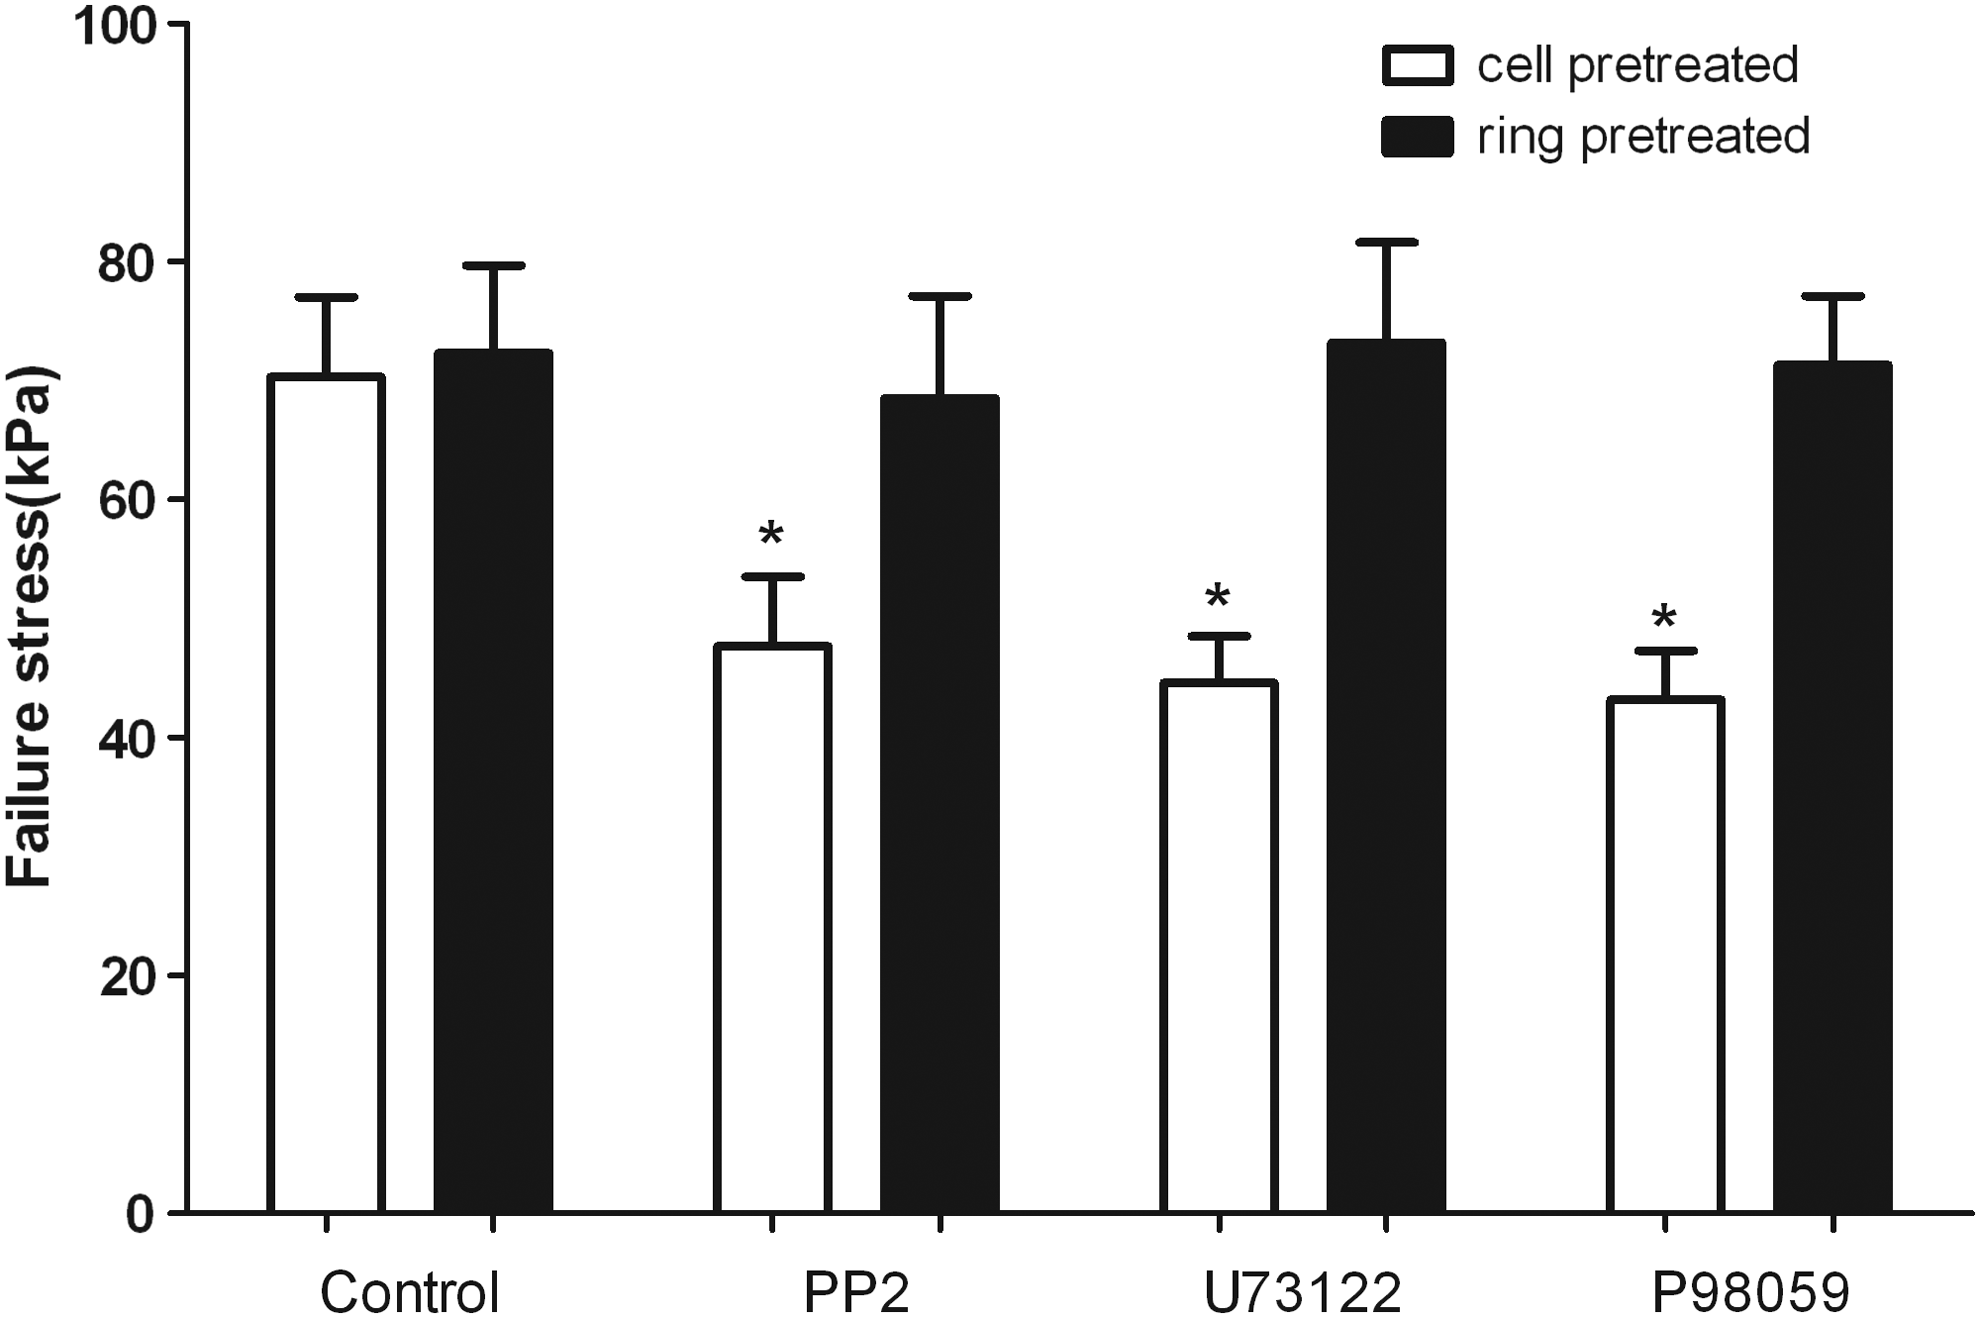
Effects of Src, PLCγ1, and ERK1/2 pathways on integration strength. The control group demonstrated higher failure stress as compared to the other three groups with inhibitors. Ring pretreatment with the inhibitors seemed to have no influence on integration as differences were not demonstrated in terms of the integration strength between the ring-pretreated group and the control group. *p<0.05 versus control. Values are mean±SD (n=10).
Src, PLCγ1, and ERK1/2 pathways were promoted in sequence in the in vitro integration model
After 4 weeks of culture of the hybrid constructs, the central cores were harvested for Western blotting to demonstrate the activating sequence of Src, PLCγ1, and ERK1/2 pathways. In the PP2 group, the phosphorylation levels of Src, PLCγ1, and ERK1/2 were significantly decreased compared to the control group, while the total levels of them remained unchanged (p<0.01, Fig. 5). In the U73122 group, the phosphorylation levels of PLCγ1 and ERK1/2 were significantly decreased relative to those in the control group (p<0.01, Fig. 5), but the phosphorylation level of Src was not appreciably altered (p>0.05, Fig. 5). In the PD98059 group, the phosphorylation level of ERK1/2 was significantly decreased (p<0.01, Fig. 5), while the phosphorylation levels of Src and PLCγ1 were not affected when compared with the control group (p>0.05, Fig. 5). Therefore, the Src, PLCγ1, and ERK1/2 pathways were all motivated in the in vitro integration model. In addition, Src was an upstream activator of PLCγ1 and ERK1/2, ERK1/2 was a downstream target of PLCγ1.
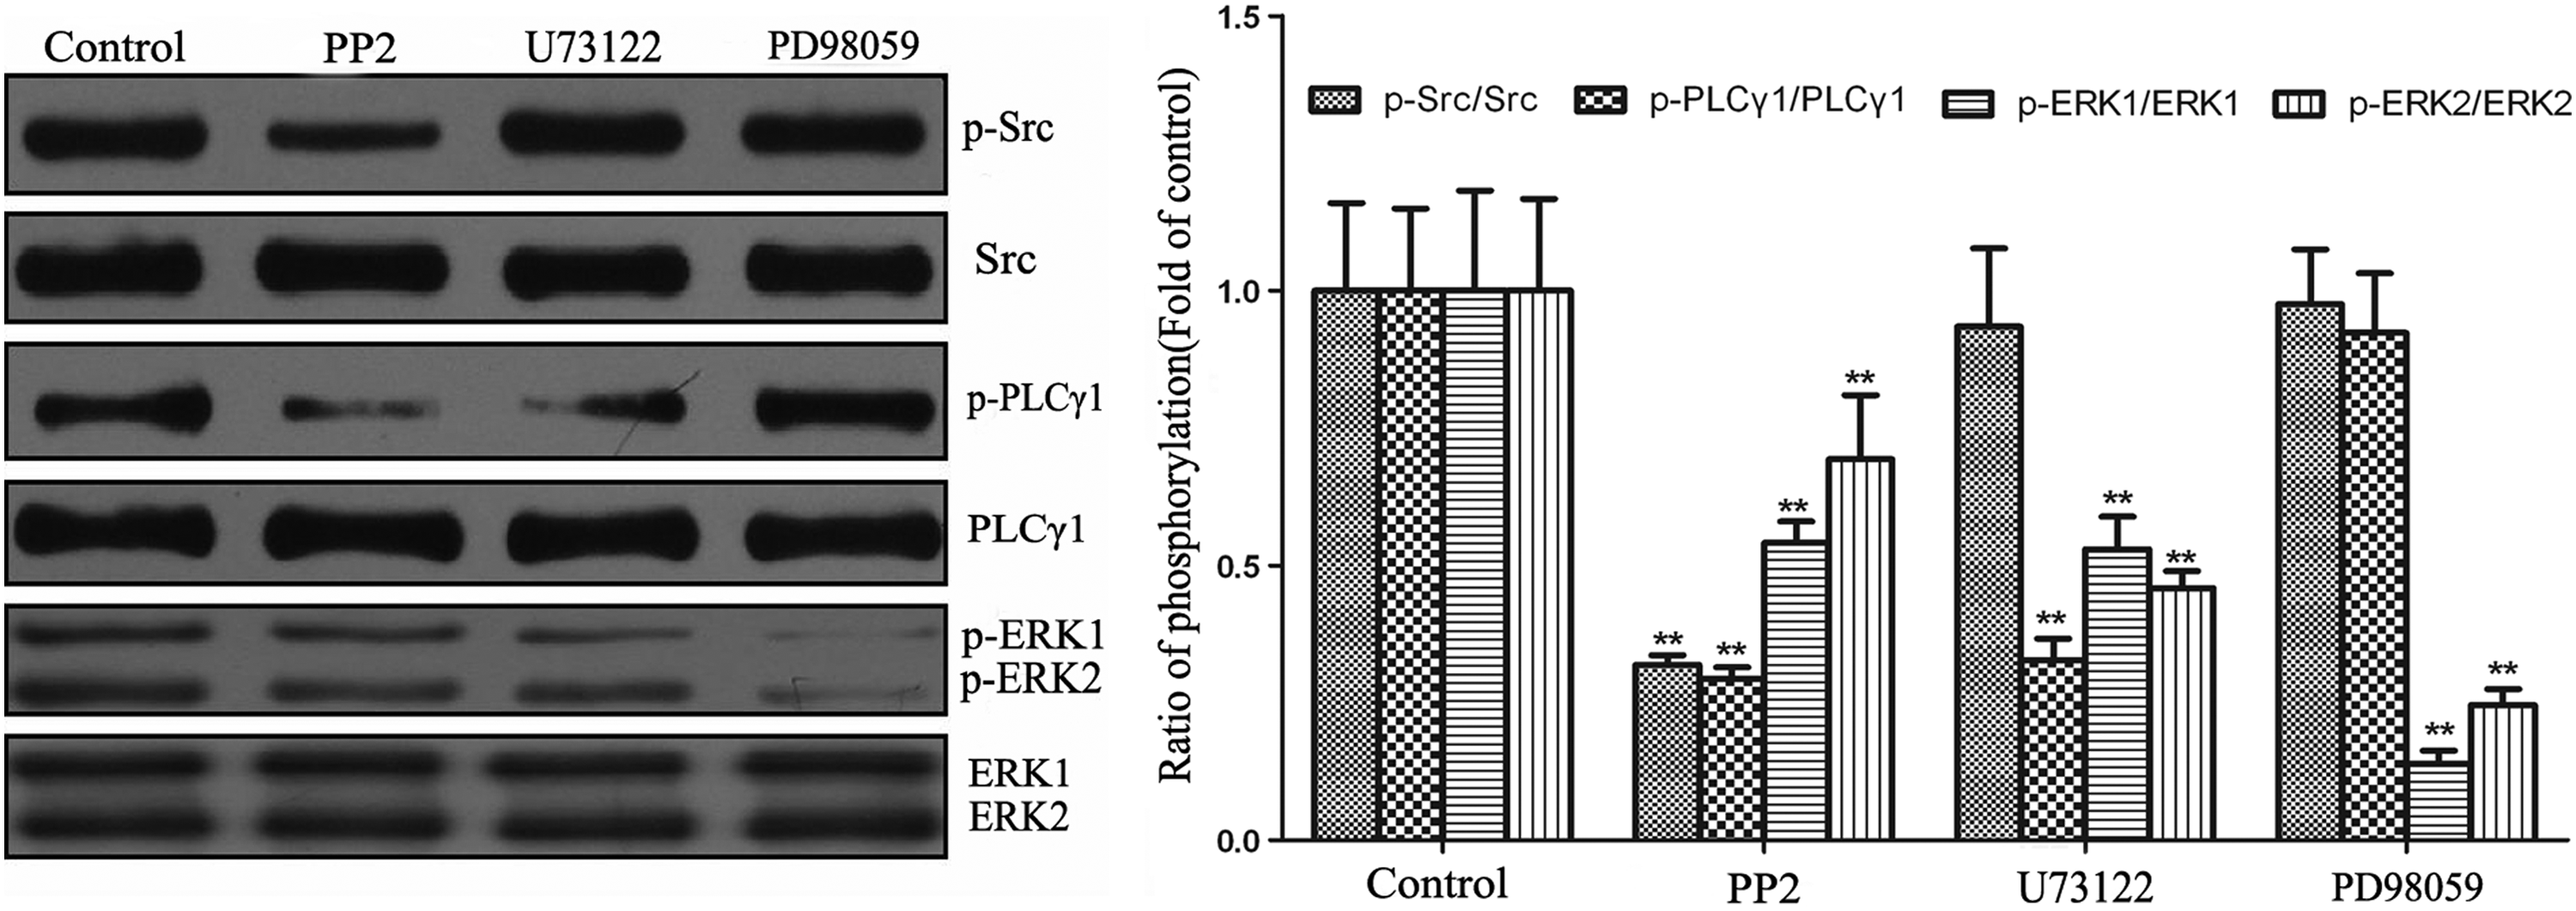
The relationship analysis among the Src, PLCγ1, and ERK1/2 pathways by Western blotting. A representative blot from five independent experiments was shown at the left panel and quantitative data at the right panel. Src inhibitor PP2 blocked the phosphorylation of all pathways. PLCγ1 inhibitor U73111 blocked the phosphorylation of both PLCγ1 and ERK1/2, but had no inhibition of Src phosphorylation. ERK1/2 inhibitor PD98059 only blocked the phosphorylation of ERK1/2. **p<0.01 versus control.
Roles of Src, PLCγ1, and ERK1/2 pathways on the implanted chondrocyte apoptosis and mRNA expression of MMPs and ADAMTSs
After 4 weeks of culture, TUNEL staining was performed to evaluate the implanted chondrocyte apoptosis. Although the apoptotic cells were sporadically distributed in the entire core, most of them were seen remote to the interface and rarely found on the interface in all samples with or without inhibitors (Fig. 6A). Quantification of apoptotic cells by FACS analysis with fluorescent isothiocyanate-conjugated annexin V showed that no differences existed between the four groups (p>0.05, Fig. 6B).
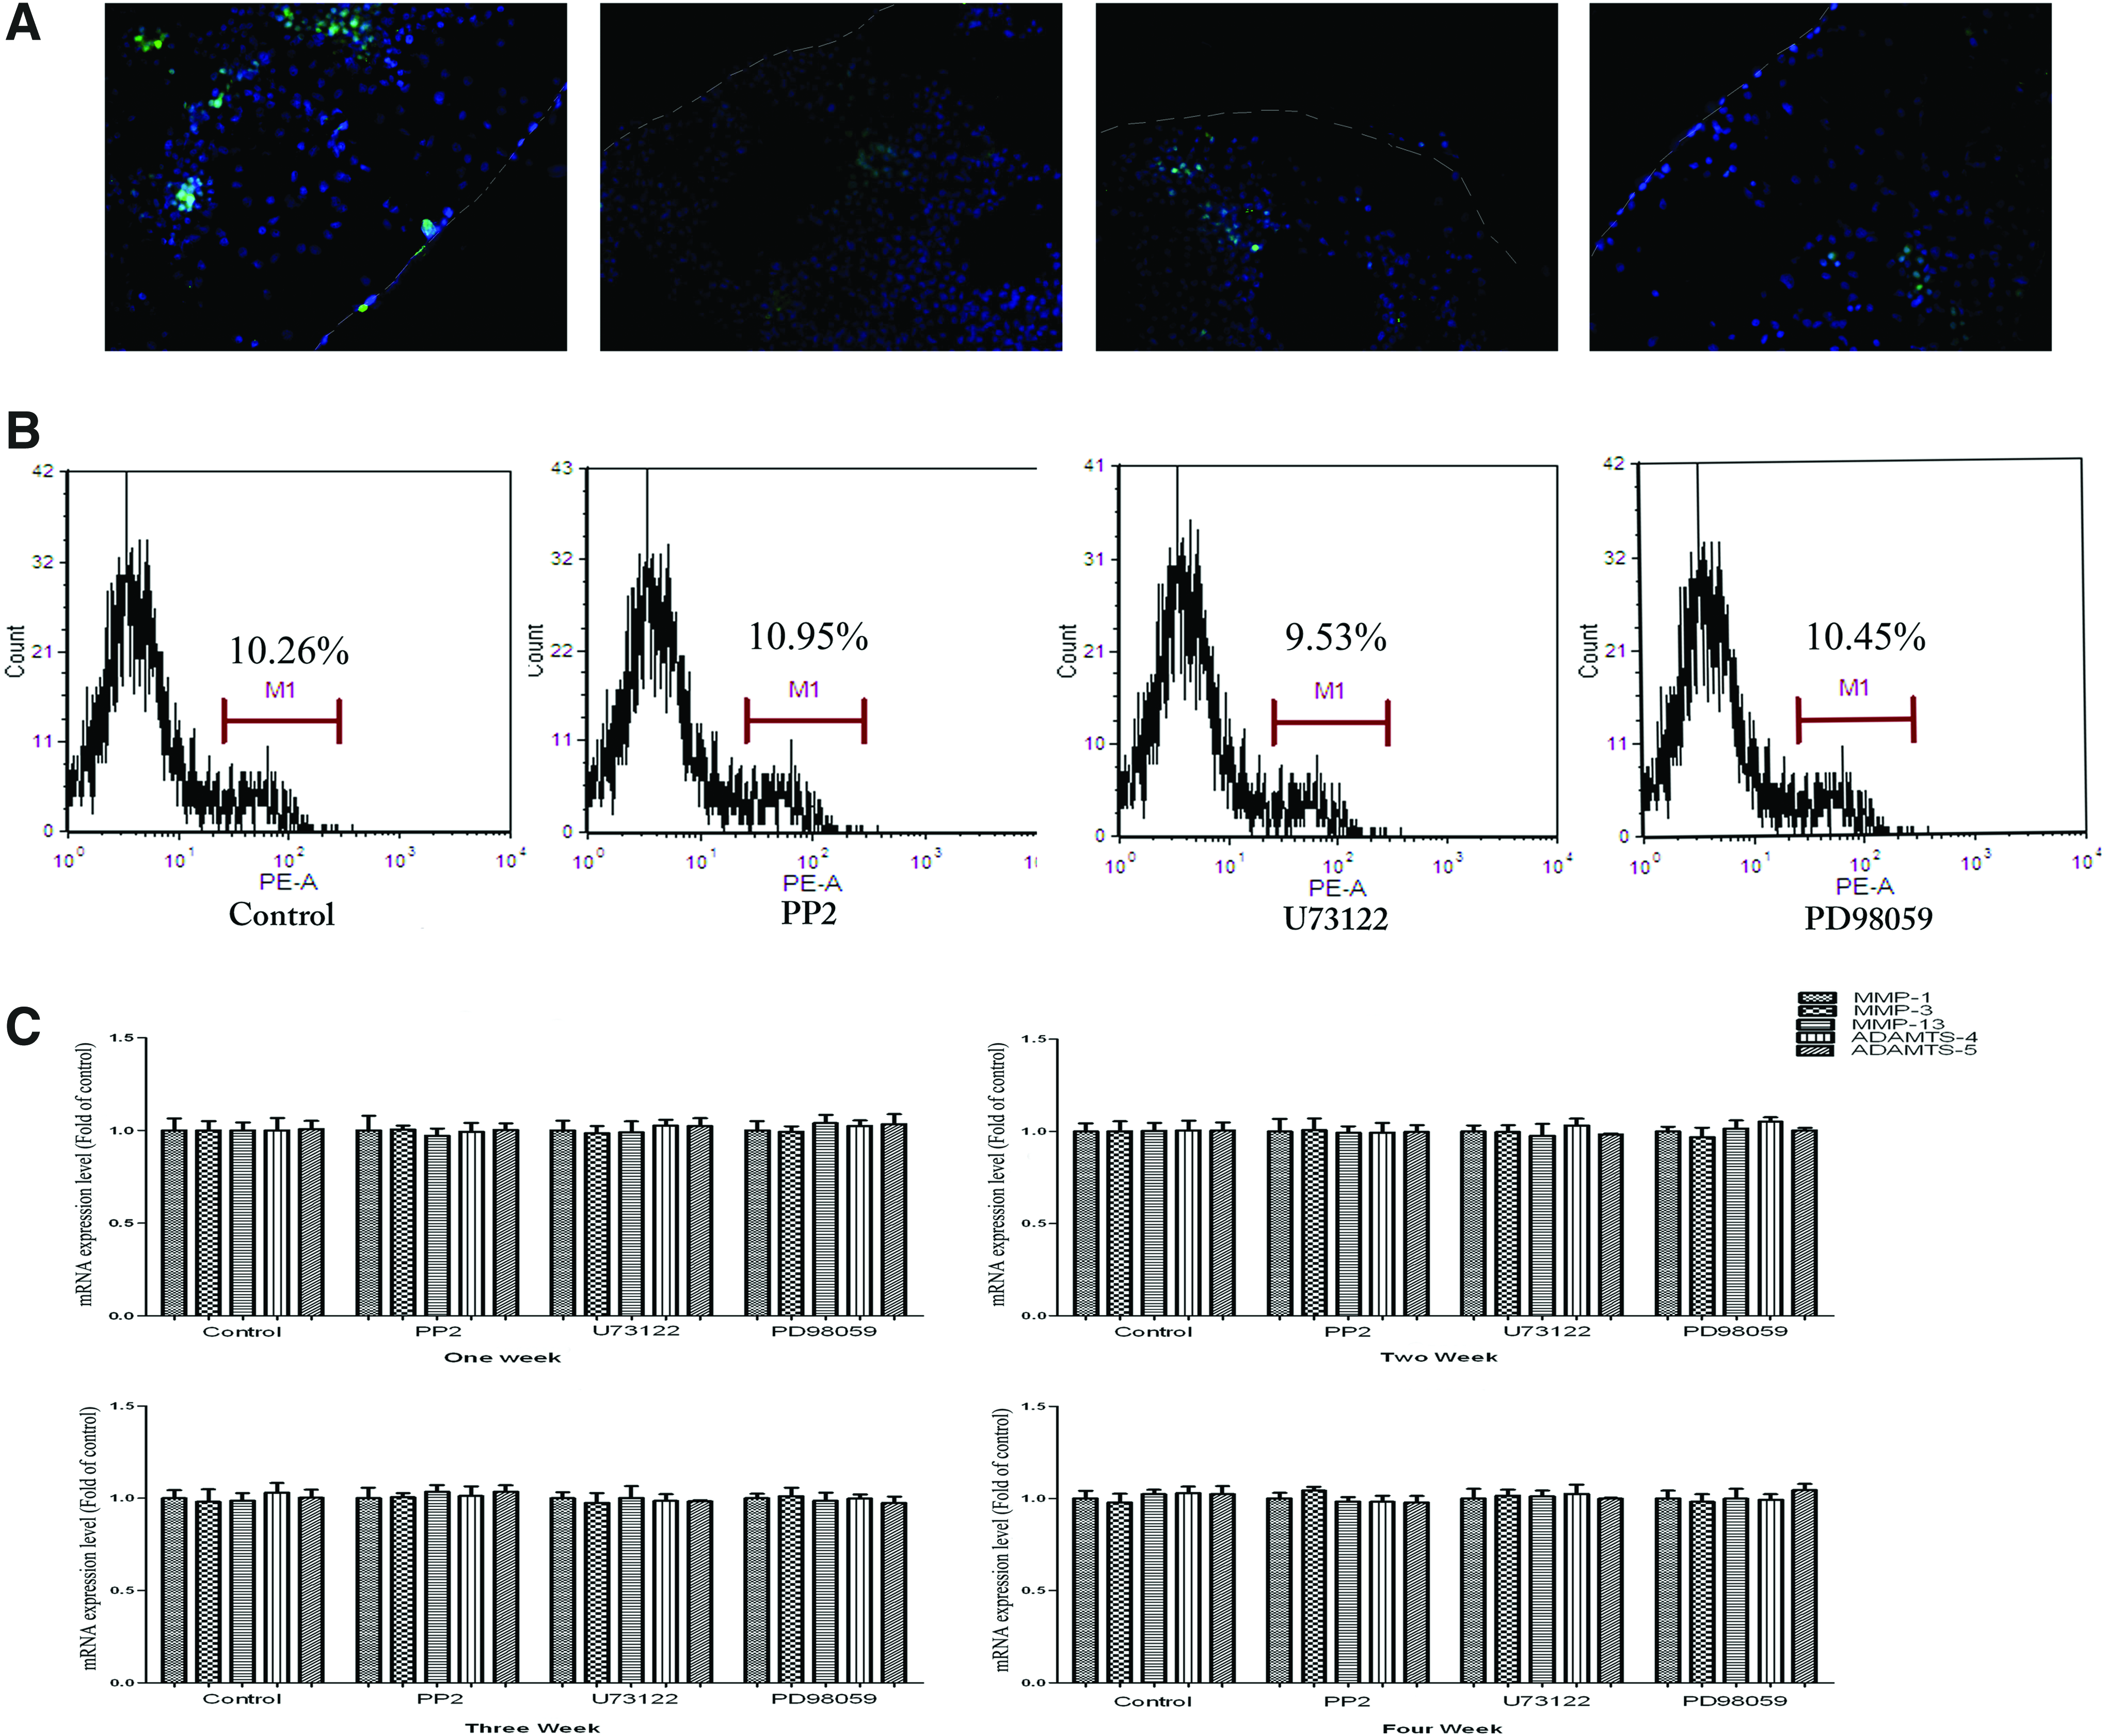
Roles of Src, PLCγ1, and ERK1/2 pathways on the implanted chondrocyte apoptosis and mRNA expression of MMPs and ADAMTSs.
To preclude the potential influence of Src, PLCγ1, and ERK1/2 pathways on chondrocyte inflammation, the mRNA expression levels of inflammatory elements (MMP1, MMP3, MMP13, and ADAMTS4, ADAMTS5) were measured weekly during a duration of 4 weeks of culture. Real-time RT-PCR analysis of regenerated cores revealed that the mRNA expression levels of MMP1, MMP3, MMP13, and ADAMTS4, ADAMTS5 were very low and remained steady from 1 to 4 weeks of incubation. No differences were found between the four groups with or without inhibiting the Src, PLCγ1, or ERK1/2 pathway at any time point (p>0.05, Fig. 6C).
Discussion
Although a variety of signaling pathways were found to be associated with chondrocyte migration,10,11 the exact intracellular signaling pathways, which contribute to chondrocyte migration in ACI remain unclear. We first explore the involvement of Src, PLCγ1, and ERK1/2 in chondrocyte migration by Boyden chamber assay and found that the Src, PLCγ1, and ERK1/2 pathways were involved in chondrocyte migration under biochemical stimulation. Furthermore, chondrocyte migration capacity was influenced by the activity of Src, PLCγ1, and ERK1/2 in a dose-dependent manner. Chondrocyte migration, as represented by the number of migrated cells, was blocked in the presence of the Src inhibitor PP2, PLCγ1 inhibitor U73122, or ERK1/2 inhibitor PD98059. Therefore, we did further study on chondrocyte migration in an in vitro ACI model. Our results showed that the implanted chondrocytes could be motivated to move as they were seeded in the explant ring. Furthermore, they could migrate, across the interface, into the native cartilage. The migratory capacity of the migrating cells, as represented by the maximum cell migration distance index and the maximum migrating cell number index, was significantly influenced by the activity of Src, PLCγ1, and ERK1/2. Less chondrocytes migrated to the native cartilage in the presence of inhibitors. Taken together, the Src, PLCγ1, and ERK1/2 pathways played significant roles in the migration of chondrocytes in the context of ACI.
Our Western blot analysis indicated that the Src was responsible for PLCγ1 activation, which signaled the ERK1/2 pathway, resulting in chondrocyte migration. A similar result has been reported by Shen et al. in cardiomyocytes in response to lipopolysaccharides. 14 Studies have suggested that PLCγ1 is activated by tyrosine kinase-dependent pathways 15 and that Src is a nonreceptor tyrosine kinase, which consists of a SH3 domain, SH2 domain, and tyrosine kinase domain. 16 Therefore, PLCγ1 can be activated by Src. It is well established that PLCγ1 activation leads to the formation of IP3 and DAG. IP3 binds to its receptors and elevates [Ca2+]I, which has been shown to modulate the Raf/MEK/ERK1/2 MAPK pathway. In addition, DAG activates protein kinase C (PKC). Activation of PKC has been demonstrated to regulate ERK1/2 MAPK. Thus, both IP3 and DAG are the potential signaling mechanisms for PLCγ1-induced ERK1/2 MAPK activation.17,18 It is approved that ERK activation can motivate the downstream signaling protein of myosin light chain kinase, which governs cell migration via the actinomyosin skeleton. 10 Taken together, these molecular mechanisms strongly support chondrocyte migration, which can be modulated by the Src-PLCγ1-ERK1/2 signal transduction pathway.
Although the contribution of chondrocyte migration to cartilage integration was speculated by many researchers,1,5,19 it has not yet been clearly defined till now. There were many evidence observed by us to show that chondrocyte migration was a determined effector for the increased cell number presenting at the integration zone. First, the time course study of the labeled chondrocytes revealed that chondrocyte migration was a time-dependent process as the number of PKH26-labeled chondrocytes at the integration zone was increased from 2 to 4 weeks of culture when the activity of migration-related proteins (Src, PLCγ1, and ERK1/2) was not blocked. Second, the DNA contents of the control group in the integration zone were much higher than any of the other three inhibitor groups, suggesting hypercellularity existed in the integration zone. Because the total DNA contents of the entire cores were identical between the four groups, we confirmed that the inhibitors had no mitogenic effect on chondrocytes. Therefore, the increased number of cells in the integration zone was contributed by chondrocyte migration rather than proliferation. Third, histology analysis revealed that more cells were presented at the integration zone in the absence of inhibitors. DiMicco et al. found that integrative strength was correlated with collagen deposition, 20 indicating that extracellular matrix accumulation laid an important foundation for interface formation. We also had many evidences that revealed the impact of chondrocyte migration on matrix deposition. First, much more extracellular matrices (GAG and collagen), as revealed by more intensive staining of Safranin O and type-II collagen, were deposited in the integration zone in the control group without migration inhibitors. Second, the significantly greater accumulations of GAG and total collagen in the integration zone were achieved when the Src, PLCγ1, and ERK1/2 pathways were not repressed. In summary, our results clearly revealed that chondrocyte migration had a positive influence on the number of viable cells and matrix synthesis at the integration zone, which is well approved in the literature to be beneficial for cartilage integration. It was rational in our study that higher integration strength was shown in the control group without compromising the chondrocyte migration.
Because Src, PLCγ1, and ERK1/2 pathways have been reported to be associated with many functions of cells,21,22 it is necessary to evaluate their potential adverse effects. We first examined the mRNA expression levels of extracellular matrix (collagen and aggracan) of different groups with or without Src, PLCγ1, or ERK1/2 inhibition. No difference was found, especially, the ratio of collagen II to collagen I mRNA expression level indicating that terminal differentiation of chondrocytes was identical in the four groups. Next, we examined the protein levels of extracellular matrix of different groups. Differences were also not found between the four groups in terms of GAG/DNA or collagen/DNA values. Finally, histological results confirmed again that the implanted cells retained sphere-shaped morphology resembling the well-differentiated chondrocytes throughout the culture period. Therefore, it seemed that Src, PLCγ1, and ERK1/2 pathways had no influence on chondrocyte dedifferentiation under the circumstances of our in vitro integration model. The reason that might explain the fact was that the cell density in this model was well above the previously determined high density, for example, 4×10⁵/cm2, which retained the chondrocyte phenotype. 13 Additionally, Src, PLCγ1, or ERK1/2 pathways had no relationship with chondrocyte apoptosis or inflammation in our in vitro integration model.
The role of host cartilage on integration has not been fully studied. Pabbruwe et al. found that some resident condrocytes could migrate out of the natural cartilage, but no efficient integration could be observed using an in vitro sandwich-like integration model. 5 To verify the influence of native cartilage, the explant rings were pretreated with inhibitors to the Src, PLCγ1, or ERK1/2 pathways for 7 days and the hybrid constructs were then cultured in an inhibitor-free medium for 4 weeks. No differences were found between the control group without inhibitors and the ring-pretreated groups both in biochemical and mechanical analysis. Furthermore, the biochemical and mechanical values achieved by ring-pretreated groups were significantly higher than those of cell-pretreated inhibitor groups. These results suggest that the implanted chondrocytes are primarily responsible for integration. Because the resident chondrocytes are surrounded by dense extracellular matrices, it is not easy for them to migrate to the interface, while the implanted cells can migrate freely without restraints.
In conclusion, our findings strongly suggest that chondrocyte migration is critical for sufficient cartilage tissue integration through enhanced cell congregation and matrix accumulation at the integration zone. In parallel, we have demonstrated for the first time that the Src-PLCγ1-ERK1/2 signal transduction pathway is involved in chondrocyte migration in vitro. As cartilage integration failure remains the main threat to cell-based cartilage repair, our results raise the importance of chondrocyte migration enhancement therapy in the framework of tissue engineering-based cartilage repair strategies, as well as the development of gene-level or protein-level agents specifically targeting the signal transduction pathway to ensure long-term functionality of the restored joint surface.
Footnotes
Disclosure Statement
No competing financial interests exist.