
Abstract
Developing myofibers require chemical and electrical stimulation to induce functional muscle tissue. Tissue engineering protocols utilize either or both of these to initiate differentiation ex vivo. Current methodologies typically deliver multi-volt electrical signals, which may be hazardous to developing tissues. In attempts to mimic in vivo muscle development, we stimulated cultured muscle precursor cells with a low-voltage (1 mV) digitized synaptic signal derived from cultured cortical neurons. This synaptic signal induced larger and more adherent myofibers, along with markers of myoblast differentiation, compared to those induced following stimulation with a conventional (28 V) square signal. These findings suggest that stimulation with a digitized synaptic signal may be useful in tissue engineering and physical therapy.
Introduction
Electrical stimulation of skeletal myoblast cell lines induces cell fusion and increases differentiation markers.10–14 These approaches attempt to mimic developmental cues using a multi-volt electrical stimulation to induce differentiation of myoblast cells in vitro. A variety of electrical stimulation protocols have been developed to induce muscle cell differentiation. Application of signals from 1 to 50 V induced differentiation,10,13–18 while those of 100 mV were ineffective, 11 suggesting the existence of a voltage threshold to foster differentiation.
Since muscle development in situ is dependent on synaptic stimulation, we hypothesized that application of a synaptic signal may improve myoblast differentiation. We therefore compared herein the impact of stimulation with a 1 mV synaptic signal versus a classical 28 V pulse on differentiation of myoblast cell lines and primary cultures of murine skeletal muscle cells. We observed that the low-voltage synaptic signal increased the rate of myofiber differentiation, increased myofiber size, and increased myofiber adherence to the culture substrate compared to those induced by the classical high-voltage signal.
Materials and Methods
Cell culture
C2C12 mouse myoblast cells (ATCC, Manassas, VA) were seeded in 100-mm2 Petri dishes at a cell density of 0.5×10⁶ cells per mL and grown to confluency using the Dulbecco's modified Eagle's medium (DMEM; Mediatech, Manassas, VA) supplemented with 10% fetal bovine serum and 1% antibiotic/antimycotic (Sigma-Aldrich, St. Louis, MO). Cells were incubated at 37.0°C in a humidified atmosphere containing 5% CO2. The medium was changed every other day. Primary murine skeletal myoblast cultures were established as described. 19 Both C2C12 and primary cultures were grown to confluency (6 days) before experimentation (Fig. 1).
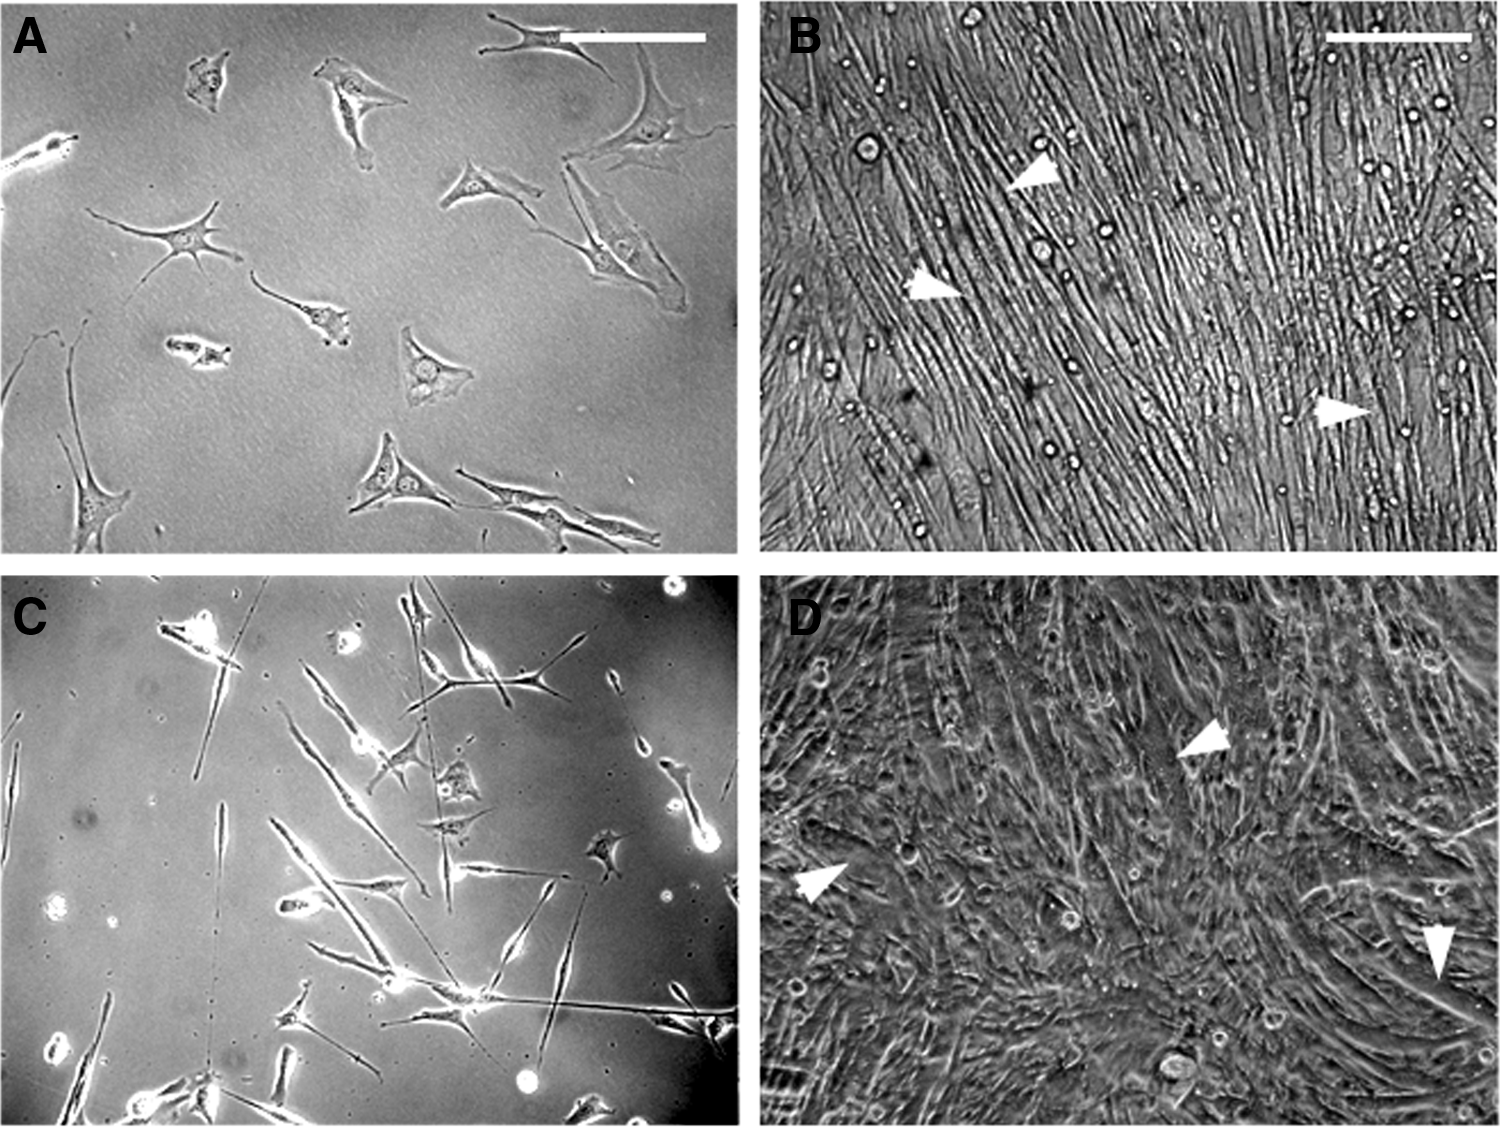
C2C12 and primary mouse myoblast cell line at low and high density. Panel
Electrical stimulation
Confluent cultures were stimulated on days 6, 8, 10, 12, and 14 in culture for 5 min each day with either using a classical electrical signal (28 V, 0.5 Hz, 4 ms) or a digitized synaptic signal (1 mV, 0.5 Hz, 1 s). Signals were generated and delivered as described20,21 (Fig. 2A); briefly, the digitized synaptic signal consisted of a 1 s segment of a spontaneous synaptic signal recorded from a mature murine neuronal culture. Cultures were stimulated using platinum wires (2 cm in length immersed in the culture medium parallel to the growing surface) to deliver electrical signals and to complete the circuit. The culture medium was replaced with a fresh medium after stimulation. Control cultures were handled in the same manner, but were not stimulated.
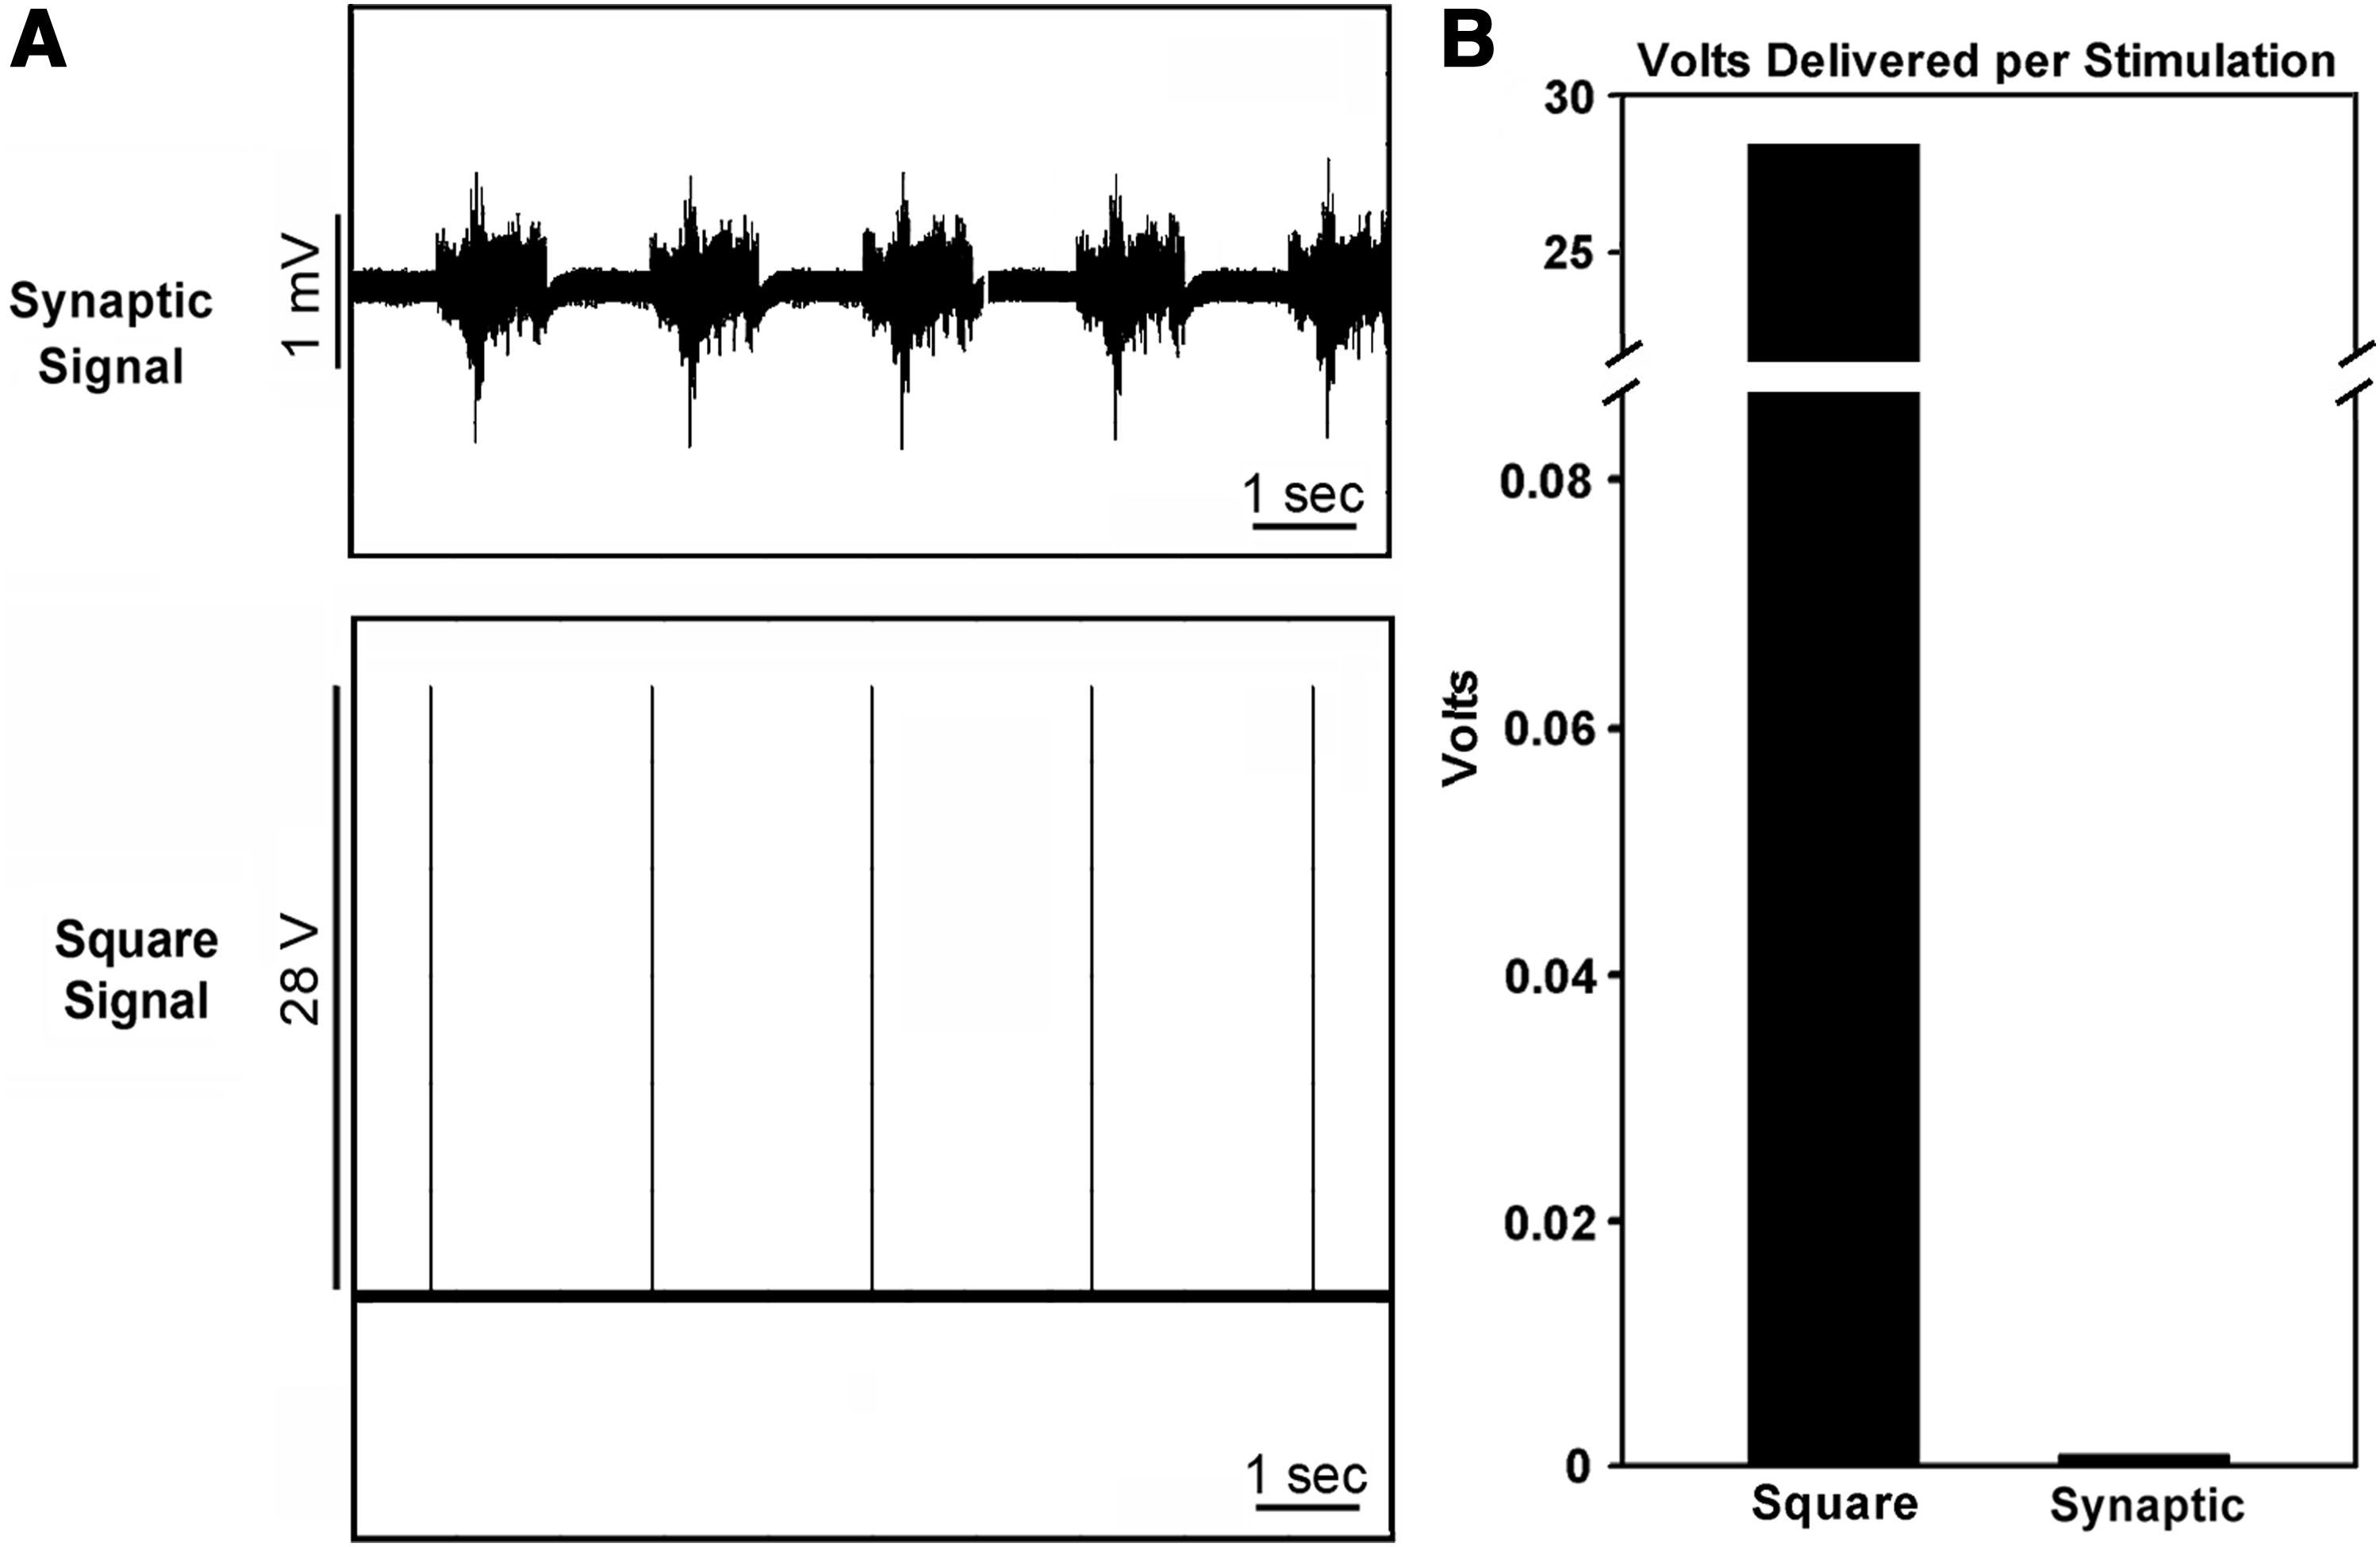
Stimulation signals and relative voltage delivery. Panel
Image analysis
Before harvest (day 15), random sections were imaged with an Olympus IMT-2 microscope and Open Lab software under brightfield settings. Pixels were quantified using Adobe Photoshop CS3 (Adobe Systems, San Jose, CA) to determine the number and area of myotubules and myofibers.
Quantification of cellular adherence
To quantify differential adherence of control and stimulated cultures, the medium was removed and cultures were rinsed with 5 mL phosphate-buffered saline (PBS), pH 7.3 and 2 mL prewarmed Trypsin-EDTA (Mediatech) was added. After 5, 10, and 15 min of incubation at room temperature, detached viable cells were decanted and quantified with a hemocytometer using Trypan Blue Dye Exclusion.
Quantification of differentiation markers
Cells seeded on 0.5 mg/mL poly-D-lysine (Sigma-Aldrich, St. Louis, MO)-coated coverslips were cultured and stimulated as above. Following stimulation, coverslips were rinsed 3× with PBS (pH 7.3) and immersed in 4% paraformaldehyde (Sigma-Aldrich) at room temperature for 10 min. Cells were permeabilized with 1% saponin in PBS for 10 min, and then rinsed 2× with PBS 5 min each. Nonspecific proteins were blocked in PBS containing 10% goat serum, 1% bovine serum albumin, and 1% saponin for 1 h at room temperature, and then briefly rinsed with PBS. Cultures were incubated for 1 h at 37°C in antibodies directed against integrin alpha-3, GJA1, and myogenin (each diluted 1:200 in the above blocking solution diluted to 10% in PBS). Coverslips were rinsed 3×with PBS containing 0.1% saponin for 10 min each, and incubated for 2 h at room temperature with the appropriate secondary antibodies diluted 1:1000 in PBS containing 1% goat serum, 0.1% bovine serum albumin, and 0.1% saponin. Cultures were washed 3× with PBS containing 0.1% saponin for 10 min each. Some cultures were then incubated with DAPI (Invitrogen, Grand Island, NY) diluted to 1 μg/mL in PBS for 10 min at room temperature, then rinsed 3× in PBS.
C2C12 cultures, which had been stimulated with the square or synaptic signal for 4 days, along with unstimulated control cultures, were scraped from the plate in cold PBS, lysed with the sodium dodecyl sulfate (SDS) sample buffer, subjected to SDS gel electrophoresis (40 μg total protein/sample), transferred to nitrocellulose, and sequentially reacted with 1:300 dilutions of anti-integrin alpha-3 (sc-7019; Santa Cruz Biotechnology) or alpha-tubulin DM1A (Sigma-Aldrich) followed by the appropriate alkaline-phosphatase secondary antibody and visualized by standard methodologies.
Images were captured using a Zeiss Axiovert 200M Microscope and Open Lab software with identical respective settings for brightfield and fluorescent exposures. Images were analyzed using ImageJ software and the Sync Measure 3D plug-in (http://rsbweb.nih.gov/ij/) to determine the mean value for the three brightest and largest myogenin-positive cells in each of ≥90 separate microscopic field. Using the Sync Measure 3D plug-in, these measurements were synced with the corresponding GJA1-fluorescent image to allow quantification of the mean gray value of GJA1. Some cultures were also stained with DAPI to allow quantification of nuclei per cell as an index of myoblast fusion to form myotubules and myofibers.
Myotubule and myofiber formation in primary murine cultures
Nuclei were quantified in primary cultures to monitor viability and myoblast fusion. At harvest, primary cultures were rinsed 3× with PBS, pH 7.3 and immersed in a 4% paraformaldehyde solution (Sigma-Aldrich) at room temperature for 10 min, then rinsed 3× with PBS. Cultures were then probed with DAPI, and then rinsed 3× with PBS. Phase-contrast and corresponding fluorescence images were captured at 10× magnification under identical conditions. To facilitate quantification of healthy versus pyknotic nuclei,22–26 reactive pixels were quantified using ImageJ with minimum arbitrary thresholds set first at 50 arbitrary densitometric units (to visualize all nuclei) followed by 100 (which restricts visualization to denser, pyknotic nuclei).
Results
The synaptic signal delivered less total voltage than the classical square signal
Confluent cultures (Fig. 1) were stimulated with the square signal or synaptic signal for the identical periodicity and time as described in Methods (Fig. 2A). Since the voltage of the square signal was 28 V, whereas the voltage of the synaptic signal was 1 mV (Fig. 2B), a total of 8400 V was delivered to cultures using the square signal during the 5-min stimulation period, whereas only 750 mV was delivered using the synaptic signal. A total of 42,000 V was delivered to cultures receiving the square signal during the multiday stimulation protocol, whereas cultures stimulated with the synaptic signal received 3.75 V.
The synaptic signal increased myofiber area
Similar numbers of myofibers were observed under all conditions (Fig. 3). However, pixel area analysis revealed that the synaptic signal induced myofibers with >50% increased area compared to that in cultures stimulated with the square signal or unstimulated cultures (p<0.05; Fig. 3).
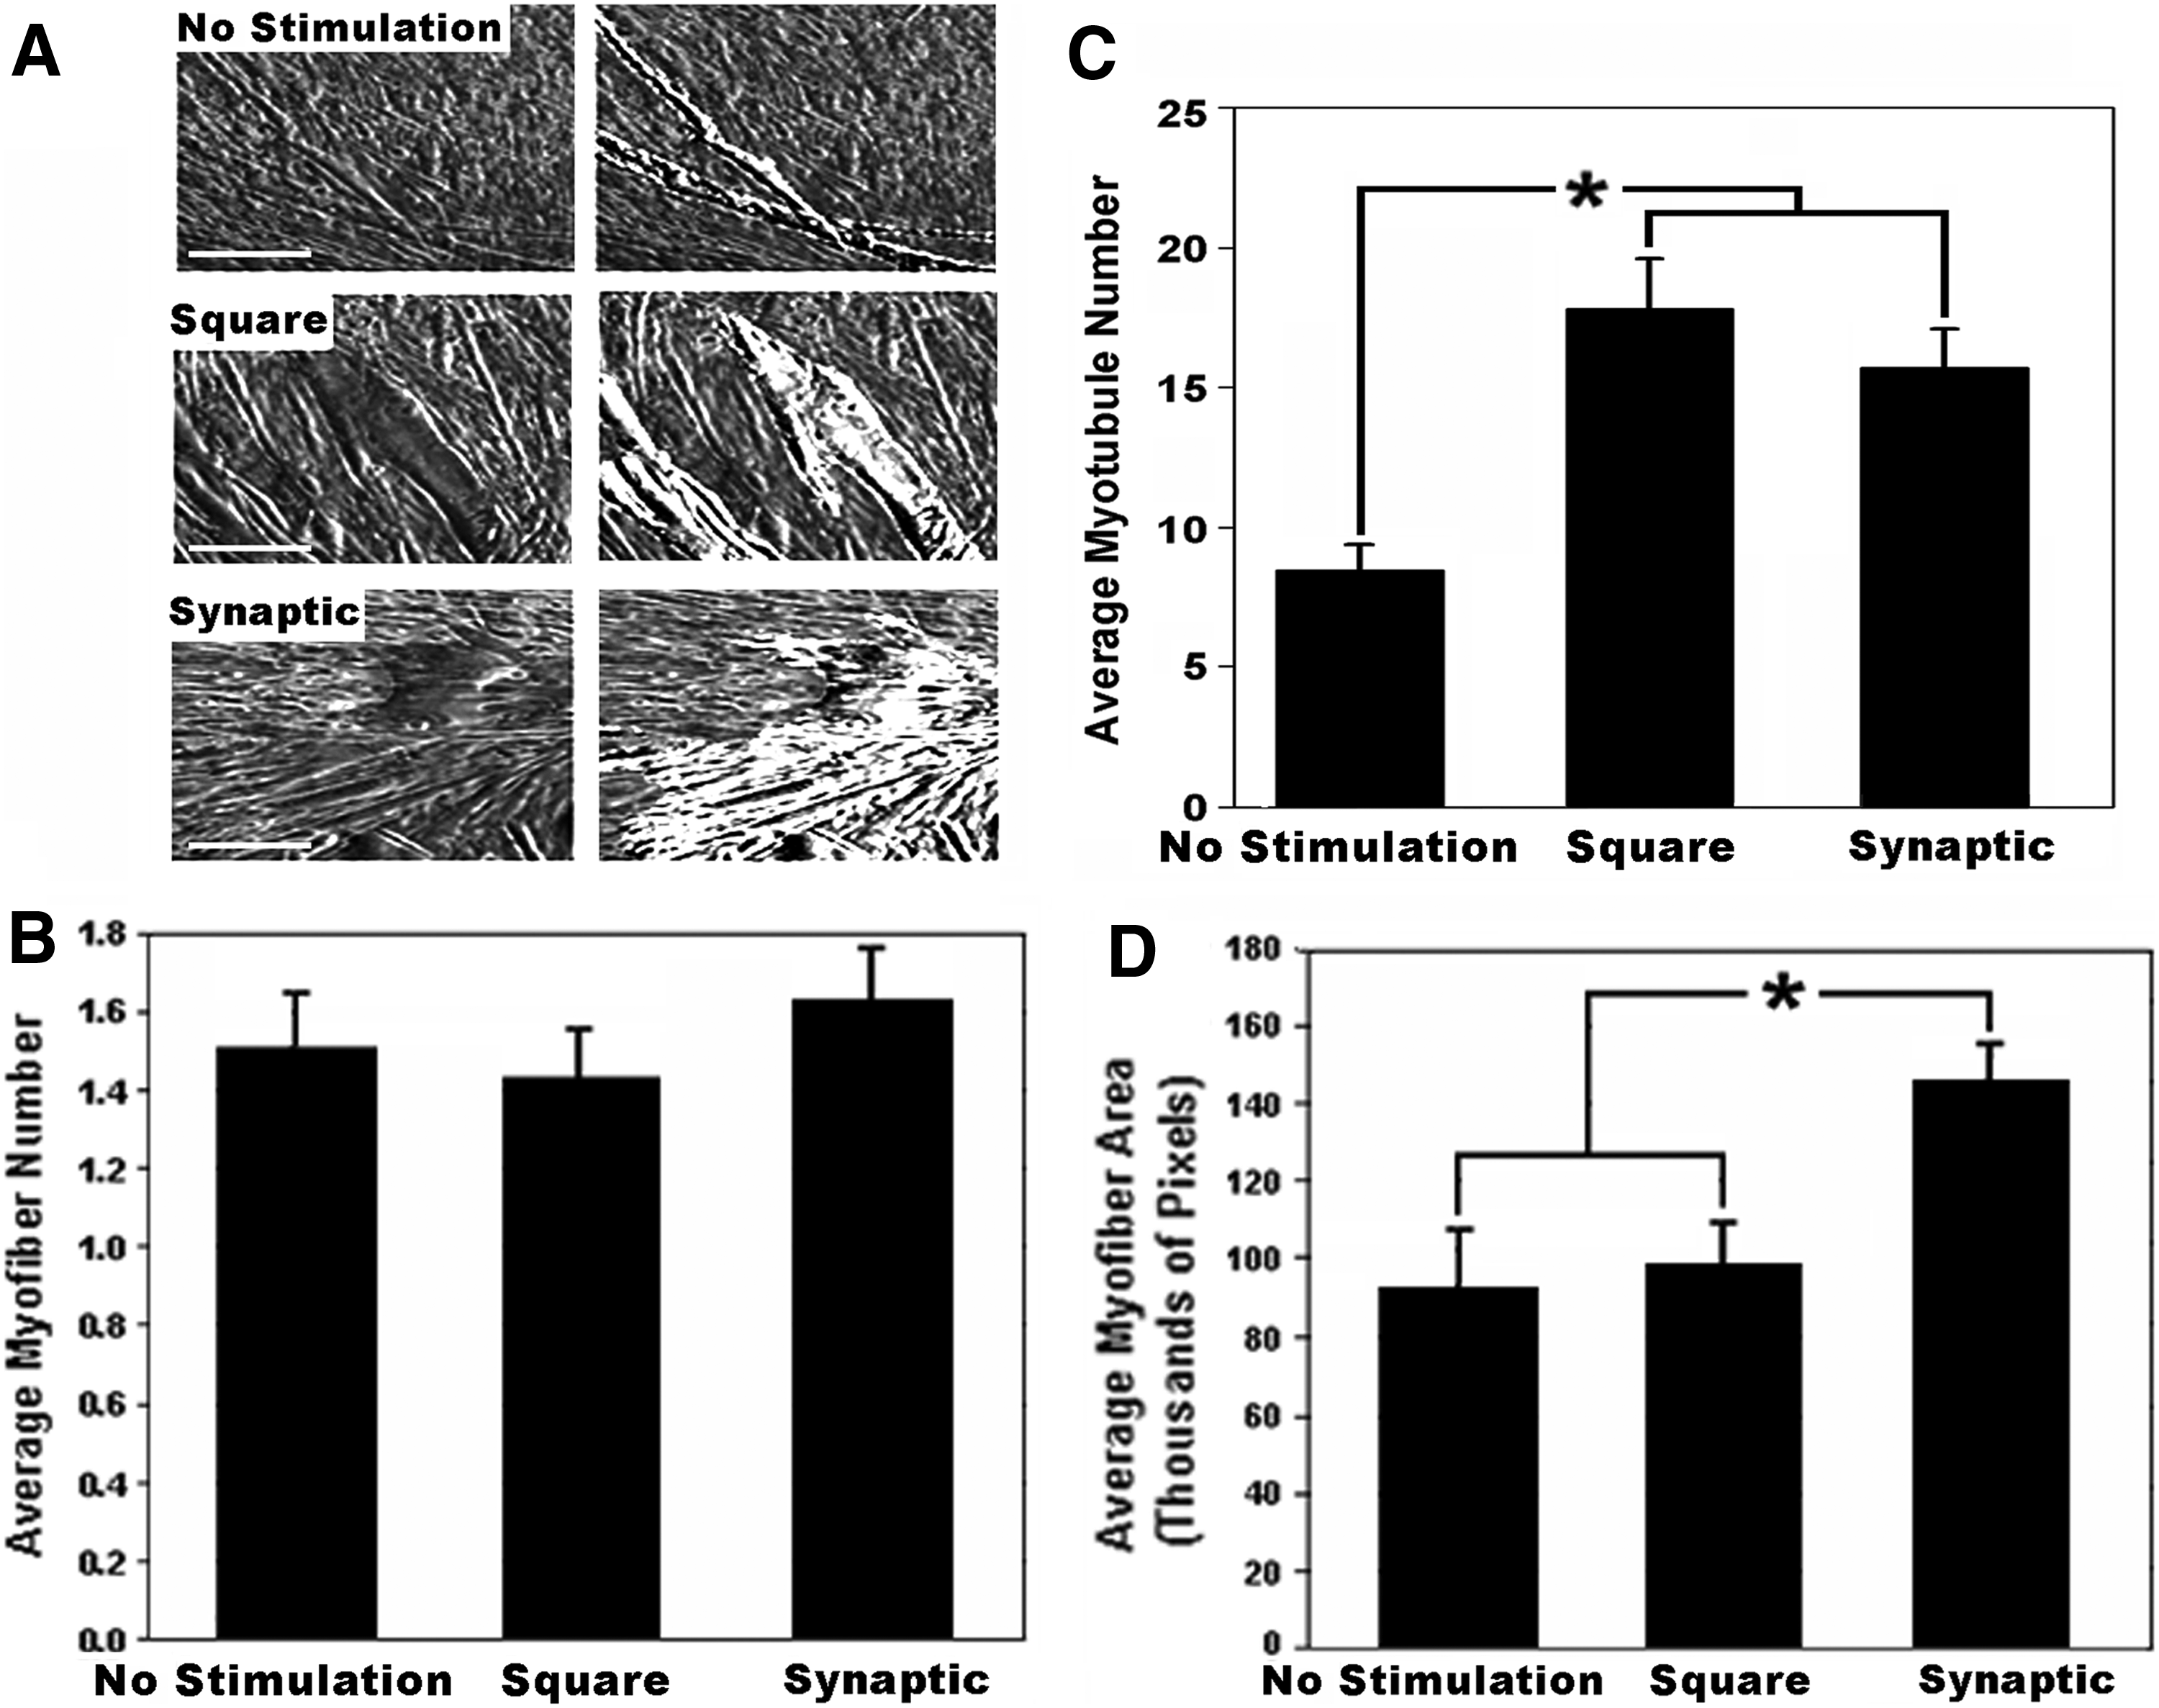
The synaptic signal increases the myofiber size. Panel
The synaptic signal enhanced cellular attachment
Following the multiday stimulation protocol, cultures were trypsinized, imaged, and cell numbers and types quantified at 5-, 10-, and 15-min intervals. During the initial 5 min of trypsinization, myoblasts (but not myotubules or myofibers) detached from the confluent monolayer in all groups. Approximately 80% of cells were retained on the substrate under all conditions for the first 5 min (Fig. 4). After 10 min, smaller myotubules and myofibers also detached. Cultures stimulated with either signal retained more total cells than unstimulated controls (33.8%±8.1%). However, 75% of cells retained in cultures stimulated with the synaptic signal were myofibers. By contrast, cultures stimulated with the square signal and unstimulated cultures contained only 49% and 34% myofibers, respectively (each p<0.05 vs. synaptically stimulated cultures; Fig. 4). All cells detached under all conditions by 15 min.
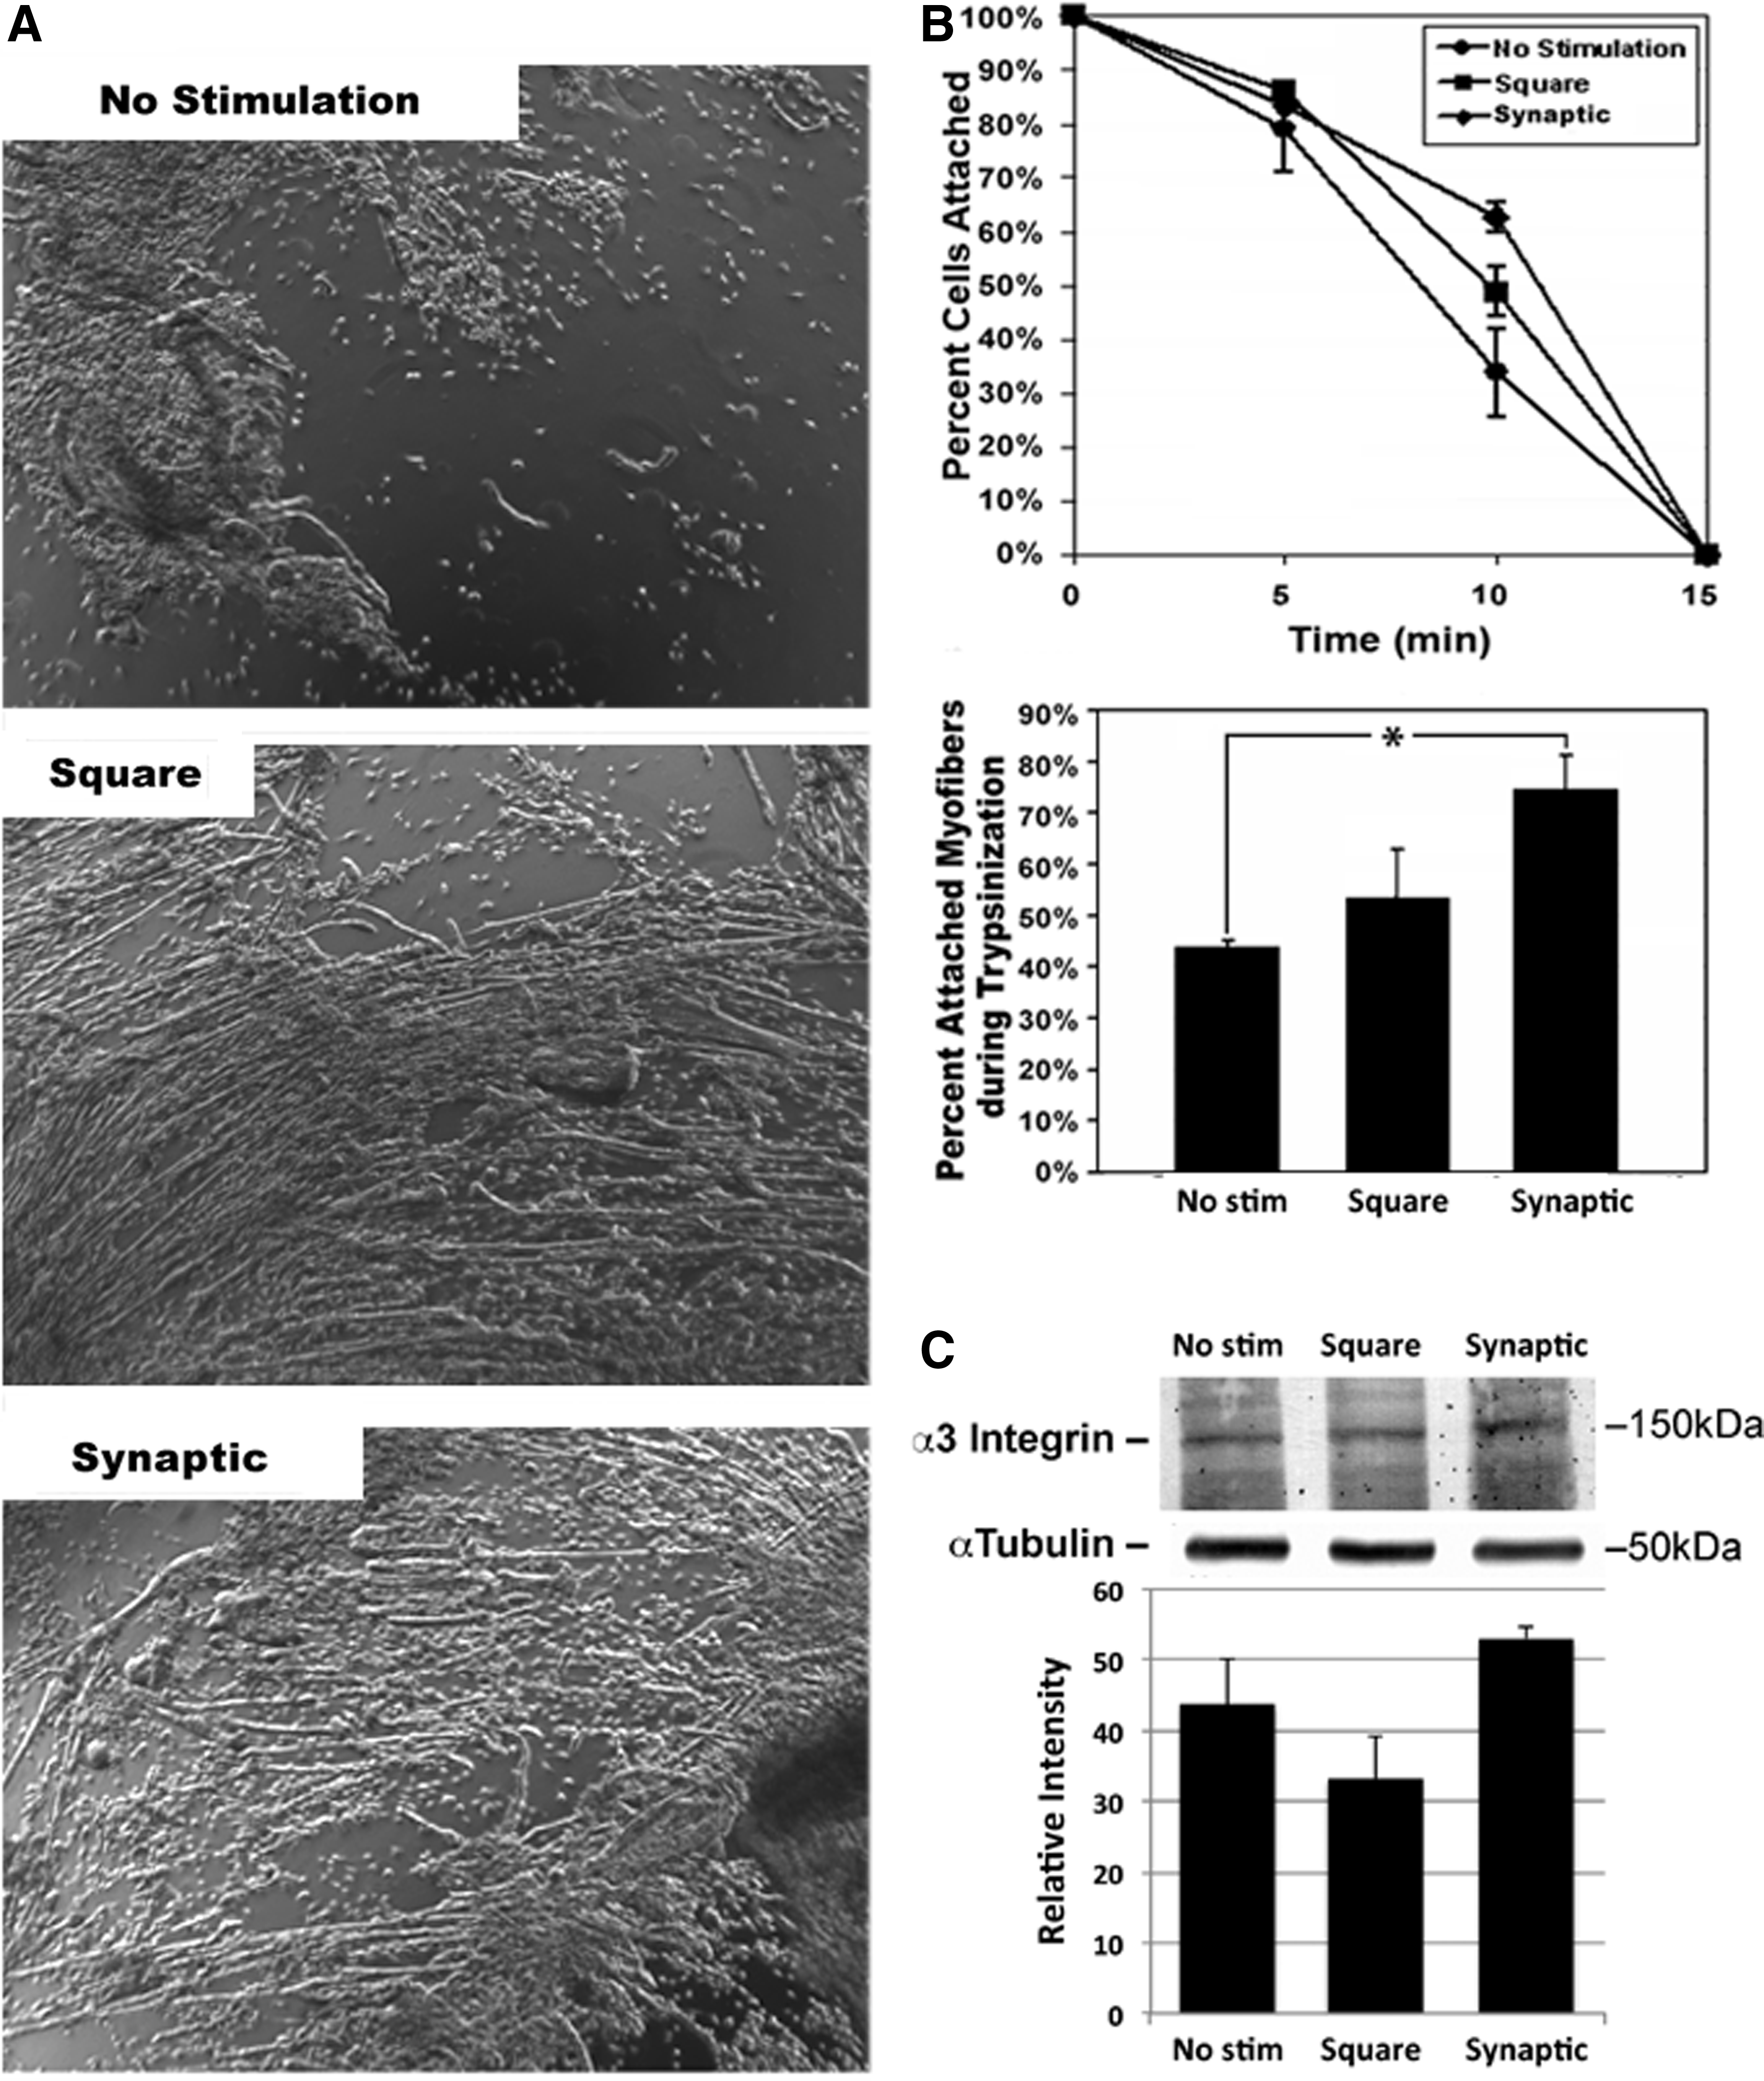
The synaptic signal enhances cellular attachment. Panel
The synaptic signal enhanced expression of differentiation markers
An increase in integrin alpha-3, which is essential for myoblast fusion, 27 was observed following stimulation with the synaptic signal (Fig. 4). Myogenin increases dramatically during muscle cell differentiation, whereas GJA1 decreases.28–30 To monitor the relative extent of myoblast differentiation, cells were probed for levels of myogenin and GJA1. Cells stimulated with the synaptic signal displayed a myogenin/GJA1 ratio significantly greater (p<0.05) than those stimulated with the square signal, whereas those stimulated with the square signal displayed a ratio significantly greater (p<0.05) than those of unstimulated controls (Fig. 5).
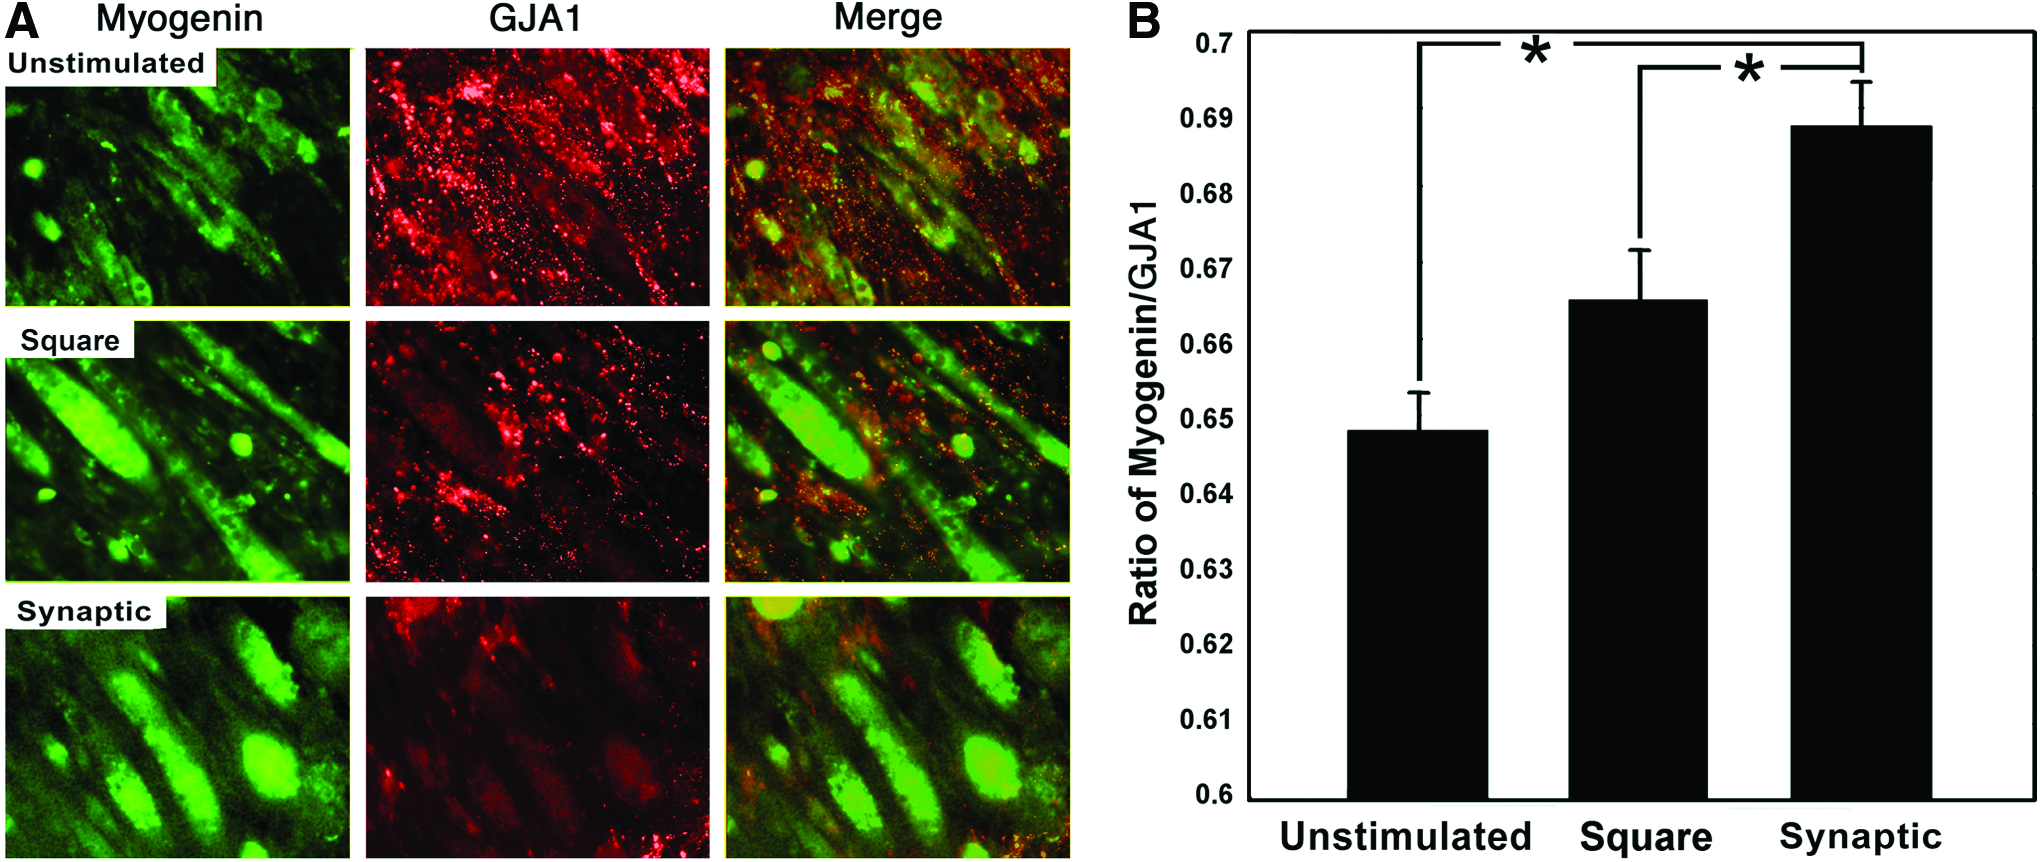
Cultures stimulated with the synaptic signal have increased differentiation markers. Panel
Electrical stimulation increased fusion of cultured myoblasts
To determine if stimulation altered fusion of myoblasts into myotubules and/or myofibers, we assayed the number of DAPI-positive nuclei/area of myofibers and myotubules. Stimulation with the synaptic or square signal significantly increased the* nuclei/cellular area by 24% and 17%, respectively (both p<0.01), versus unstimulated cultures (Fig. 6).
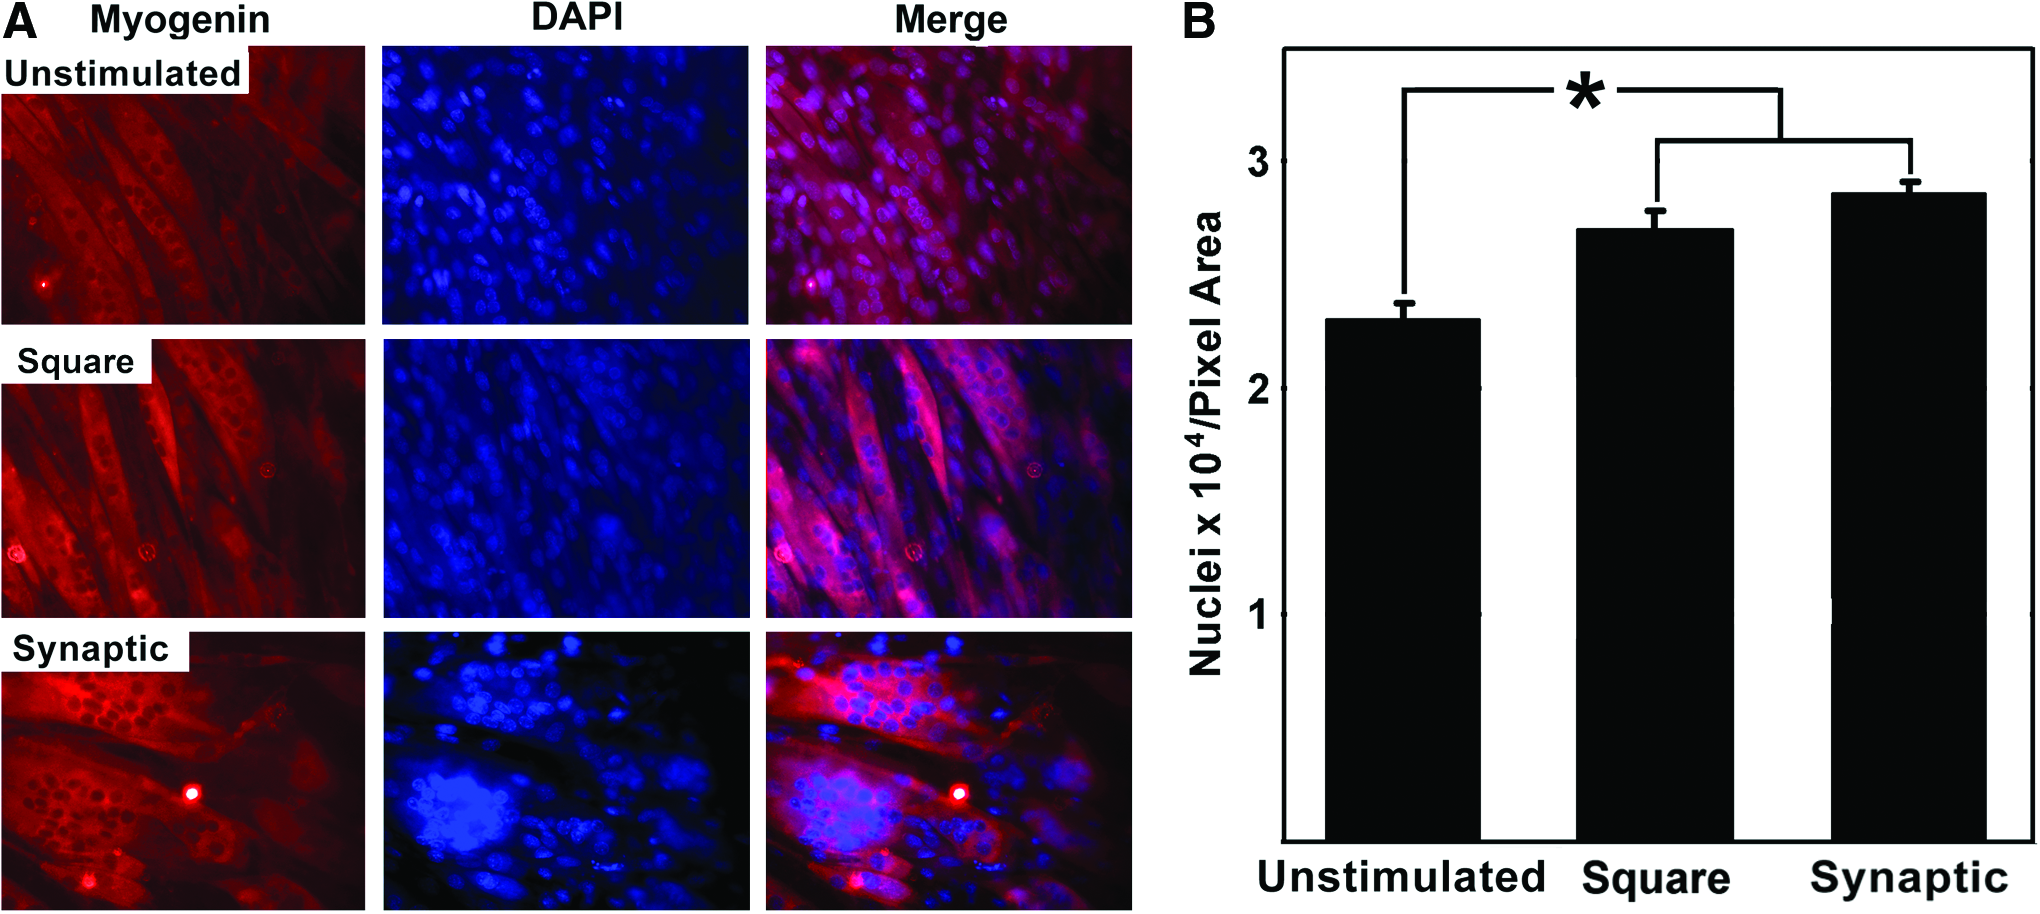
Stimulation increases fusion of skeletal myoblasts. Panel
The synaptic signal increased fusion of primary myoblasts
To verify the physiological relevance of these findings with C2C12 cells, we also examined the use of the synaptic signal on primary murine skeletal myoblasts. Primary cultures that received the synaptic signal displayed significantly (p<0.02) more myofibers than those receiving the square signal, while those receiving the square signal displayed significantly (p<0.02) more than unstimulated controls (Fig. 7). Synaptic stimulation also significantly increased the myofiber area versus that observed in cultures stimulated with the square wave or unstimulated controls (p<0.05 for each), while stimulation with the square wave did not increase the myofiber area compared to that observed in unstimulated cultures (Fig. 7). An increase in integrin alpha-3 was observed in fused skeletal myoblasts following stimulation with either the square or synaptic signal (Fig. 7).
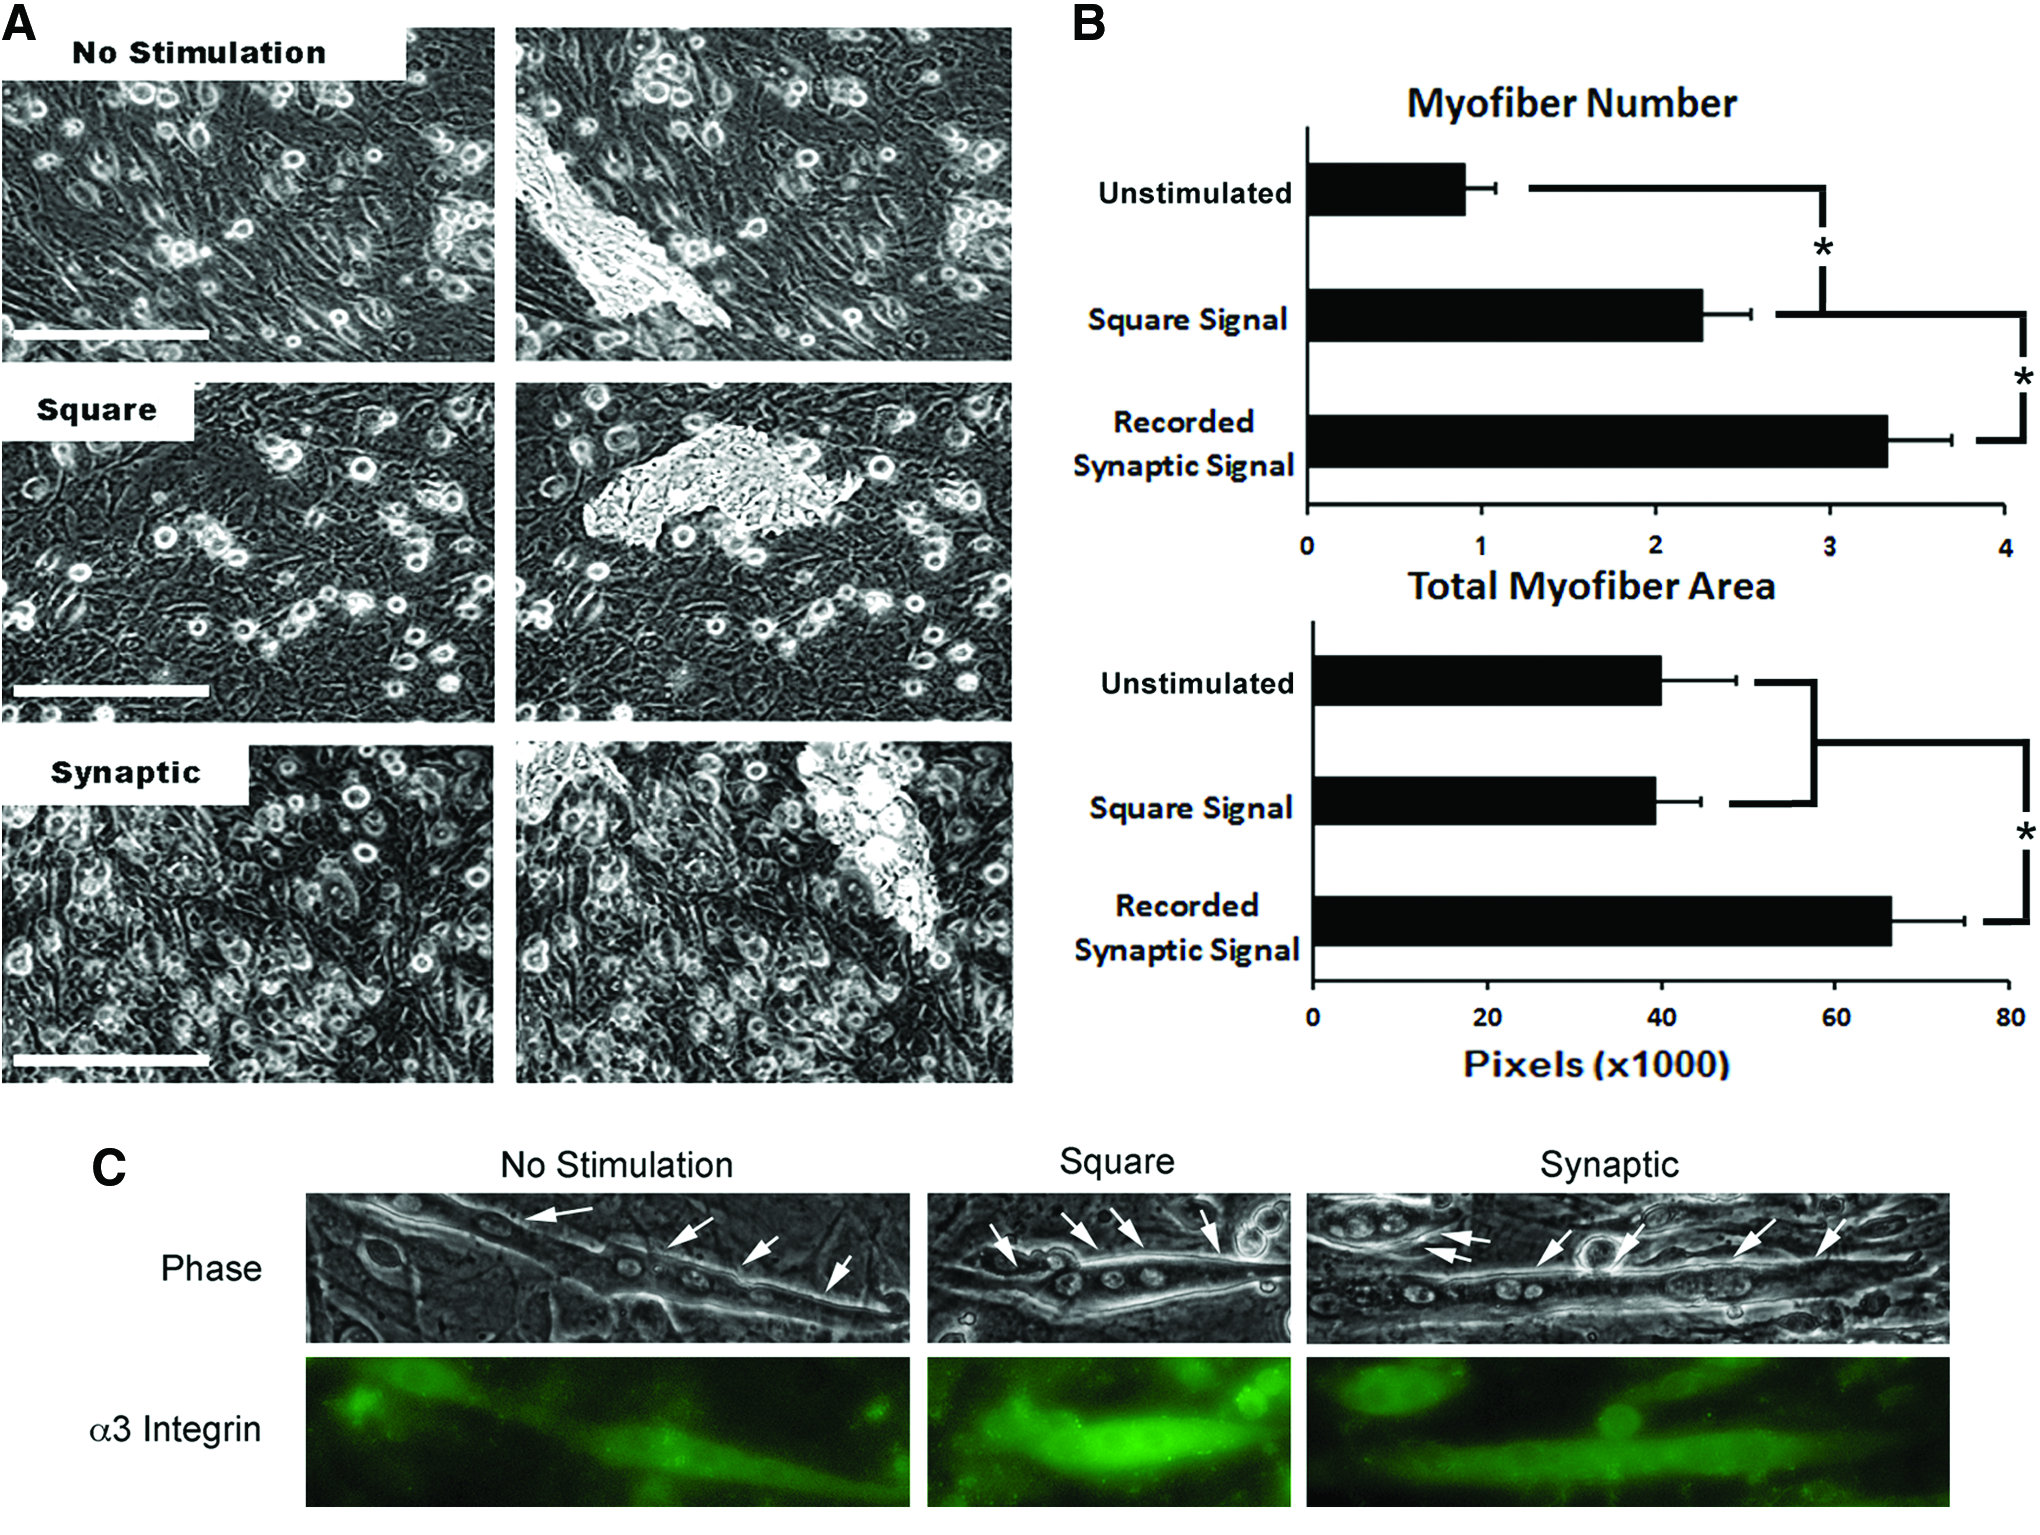
The synaptic signal accelerates differentiation in primary cultures. Panel
Electrical stimulation did not affect primary myoblast viability
The possibility existed that stimulation damaged myoblasts, which could artifactually increase the relative number of myotubules or myofibers in stimulated versus unstimulated cultures. To address this possibility, we probed cell health and morbidity using DAPI. Statistically equivalent numbers of total and pyknotic nuclei were observed under all conditions (Fig. 8).
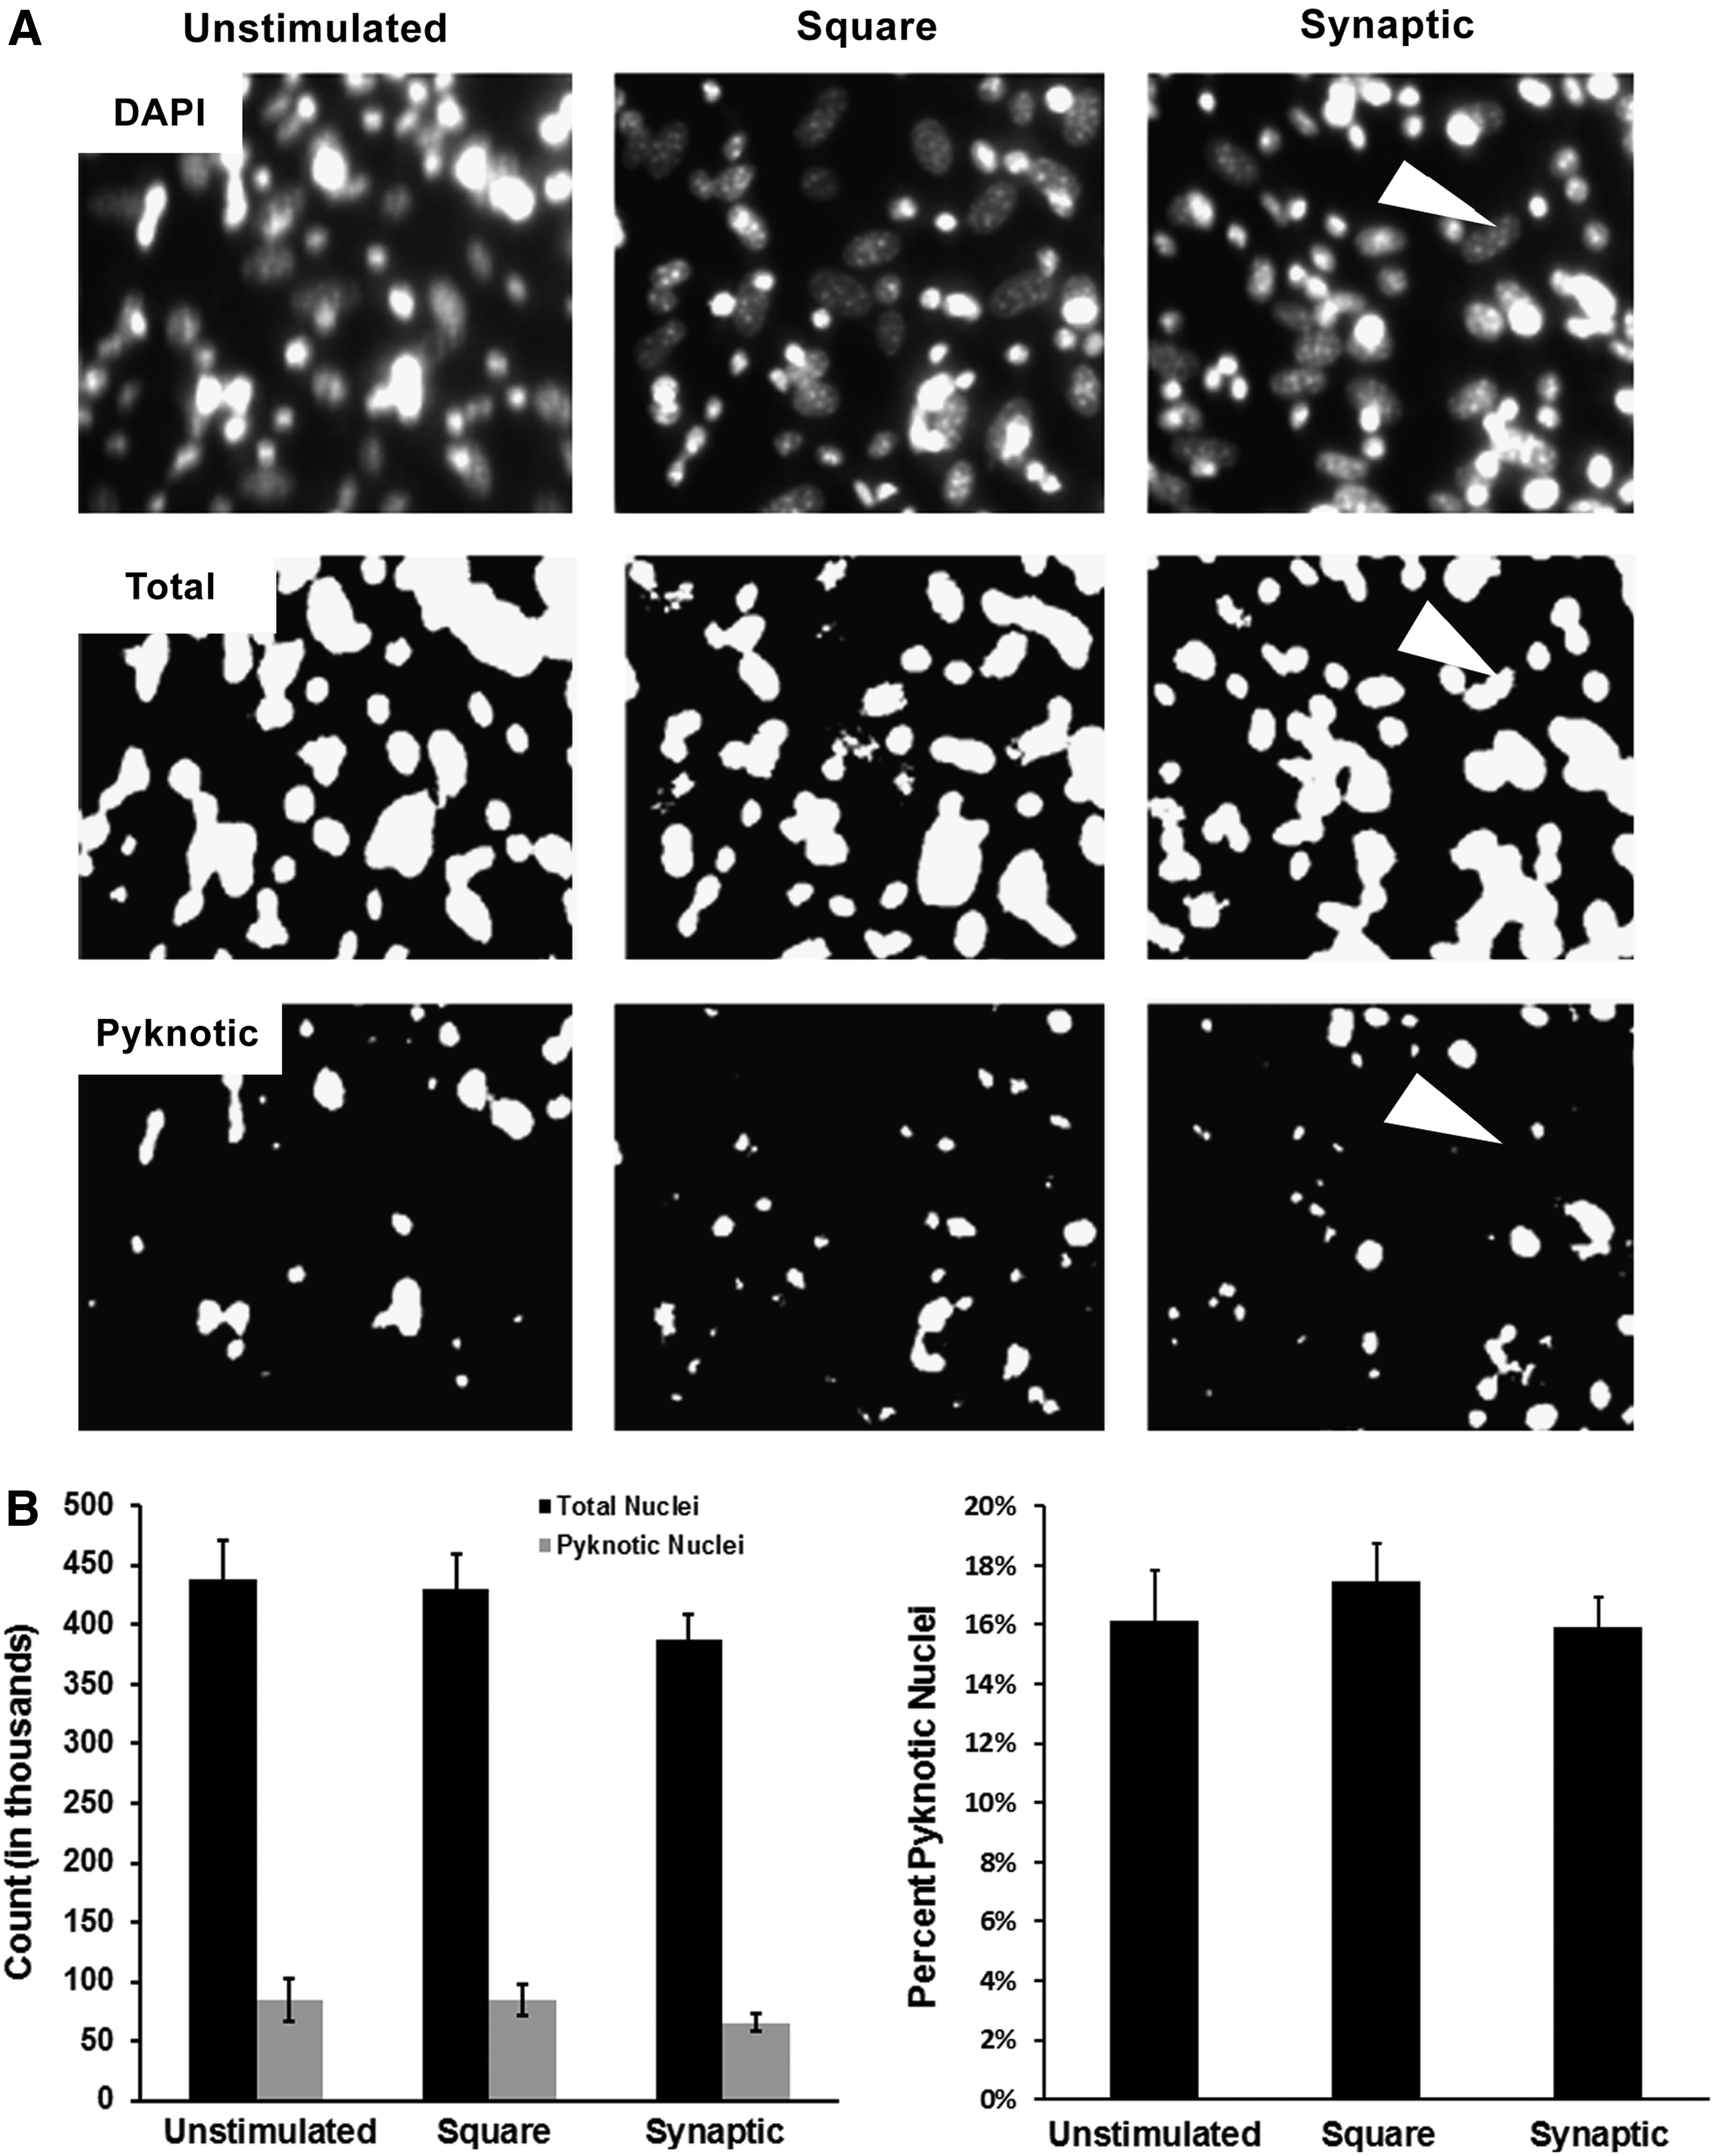
Stimulation does not affect myoblast viability in primary cultures. Panel
Discussion
The synaptic signal utilized herein more closely mimics natural developmental cues provided by neurons to induce myoblast differentiation in situ than is incorporated into classical stimulation protocols. This 1 mV synaptic signal induced more highly differentiated myofibers compared to those induced by the 28 V artificial signal. Prior investigations determined that stimulation with artificial signals of 100 mV failed to induce differentiation, indicating that higher voltage signals were required. The complex nature of the synaptic signal may therefore be responsible for its robust effect on myoblast differentiation. The type of neuronal signal (i.e., hippocampal) applied to developing muscle cells is not the same type as seen in neuromuscular junctions. By utilizing a digitized signal to induce differentiation, rather than electrical induction through neurotransmitters, the simplistic approach to improving current technologies is highlighted.
The skeletal myoblast development is marked by cellular fusion.31–34 The resultant increase in the myofiber area is due to the increased fusion of myoblasts and myotubules. Herein, myofiber numbers were similar in unstimulated and stimulated C2C12 cultures. However, stimulation with the synaptic signal increased the myofiber size ∼50% further than the size of myofibers stimulated with the square signal, suggesting that the synaptic signal improved fusion as compared to the square signal.
An increase in nuclei per cellular area was noted in cultures stimulated with either signal, confirming efficacy of the synaptic signal in inducing myoblast fusion. Stimulation with the square signal increased the myofiber size by ∼6%. Improved recruitment of satellite cells to areas of differentiation implies that the use of the synaptic signal induces similar changes in satellite cell behavior to that of the square signal.
Immunofluorescence analyses suggest that application of the synaptic signal hastened differentiation, since the synaptic signal induced the largest change in differentiation markers.28,29,34 The increased nuclei per differentiating cells in stimulated cultures further validate this conclusion as differentiating muscle in vivo display similar results.35–37 The physiological relevance of these results was supported by improved myofiber formation following stimulation of cultured primary murine myoblasts with the synaptic signal. Of interest would be to examine whether or not protracted treatment with the synaptic signal could induce further markers of muscle differentiation.
Cellular attachment of synaptically stimulated cells was improved, with a higher population of myofibers adhering to the growth substrate during trypsinization. Smaller myoblasts detached at the same rate in all cultures, while the larger myofibers remained attached to the growing substrate for a longer time. One interpretation of these results is that there is an increased level of attachment factors in cells stimulated with the synaptic signal. In this regard, we observed increased overall levels of integrin alpha-3, which is essential for myoblast fusion 27 following administration of the synaptic signal. Additionally, an increased myofiber size itself may allow protracted adherence to the growth substrate. More studies are necessary to understand fully the nature of the improved attachment.
Analyses of myoblast differentiation in culture encompass determination of whether or not the resultant myofibers contract or twitch, which is a hallmark of functionality. Such studies typically use high-voltage artificial stimulation.10,13–18 We did not examine the impact of the synaptic signal on inducing twitching. Of interest would be to examine the efficacy of this and/or a more extensive synaptic stimulation regimen on twitching on cultured myofibers.
Current physical therapies for skeletal muscle repair utilize a similar high-voltage artificial signal as the square signal used herein, often causing patient discomfort.38–41 In addition to potentially accelerating muscle regeneration, the low-voltage synaptic signal may increase patient compliance by potentially avoiding the discomfort inherent in application of high-voltage stimulation. Stimulation with the synaptic signal may also be useful for differentiation of myocardial and/or smooth muscle precursors. In this regard, the synaptic signal induced more robust development of neuronal networks in culture than those induced by higher voltage, artificial signals. 42 The findings herein suggest that stimulation with a synaptic signal, and perhaps, additional biological signals, may be useful in physical therapy to promote muscle regeneration/repair.
Footnotes
Acknowledgment
This research was supported by U.S. Army Contract No. W911NF1010227.
Disclosure Statement
No competing financial interests exist.