
Abstract
Advances in mechanistic knowledge of human neurological disorders have been hindered by the lack of adequate human in vitro models. Three-dimensional (3D) cellular models displaying higher biological relevance are gaining momentum; however, their lack of robustness and scarcity of analytical tools adapted to three dimensions hampers their widespread implementation. Herein we show that human midbrain-derived neural progenitor cells, cultured as 3D neurospheres in stirred culture systems, reproducibly differentiate into complex tissue-like structures containing functional dopaminergic neurons, as well as astrocytes and oligodendrocytes. Moreover, an extensive toolbox of analytical methodologies has been adapted to 3D neural cell models, allowing molecular and phenotypic profiling and interrogation. The generated neurons underwent synaptogenesis and elicit spontaneous Ca2+ transients. Synaptic vesicle trafficking and release of dopamine in response to depolarizing stimuli was also observed. Under whole-cell current-and-voltage clamp, recordings showed polarized neurons (Vm=−70 mV) and voltage-dependent potassium currents, which included A-type-like currents. Glutamate-induced currents sensitive to α-amino-3-hydroxy-5-methyl-4-isoxazolepropionic acid and N-methyl-D-aspartate antagonists revealed the existence of functional glutamate receptors. Molecular and phenotypic profiling showed recapitulation of midbrain patterning events, and remodeling toward increased similarity to human brain features, such as extracellular matrix composition and metabolic signature. We have developed a robust and reproducible human 3D neural cell model, which may be extended to patient-derived induced pluripotent stem cells, broadening the applicability of this model.
Introduction
T
Cell fate is determined by processes that integrate a wide range of external cues, such as nutritional status, growth factors, mechanical cues, cell–cell, and cell–extracellular matrix (ECM) interactions.2,5 Thus, when aiming at mimicking the main features of tissues, it is imperative to establish three-dimensional (3D) cellular networks, which play critical roles in cell fate, tissue specificity, and homeostasis. 6 Therefore, in vitro cellular models with a higher spatial degree of complexity are necessary. With the growing set of platforms amenable to high-throughput screening (HTS), as well as the increasing power of methodologies that allow more comprehensive readouts, human 3D ex vivo models can contribute to generate accurate and predictive cell-based drug and toxicity screenings. Several cellular systems have been established, namely, organotypic cultures, which fail to maintain long-term viability, and 3D in vitro cell cultures, either within matrices, highly dependent on time-consuming scaffold engineering and preparation, 7 or as free-floating aggregates. 6
By taking advantage of the potential of many cell types to self-organize into 3D structures, with secretion of ECM,5,8 one may culture isolated cells as 3D spheroids,5,6 which in case of neural cultures are referred to as neurospheres and have been reported to mimic basic processes of brain development. 9 Different methods for aggregation have been explored, including spontaneous aggregation under static conditions and in rotating wall vessels or induced aggregation in stirred culture systems. 5 As shown by our group, human midbrain-derived neural progenitor cells (hmNPCs) from fetal origin can be successfully cultured in low oxygen and serum-free medium as neurospheres in stirred culture systems and differentiated toward the dopaminergic lineage. 10
In this work, we further explored this dynamic culture system in order to attain more efficient dopaminergic differentiation and neuronal maturation, along with a comprehensive set of characterization methods adapted for a 3D setting. By extending culture time in the presence of cAMP, we were able to establish a reliable 3D differentiation process in which dopaminergic and synaptic markers were upregulated, recapitulating key events of midbrain development. Moreover, the expression of synaptic markers and their assembly in synaptic-like microvesicles resulted in increased neuronal functionality, as suggested by the ability to spontaneously elicit Ca2+-firing and respond to depolarizing stimuli, analyzed by 3D live imaging. The functionality of the generated neurons was further confirmed by the appearance of hyperpolarized resting potentials, voltage-activated currents, and glutamate-evoked currents. Therefore, this 3D human neural model is biologically relevant, and it can be exploited for different applications ranging from mechanistic studies on disease pathogenesis to drug screening.
Materials and Methods
Two-dimensional cell expansion
hmNPCs derived from aborted fetal brain tissue 12–14 weeks postfertilization10,11 were kindly provided by Dr. Johannes Schwarz (Technical University of Munich). Tissue was obtained with mother's consent and in accordance with the ethics committee of the University of Leipzig and the German state and federal laws. Expansion of hmNPCs was performed on poly-
3D neurosphere differentiation
hmNPCs were cultured in dynamic culture systems, using shake flasks (Corning) under constant orbital shaking (stirring rate=100 rpm) at 37°C in a multigas cell incubator (Sanyo), with a humidified atmosphere of 5% CO2 and 3% O2 in air. Typically, flasks were inoculated at 2×10⁵ cells/mL (single-cell suspension) in aggregation medium (AM; EM with lower mitogen concentration 5 ng/mL of FGF2 and EGF) and maintained in AM for 7 days with a 50% medium exchange performed at days 3–4. At day 7 of aggregation (7Diff), differentiation of neurospheres was induced by exchanging AM to differentiation medium (DM; neurobasal medium [Invitrogen] supplemented with 2% of B27, 2 mM of Glutamax [Invitrogen], 100 μM dibutyryl c-AMP [Sigma-Aldrich], 10 μM forskolin [Sigma-Aldrich], 100 μM fusaric acid [Sigma-Aldrich], and 10 μg/mL gentamycin [Invitrogen] 12 ). After 14 days in DM (21Diff), neurospheres were further cultured in maturation medium (MM; same composition of DM, except for removal of forskolin and fusaric acid) for 18 days (18Mat). A 75% medium exchange was performed every 2–3 days.
Viability assay
For cell viability assessment, neurospheres were incubated with 20 μg/mL fluorescein diacetate, which stains viable cells, and with 10 μg/mL propidium iodide, a membrane-impermeable DNA dye that stains nonviable cells, in phosphate-buffered saline (PBS) for 5 min, washed with PBS, and observed using fluorescence microscopy (DMI6000; Leica).
Fluorescence microscopy
Neurospheres were plated on PLOF-coated glass coverslips and allowed to attach for 3 days, fixed in 4% paraformaldehyde +4% sucrose in PBS for 40 min, and processed for immunostaining as described previously. 13 The antibodies used for population characterization, as well as the secondary antibodies are described in Supplementary Table S1 (Supplementary Data are available online at www.liebertpub.com/tea); cell nuclei were counterstained with TO-PRO-3 (Invitrogen). Samples were visualized using fluorescence (DMI6000; Leica) and point-scan confocal (SP5; Leica) microscopy. Merge between channels and maximum z-projections, as well as linear brightness and contrast adjustments of the images were performed using the open-source ImageJ software.
Electron microscopy
Neurospheres were fixed in 2.5% glutaraldehyde and 4% formaldehyde in 0.1 M phosphate buffer (pH 7.4) and then processed for scanning electron microscopy (SEM), transmission electron microscopy (TEM), or serial block-face SEM (SBFSEM). For SEM, samples were dehydrated, critical point dried, mounted on stubs, coated with a thin layer of gold, and imaged with a 6700F field emission SEM (JEOL Ltd.). Secondary electron images were collected at 5 keV with a probe current of 10 μA and a probe distance of 7.8–7.9 mm. For TEM and SBFSEM, samples were prepared using the National Center for Microscopy and Imaging Research (NCMIR) method. 14 For TEM, 70-nm sections were collected from neurospheres embedded in Durcupan resin using a UCT ultramicrotome (Leica Microsystems). No poststaining was required due to the density of metal deposited using the NCMIR protocol. Images were acquired using a Tecnai G2 Spirit Biotwin TEM (FEI) and an Orius CCD camera (Gatan). For SBFSEM, neurospheres embedded in Durcupan resin were mounted on a pin and trimmed to a block face of <1 mm2. Imaging was performed in a Sigma variable-pressure SEM (Carl Zeiss) equipped with a 3View ultramicrotome (Gatan) for automated serial imaging within the SEM chamber. Images were collected at 4 keV with a pixel dwell time of 3 μs at 40 Pa. One thousand serial images were collected overnight for each dataset with 7.2 nm2 pixels and a slice thickness of 75 nm. The resulting image stack was aligned using Amira (Visage Imaging, Inc.) and individual cells were manually segmented and rendered using the same software.
Metabolic profiling
Metabolic profile of neurospheres was assessed at 7Diff and 18Mat and was performed using MM for both cultures, in order to discard the influence of different media composition. Neurospheres were plated on PLOF-coated plates and allowed to attach to the surface. A washing step with PBS was performed before adding fresh MM to the culture. Samples of supernatant were then collected at 6, 12, 24, and 48 h after media exchange and stored at −20°C. Neurospheres were harvested and total protein was quantified with Micro BCA Protein Assay Kit (Pierce), according to manufacturer's instructions. Prior to nuclear magnetic resonance (NMR) analysis, samples were thawed and filtered using Vivaspin 500 columns (Sigma-Aldrich) at 14,000 g. To minimize variations in pH, 400 μL of filtered samples was mixed with 200 μL of phosphate buffer (50 mM, pH 7.4) with 5 mM DSS-d6 and centrifuged at 1000 g for 1 min. For NMR analysis, 500 μL of the resulting supernatants were placed into 5-mm NMR tubes. All 1 H-NMR spectra were recorded at 25°C on a Bruker Avance II+500 MHz NMR spectrometer. One-dimensional spectra were recorded using a NOESY-based pulse sequence (4 s acquisition time, 1 s relaxation time, and 100 ms mixing time). Typically, 256 scans were collected for each spectrum. All spectra were phase and baseline corrected automatically, with fine adjustments performed manually. Spectra analysis was performed using Chenomx NMR Suite 7.1, using DSS-d6 as internal standard for quantification of metabolites. 15
Real time quantitative reverse transcription polymerase chain reaction
Total RNA was extracted with High Pure RNA Isolation Kit (Roche) or RNeasy Mini Kit (Qiagen), according to the manufacturer's instructions. RNA was quantified in a NanoDrop 2000c (Thermo Scientific) and used for cDNA synthesis. Reverse transcription was performed with High Fidelity cDNA Synthesis Kit (Roche), using Anchored-oligo(dT)18 Primer (Roche) or with the Super Script III First Strand synthesis system (Invitrogen), using random hexamers (Invitrogen). Real time quantitative reverse transcription polymerase chain reaction (qRT-PCR) were performed in triplicates using LightCycler 480 SYBR Green I Master Kit (Roche) and primers were listed in Supplementary Table S2. As alternative, TaqMan Universal PCR Master Mix (Applied Biosystems) and TaqMan® Gene Expression Assays (Applied Biosystems) listed in Supplementary Table S3 were used. Reactions were performed with Applied Biosystems 7300 Real Time PCR system or LightCycler 480 Instrument II 96-well block (Roche). Quantification of cycle values and melting curves was determined using LightCycler 480 Software version 1.5 (Roche). All data were analyzed using the 2−ΔΔCt method for relative gene expression analysis. 16 Changes in gene expression were normalized using the housekeeping gene RPL22 (ribosomal protein L22) as internal control.
Microarray analysis
Three independent biological replicates of both undifferentiated and differentiated samples were analyzed by using the Affymetrix HG U133 plus2 gene chips, interrogating more than 47,000 transcripts. Microarray data were normalized by the log scale robust multiarray analysis procedure using R (Bioconductor) and differentially expressed genes were obtained with limma package. 17 A moderated t-test was performed between differentiated and undifferentiated groups selecting genes with a false discovery rate (FDR) value ≤0.01 and with ≥2-fold change for upregulated genes and ≤2-fold change for downregulated genes.
The identified genes were categorized in generic gene ontology (GO) functional clusters using Cytoscape_v 2.8.3 and its plug-in BINGO 2.44 (Biological Networks Gene Ontology tool). 18 The significance of overrepresented GO categories was assessed with a hypergeometric test and the Benjamini and Hochberg FDR correction. A corrected p-value <0.05 was considered significant and only significantly overrepresented GO categories are presented. 19
Western blot
Cells were lysed in lysis buffer (50 mM Tris, 5 mM ethylenediaminetetraaceticacid, 150 mM NaCl, and 1% Triton X-100 [pH 7.4]) for 30 min at 4°C. Extracts were clarified by centrifugation at 15,000 g for 10 min, followed by protein precipitation by overnight incubation in 80% ethanol. Precipitated proteins were collected at 15,000 g for 15 min and solubilized in reducing NuPAGE sample buffer (Invitrogen). Total protein was quantified with Micro BCA Protein Assay Kit (Pierce). Protein extracts were resolved on a 1 mm NuPAGE® Novex BisTris gel (Invitrogen) under reducing conditions and transferred with iBlot system (Invitrogen), according to the manufacturer's instructions. Membranes were blocked by incubation for 1 h with blocking solution (0.1% Tween 20 and 5% dry milk in PBS), and incubated overnight with primary antibody (Supplementary Table S1) diluted in blocking solution. Blots were developed using the enhanced chemiluminescence (ECL) detection system after incubation for 1 h at room temperature with horseradish-peroxidase-labeled anti-mouse immunoglobulin G or anti-rabbit antibody (GE Healthcare) at 1:5000 dilution. Chemiluminescence detection was performed by incubating the membranes with Amersham ECL Prime western blotting detection reagent (GE Healthcare) and analyzed under ChemiDoc XRS System (Bio-Rad).
Synaptic vesicle trafficking
Neurospheres plated on PLOF-coated glass coverslips were washed with PBS and exposed to a high-potassium-depolarizing solution (100 mM KCl buffer; Supplementary Table S4), for 5 min. Afterward, neurospheres were incubated with 10 μM FM 1–43 dye (Invitrogen) dissolved in normal saline (5 mM KCl buffer; Supplementary Table S4) for 15 min and washed with ADVASEP-7 (Sigma) dissolved in 5 mM KCl buffer for 1 min. This was followed by three washes of 1 min with 5 mM KCl buffer prior to imaging. Exocytosis was stimulated with 100 mM KCl buffer and samples were imaged live in a fluorescence microscope (DMI6000; Leica) to monitor synaptic vesicle release. Fluorescence intensity was measured using ImageJ.
Calcium assay
Neurospheres were incubated with 1× Fluo4 Direct calcium reagent (Invitrogen) for 30 min at 37°C, 5% CO2, and 3% O2 and for 15 min at room temperature. Samples were then imaged live using spinning-disk microscopy (Nikon Eclipse Ti-E, confocal scanner: Yokogawa CSU-x1). Fluorescence change over time is defined as ΔF/F0=(F − F0)/F0, where F is the fluorescence at any time point, and F0 the baseline fluorescence determined by baseline fitting across the whole movie for each cell using PeakFit Software (v4.12).
Neurotransmitter release and quantification
Neurotransmitter synthesis and release was assessed at 18Mat. Neurospheres plated on PLOF-coated glass coverslips were washed with PBS and exposed to a high-potassium-depolarizing solution (100 mM KCl buffer; Supplementary Table S4) for 15 min. The obtained supernatant was then collected and stored at −20°C prior to high-performance liquid chromatography (HPLC) analysis. Dopamine in cell supernatants was quantified by HPLC after sample precipitation with 10% perchloric acid (8:1). The separated monoamines were detected by fluorescence 20 and quantified by comparison to a calibration curve of dopamine. GABA was quantified by HPLC after supernatant freeze drying, using a precolumn derivatization method (Waters AccQ.Tag Amino Acid Analysis) previously described. 21
Electrophysiology recording
Neurospheres were visualized in an inverted phase-contrast microscope. Whole-cell voltage-clamp recordings were made from neurons within differentiated neurospheres at room temperature using an Axopatch 200B (Axon Instruments, Inc.). Microelectrode contact to individual cells was made visually (cells on the neurosphere surface) or in deeper layers, using the blind approach common in brain slice recordings.
22
Microelectrodes (1.2–3.0 MΩ) were pulled from borosilicate glass (Science Products GmbH). Two sets of solutions were used: one to record voltage-activated K+ conductances and to estimate membrane potential (Vm, under current clamp) (set 1), and a second to record excitatory ligand-activated currents (set 2). For set 1, electrodes were filled with solution containing (in mM) KMeSO4 (140), MgCl2 (1), HEPES (10), EGTA (10), CaCl2 (1), Na2ATP (2), and Na-GTP (0.4) (pH 7.2–7.3) and titrated with KOH (calculated free [Ca2+]=60 nM by Webmaxclite v1.15; MaxChelator), and external solution to record outward K+ currents contained (in mM) NaCl (135), KCl (5.4), CaCl2 (2), MgCl2 (1.5), HEPES (10), and
The junction potentials estimated on JPCalc software (v2) for the external solution for set 1 of solutions was −8.8 and −8.5 mV for set 2 of solutions; data were not corrected for the junction potential. Currents were measured with cell capacitance compensation and series resistance compensation (80%), filtered at 2 kHz, sampled at 5 kHz, using a Digidata 1200 ADC converter (Axon Instruments) and pClamp software (v6). Time was allowed for the stabilization of the recording before experiments were conducted.
Different voltage-clamp protocols were applied according to the experimental needs, as follows: (1) to study outward currents: a single command pulse to a fixed voltage was used and, to isolate the fast-current component, such command pulse was preceded by a pulse to −120 or to −30 mV. Sets of incremental depolarizing commands were used for the characterization of the voltage dependence of activation. In this protocol, leakage current was compensated a posteriori from the current-voltage relation generated by a set of 12 prepulses in increments of 2 mV from −75 mV. To study steady-state inactivation, a single-command step was preceded by incremental prepulses.
23
Whole-cell data were analyzed using Clampfit (v9) (Axon Instruments, Inc.), Pulsefit (v8.67), and Origin (v5) (Microcal Origin). Outward currents were measured as illustrated previously.
23
Peak current was taken for current amplitude of the faster current component; for each experiment, current decay was best fit with a sum of two exponentials (Eq. 3). For each current sweep, the amplitude of the slower component was taken at a time equal to 5×τfast from the start of the command pulse. For steady-state inactivation and activation profiles, current values were fit with the following Boltzmann equation:
where I is the current amplitude at the test potential V, V1/2 is the half-activation potential, Vs is the slope constant, and A1 and A2 are coefficients.
In the case of voltage dependence of activation, data were converted to conductance using the relationship G=I/(V −EK+), where I is current amplitude, V is the step command potential, and EK+ the estimated equilibrium potential for K+. Results were plotted against the step command potential and fit with the following equation:
In the vast majority of the cases, current relaxations required the sum of two exponentials, using the following equation:
where τfast and τslow are the time constants of the fast and slow inactivating components, respectively; Afast and Aslow are the respective coefficients; and C is a constant.
Statistical analysis
Data are expressed as the mean±standard error of the mean. Data were analyzed using GraphPad Prism (version 5.01) by an analysis of variance, followed by Tukey's post-hoc multiple-comparison test, and for metabolic profiling data using a two-tailed t-test. The α value was set at 0.05 with a 95% confidence interval and statistical significance was defined based on p-value (***p<0.001, **p<0.01, and *p<0.05).
Results
hmNPC 3D differentiation induces molecular, metabolic, and morphological remodeling
To determine the potential of hmNPCs to generate innovative cellular models for CNS diseases, we assessed the cellular changes induced by 3D culture conditions. For multipotent hmNPC differentiation, cells expanded in two-dimensional (2D) cultures were kept in suspension culture systems with constant stirring (Fig. 1A). As recently described by our group, 10 hmNPCs efficiently organized into neurospheres, resulting in a homogenous culture in terms of neurosphere size, ranging between 300 and 400 μm, as well as high cell viability (Supplementary Fig. S1A, B).
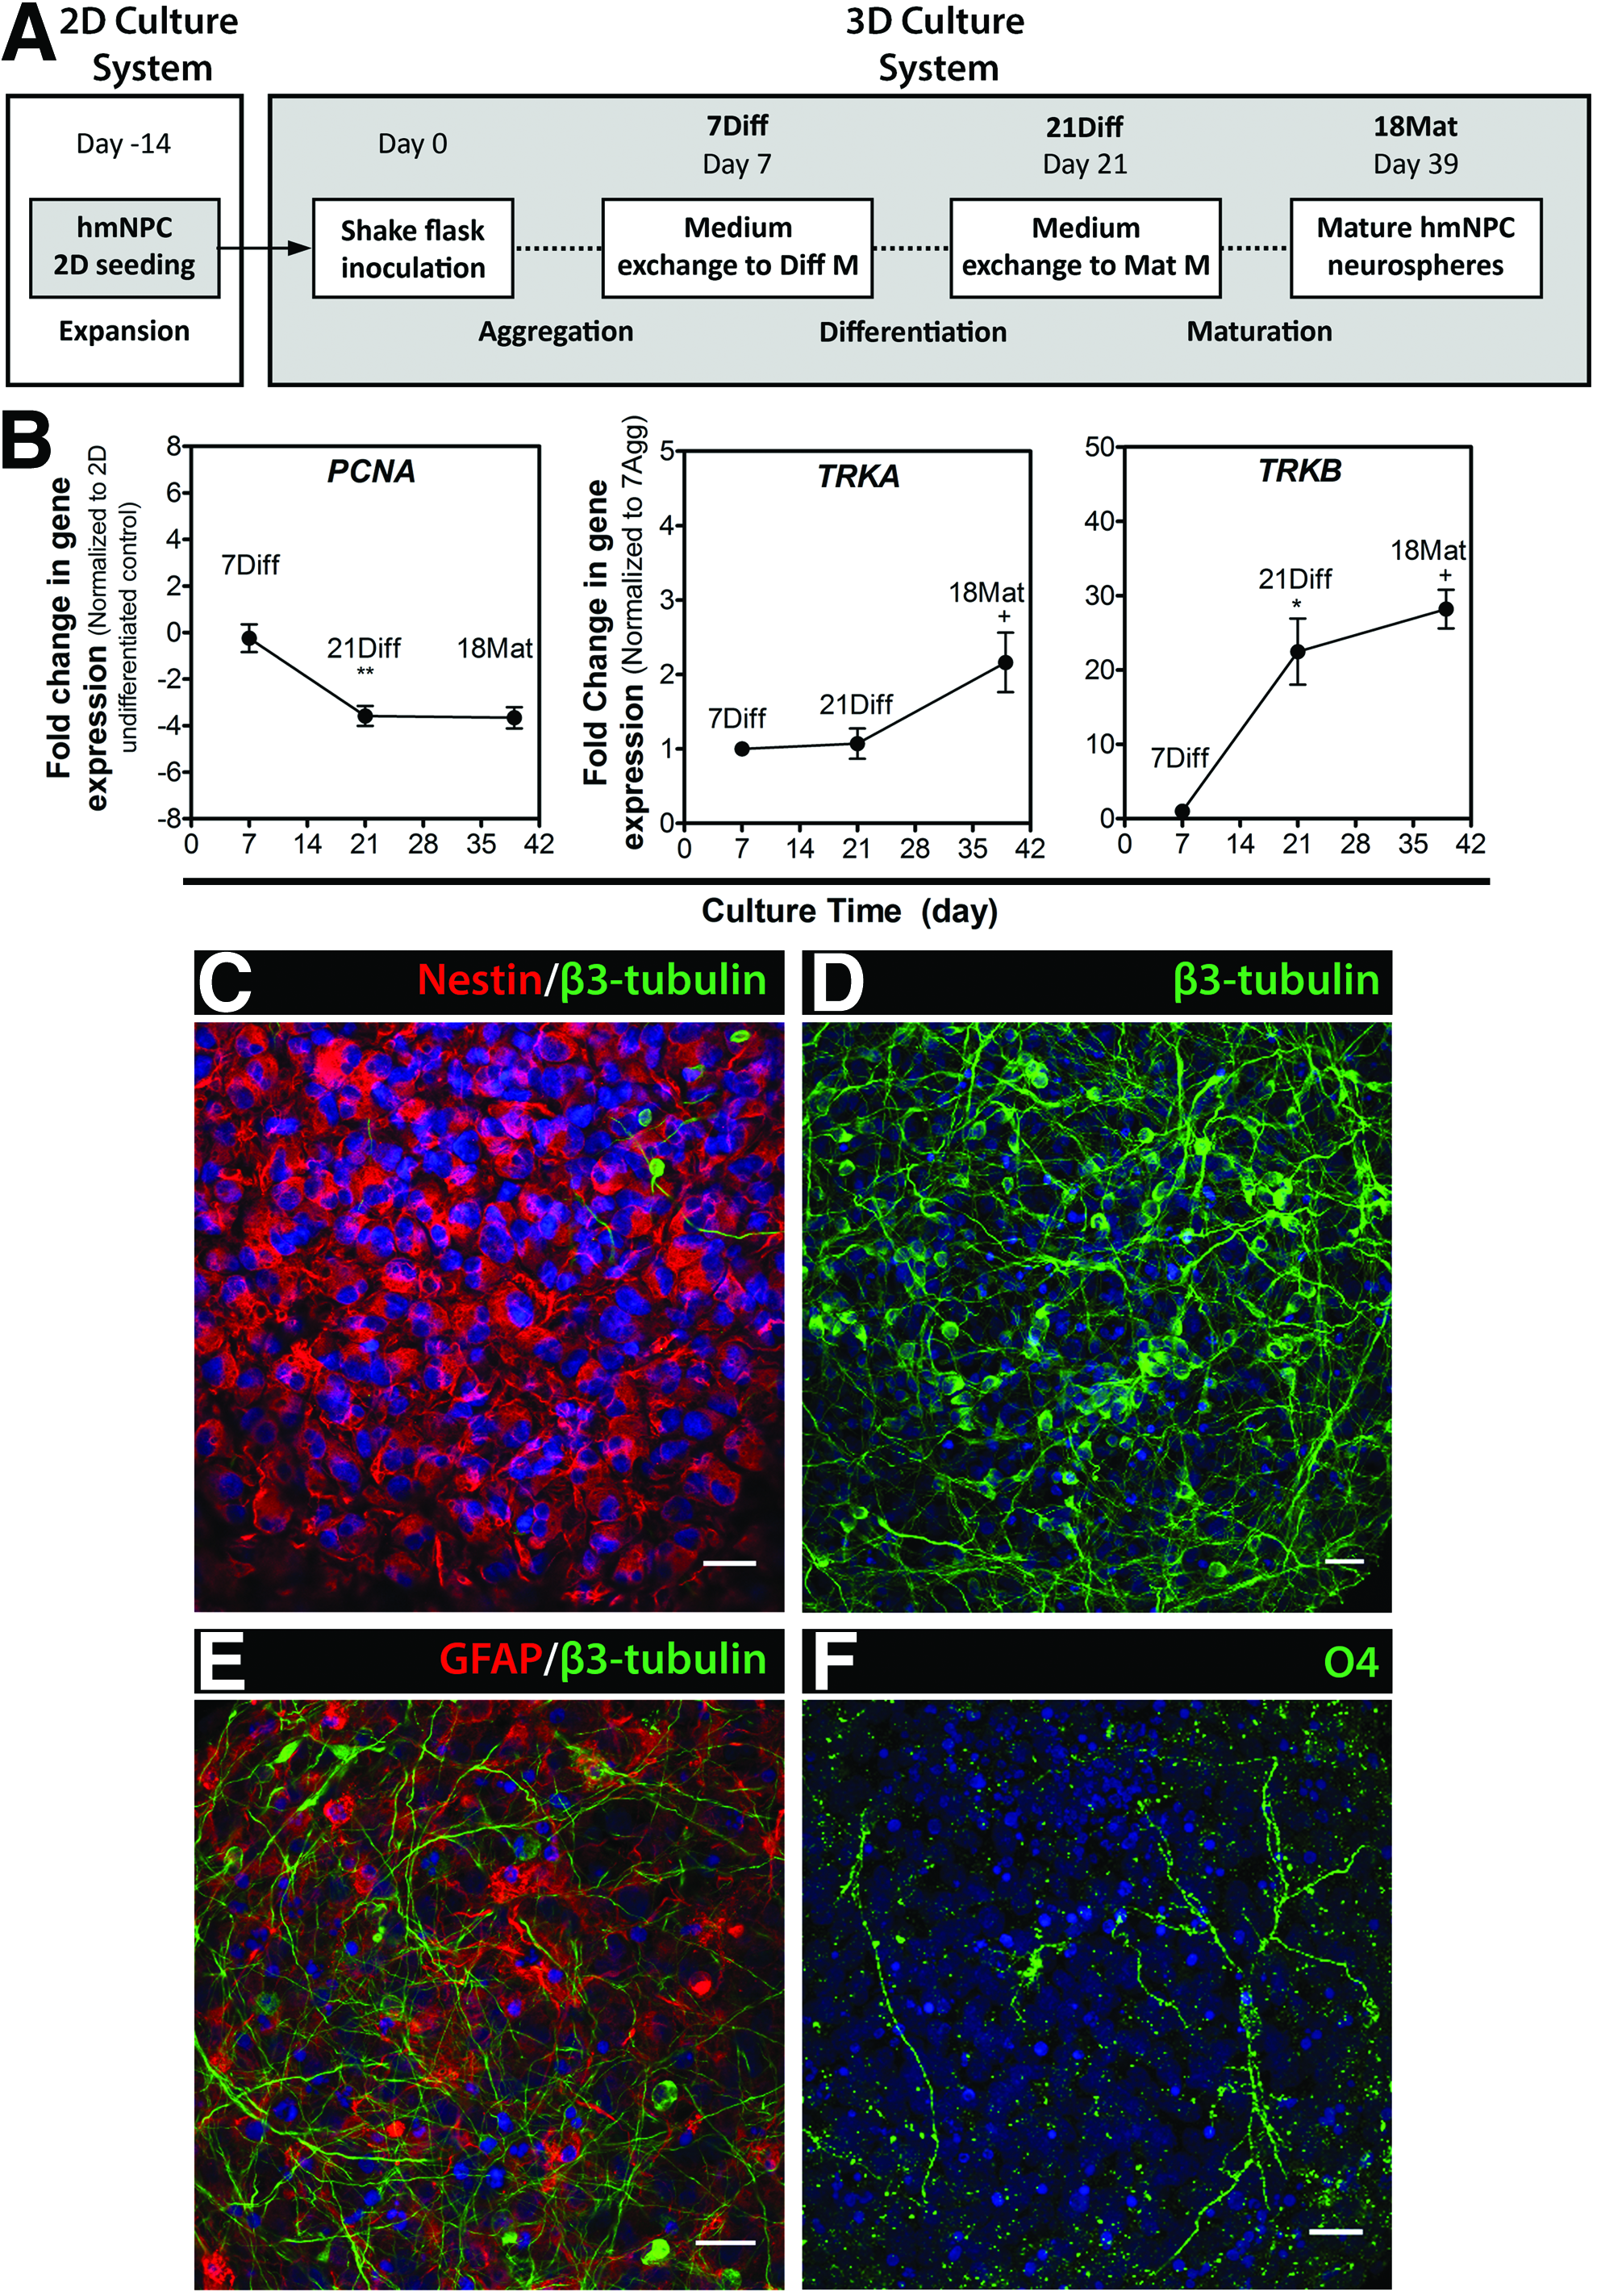
Differentiation and cell population dynamics of hmNPCs as 3D neurospheres.
The onset of differentiation led to a significant downregulation (up to 4-fold) in the expression of the DNA polymerase cofactor PCNA (Fig. 1B), which was maintained during 32 days of differentiation, suggesting a decrease in cell proliferation. Concomitantly, the neurotrophic receptors TrkA and TrkB were positively modulated upon differentiation with a 2- and 28-fold increase at 18Mat, respectively (Fig. 1B). The expression of these tyrosine kinase receptors, activated by different neurotrophic factors, has been correlated with midbrain dopaminergic neurons during pre- and postnatal development,24,25 with reports suggesting an increased dependence on TrkB/BDNF signaling with differentiation. 26
In contrast to 7Diff, when cells presented predominantly a progenitor phenotype, expressing the early neuroepithelial marker nestin (Fig. 1C), by 18Mat, a dense neurite network of β3-tubulin-positive neurons was observed both at the surface and inside the neurospheres (Fig. 1D). Moreover, differentiation into the three neural lineages was observed, as cells positive for the astrocytic-lineage marker glial fibrillary acidic protein (GFAP) and oligodendrocytic-lineage O4 were also detected (Fig. 1E, F).
Morphological changes, including membrane rearrangements and cytoplasmic volume reduction, were observed during the differentiation process (Fig. 2; Supplementary Videos S1 and S2), with a transition from lamellipodia, which were abundant in early differentiation stages (Fig. 2A, C), toward filopodia (Fig. 2B, D). In parallel, the complexity of cell processes and arborization of the network increased (Fig. 2E, F), with thin filopodia (0.2–0.5 μm) protruding from the cell processes (Fig. 2H), which may indicate the ability of differentiating neurons to undergo synaptogenesis and form dendritic spines.27,28 Putative synaptic precursor sites were already visible in 7Diff neurospheres (Fig. 3D), suggesting that the synaptic machinery might be activated at early differentiation stages. Ultrastructural examination revealed intact mitochondria, Golgi apparatus, and endoplasmic reticulum both in undifferentiated (7Diff, Fig. 3C) and differentiated cultures (21Diff and 18Mat, Fig. 3G, K respectively), consistent with the cells within the neurospheres being healthy and metabolically active. These features were observed throughout the neurospheres (for 7Diff, 21Diff, and 18Mat; Fig. 3A, B and E, F and I, J, respectively), which lacked any obvious sign of a necrotic center (Supplementary Videos S1–S3). Interestingly, in differentiated cultures (21Diff), it was also possible to identify cells with morphological features typical of oligodendrocytes, enfolding neighboring cells with membrane protrusions (Fig. 3H). By 18Mat putative synaptic sites enriched in synaptic vesicles and contacting adjacent cells were identified (Fig. 3L).
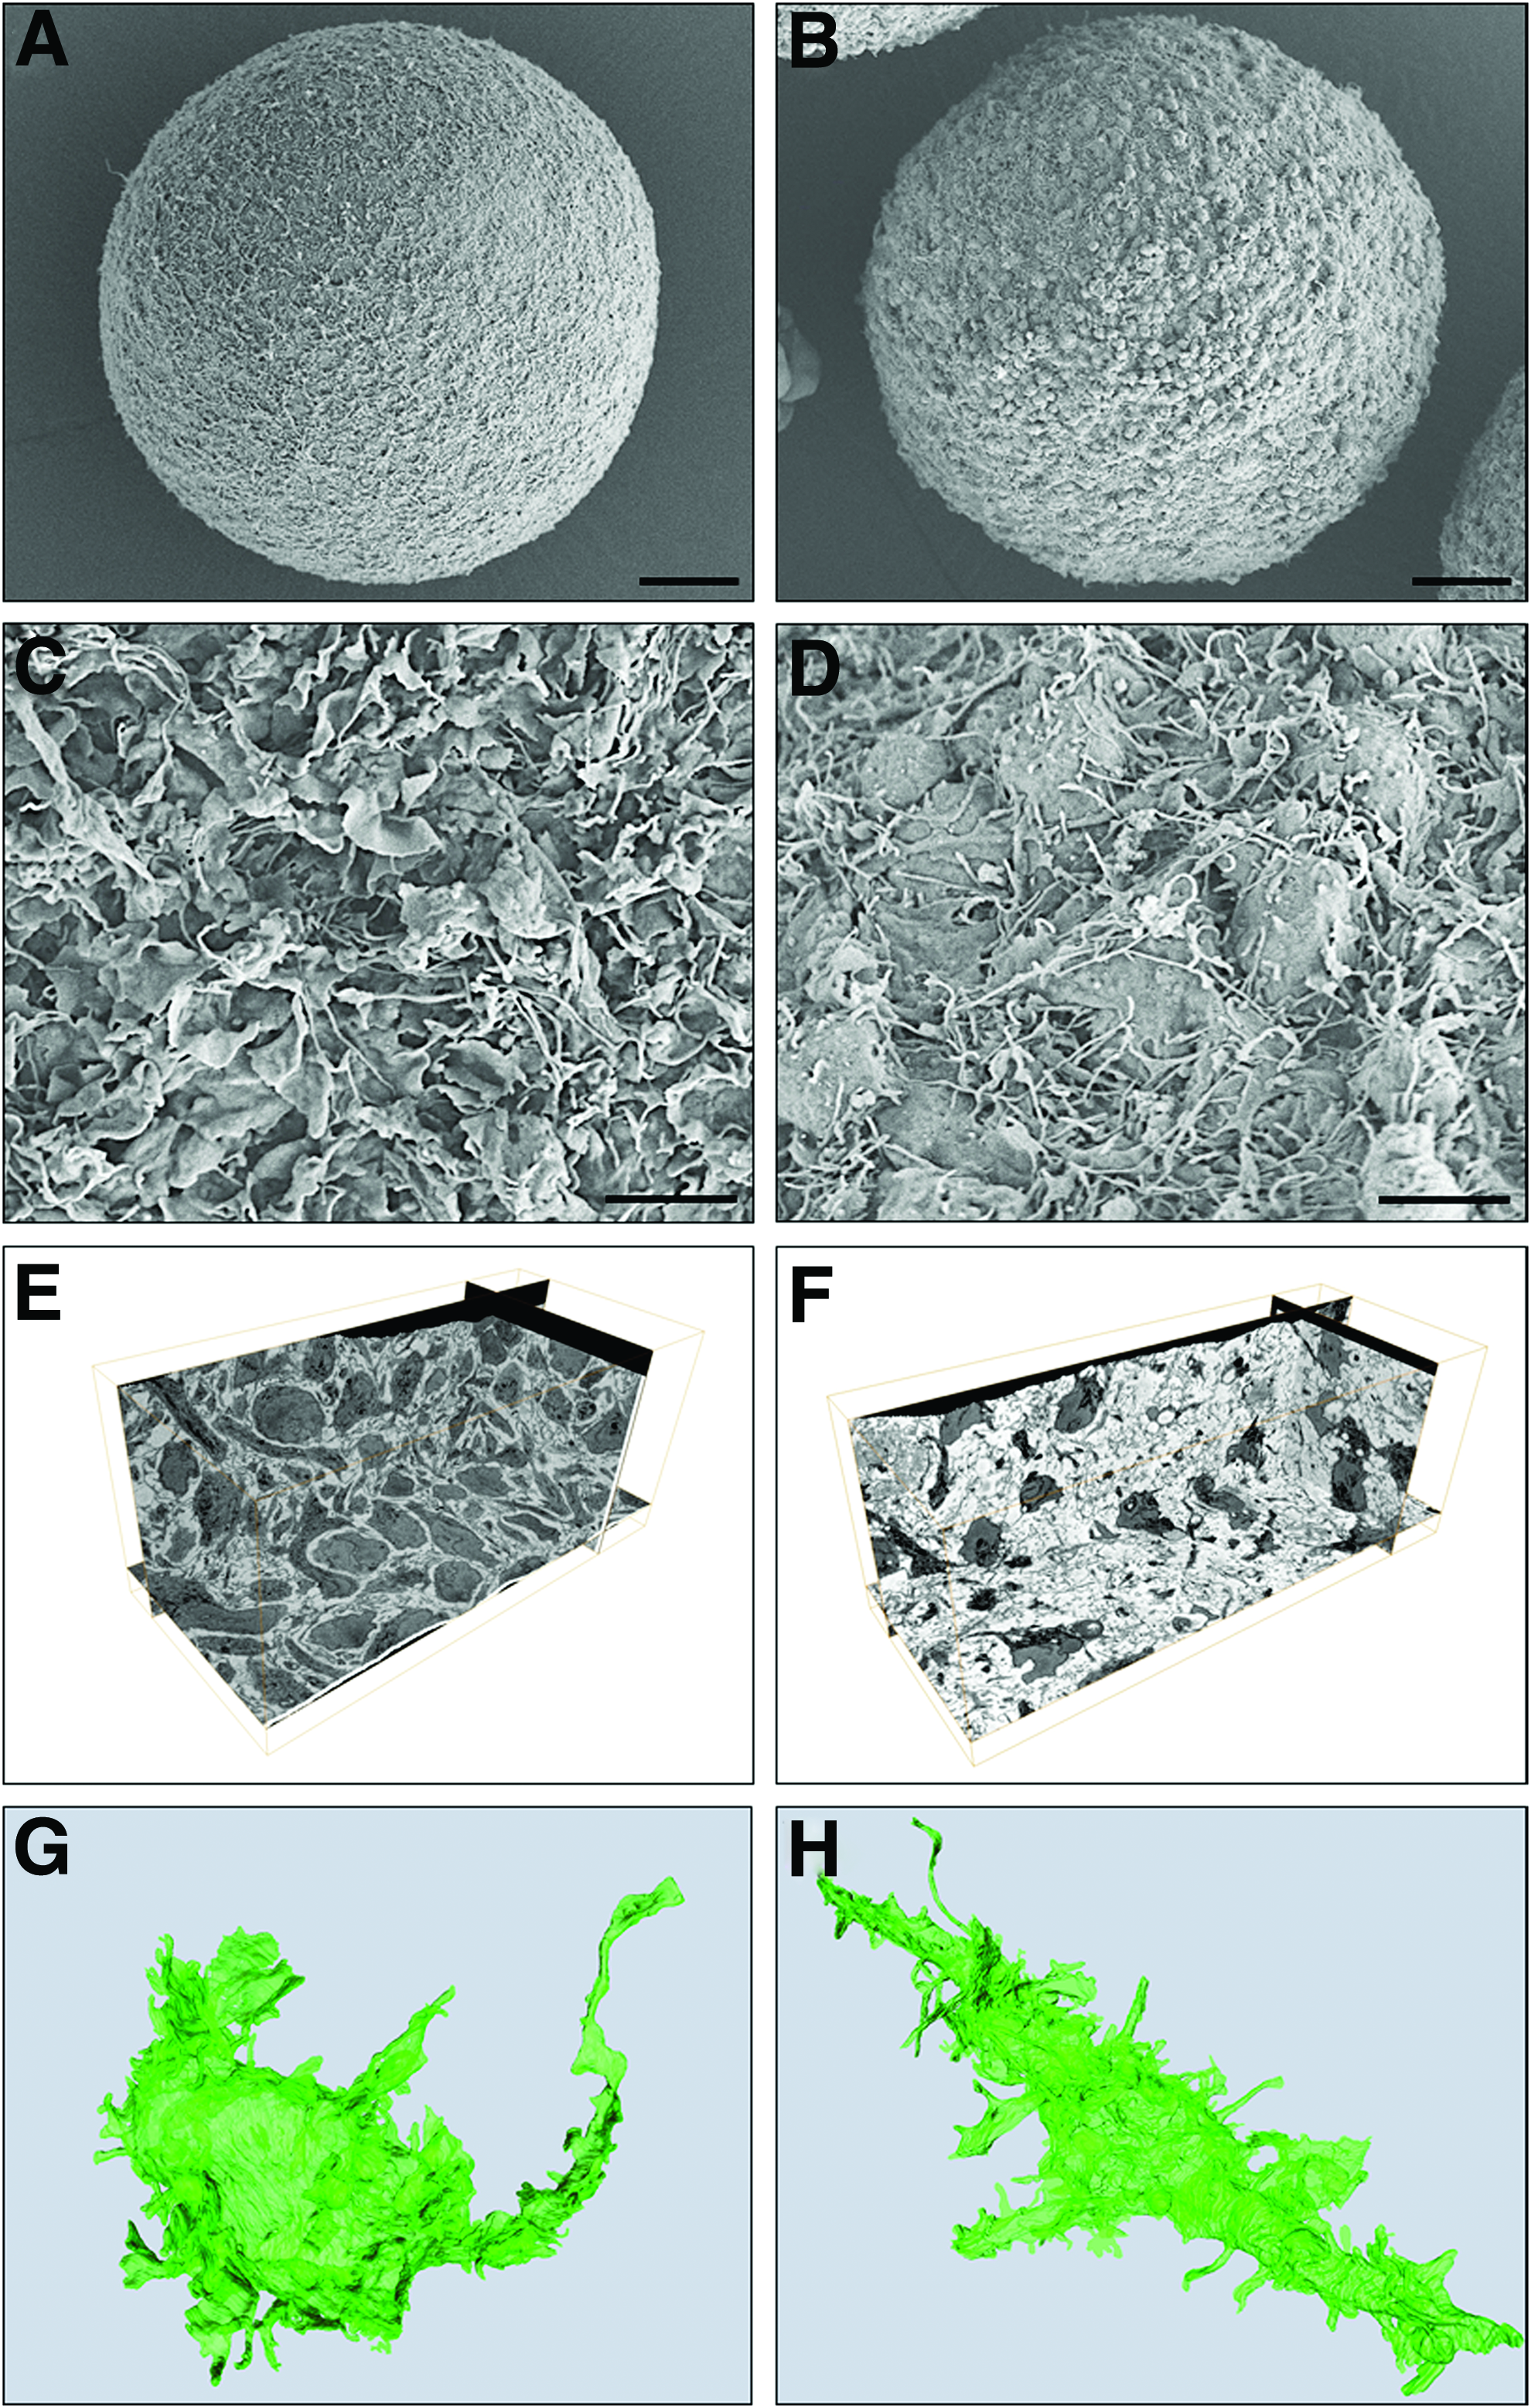
Morphological characterization of hmNPC neurospheres along differentiation.

Ultrastructural characterization of hmNPC neurospheres along differentiation. Transmission electron microscopy of external
Aiming at assessing metabolic alterations along differentiation, 1 H-NMR metabolic profiling of cell supernatants along 48 h of culture was determined for undifferentiated and differentiated hmNPC neurospheres (Fig. 4; Supplementary Fig. S2). 7Diff neurospheres presented high-glucose consumption to lactate production ratio (YLac/Glc=1.68±0.22), indicating anaerobic glucose utilization in progenitor cells. Despite taking up glucose at lower rates (Fig. 4B), differentiated hmNPC neurospheres maintained the reliance on glycolytic metabolism (YLac/Glc=1.91±0.12). As for pyruvate uptake and alanine accumulation rates, a 4-fold increase and decrease, respectively, were observed (Fig. 4B), suggesting changes during differentiation in the alanine-lactate shuttle. Although glutamate was not detected in hmNPC cultures, its cyclized form pyroglutamate was released at higher rates in differentiated cultures (Fig. 4A, B). Conversely, the accumulation rates of 2-oxoisocaproate and methylsuccinate, metabolites that result from the metabolism of branched-chain amino acids (BCAAs), were maintained in undifferentiated and differentiated cultures.
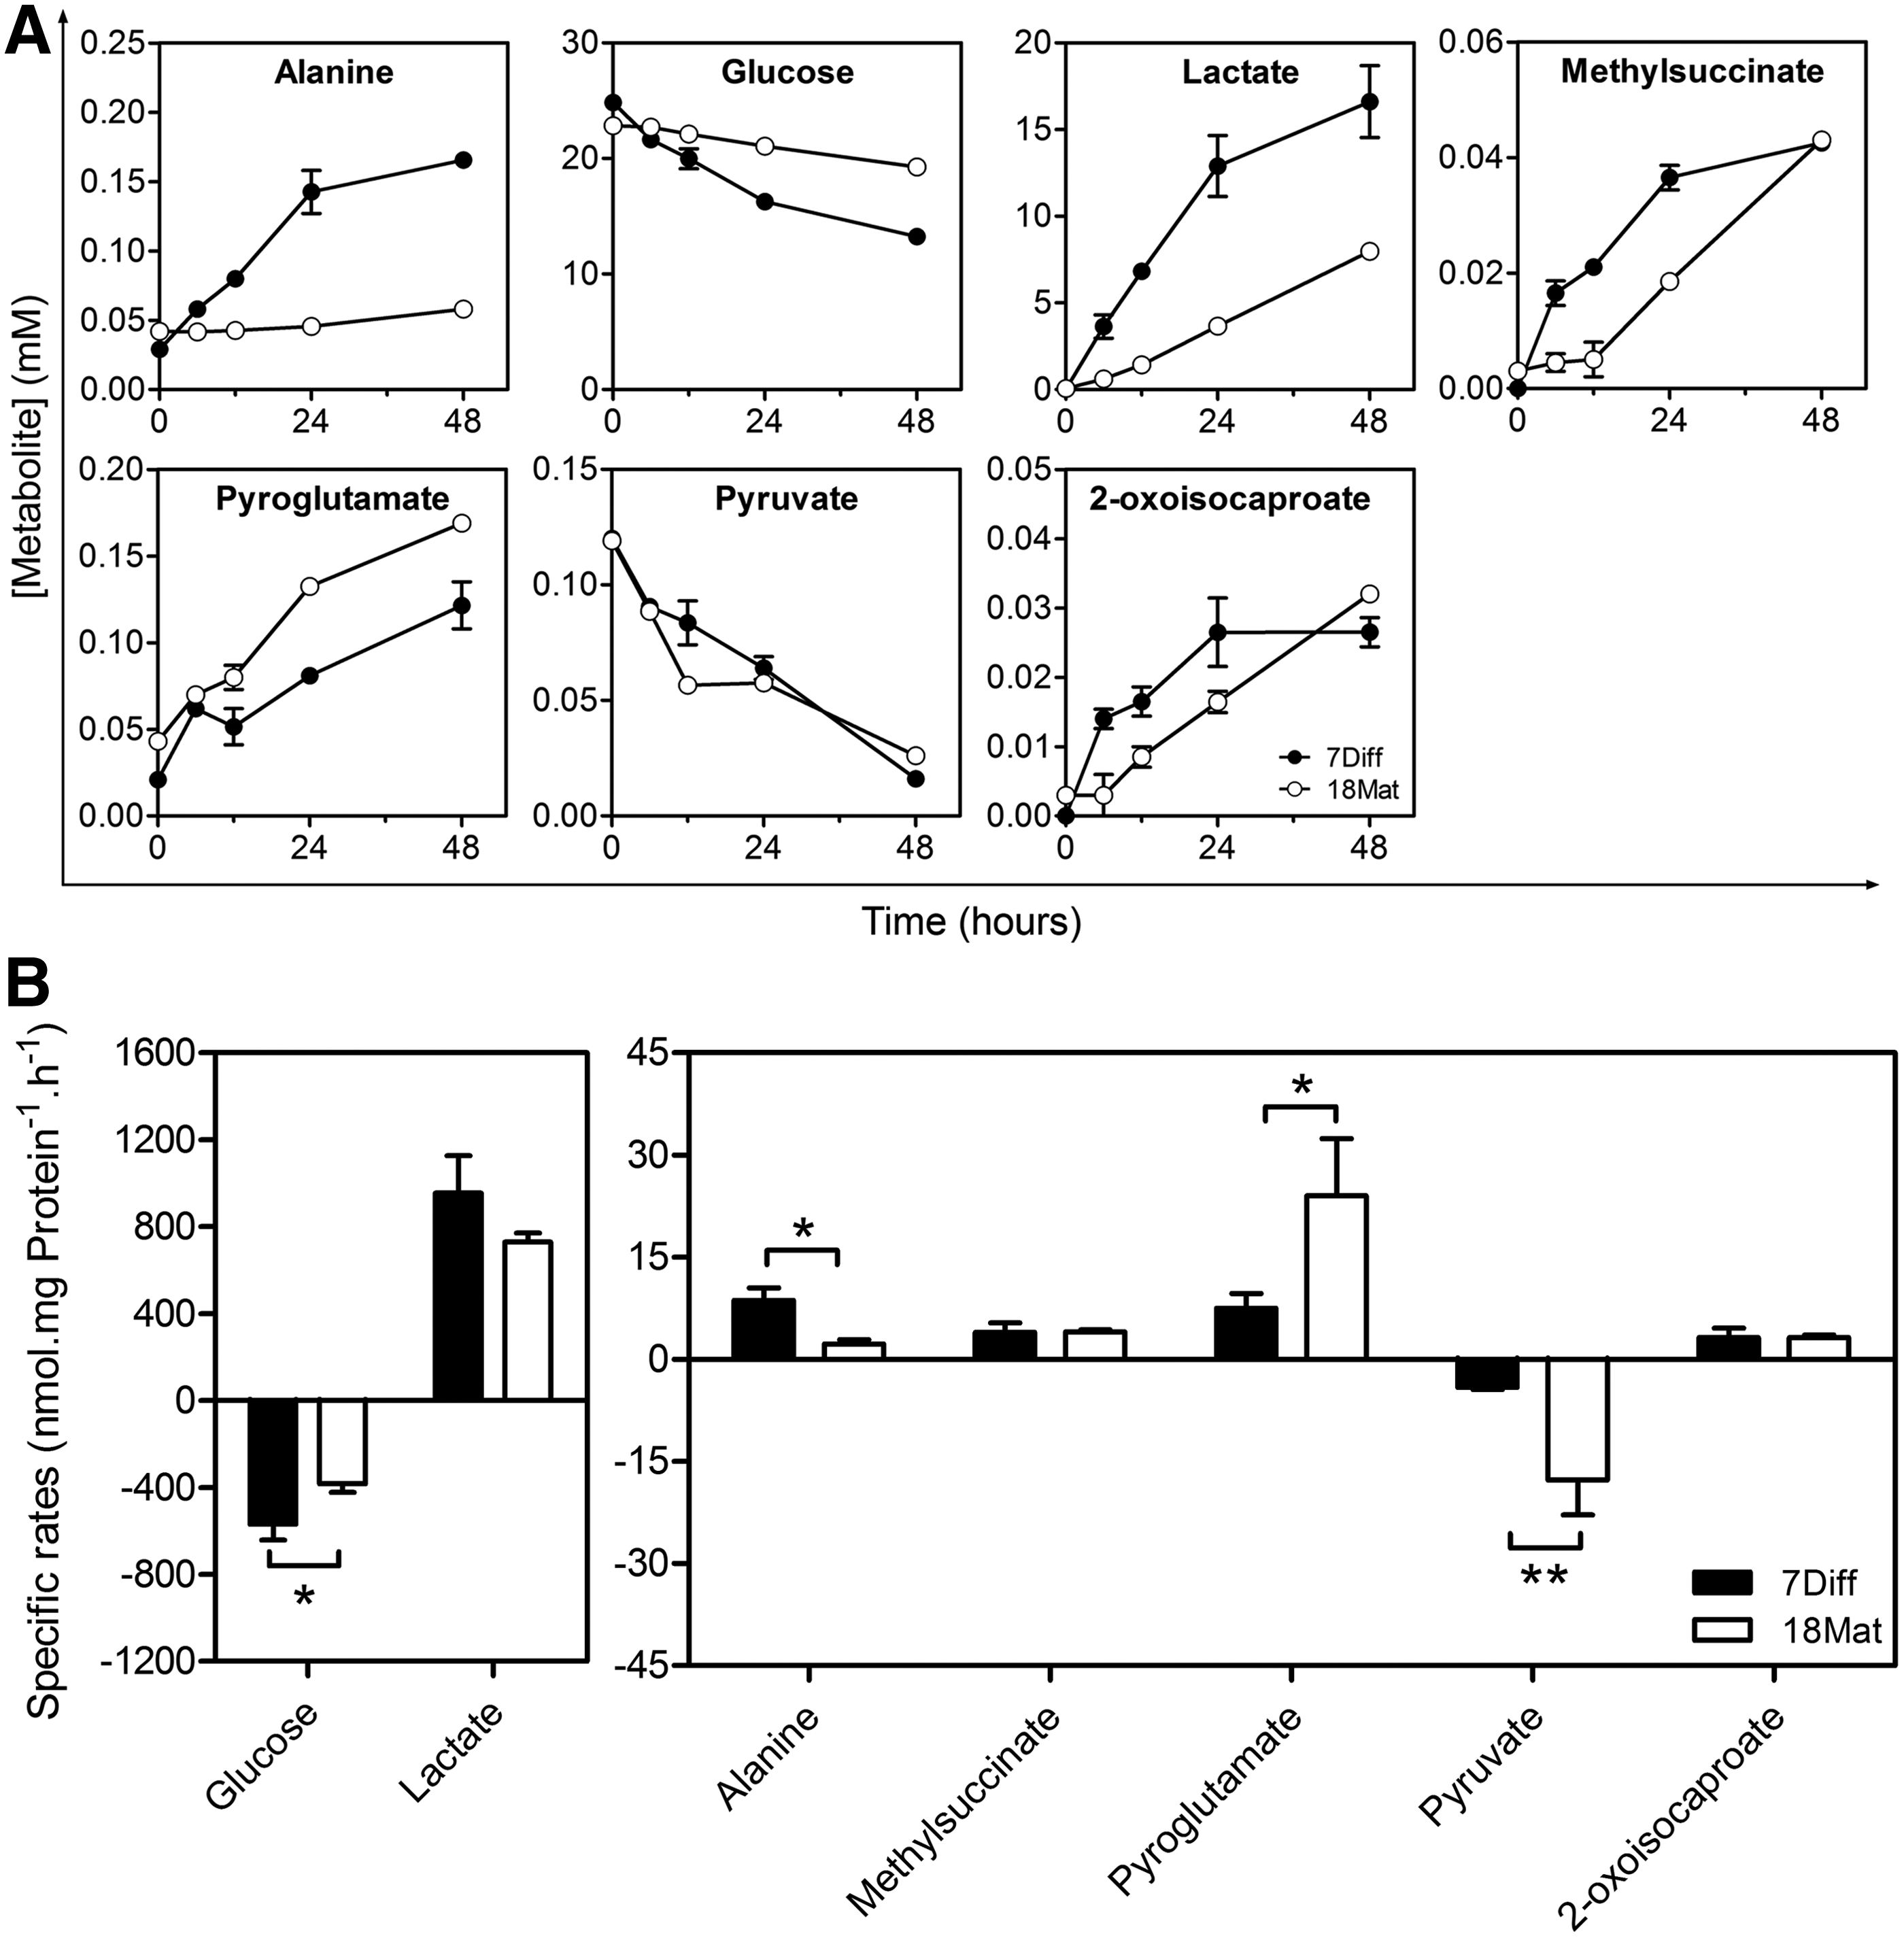
Metabolic profiling of hmNPC neurospheres along differentiation.
3D differentiation activates neurogenesis developmental pathways
A coordinated change in gene expression is a hallmark of cellular differentiation. We therefore decided to study the transcriptomic programs that were modulated during hmNPC neurosphere differentiation. Global transcriptional analysis was performed in differentiated neurospheres (21Diff) and compared with undifferentiated hmNPCs (Fig. 5A). The gene expression profile showed that 807 probes, which corresponded to 664 unique genes, were differently modulated upon neurosphere differentiation.
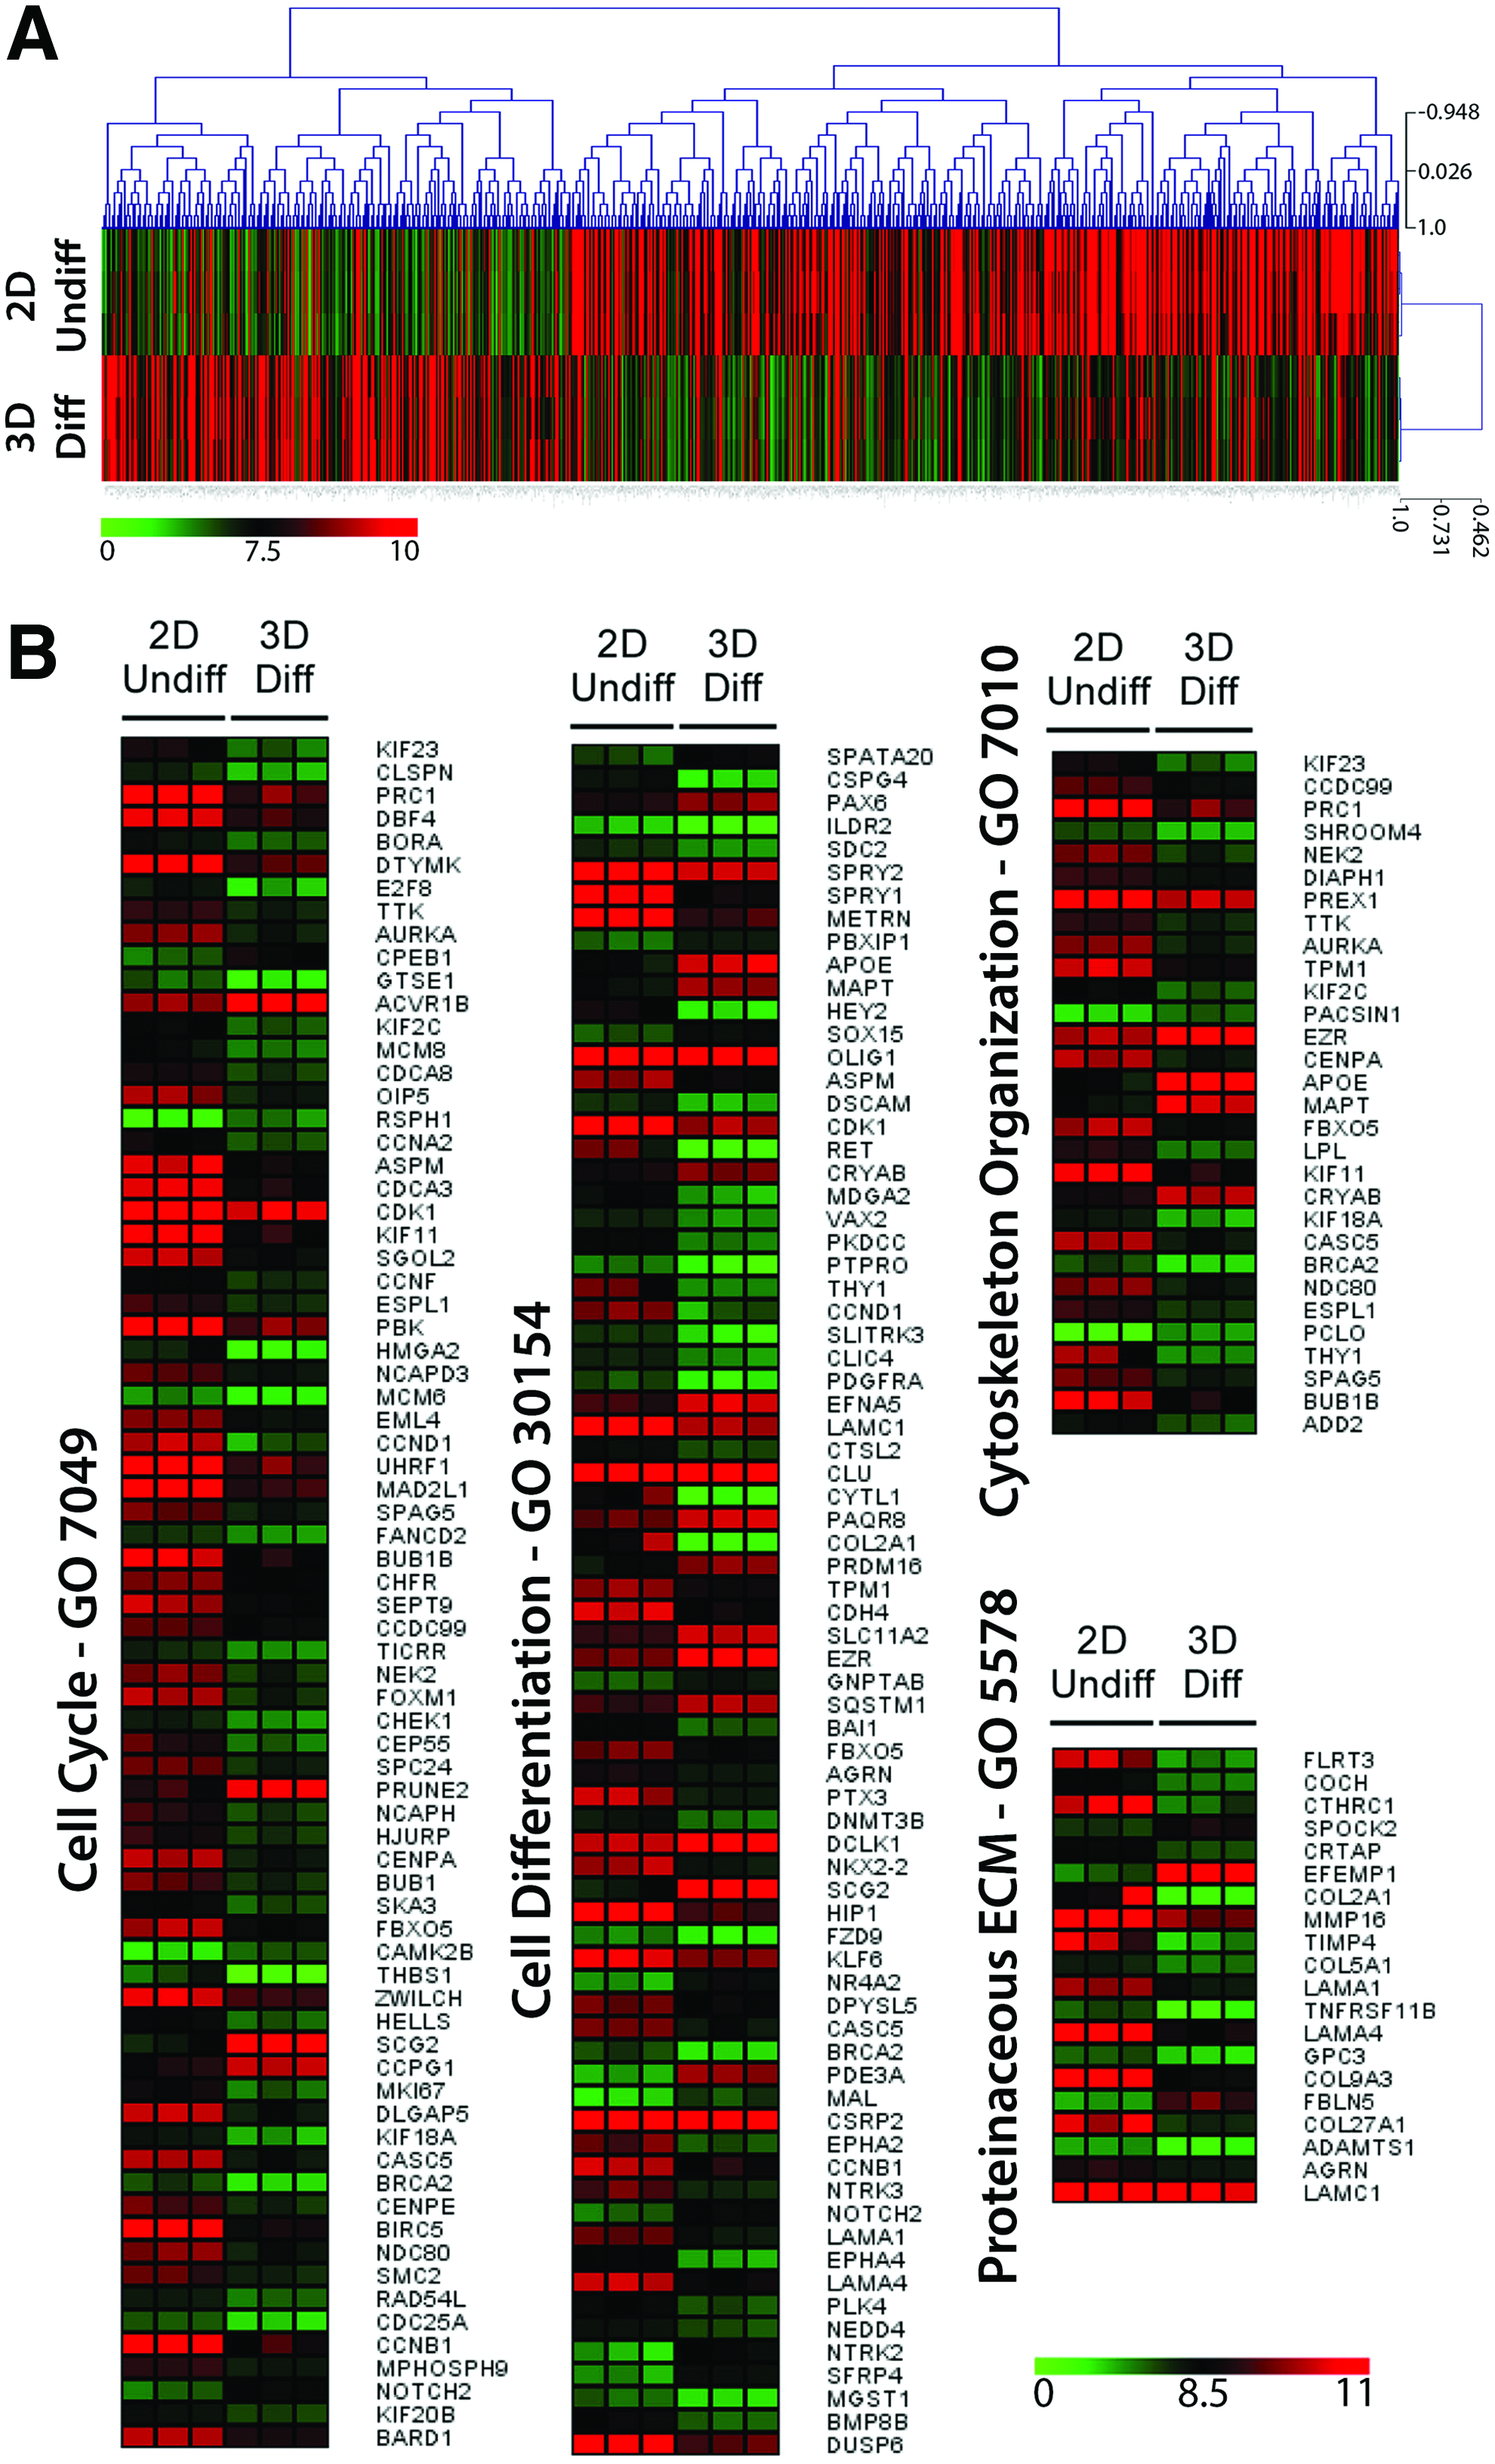
Global gene expression analysis of differentiated hmNPC neurospheres.
GO analysis showed that the 3D differentiation process led to a significant enrichment in genes involved in cell cycle, cell differentiation, cytoskeleton organization, and proteinaceous ECM (Fig. 5B). Genes involved in the cell cycle progression, such as MKI67, cyclin A2, cyclin B1, and cyclin D1, and mitotic genes like BUB1B, BUB1, CCNB1, CDC25A, CDK1, AURKA, KIF23, MAD2L1, and BIRC5 were significantly downregulated after 3D differentiation, suggesting an increase in cells exiting the cell cycle. Additionally, markers of neural stem cells, such as SPRY1, SPRY2, and FBXO5, were also downregulated, whereas genes involved in neurogenesis and neuronal metabolism, namely, NOTCH2, PAX6, PRDM16, NR4A2, PDE3A, DCLK1, SCG2, PAQRB, EFNA5, MAPT, APOE, and MAL, were increased. The activation of TGFβ1-signaling-associated genes, such as ACVR1B or PRUNE2, which are involved in the maintenance of mature CNS, 29 suggests maturation of the neuronal population. Several ECM-associated genes were downregulated after differentiation, such as genes involved in collagen synthesis and binding (COL2A1, COL5A1, COL9A3, COL27A1, CTHRC1, and CRTAP), laminin synthesis (LAMA1 and LAMA4), and fibronectin binding (FLRT3). Concomitantly, an upregulation of SPOCK2, EFEMP1, and FBLN5 genes, which code for proteins involved in glycosaminoglycan binding and proteoglycans, 30 was observed. Together these results suggested a significant remodeling of the ECM composition in the 3D environment of the differentiated neurospheres toward a higher similarity to the in vivo neural ECM composition. 31
Extended 3D differentiation enhances dopaminergic phenotype
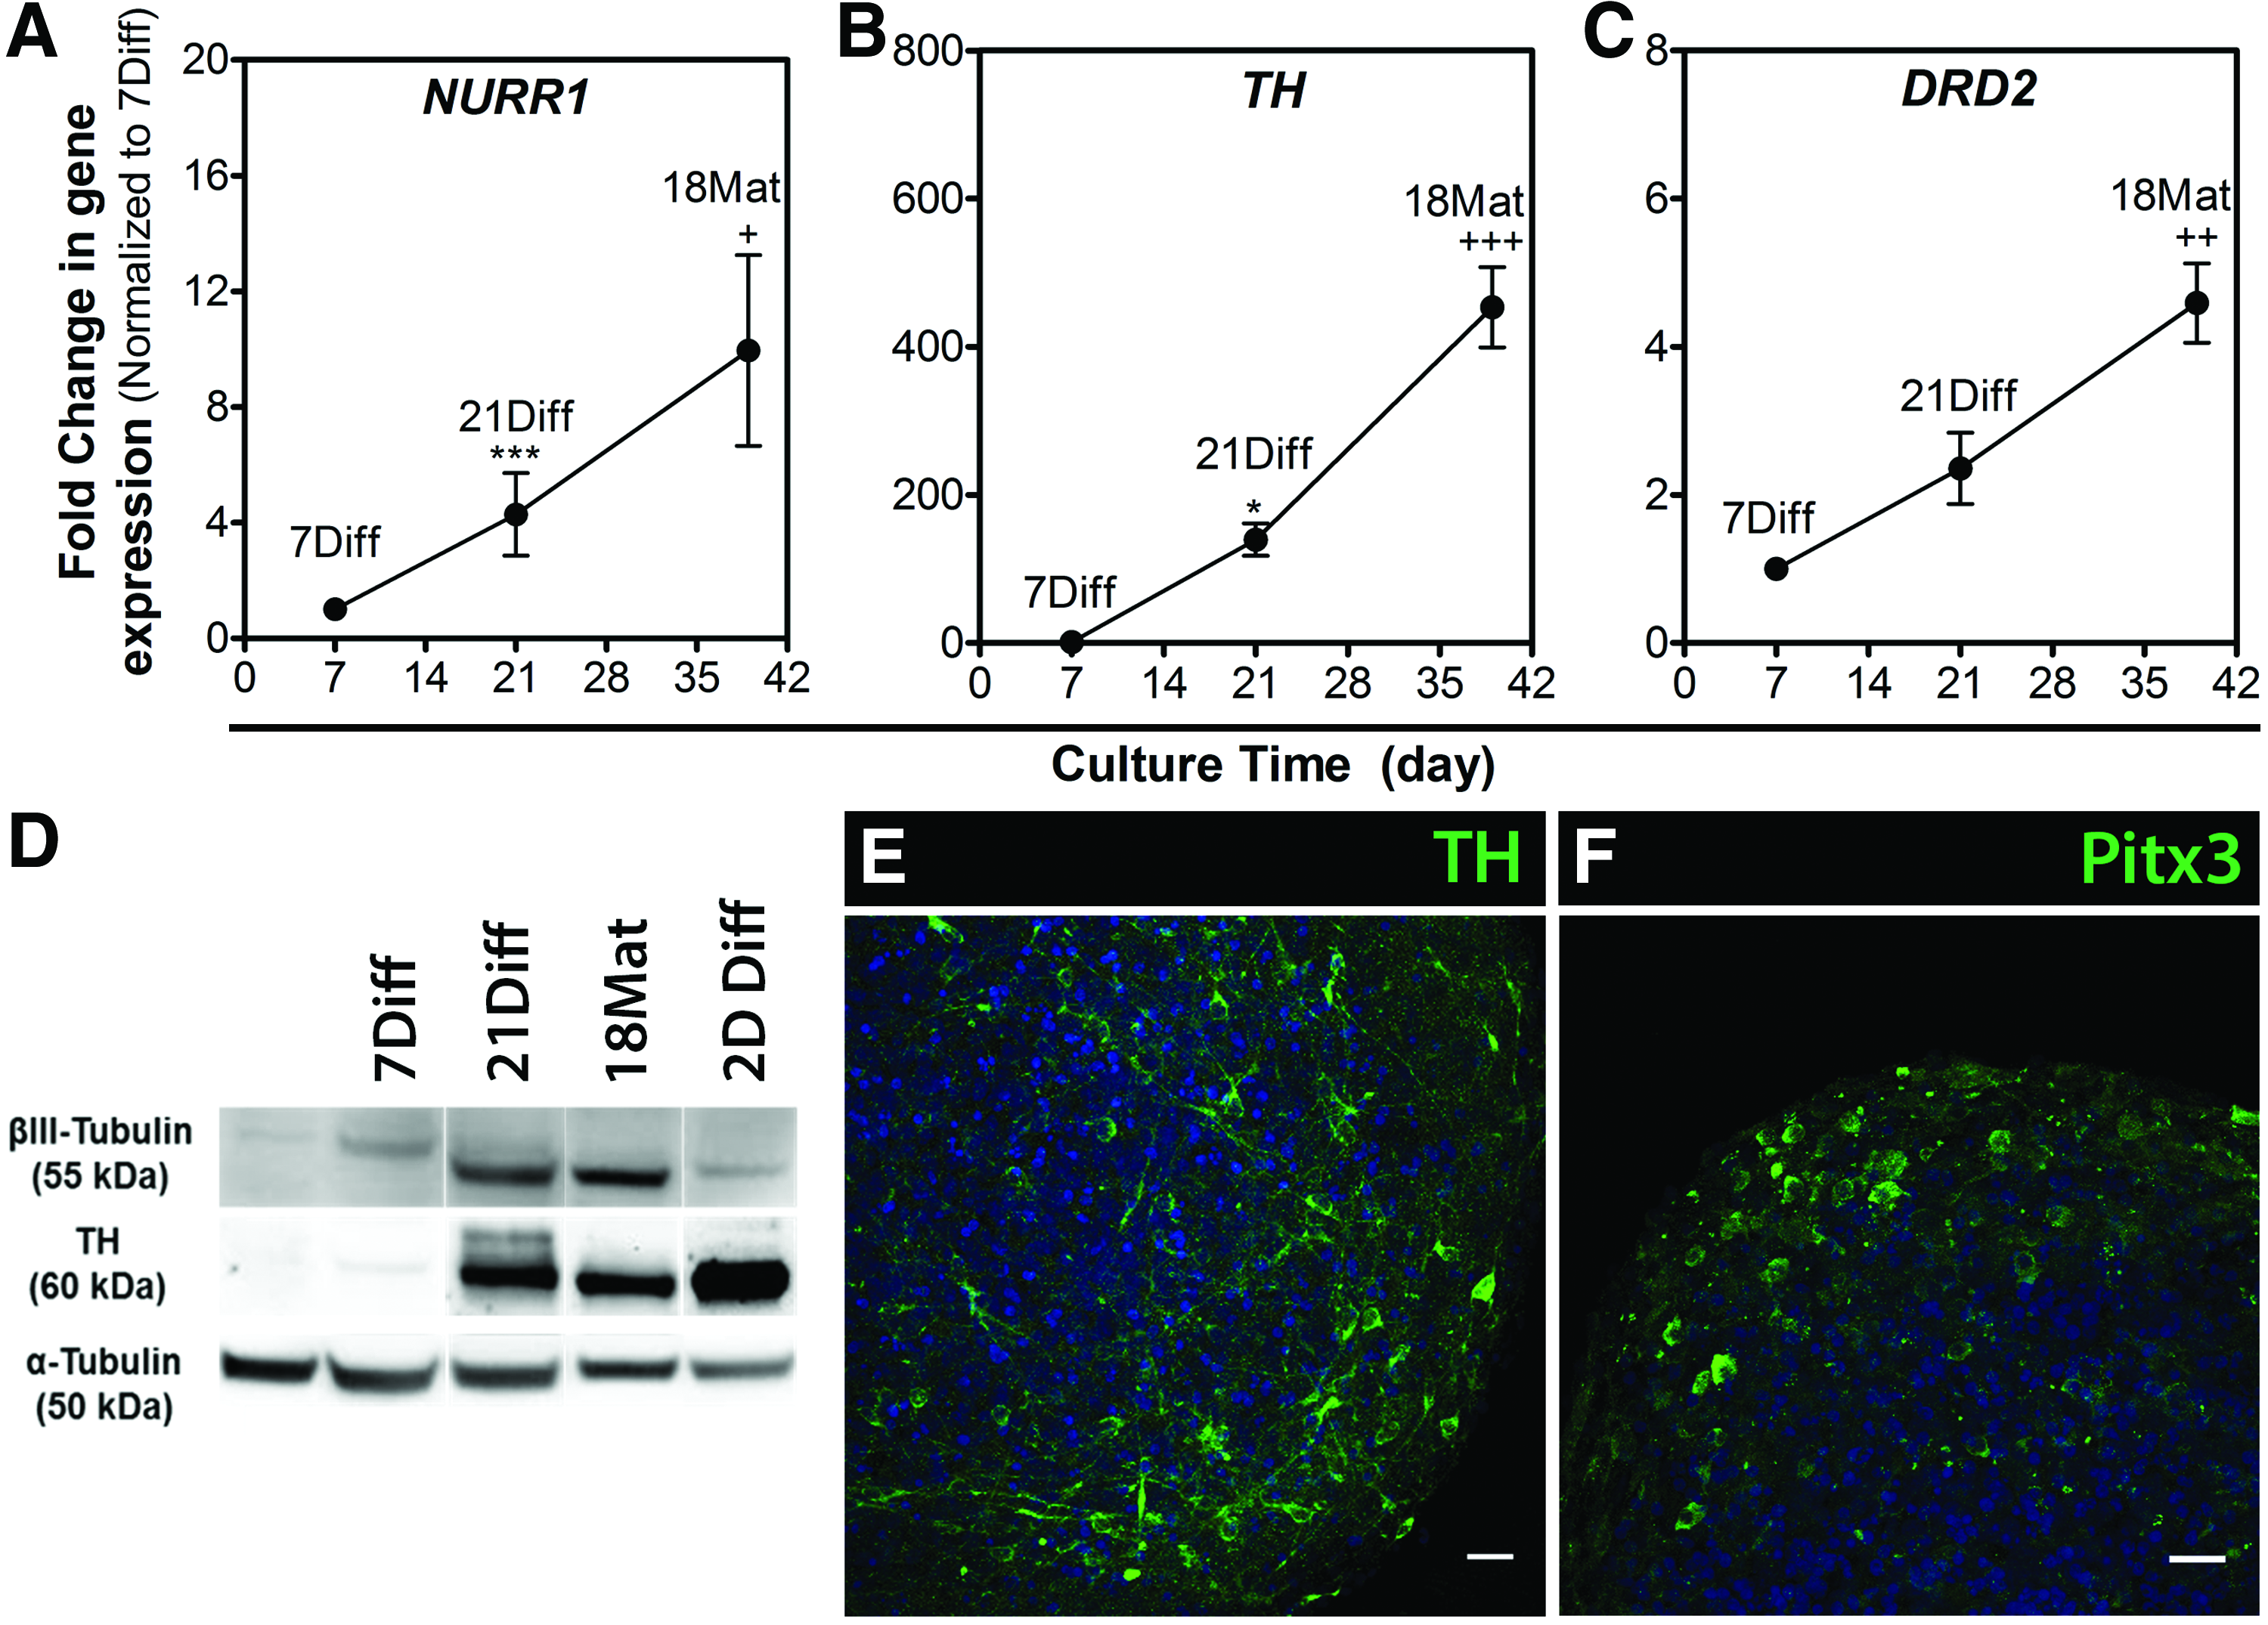
Neuronal differentiation toward the dopaminergic lineage depends on specific developmental programs that rely on the sequential activation of specific transcription factors. At 21Diff, an increase in the expression levels of NURR1, a transcription factor critical for the development of the dopaminergic phenotype; tyrosine hydroxylase (TH), the rate-limiting enzyme in dopamine synthesis; and dopamine receptor D2 (DRD2) indicated the activation of genetic pathways controlling the dopaminergic phenotype (Fig. 6A–C). Extending the differentiation process for additional 18 days in presence of cAMP led to a significant upregulation of these markers (10-, 450-, and 4-fold increase at 18Mat relatively to day 7, for NURR1, TH, and DRD2, respectively) (Fig. 6A–C). Moreover, the increase in TH protein levels along differentiation (Fig. 6D) and detection of cells positive for TH (Fig. 6E), as well as dopaminergic transcription factor Pitx3 (Fig. 6F), at 18Mat further suggested the establishment and maintenance of the dopaminergic phenotype.
Dopaminergic differentiation of hmNPC neurospheres.
Along with the expression of dopaminergic markers, a significant upregulation of the presynaptic vesicular GABA transporter (vGAT) was observed (Supplementary Fig. S3A), suggesting the coexistence of dopaminergic and GABAergic neuronal populations.
Altogether, our results indicated that hmNPC neurospheres retained their midbrain developmental patterns by expressing key dopaminergic markers upon differentiation, and revealed the importance of extending the differentiation process by 18 days to increase the neuronal differentiation efficiency.
Neuronal maturation and synaptic functionality
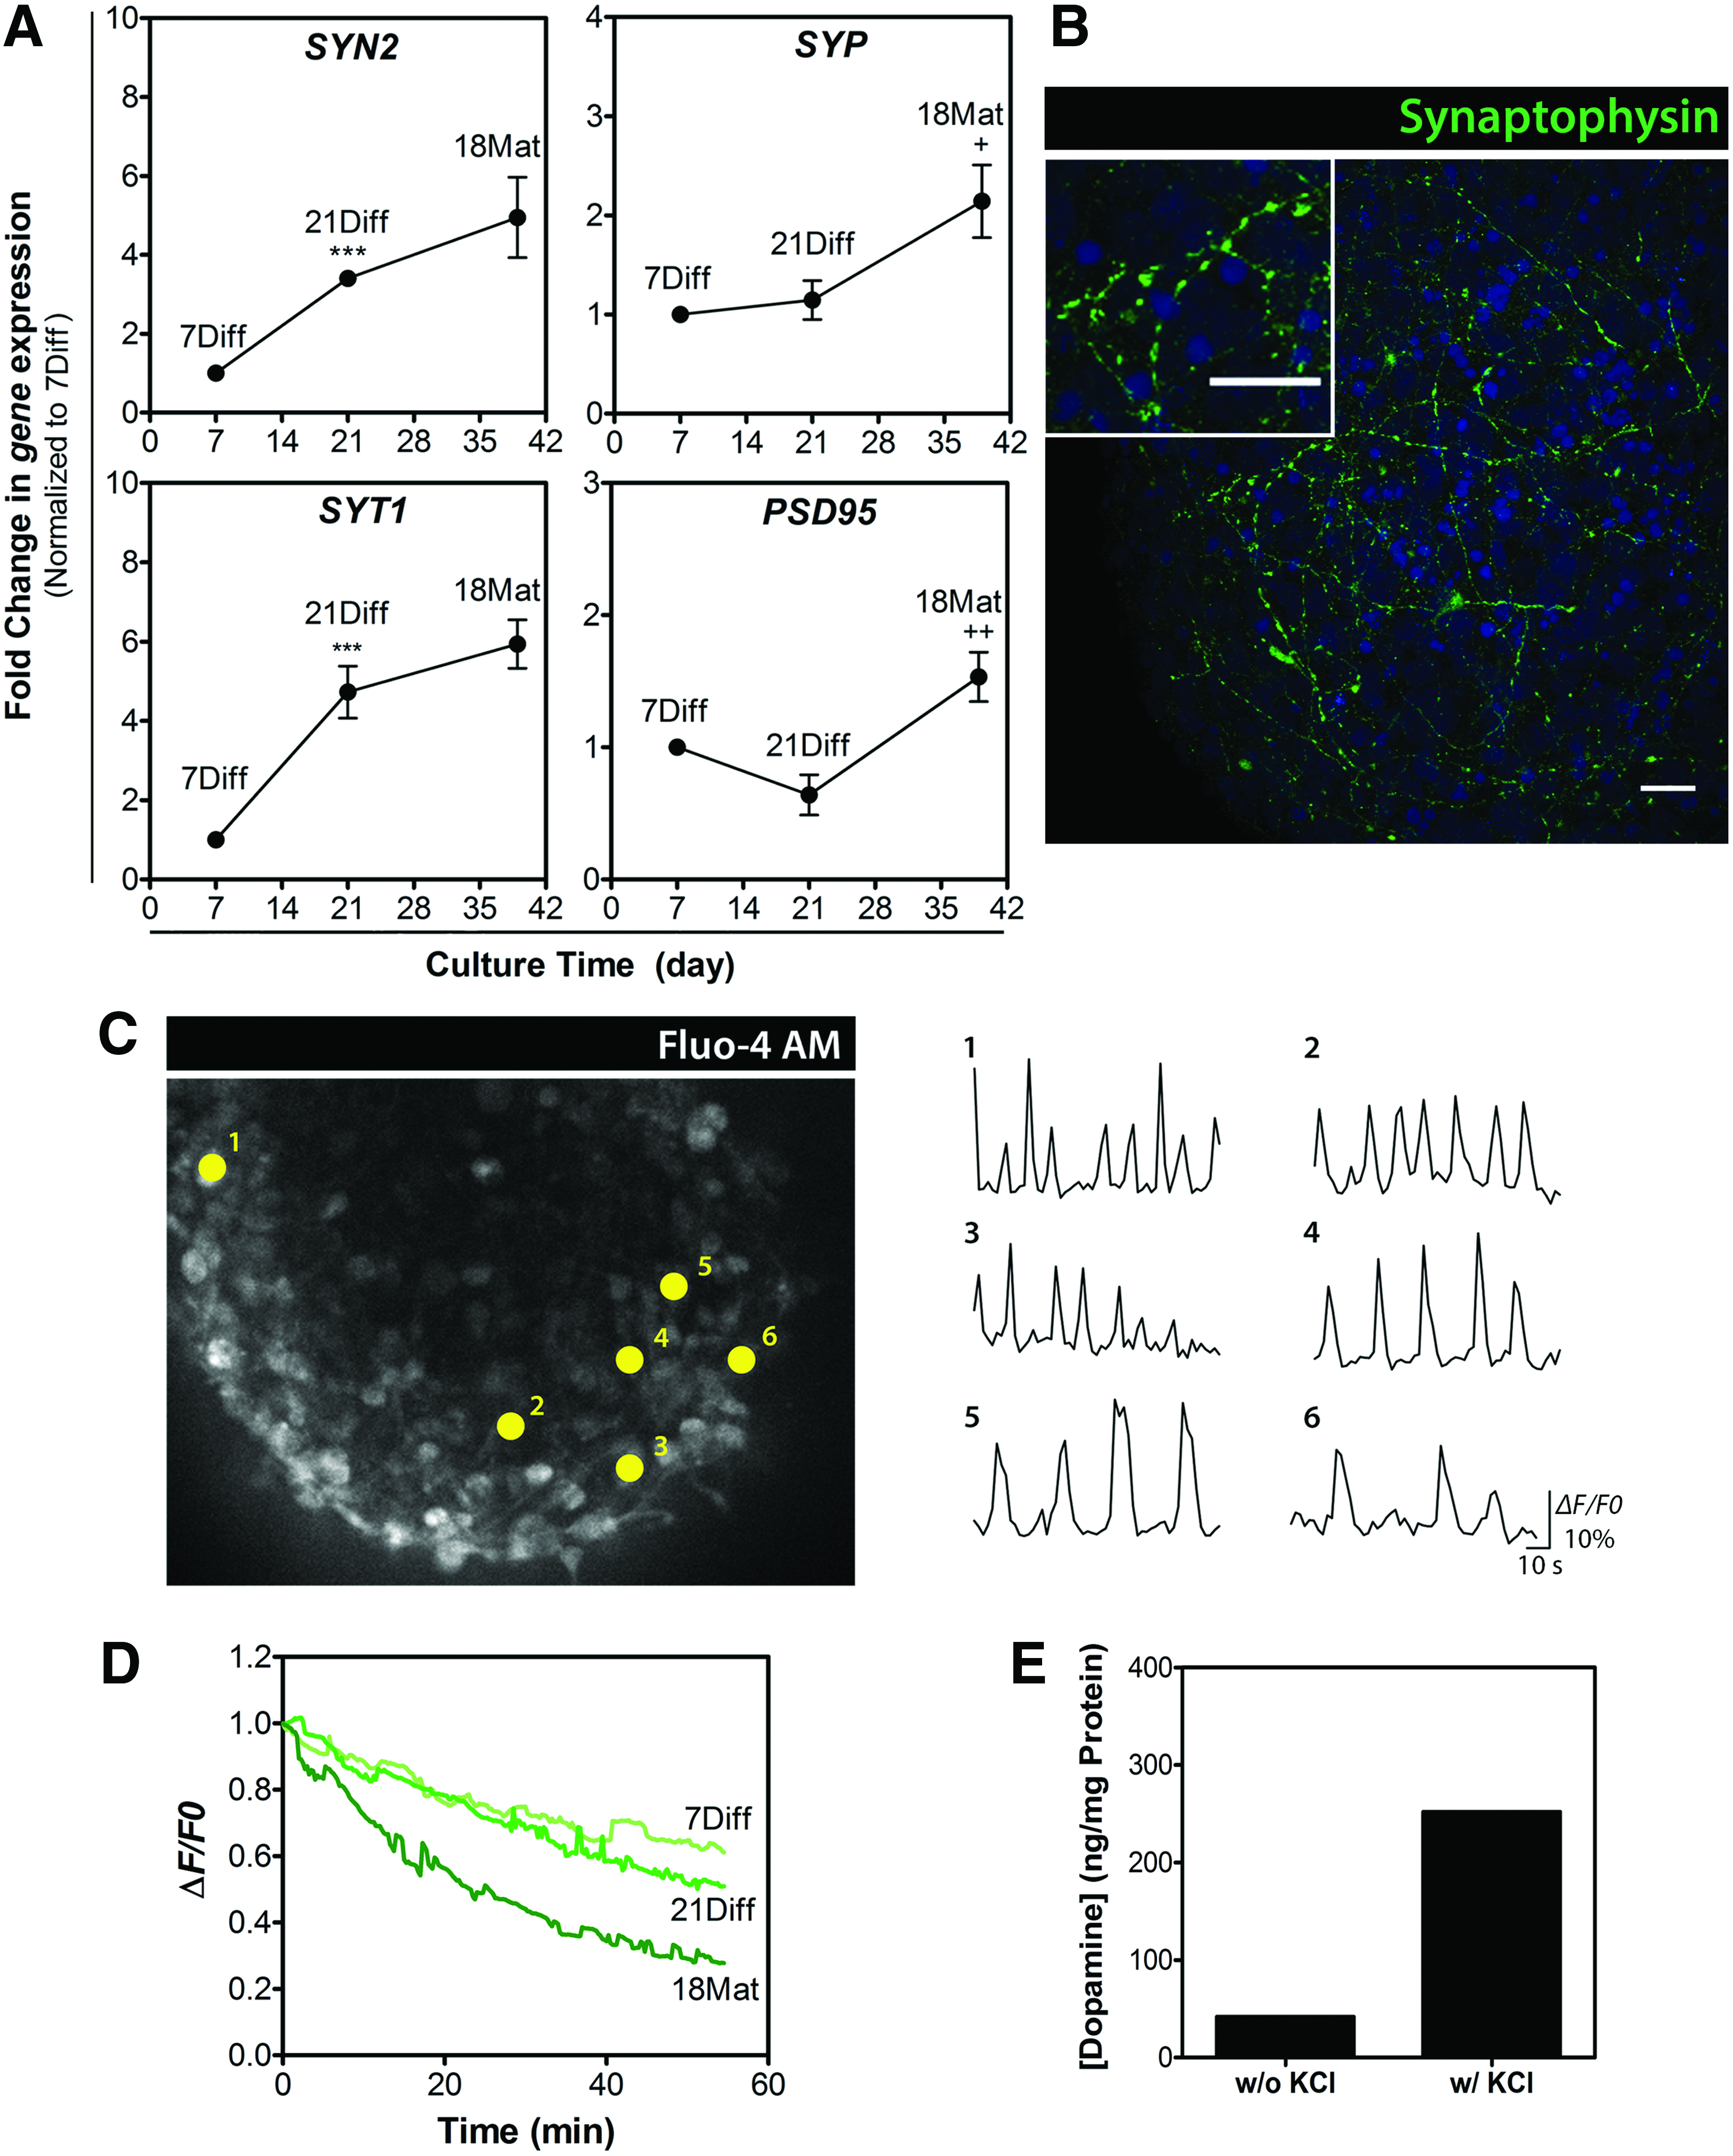
In addition to the increased expression of key lineage-specific markers, it was essential to demonstrate the functional properties of the differentiated cells derived from hmNPC neurospheres. To assess neuronal synaptic maturation, we analyzed the expression of proteins involved in synaptic formation and homeostasis. Expression of different presynaptic markers, such as synapsin II (SYN2), synaptophysin (SYP), and synaptotagmin I (SYT1), gradually increased during differentiation, reaching up to 5-, 2-, and 6-fold greater levels by the end of the differentiation process (Fig. 7A). Additionally, synaptophysin, an integral presynaptic vesicle glycoprotein, was detected in a typical punctate pattern across the differentiated neurospheres (Fig. 7B). These results together with the ultrastructural evidence (Fig. 2) suggest that presynaptic components cluster in differentiated hmNPC neurospheres into synaptic vesicle-like organelles. The 1.5-fold increase in postsynaptic density protein 95 (PSD95) at 18Mat suggested the accumulation of postsynaptic markers in these cultures (Fig. 7A).
Synaptic marker enrichment and synaptic vesicle trafficking in hmNPC neurospheres along differentiation.
Synaptic activity was assessed using the fluorescent probe FM1-43,32,33 by the ability of differentiated neurospheres to respond to depolarizing stimuli. Neurospheres at different stages of differentiation were loaded with FM1-43, and their destaining kinetics upon depolarization indicated that the same depolarizing stimuli led to a modest decrease in the fluorescence intensity of 7Diff and 21Diff neurospheres, when compared with neurospheres at the end of the differentiation process (18Mat), in which fluorescence dropped to less than half of its initial value (Fig. 7D). These results suggested that differentiated neurospheres showed a higher number of mature neurons with functional synaptic terminals, which were able to respond to depolarizing stimuli.
To further assess neuronal functionality, Fluo-4-based Ca2+ imaging studies were performed in 18Mat neurospheres (Fig. 7C; Supplementary Video S4). A variety of spontaneous firing patterns identified in individual cells may suggest the presence of both neurons and astrocytes, since the latter can also present spontaneous Ca2+ transients, although with significant lower frequencies compared with neurons.34,35
Moreover, an important physiological property of dopaminergic neurons is their ability to produce and release dopamine in response to a depolarizing stimulus. Differentiated neurospheres (18Mat) in presence of 100 mM KCl were able to respond, releasing 252 ng of dopamine per mg of total protein (Fig. 7E), further indicating a mature phenotype of the dopaminergic neurons in culture. In agreement with observation of upregulation of GABAergic marker vGAT, differentiated hmNPC neurospheres were also able to synthesize and release GABA (Supplementary Fig. S3B), in a KCl-dependent response, further suggesting the presence of mature GABAergic neurons.
Voltage-activated and glutamate-evoked currents
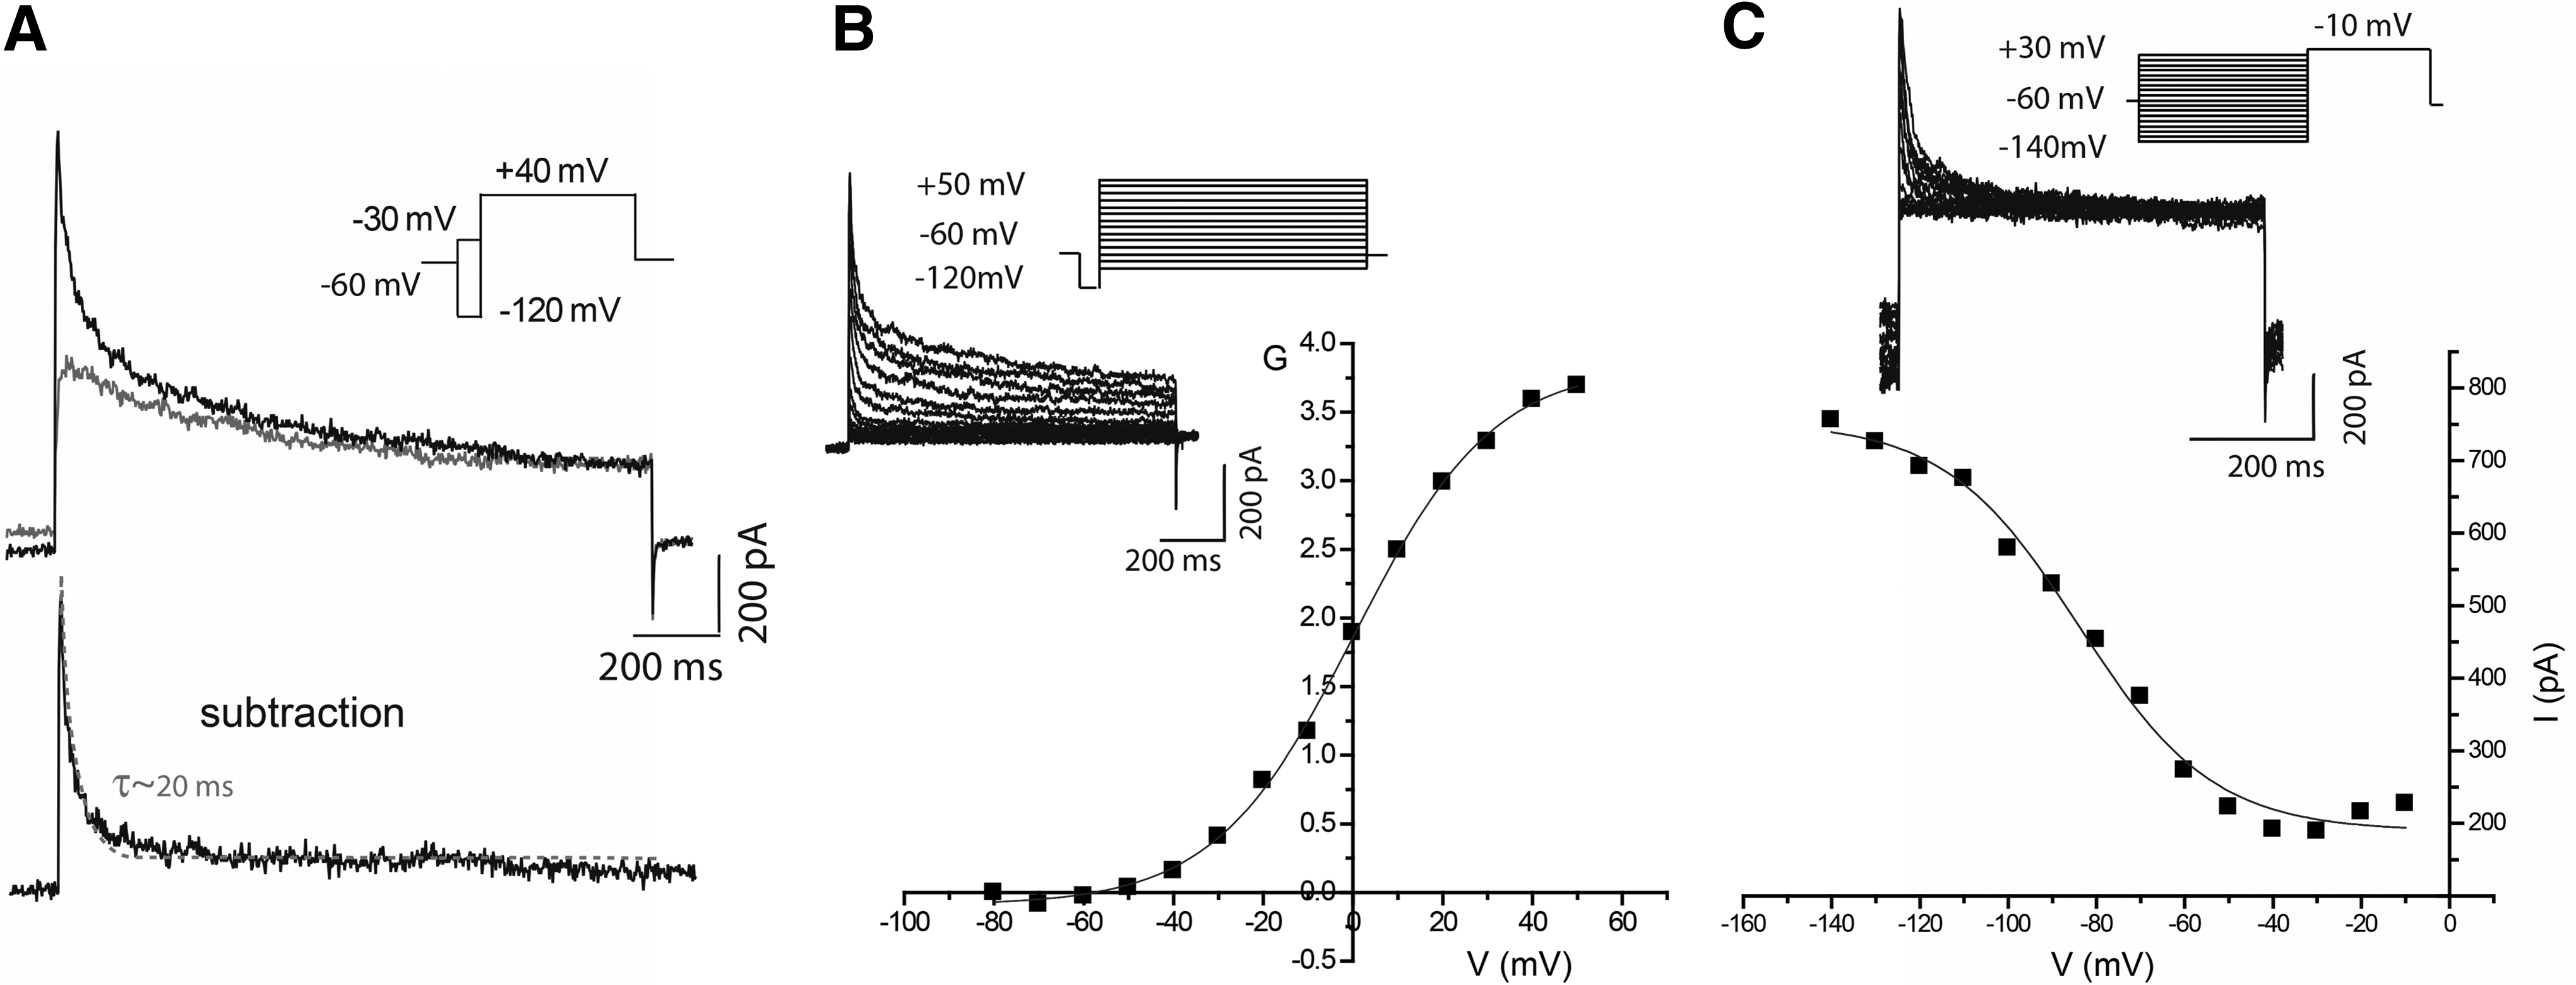
Functionality of neurons within differentiated neurospheres was further assessed by whole-cell voltage-clamp recordings. Cells exhibited hyperpolarized membrane potential values (Vm=−70.1±0.3 mV, n=9), indicating a high level of polarity. Voltage-activated potassium currents recorded at physiological K+ concentrations generated typical neuronal outward currents (Fig. 8A). The outward current following the prepulse to −120 mV comprised two major components, Ifast and Islow, which were fit with a sum of two exponentials to determine time constants of 25.9±0.9 ms (n=9) (τfast) and 234.4±5.4 ms (n=9) (τslow). In contrast, the outward current following a prepulse to −30 mV comprised only one slow component, as current decay was best fit by a single exponential with a time constant of 235.7±6.3 ms (n=7).
Voltage-activated potassium (Kv) currents in hmNPC-differentiated neurospheres.
The subtraction of the two current traces enabled to isolate A-type-like currents (Ifast), which were quickly activated (≤3 ms), indicating a strong dependency on voltage for inactivation. The current decay was best fit with a single exponential with time constant of 23.4±1.1 ms (n=7), values of the same range as those reported as typical for A-type current. 36 K+ currents were also characterized in terms of voltage dependence of activation (Fig. 8B), where current records were converted to conductance, and steady-state inactivation (Fig. 8C). Data were fit with the Boltzmann equation (Eq. 1) obtaining for activation a V1/2 value of −0.3±0.4 mV (n=4) and 5.3±0.5 mV (n=4), for Ifast and Islow, respectively. As for inactivation a V1/2 value of −81.3±1.6 mV (n=3) was obtained.
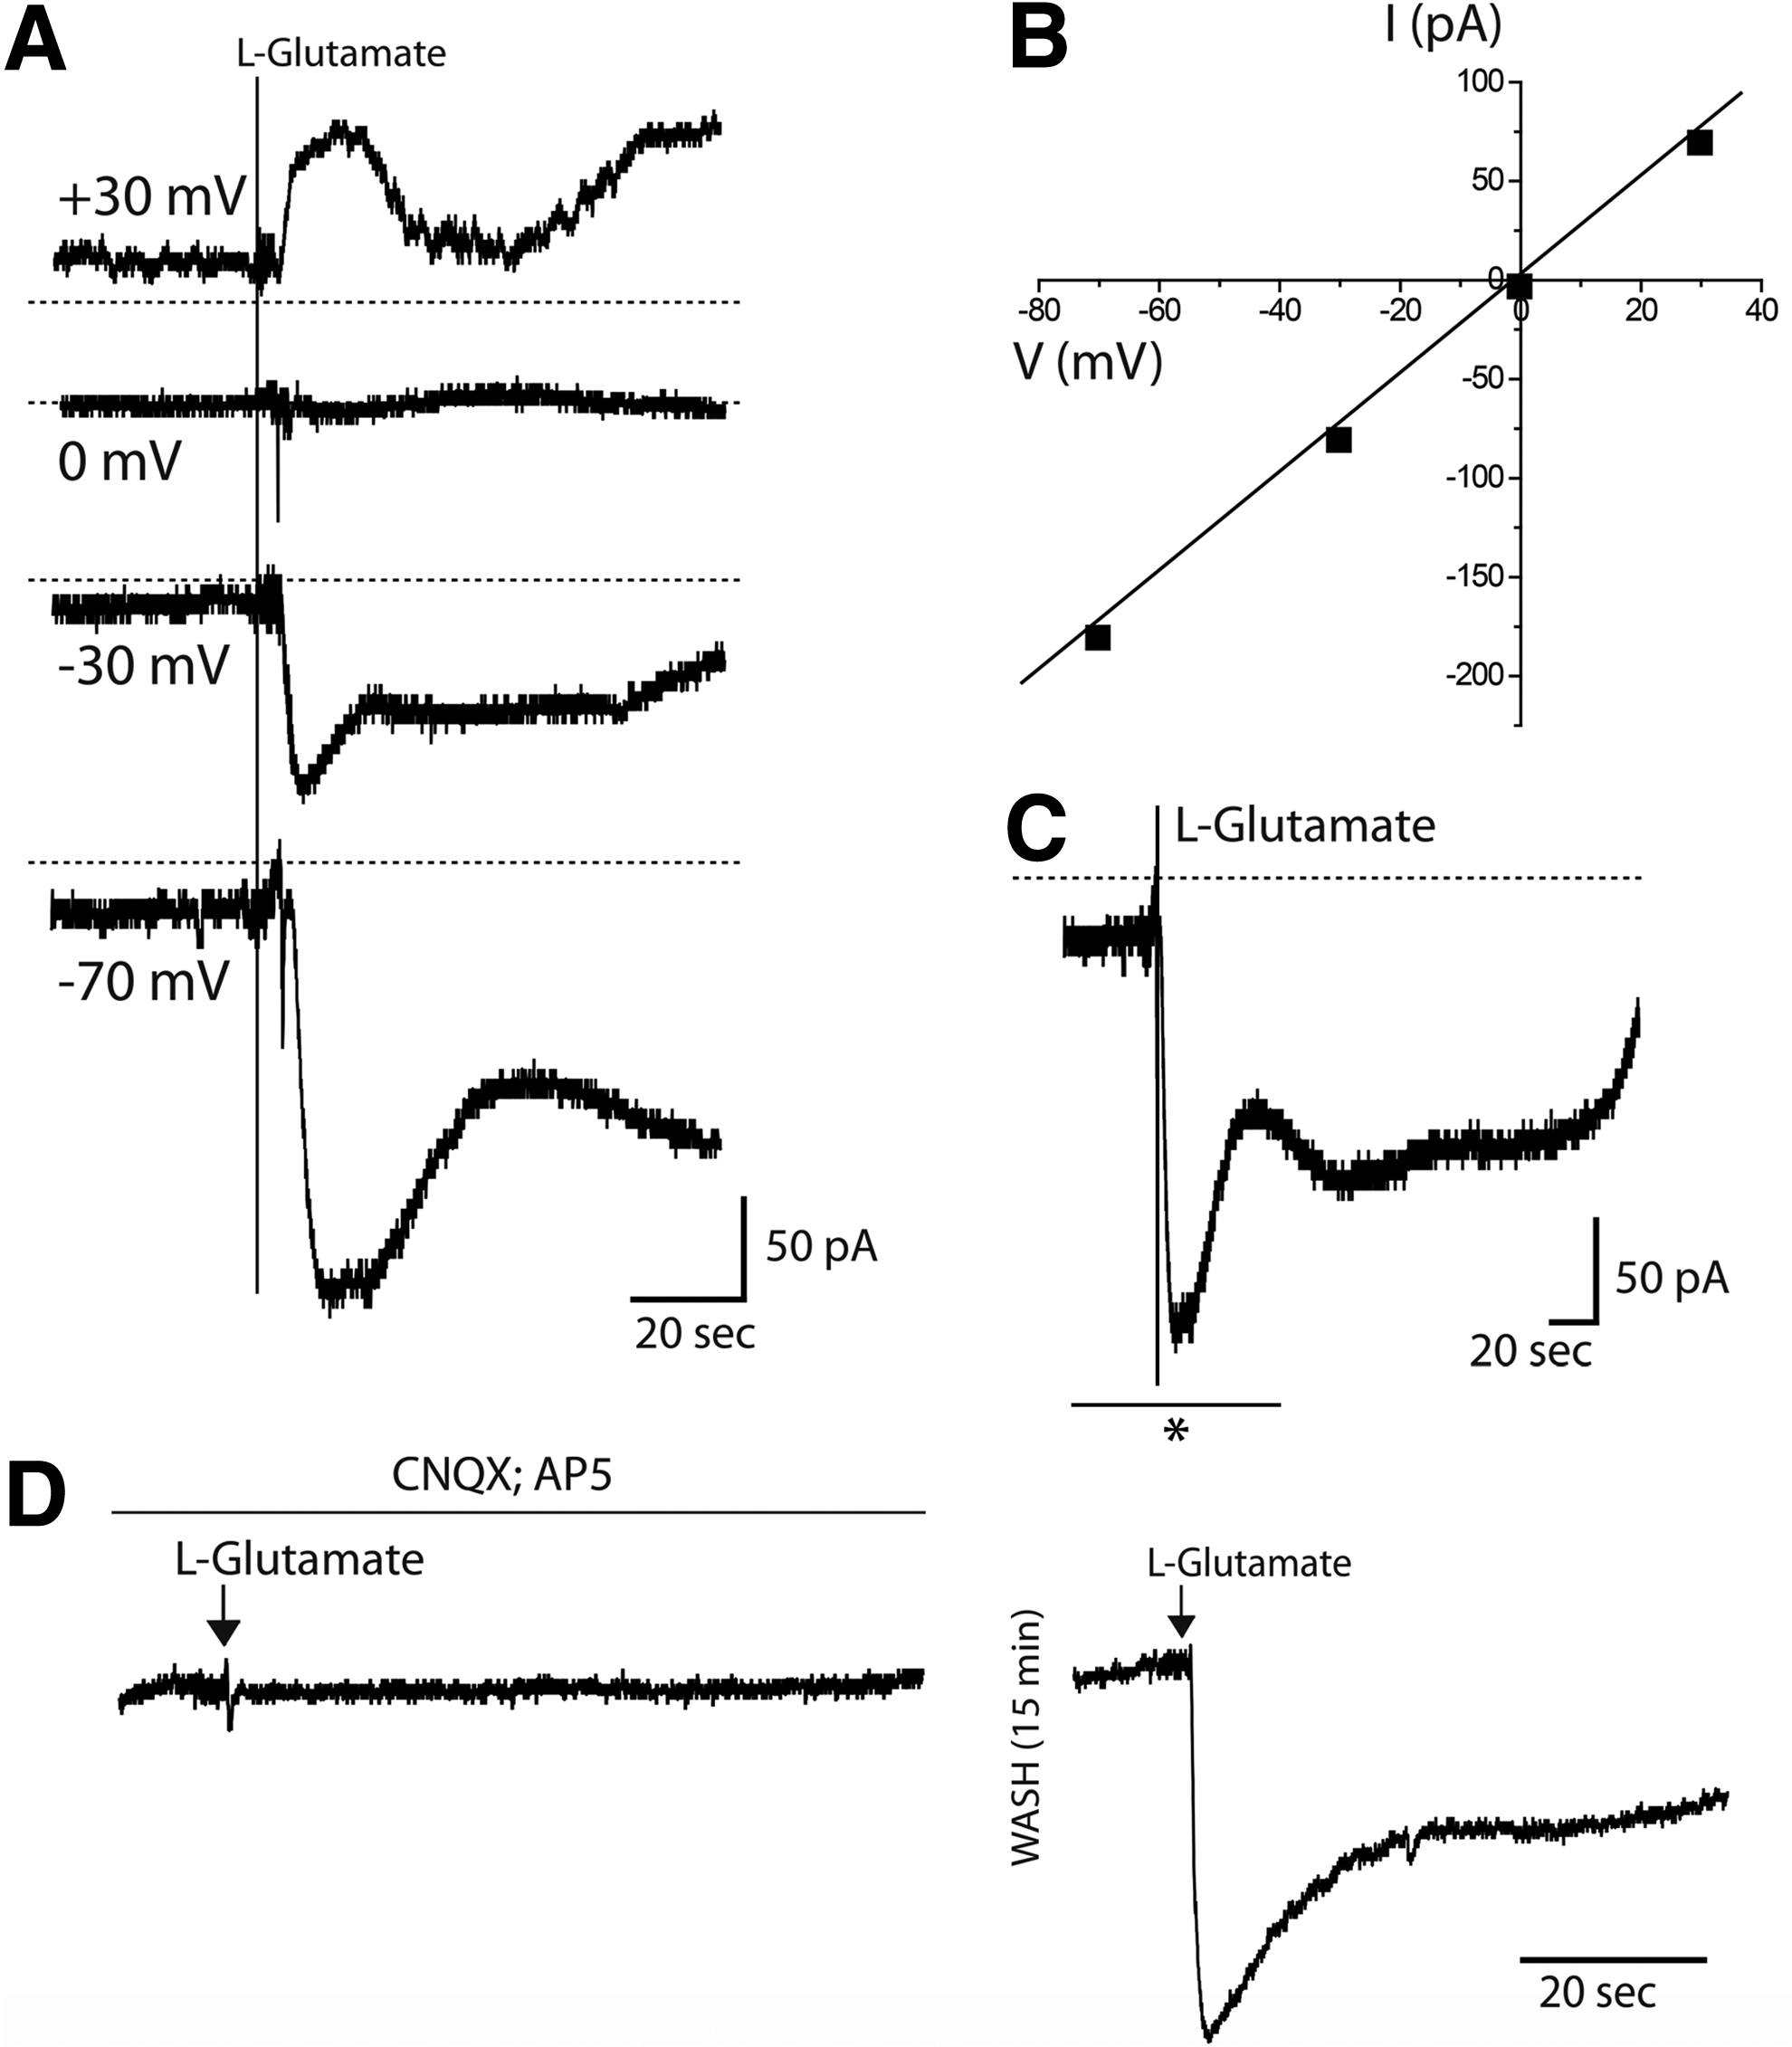
As midbrain mainly receives glutamatergic projections from other surrounding brain regions, 37 glutamate-evoked ionic currents were evaluated to assess the functionality of glutamate receptors. Glutamate was added to clamped cells under different holding potentials, with increased responses observed at a more hyperpolarized potential (−70 mV) and reversed currents obtained under positive potentials (Fig. 9A). A linear current–voltage relationship was obtained with a reversing potential close to 0 mV (Fig. 9B). The observed glutamate-evoked currents were characterized by a dual-phase response, which was more noticeable over a longer period of time (Fig. 9C), with a faster response followed by a slower and more sustained current. In the presence of antagonists of AMPA/kainate and NMDA glutamate receptors (10 μM CNQX and 10 μM AP5, respectively), no or small responses to glutamate were registered (Fig. 9D). After 15 min washing, the same clamped cell (n=3) exhibited a robust response to glutamate, confirming the presence and specific activation of glutamate receptors during glutamate application.
Whole-cell voltage-clamp recordings of glutamate-gated currents in hmNPC-differentiated neurospheres.
Discussion
In this study, we demonstrated that hmNPCs can be efficiently differentiated within neurospheres into functional dopaminergic and GABAergic neurons and cells from the astrocytic and oligodendrocytic lineages, and be maintained in long-term in vitro cultures. By providing homogeneous aggregation and efficient differentiation of hmNPCs, with establishment of 3D cell–cell interactions, we attained an efficient scalable culture system that is directly transferable to feeding of HTS platforms. These features are critical for basic research on the pathways responsible for the onset and progression of human neurological disorders, as well as for drug discovery.
The cell model presented herein can represent an alternative to organotypic cultures in which cytoarchitecture and cellular functionality of the original tissue6,38 are preserved but fail in maintaining long-term cellular viability and phenotype and present limited availability.
hmNPCs have been initially established and extensively described in 2D culture systems, demonstrating an efficient differentiation into the dopaminergic lineage.11,39,40 Nevertheless, these 2D culture systems recapitulate to a lower extent the three-dimensional cell–cell interactions of the brain. We have previously demonstrated that hmNPCs can also be efficiently differentiated as neurospheres, expressing several neuronal and dopaminergic-specific markers after 14 days of differentiation. 10
In this work, we further explored the neuronal differentiation process, successfully aiding the progression into later developmental stages, attaining maturation and synaptic functionality, by mimicking the developmental stages that multipotent mesencephalic progenitors undergo to acquire a mature dopaminergic neuronal phenotype. Differentiation of hmNPC neurospheres activated the expression of NURR1, with significant upregulation of the mature dopaminergic markers, Pitx3, TH, and DRD2, suggesting the preservation of midbrain region identity and developmental programs. These depend on the integration of various external cues culminating in the activation of signaling pathways, such as the Wnt/β-catenin canonical pathway that mediates the proliferation and differentiation of NURR1+ immature dopaminergic neurons.41,42 In later stages of differentiation, NURR1 is required for dopaminergic neuron specification and maturation, regulating the expression of mature markers, such as Pitx3 and TH.43–45
Moreover, the expression of vGAT and the ability of differentiated neurospheres to synthesize and release GABA upon stimuli suggested the presence of a GABAergic population, as previously demonstrated in 2D cultures of differentiated hmNPCs. 46 These evidences further suggest that the developed 3D model can mimic the main midbrain developmental pathways, generating heterogeneous neurospheres with the two neuronal subpopulations found in the human midbrain, dopaminergic and GABAergic. 37
Extension of the differentiation process was performed in presence of cAMP, which has been described to promote the differentiation, maturation, and survival of midbrain dopaminergic neurons.47,48 Moreover, cAMP has been reported to enhance neuronal differentiation in NPCs derived from other brain regions, such as forebrain in murine NPCs, 49 and also in other pluri/multipotent cells, such as mesenchymal stem cells, inducing the expression of NURR1 and TH. 50
The transition from multipotent neural progenitors toward a mixed culture of differentiated neural cells induced modulation of cellular metabolism. The maintenance of a highly glycolytic phenotype despite lower glucose consumption, together with increased pyruvate consumption, suggested the recapitulation of metabolic features of mature neural cells. Both neurons and astrocytes can utilize extracellular pyruvate 51 and production of lactate from pyruvate has been reported for neurons cultured in glucose-containing medium as a faster way to recycle NAD+ produced in glycolysis. 52 Neural reliance on glycolytic metabolism has been linked to the high energy requirements of the brain, where glycolysis may act as a fast-response pathway to accommodate high ATP demands, namely, to enable the constant activity of Na+/K+ ATPases, essential for maintenance of neuronal membrane ionic gradients53,54 and/or provide local ATP supply to molecular motors. 55
Differentiated neurospheres presented significantly increased accumulation of pyroglutamate, which can derive from degradation of proteins containing modified N-terminal glutamic acid residues or from glutamate/glutamine cyclization 56 and has been suggested to act as a reservoir of neural glutamate, the main excitatory neurotransmitter in the CNS. 57
The accumulation of BCAA catabolism intermediates (2-oxoisocaproate and methylsuccinate) points to recapitulation of important astrocyte-neuron nitrogen shuttling systems of human CNS, 58 complementing the extensively described glutamine–glutamate cycle between neurons and astrocytes. 54 Our results suggest that establishment of some of these nitrogen shuttles may occur in an early stage of CNS development and maturation.
The developed cell model, in combination with NMR and/or mass spectrometry analyses of isotopic (13C and 15N) tracer studies, can be applied in depicting these neural metabolic shuttles and contribute to increase the mechanistic understanding on the correlation between cell metabolism and stemness/cell identity determination driven by genetic and epigenetic switches. 59
Upon differentiation, neurospheres exhibited extensive ECM composition remodeling and morphological rearrangements. Gene expression results evidenced a closer resemblance to the in vivo neural ECM, which is mainly comprised of glycosaminoglycans, namely, hyaluronan, heparan sulfate proteoglycans, and chondroitin sulfate proteoglycans and displays low levels of fibrilliar proteins, such as collagens, fibronectin, and laminin,31,60 regularly used as matrix in 2D cultures. This was accompanied by changes in plasma membrane architecture, with a transition from highly prevalent lamellipodia found in undifferentiated neurospheres toward a dense filopodia network in differentiated neurospheres. Filopodia have been shown to be paramount in dendritic branching, axonal development, and synapse formation. 61 Formation of newborn synapses is concomitant with an increase in expression of synaptic markers. 62 Expression levels of synaptic proteins, such as SYN2, SYP, SYT1, and PSD95, steadily increased during hmNPC neurosphere differentiation. Moreover, synaptophysin-positive organelles could be detected in puncta along neuronal processes, suggesting that these neurons are fully competent for the biogenesis and clustering of synaptic vesicles.
Neurons in differentiated neurospheres were able to elicit spontaneously Ca2+ oscillations at frequencies reminiscent of action potential firing, as well as to respond to depolarization stimuli leading to FM-1–43 and neurotransmitter release (dopamine and GABA). These results indicate that midbrain neurons generated in hmNPC neurospheres contain functional synapses, where the rapid influx of Ca2+ through voltage-dependent Ca2+ channels arriving in the nerve terminals triggers fusion of neurotransmitter-containing vesicles with the plasma membrane, leading to neurotransmitter release into the synaptic shaft. 63 Further, the electrophysiology recordings, which to our knowledge are the first recordings from single cells within the 3D structure of neurospheres, demonstrated that the generated neurons were fully polarized (Vm of approximately −70 mV) at potentials modulated by functional voltage-activated ion channels. The registered voltage-activated K+ currents pointed out for the existence of at least two populations of voltage-gate K+ channels (KV), one underlying Ifast and other underlying Islow. The conspicuous Ifast component showed typical patterns of an A-type current, which are perceived to have high relevance in numerous physiological and pathological contexts. From the KV channels/subunits that are known to be responsible to trigger A-type currents, two emerge as probable candidates to underlie the Ifast component. Considering that this current showed (1) a voltage profile for activation with a V1/2 of around −10 mV (considering a −9 mV junctional potential), which points out for high threshold activating channels; (2) a hyperpolarized voltage dependence of inactivation; and, most noticeably, (3) a time constant for the inactivation time course in the order of 20 ms, the channels KV1.4 and KV4.2 are envisaged to be the most likely candidates to be present in neurons of hmNPC-differentiated neurospheres. Indeed, extensive characterization on a predominant A-type current in hmNPCs differentiated in 2D cultures was reported, 64 which according to the authors is evoked by KV4.2 channels. Nevertheless, one cannot exclude the possibility of KV1.4 channels to be also present in the differentiated neurospheres.
Moreover, the excitability of differentiated hmNPC neurospheres was challenged by the addition of glutamate, with the generated neurons demonstrating to be able to elicit glutamate-gated currents with two clear components, one faster followed by a slower and more sustained current. The linear voltage–current relationship reversing close to 0 mV corroborates the involvement of channels with unspecific cationic conductance. Further, these currents were blocked by coincubation of AMPA/kainate and NMDA antagonists (CNQX and AP5, respectively). Altogether, these results showed that hmNPC neurospheres contain mature neurons with functional glutamate receptors, which are most likely AMPA/kainate and NMDA receptor types, as well as the associated channels. These observations are in agreement to what was described previously for hmNPC differentiated in 2D cultures. 65 The presence of functional postsynaptic glutamatergic molecular machinery further suggests that the developed 3D model recapitulates in vivo features, since the midbrain is known to receive and integrate multiple glutamatergic inputs from other brain regions. 37
In this work, we established a novel culture system that yields a reproducible human 3D CNS cell model enriched in dopaminergic neurons. By combining scalable protocols with an extensive toolbox of characterization methods, we have generated a comprehensive set of developmental data on the in vitro differentiation of human midbrain neurons. This approach can be extended to other sources of human neural stem cells, such as patient-derived iPSCs, based on recent reports on the generation of regionally specified neural progenitors from human pluripotent stem cells under defined conditions. 66 The exploitation of these novel cellular models is likely to boost our mechanistic understanding of the pathogenesis of human disorders as well as accelerate the discovery of new therapeutics.
Footnotes
Acknowledgments
The authors gratefully acknowledge Dr. Johannes Schwarz for the supply of hmNPCs within the scope of the EU project BrainCAV (FP7-222992), Pedro Almada and Dr. Emilio Gualda for support on confocal microscopy, Dr. Ana Amaral for support on hmNPC 3D cultures and, Dr. Rodolfo Negri and Dr. Enrico Tagliafico for chip bioinformatics. IBET Analytical Services Unit, Portugal, is acknowledged for HPLC analysis and Institute of Ophthalmology, UCL, United Kingdom, is acknowledged for collection of SBFSEM data. The NMR spectrometers are part of The National NMR Facility, supported by Fundação para a Ciência e a Tecnologia (RECI/BBB-BQB/0230/2012). This work was supported by BrainCAV (FP7-222992) and Brainvectors (FP7-286071); funded by the EU (PTDC/EBB-BIO/112786/2009 and PTDC/EBB-BIO/119243/2010); funded by Fundação para a Ciência e Tecnologia, Portugal; and Cancer Research, United Kingdom. D.S. was recipient of a PhD fellowship from FCT, Portugal (SFRH/BD/78308/2011, FCT).
Disclosure Statement
No competing financial interests exist.
References
Supplementary Material
Please find the following supplemental material available below.
For Open Access articles published under a Creative Commons License, all supplemental material carries the same license as the article it is associated with.
For non-Open Access articles published, all supplemental material carries a non-exclusive license, and permission requests for re-use of supplemental material or any part of supplemental material shall be sent directly to the copyright owner as specified in the copyright notice associated with the article.