




Abstract
Current approaches to cartilage tissue engineering require a large number of chondrocytes. Although chondrocyte numbers can be expanded in monolayer culture, the cells dedifferentiate and unless they can be redifferentiated are not optimal to use for cartilage repair. We took advantage of the differential effect of culture conditions on the ability of passaged and primary chondrocytes to form cartilage tissue to dissect out the extracellular matrix (ECM) molecules produced and accumulated in the early stages of passaged cell cartilage tissue formation as we hypothesized that passaged bovine cells that form cartilage accumulate a pericellular matrix that differs from cells that do not form cartilage. Twice passaged bovine chondrocytes (P2) (cartilage forming), or as a control primary chondrocytes (P0) (which do not generate cartilage), were cultured on three-dimensional membrane inserts in serum-free media. P2 redifferentiation was occurring during the first 8 days as indicated by increased expression of the chondrogenic genes Sox9, collagen type II, aggrecan, and COMP, suggesting that this is an appropriate time period to examine the ECM. Mass spectrometry showed that the P2 secretome (molecules released into the media) at 1 week had higher levels of collagen types I, III, and XII, and versican while type II collagen and COMP were found at higher levels in the P0 secretome. There was increased collagen synthesis and retention by P2 cells compared to P0 cells as early as 3 days of culture. Confocal microscopy showed that types XII, III, and II collagen, aggrecan, versican, and decorin were present in the ECM of P2 cells. In contrast, collagen types I, II, and III, aggrecan, and decorin were present in the ECM of P0 cells. As primary chondrocytes grown in serum-containing media, a condition that allows for the generation of cartilage tissue in vitro, also accumulate versican and collagen XII, this study suggests that these molecules may be necessary to provide a microenvironment that supports hyaline cartilage formation. Further study is required to determine if these molecules are also accumulated by passaged human chondrocytes and their role in promoting hyaline cartilage formation.
Introduction
A
Once damaged, articular cartilage is unable to repair, which has stimulated an increasing interest in developing cell and tissue-based repair/regeneration therapies.8–15 However, a large number of chondrocytes are required for these approaches and only a small number of cells can be harvested from an individual. Increasing the cell number by passaging chondrocytes in monolayer culture leads to loss of the chondrocyte phenotype and an inability to form cartilage tissue. 16 A number of approaches have been developed to redifferentiate passaged chondrocytes, including three-dimensional (3D) culture in pellets, gels, filters, or scaffolds in the presence or absence of growth factors,17,18 monolayer expansion with growth factors, 19 or directly adding factors into the culture medium to enhance redifferentiation.20,21 However, studies have shown that the phenotype was not fully restored (or maintained).17,22 Identifying conditions that favor formation of articular cartilage of appropriate composition and organization would be a significant advance in cartilage tissue engineering.
We recently described a method by which passaged chondrocytes can be induced to redifferentiate and accumulate ECM rich in proteoglycans and type II collagen in vitro when cultured on type II collagen-coated membrane inserts (3D) in defined serum-free growth factor-free chondrogenic medium (SF). 23 In contrast, culture of primary chondrocytes under these SF conditions did not support formation of hyaline-like cartilage, as these cells required the presence of serum to accumulate ECM. 23 As the presence or absence of serum in the media of 3D cultures can affect whether P0 and P2 cells accumulate hyaline matrix molecules, we took advantage of the differential effect of these culture conditions to dissect out the pericellular matrix molecules produced and accumulated in the early stages of passaged cell redifferentiation and tissue formation. We hypothesized that passaged bovine cells that form cartilage accumulate a pericellular matrix that differs from cells that do not form cartilage. Identification of these macromolecules will not only facilitate study of which matrix molecules are important for cartilage formation but also may then serve as markers that can be used to identify culture conditions and/or scaffolds that will favor articular cartilage formation by passaged chondrocytes and facilitate rapid screening of culture conditions for chondrogenic-inducing potential.
Materials and Methods
Cell culture
Articular cartilage was harvested from bovine metacarpophalangeal joints (6–9 months old) as described previously. 24 Chondrocytes were isolated from cartilage of an individual animal by enzymatic digestion with 0.1% collagenase A (Roche Diagnostics GmbH, Mannheim, Germany) for 18 h at 37°C. Cells were either cryopreserved in liquid nitrogen for later use or resuspended in HAMS F12 containing 5% fetal bovine serum (FBS; HyClone, Logan, UT), seeded in monolayer at a density of 2000 cells/cm2, and grown under standard culture conditions. When cells reached ∼80% confluence, they were passaged and replated at the same seeding density. Bovine P2 (2.0×10⁶ cells/membrane) and P0 cells (2.0×10⁶ cells/membrane) were separately suspended in serum-free media (SF) consisting of high glucose Dulbecco's modified Eagle's medium, ITS+ (10 μg/mL insulin, 0.5 μg/mL transferrin, 0.67 ng/mL selenium, 5.35 μg/mL linoleic acid, and 1.25 mg/mL bovine serum albumin; BD Bioscience, Billerica, MA), proline (40 μg/mL), pyruvate (110 μg/mL), dexamethasone (0.1 μM), and ascorbate-2-phosphate (50 μg/mL). Cells were seeded onto type II collagen-coated membrane plate inserts (60 mm2, Millicell®; Millipore Co., Bedford, MA) prepared as described previously. 25 Selected cultures were grown under the same culture conditions except that the media were supplemented with 20% FBS (serum). The cells were grown for up to 3 weeks, media were changed every 2 days, and collected at day 1, 3, 5, and 7 of culture. The media was centrifuged to remove any cells in suspension and stored at −80°C until further analysis (Supplementary Fig. S1; Supplementary Data are available online at www.liebertpub.com/tea).
Protein extraction and sample preparation for mass spectrometry
Chondrocytes (P2 and P0) were grown in media supplemented with insulin rather than ITS+ to eliminate the bovine serum albumin present in ITS+, which could affect analysis. Media were changed every 2 days, collected separately, and protein content quantified by the Bradford protein assay reagent (Pierce Biotechnology, Rockford, IL). Media collected within the first week were combined for mass spectrometry analysis.
To remove excess salts, samples were dialyzed in a molecular porous membrane tubing (Spectra/Por Dialysis Membrane; Spectrum Laboratories, Inc., Rancho Dominguez, CA) against an ammonium bicarbonate buffer (50 mM) overnight, frozen at −80°C, lyophilized, then denatured with 8 M urea (in H2O), and reduced with dithiothreitol (final concentration, 13 mM; Sigma-Aldrich Ltd., St. Louis, MO). Samples were then alkylated with iodoacetamide (final concentration, 125 mM; Sigma-Aldrich Ltd.) and desalted using a NAP5 column (GE Healthcare, Buckinghamshire, United Kingdom) as per the manufacturer's instructions. Samples were lyophilized and digested in trypsin (trypsin/protein ratio 1:50; 120 μL 50 mM ammonium bicarbonate, 100 μL methanol, 150 μL water) overnight at 37°C. Samples were loaded onto a PolySULFOETHYL ATM column (The Nest Group, Southborough, MA), containing a hydrophilic anionic polymer (poly-2-sulfoethyl aspartamide, 200 Å pore size, 5 μm diameter). Fractionation was performed using an Agilent 1100 HPLC system (200 μL/min flow rate). A linear gradient of mobile phase B (0.26 M formic acid in 10% acetonitrile and 1 M ammonium formate) was applied and eluate was monitored at 280 nm.
Mass spectrometry
Peptides in fractions were microextracted using the ZipTip C18 pipette tip (Millipore) and eluted in 5 μL of buffer (64.5% acetonitrile, 35.4% water, 0.1% formic acid, and 0.02% trifluoroacetic acid). Eighty microliters of buffer (95% water, 0.1% formic acid, 5% acetonitrile, and 0.02% trifluoroacetic acid) was added to each sample and 40 μL was loaded using a 96-well microplate autosampler onto a 2-cm C18 trap column, packed with Varian Pursuit (5 μm C18), using the EASY-nLC system (Proxeon Biosystems, West Palm Beach, FL) and running buffer A (0.1% formic acid in water). Peptides were eluted from the trap column onto a resolving 5-cm analytical C18 column packed with Varian Pursuit (3 μm C18) with an 8-μm tip (New Objective, Woburn, MA) and an increasing concentration of buffer B (0.1% formic acid in acetonitrile). This LC setup was coupled online to an LTQ-Orbitrap XL (Thermo Fisher Scientific, Waltham, MA) mass spectrometer with a nanoelectrospray ionization source (Proxeon Biosystems). Fractions underwent a 54-min gradient (buffer A to buffer B), and eluted peptides were subjected to one full MS scan (450–1450 m/z) in the Orbitrap at 60,000 resolution, followed by top 6 data-dependent MS/MS scans in the linear ion trap (LTQ Orbitrap). Using a charge state screening and preview mode, unassigned charge states as well as charges 1+ and 4+ were ignored.
Protein data analysis
Data files were created by the use of Mascot Daemon (version 2.2.0) and extract_msn. The resulting mass spectra were analyzed using Mascot (version 2.2; Matrix Science, Boston, MA) and X!Tandem (Global Proteome Machine Manager, version 2006.06.01) search engines on the nonredundant International Protein Index human database (version 3.46, 144,158 protein sequences). Resulting Mascot and X!Tandem search result files were loaded into Scaffold (version 2.0, Proteome Software) to cross-validate Mascot and X!Tandem data files. The protein false-positive rate was set to 1% by adjusting Mascot and X!Tandem thresholds within Scaffold. False-positive rates were calculated as the number of proteins identified by searching the reverse sequences (x2) divided by the total number of identified proteins. Normalized spectral counting was performed using Scaffold. Spectrum reports were uploaded into an in-house program for additional data analysis comparing proteins found between secretomes. Identified proteins that did not show a significant difference (determined by Student's t-test) between groups or that had <10 spectral counts between groups were eliminated.
Evaluation of in vitro formed cartilage tissues
At 3 weeks, cultures were harvested for histological evaluation. Tissues were fixed in 10% buffered formalin and embedded in paraffin. Five-micrometer sections were cut and stained with toluidine blue or hematoxylin and eosin. For immunohistochemical staining, sections were deparaffinized and digested with 0.4% pepsin (w/v) (Sigma-Aldrich Ltd.), blocked with 20% goat serum (v/v) (Sigma-Aldrich Ltd.), and then incubated overnight at 4°C with an antibody reactive with either type I collagen (1:100, T59103R; Meridian Life Science, Inc., Saco, ME) or type II collagen (1:100, MAB8887; Millipore), followed by incubation with the Alexa-488 goat anti-rabbit (1:300; Invitrogen, Paisley, United Kingdom) or Alexa-594 goat anti-mouse secondary antibody. Nuclei were stained with DAPI (1:10,000; Invitrogen) and sections coverslipped (Permafluor). Images were collected at a single representative focal plane (resolution 1024×1024 pixels) using a 60× objective (Nikon Eclipse C1si; Nikon Corporation, Tokyo, Japan).
Matrix accumulation was quantified biochemically following harvest of the tissues at 3 weeks and digestion by papain (40 μg/mL in 20 mM ammonium acetate, 1 mM EDTA, and 2 mM DTT; Sigma-Aldrich Ltd.) for 48 h at 65°C, as described previously. 25 Sulfated glycosaminoglycans were quantified using the dimethylmethylene blue dye-binding assay (Polysciences, Inc., Washington, PA) and spectrophotometry (wavelength: 525 nm). 25 DNA content was quantified using the Hoechst dye 33258 assay (Polysciences, Inc.) and fluorometry (excitation wavelength: 365 nm and emission wavelength: 458 nm). 26
RNA extraction and quantitative PCR
Total RNA was isolated using Trizol® (Gibco BRL, Rockville, MD). Invitrogen Superscript II reverse transcription kit was used to reverse transcribe 0.5 μg of total RNA according to the manufacturer's instructions (Invitrogen, Carlsbad, CA). Each reaction contained 40 units/mL of recombinant ribonuclease inhibitor RNase OUT™ (Invitrogen), 50 μg/mL of random hexamers, 10 mM dNTPs, and 200 units of SuperScript II enzyme. Gene expression was determined using sequence-specific primers (Supplementary Table S1), SYBR green dye I, and Realplex2 Master Cycler (Eppendorf, Hamburg, Germany) (real time polymerase chain reaction, qPCR) according to the manufacturer's instructions, and data analyzed with Mastercycler EP Realplex. One microliter cDNA was amplified in 20 μL final volume with 0.2 μM each primer suspended in QuantiFast SYBR Green Master Mix (Qiagen, Hilden, Germany). Amplification parameters were identical for each primer pair; after the initial 10 min at 95°C to activate the enzyme, 15 s denaturation at 95°C was followed by 30 s annealing at 60°C, and amplification data were collected for up to 40 cycles. Mean relative quantification values were calculated with the ΔΔCt method, using 18S rRNA as endogenous control and primary bovine chondrocytes as a calibrator.
Quantification of proteoglycan and collagen synthesis
After 3 and 8 days, chondrocyte cultures were incubated in the presence of both [ 35 S]SO4 (1 μCi/culture; PerkinElmer, Mississauga, Canada) to label proteoglycans and [ 3 H]proline (1 μCi/culture; PerkinElmer) to label collagen for 48 h. In chondrocyte cultures, ∼90% of proline becomes incorporated into collagen. The medium was collected and divided in two parts, proteoglycans were precipitated by adding 100% cold ethanol (3:1 ratio) and collagen was precipitated by adding 70% ammonium sulfate solution (3:4 ratio) overnight at 4°C. Samples were each centrifuged at 14,000 rpm for 30 min at 4°C, washed in 70% ethanol, and resuspended in either 4 M guanidine hydrochloride to solubilize the proteoglycans or 10% sodium dodecyl sulfate in Tris buffer (0.1 M, pH 7.0) to solubilize collagen. To quantify newly synthesized collagen and proteoglycans accumulated in the tissue, cultures were washed thrice in phosphate-buffered saline (PBS) and digested by papain. Radioisotope incorporation in media and tissue was determined using a β-liquid scintillation counter (Beckman LS6000TA; Beckman Instruments, Mississauga, ON, Canada). The amount of synthesized molecules in each fraction (culture or media) as well as the total matrix synthesis were expressed relative to the DNA content.
Immunohistochemistry and confocal microscopy of early cultures
To assess ECM accumulation at early time points, the cells were processed differently than the tissues. Cells at 1 and 3 days of culture were fixed in 4% paraformaldehyde at room temperature for 15 min and then permeabilized with 0.2% Triton-X in PBS for 15 min. For staining of collagens, samples were sequentially digested with 2.5 mg/mL pepsin (P7012-1G, in PBS at pH 2; Sigma-Aldrich Ltd.) for 10 min at 37°C, 2.5 mg/mL of trypsin (T7409 Tris-buffered saline; Sigma-Aldrich Ltd.) for 30 min at 37°C, and 25 mg/mL hyaluronidase (H3506; Sigma-Aldrich Ltd.) for 30 min at 37°C. For staining of proteoglycans, cells were digested with 0.25 μM of chondroitinase ABC (in 0.1 M Tris pH 8, 0.05 M NaOAc) for 1 h at 37°C. Samples were blocked with 20% goat serum and 0.1% Triton-X in PBS for 1 h at 37°C and incubated with an antibody reactive to either collagen type I [1:300 in dilution buffer (DB: 10% goat serum and 0.1% Triton-X in PBS); Meridian Life Science, Inc.], collagen type II (clone 6B3, 1:300 in DB; Labvision, Freemont, CA), collagen type III (ab7778, 1:100 in DB; Abcam, Toronto, Canada), collagen type XII (NC3 domain, clone 1851, rabbit polyclonal, 1:50 in DB), aggrecan (clone 6B4, 1:100 in DB; Abcam), versican (clone 12C5, 1:50 in DB; Developmental Studies Hybridoma Bank, Iowa City, IA), or decorin (sc-22753, 1:150 in DB; Santa Cruz, Dallas, TX) overnight at 4°C. Samples were washed in 0.2% Triton-X, and then incubated with the goat anti-rabbit IgG secondary antibody (1:500 in DB) conjugated with Cy5 (Jackson Immunoresearch Laboratories, West Grove, PA) or goat anti-mouse source of the primary antibody, at 25°C for 1 h. After washing with 0.2% Triton-X in PBS, nuclei were counterstained with DAPI (1:10,000 in PBS; Invitrogen), washed in PBS, coverslipped (Permafluor Mountant solution, anti-fade; Thermo Scientific, Pittsburgh, PA), and stored in darkness at 4°C until examined by the Quorum WaveFX Spinning Disc Confocal System (Guelph, Canada) with optimized Yokogawa CSU X1, Hamamatsu EM-CCD digital camera Image EM (C9100-13), and Leica DMI6000B inverted research grade motorized microscope run by Velocity 5.2.2 Acquisition software (Improvision/PerkinElmer, Waltham, MA).
Statistical analysis
Three independent sets of experiments were performed for cell culture studies. All conditions were done in triplicate. Data are presented as mean±standard error of the mean. Results were analyzed using a one-way analysis of variance, and all pairwise comparisons between groups were conducted using the Tukey post hoc test. p-Values ≤0.05 were considered to be statistically significant.
Results
Redifferentiation of passaged chondrocytes
P0 and P2 chondrocytes were cultured independently for up to 3 weeks to confirm their capacity to accumulate ECM and form cartilage tissue in serum-free 3D culture (SF) supplemented with either ITS+ or insulin only (Supplementary Fig. S2). P0 cells grown in serum-free conditions did not accumulate matrix. In contrast, P2 cells accumulated ECM rich in proteoglycans as shown through a histological examination and as quantified biochemically. Immunostaining showed type II collagen and little type I collagen in the tissue. The tissue was more cellular compared to P0 cultures (Supplementary Fig. S2).
Passaged chondrocytes grown in media supplemented with insulin alone (condition used for mass spectroscopy studies) supported chondrocyte redifferentiation and hyaline cartilage tissue formation. The amount of proteoglycan accumulation by P2 cells was similar whether P2 cells were grown in ITS+ or insulin only and had similar cellularity as determined by the DNA content (Supplementary Fig. S3). This suggests that insulin can replace ITS in supporting passaged cell redifferentiation.
Differences in the secretome between P2 and P0 cells in the early stages of culture
The secretome (cell-conditioned media) of P2 and P0 cells grown SF for 1 week of culture was analyzed by mass spectrometry (Fig. 1). One thousand two hundred sixty proteins were identified in the combined secretomes, 807 in P0, and 1122 in P2 cultures, with 669 that overlapped between groups (Fig. 1). Six thousand six hundred eighty-eight peptides were identified in the combined secretomes, 3758 in P0, and 5882 in P2 cultures, with 2952 peptides that overlapped between groups. Spectral counts were log transformed, scaled within each replicate, and used to generate a two-dimensional heat map with hierarchical clustering using the R-Project open-source software (Fig. 1). One hundred seventy-one proteins with a spectral count difference of at least 10-fold were present at significantly different levels. Spectral counts of cartilage-associated proteins, including collagen types I, II, III, and XII, aggrecan, versican, biglycan, decorin, proteoglycan-4, COMP, and matrilin-3, are presented in Figure 2. Collagen types I, III, and XII, and versican were found at higher levels within the P2 secretome, while type II collagen and COMP were found at higher levels in the P0 secretome. Proteins of interest known to be present in cartilage ECM are presented along with number of peptide fragments detected, length of amino acid sequence, and percent sequence coverage of the peptides in Supplementary Table S2.
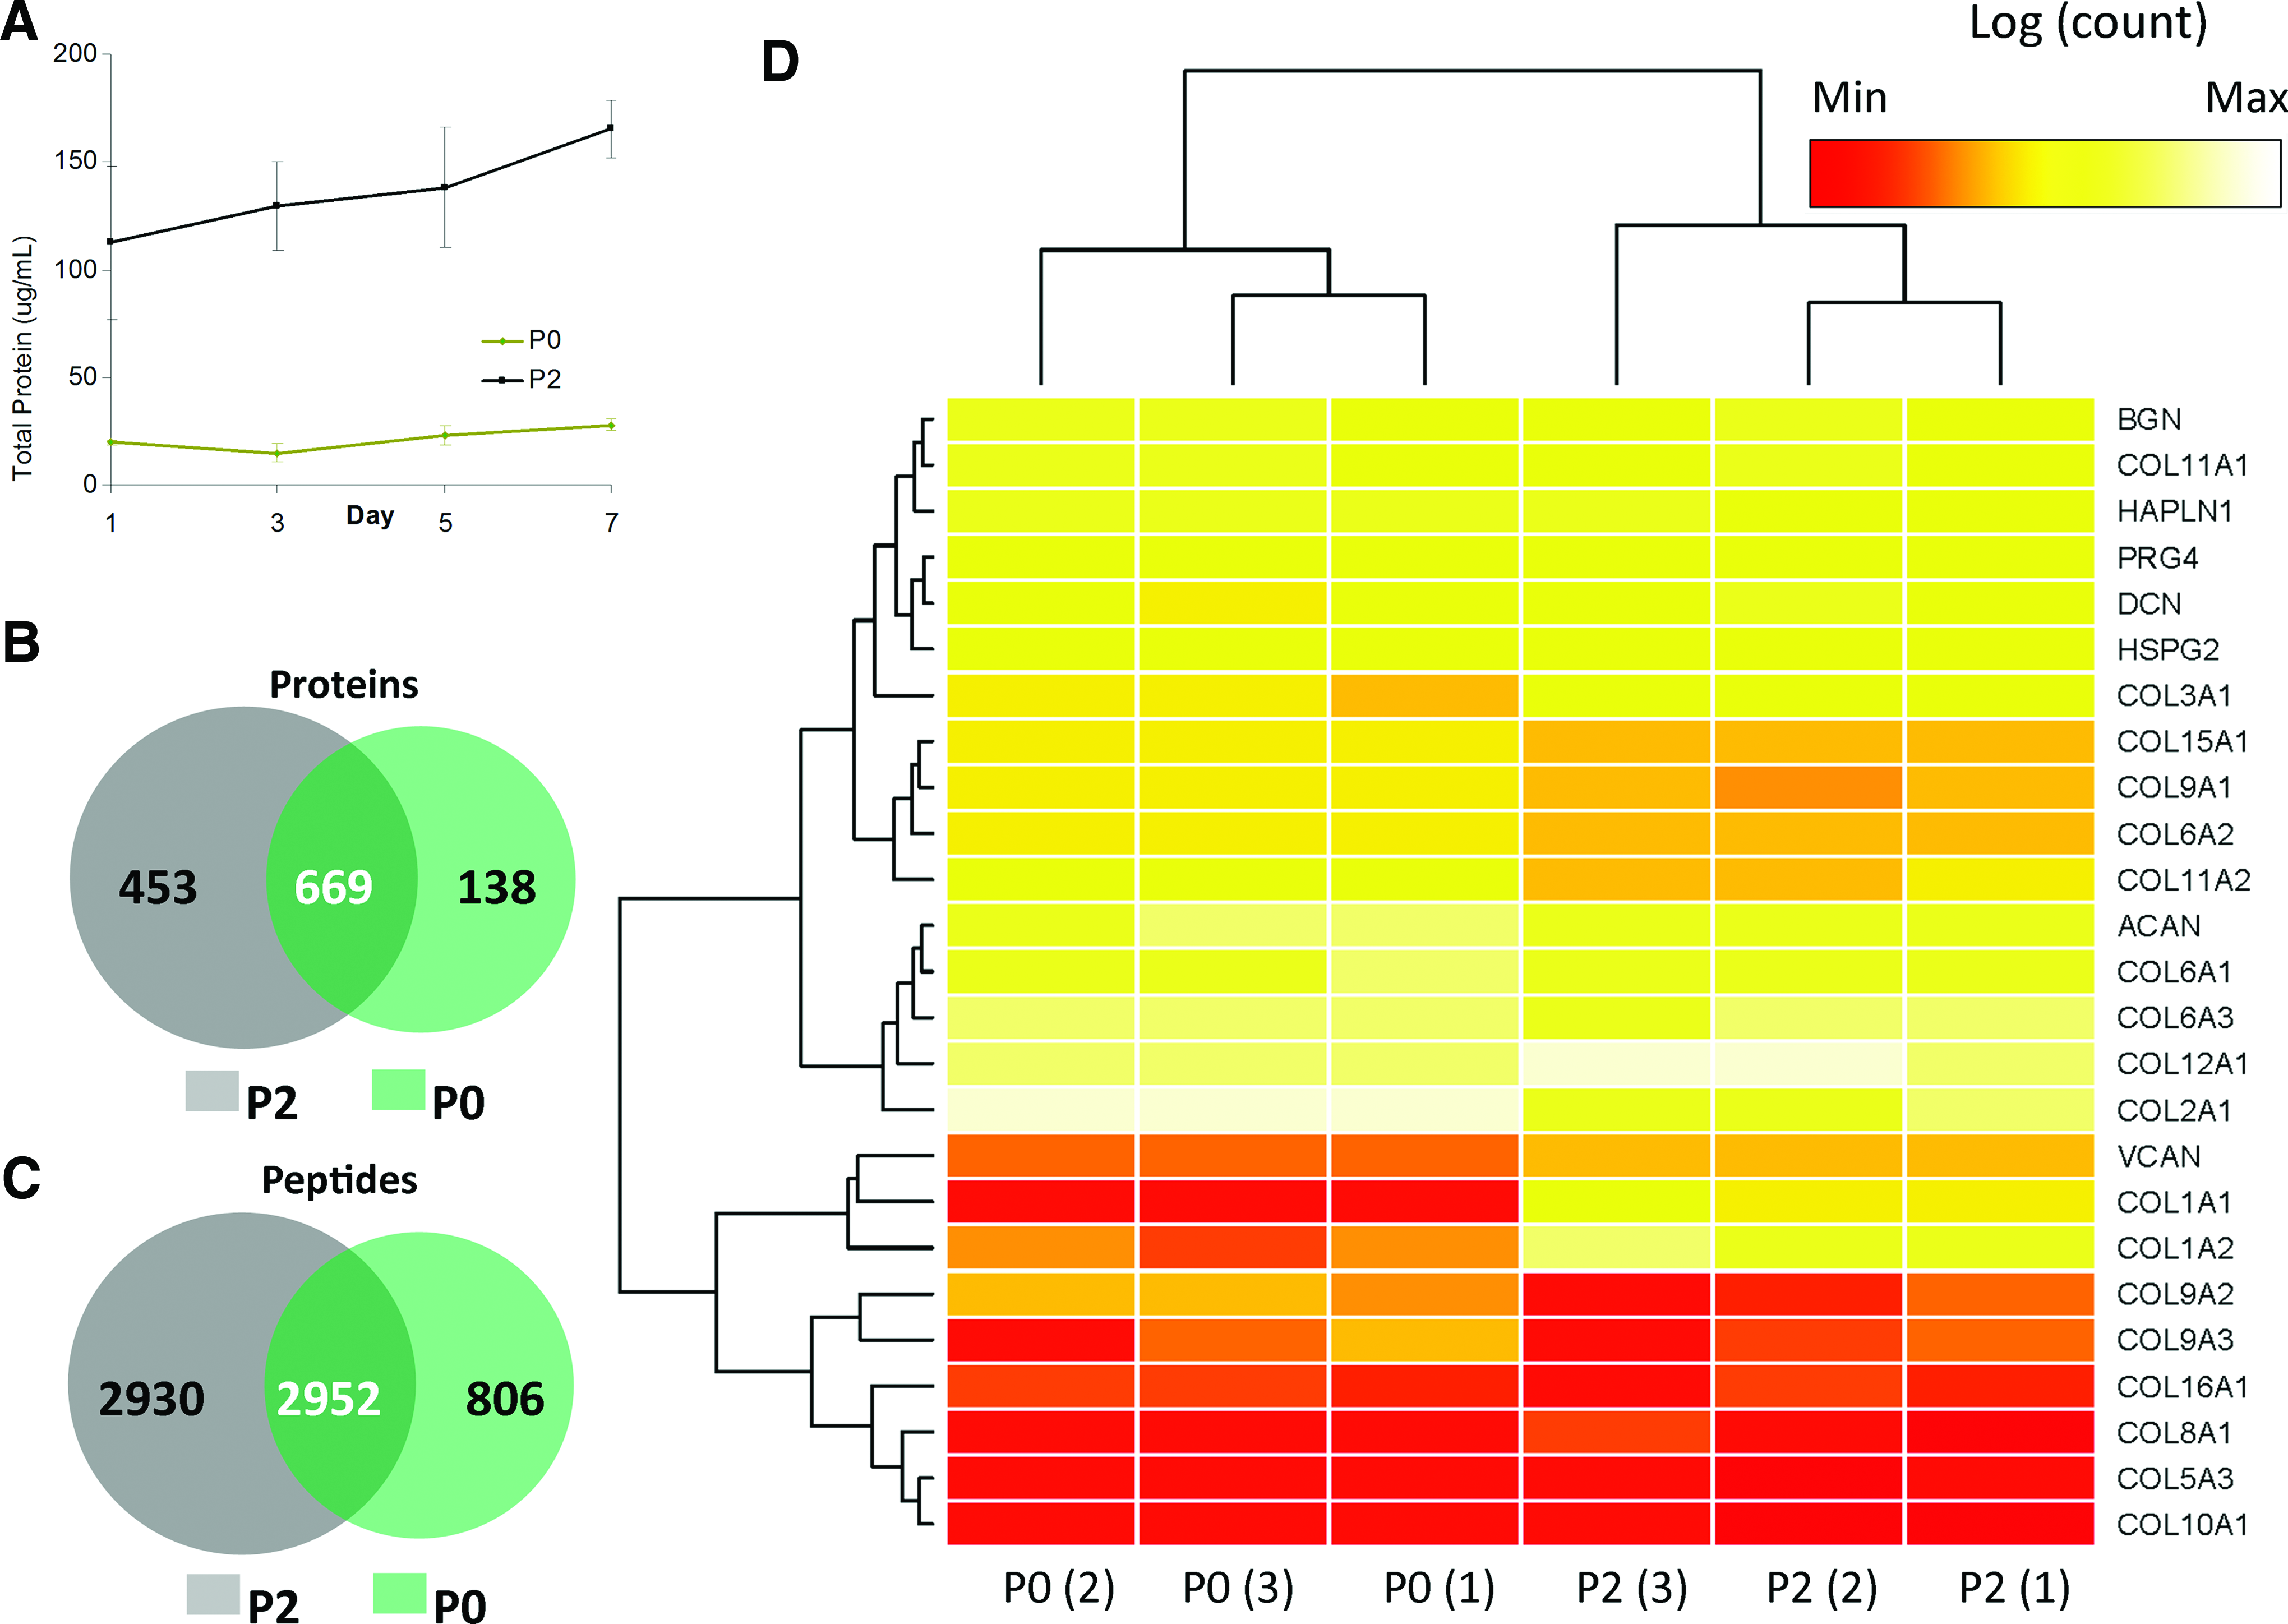
Proteonomic analysis. Total protein present in the secretome in the first week of P2 and P0 culture
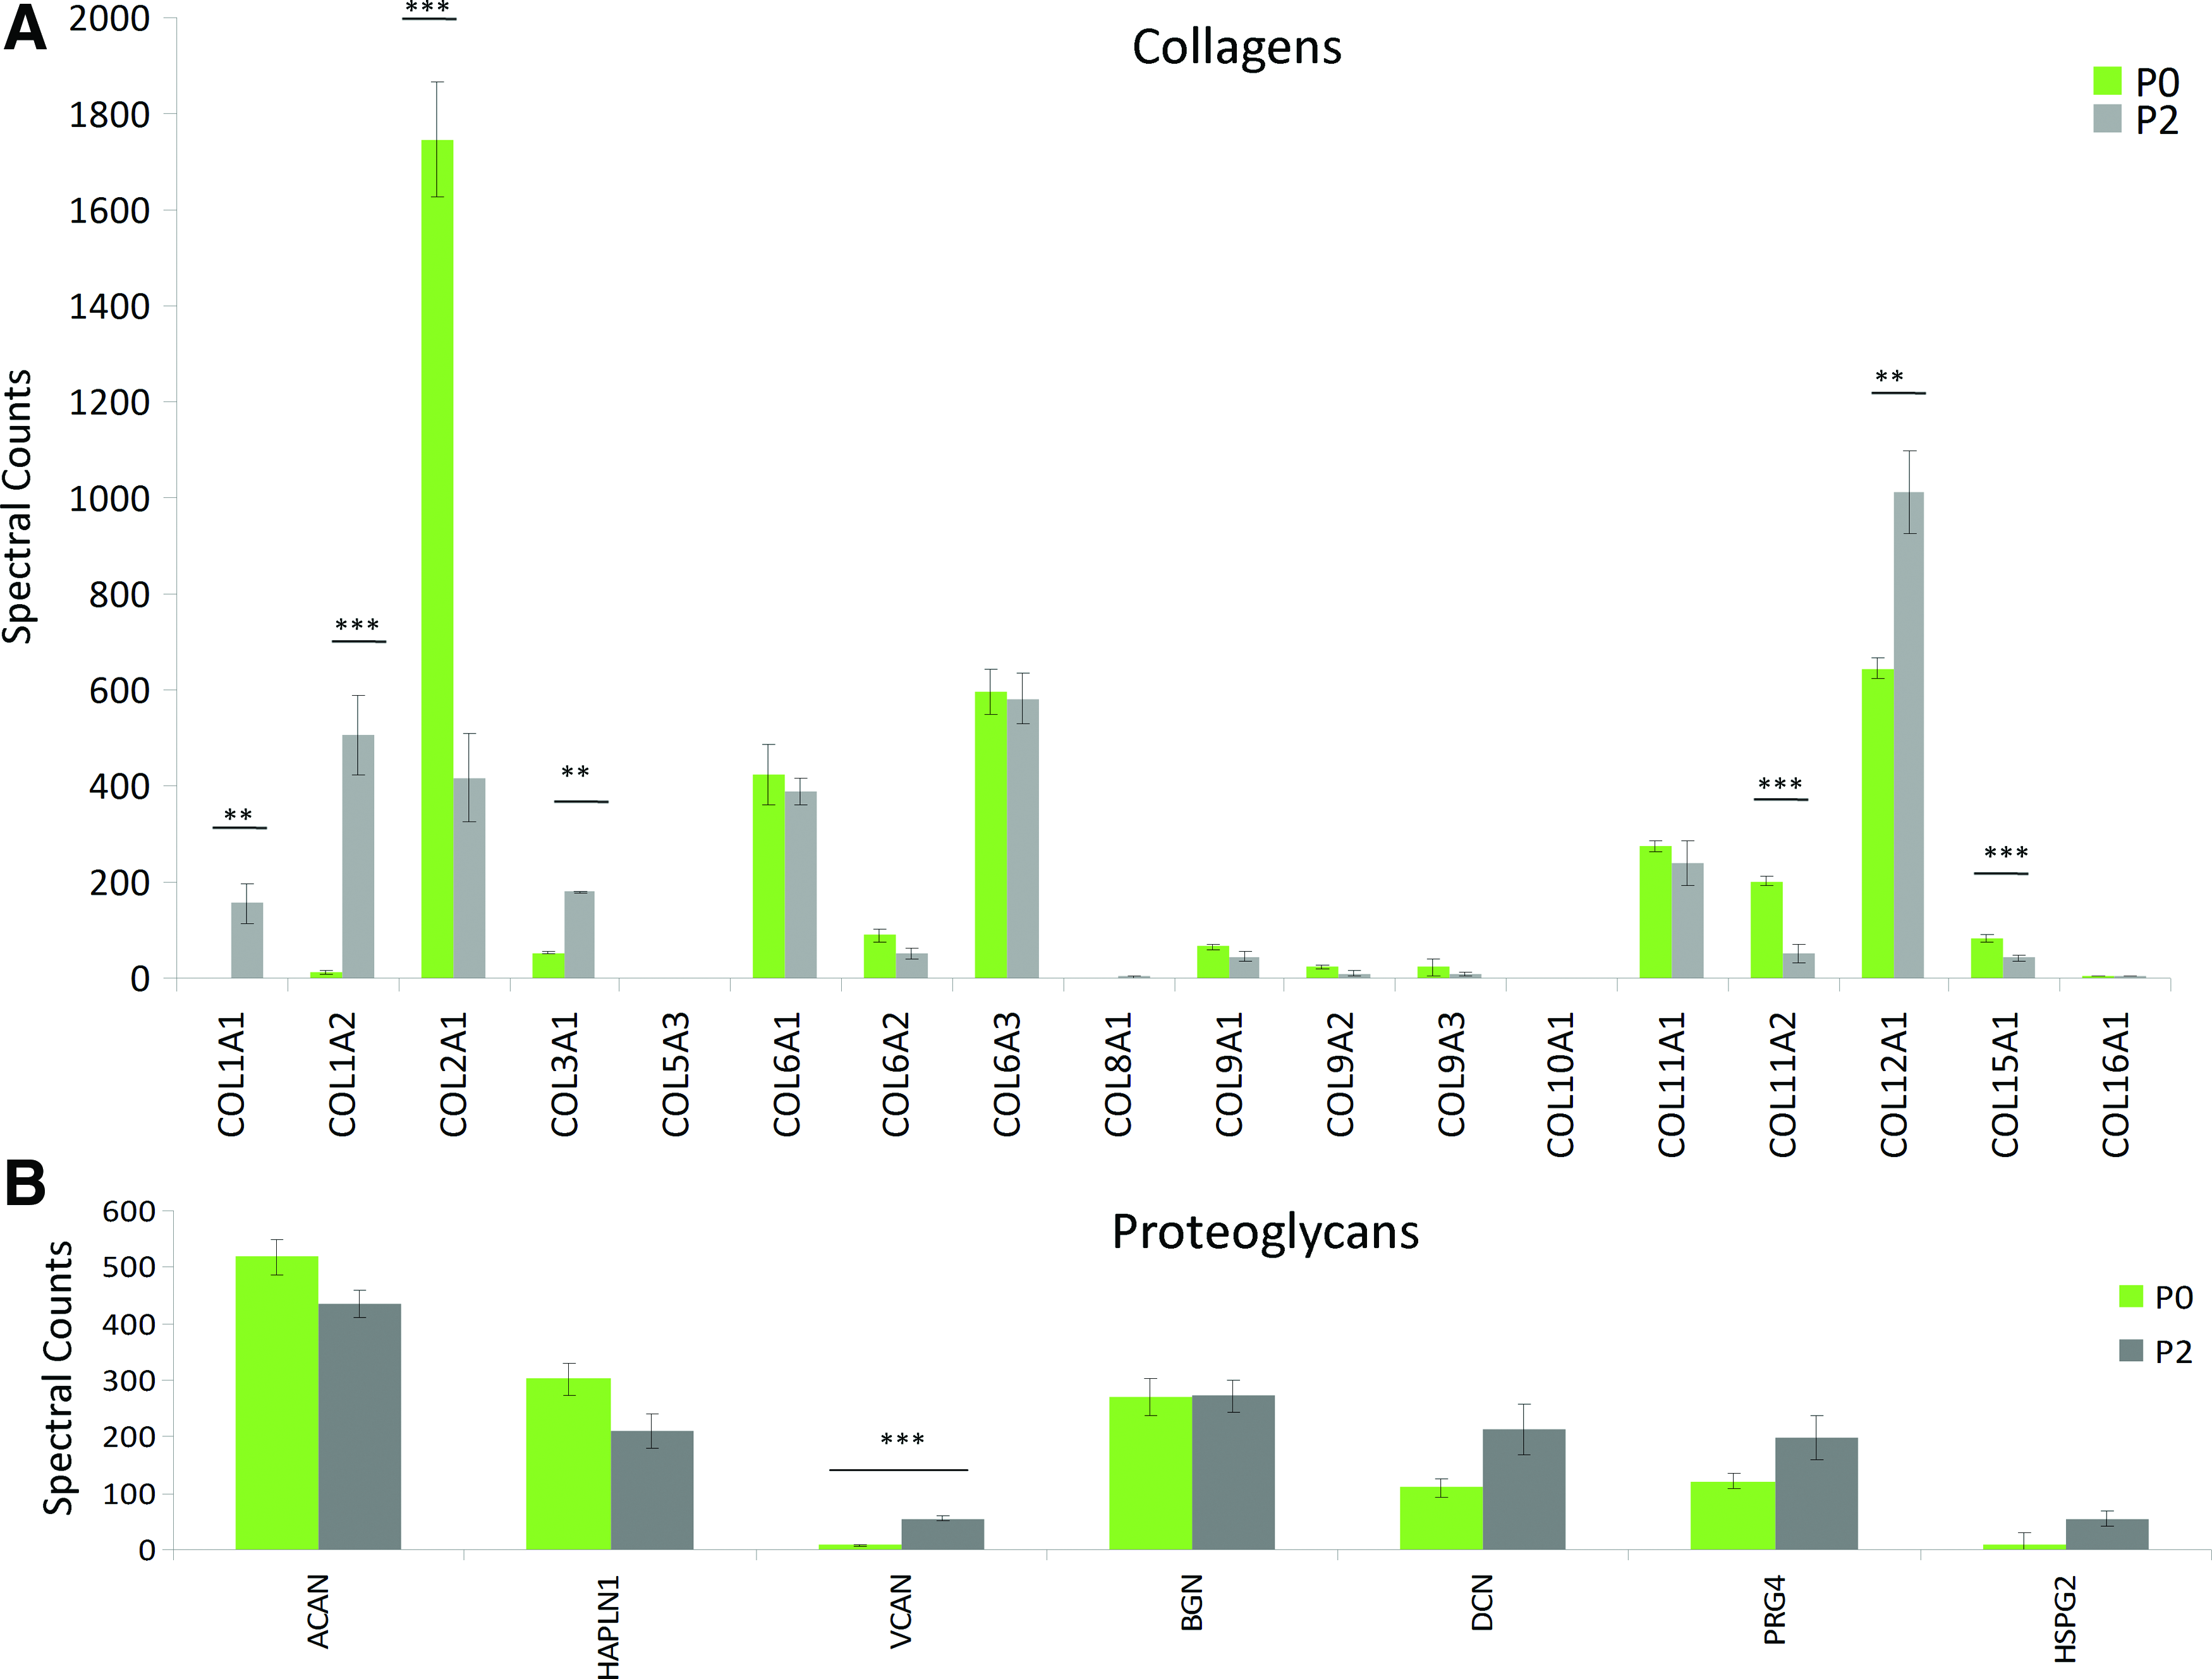
Differences in P2 and P0 secretomes. Spectral counts determined through mass spectrometry for collagen
Differential expression of genes between P2 and P0 cells over time
To characterize gene expression of proteins of interest, mRNA was isolated at various time points within the first 2 weeks of culture and examined by qPCR (Fig. 3). Sox9 was initially lower in P2 cells until day 8 when it reached P0 levels, after which levels of sox9 again dropped. Initially, expression of aggrecan and COMP was significantly lower in P2 cells but these increased, reaching levels expressed by P0 cells by 8 days. Expression of versican was not significantly different between P0 and P2 cells throughout the 2 weeks in culture. Type I collagen expression was initially 100-fold higher in P2 cells than P0, but dropped to about 10-fold higher at 8 days. Expression of type II collagen in P2 cells increased steadily up to day 8, where levels were then 10-fold higher than those found in P0 cells and remained significantly higher throughout 2 weeks. Type III collagen expression remained stable throughout 2 weeks in culture. Type XII collagen levels were significantly higher in P2 cells after just 2 days in culture and steadily deceased throughout 2 weeks although remaining higher than levels in P0.
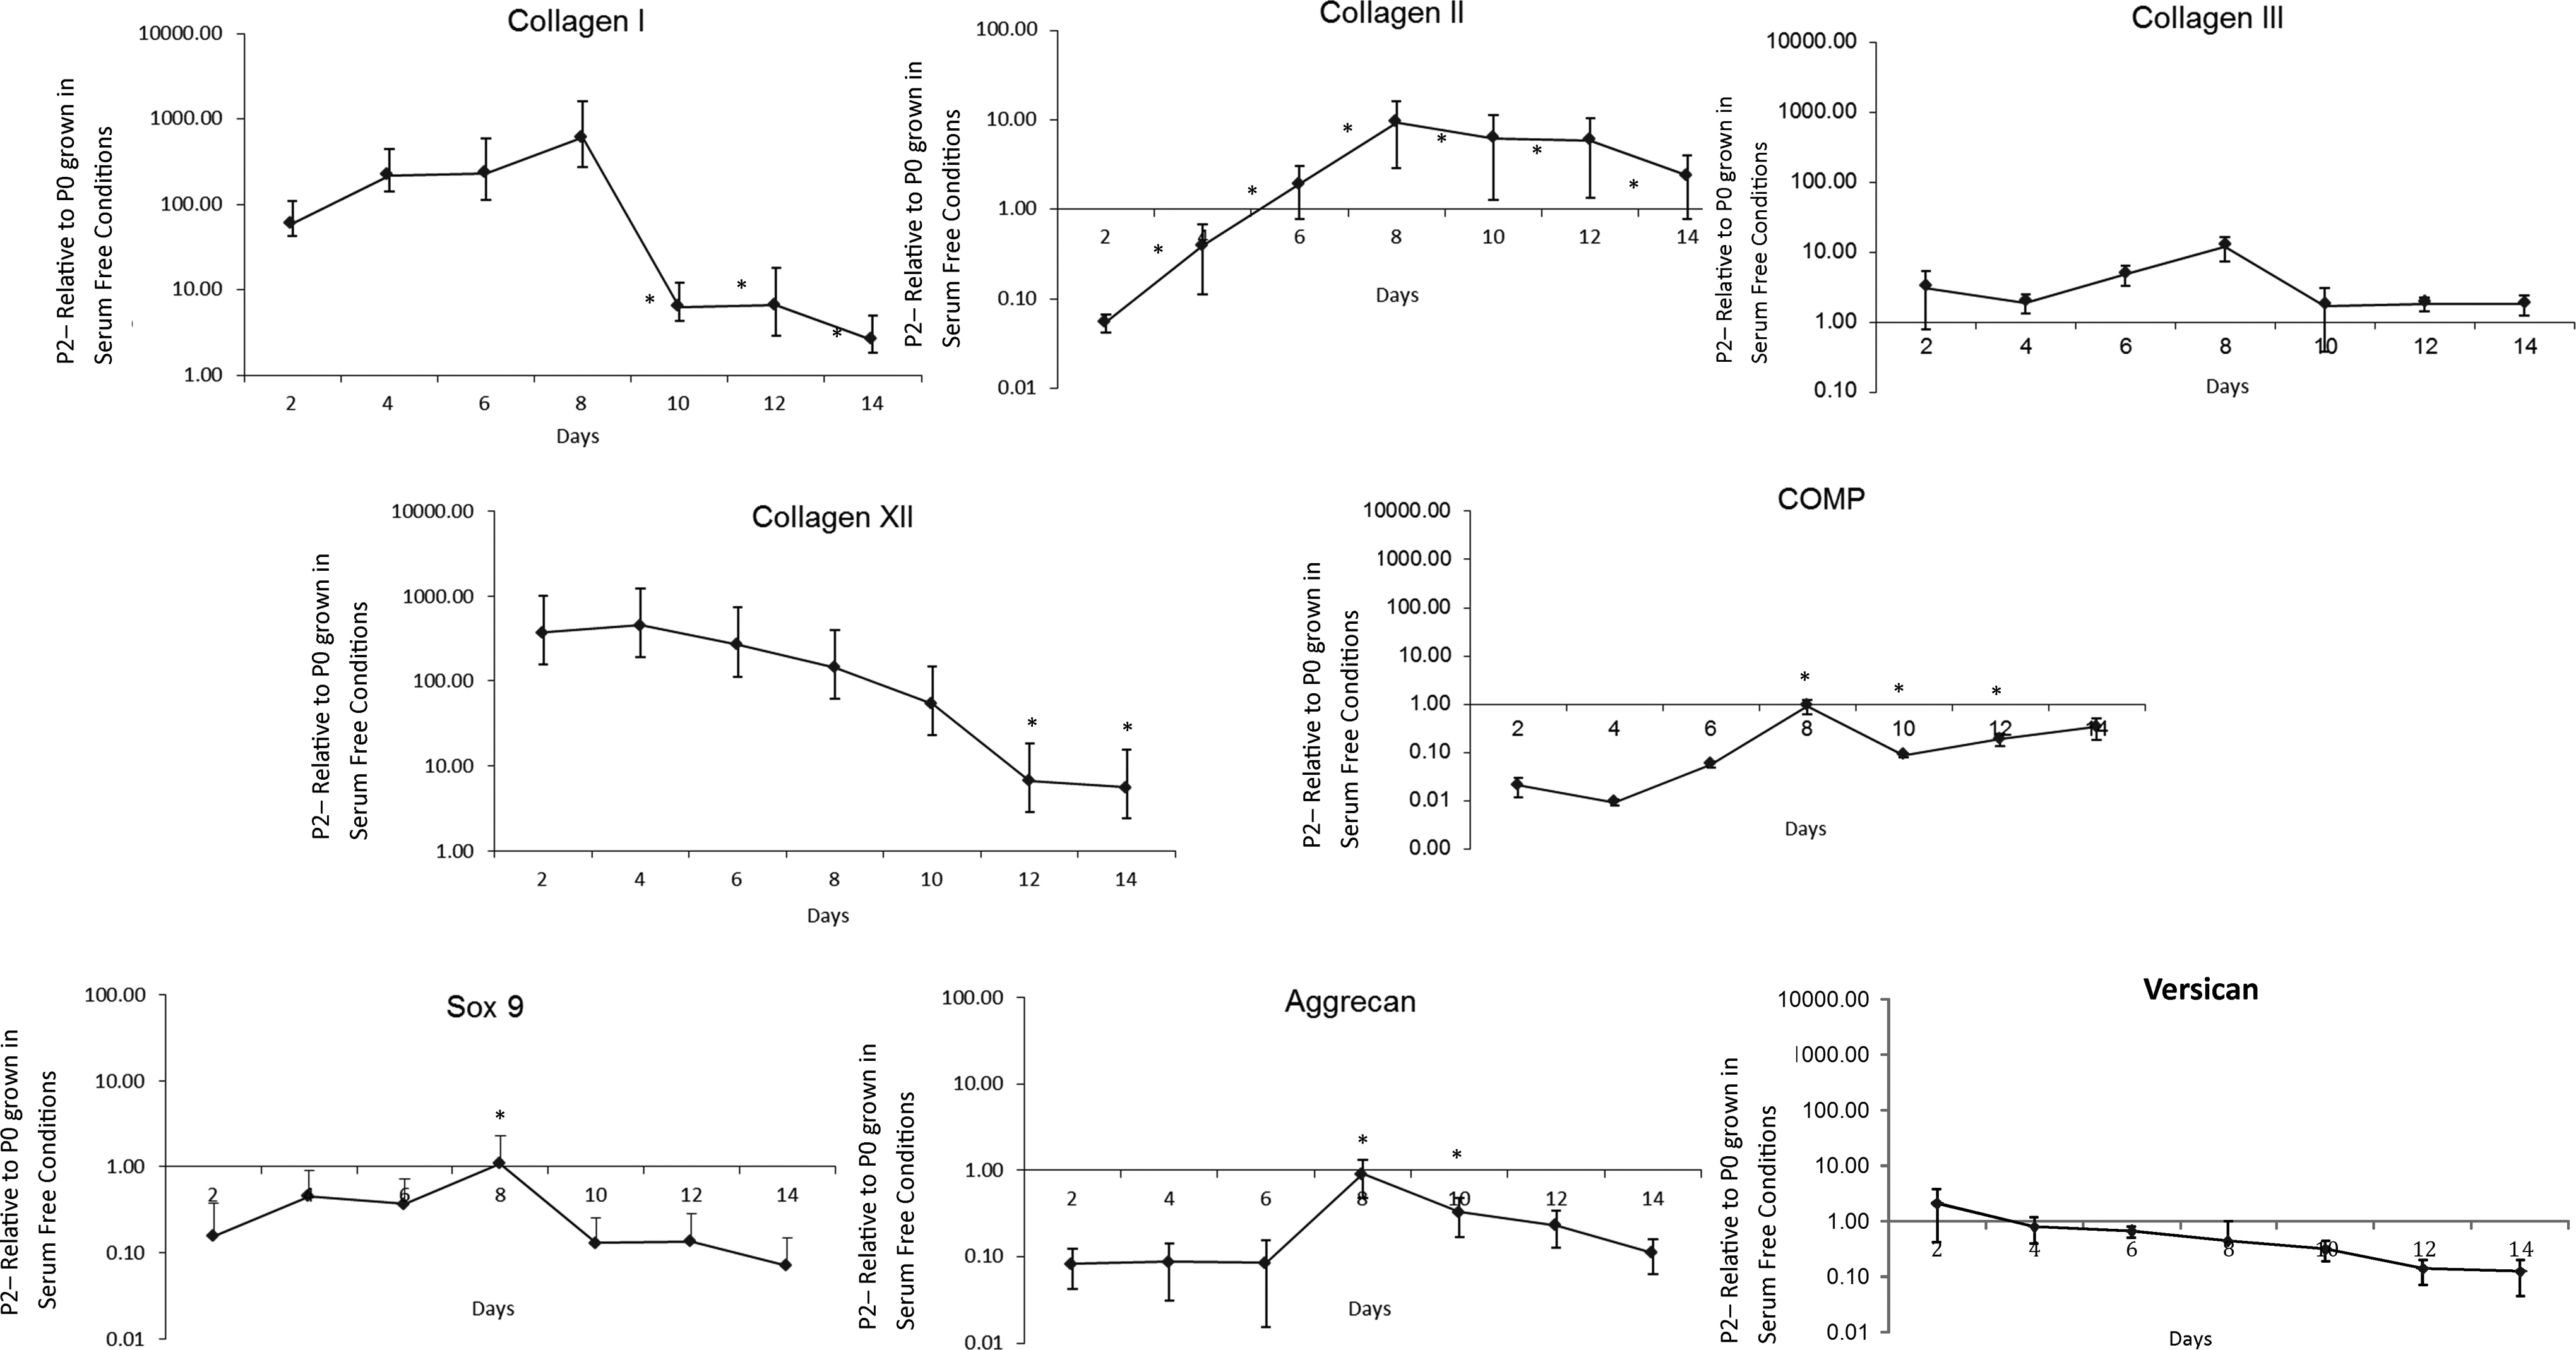
Expression of genes by P2 and P0 cells over time. Gene expression was determined by real time PCR of molecules of interest, as identified by mass spectrometry. The results from three independent experiments were pooled (n=9) and expressed as mean±standard error of the mean (SEM). All values are represented as P2 relative to P0 grown in serum-free conditions. * Significantly different from P2 at day 2 (p<0.05).
Collagens, not proteoglycans, are preferentially retained by P2 cells compared to P0 cells in early cultures
To examine retention of newly synthesized collagen and proteoglycans, the two major macromolecules in cartilage, the media and tissues were collected daily and those from days 1–3 to 8–10 were pooled to create two groups (Fig. 4). Within the first 3 days, proteoglycan synthesis was higher in P0 cells than P2 cells, but in both cultures, only small amounts were retained. By 8–10 days, proteoglycan synthesis for both cell types had decreased and was similar in amount. In contrast, P2 cells synthesized and retained significantly more collagens than P0 cells at both early (days 1–3) and later (days 8–10) time points. The percent of newly synthesized collagen retained in tissue formed by P0 cells decreased at the later time point.

Proteoglycan and collagen synthesis by primary and passaged cells in vitro. Total proteoglycan and collagen synthesis and retention were determined in P0 and P2 cultures between 1 and 3 days and 8 and 10 days in culture. One representative set is shown from a total of three independent experiments. Each experiment condition was performed in triplicate. Results are expressed as mean±SEM. * Total synthesis significantly different between P0 and P2 at the same time point,+total synthesis significantly different between time points of the same cell type (p<0.5).
The ECM differs between cells that will form cartilage tissue compared to those that do not form cartilage tissue
Immunostaining and confocal microscopy were used to probe differences in ECM accumulation within the first 3 days of culture of the proteoglycans and collagens of interest identified by mass spectrometry (Fig. 5). Very little collagen type I was retained within the matrix produced by P2 versus P0 cultures, while collagen type III was retained in the ECM of both P0 and P2 at either time point. P0 cells accumulated small amounts of collagen type II, but little was seen in the ECM. Abundant collagen type II was accumulated in the matrix of P2 cultures by day 1 and this appeared to increase by day 3. Collagen type XII was only detected in the matrix accumulated by P2 cells and was present at day 1. Versican was also absent from P0, but was present on day 1 in the P2 ECM and there appeared to be less staining by day 3. Aggrecan was seen in the P2 matrix on day 3. Decorin was produced by P0 and P2 cells at both time points.
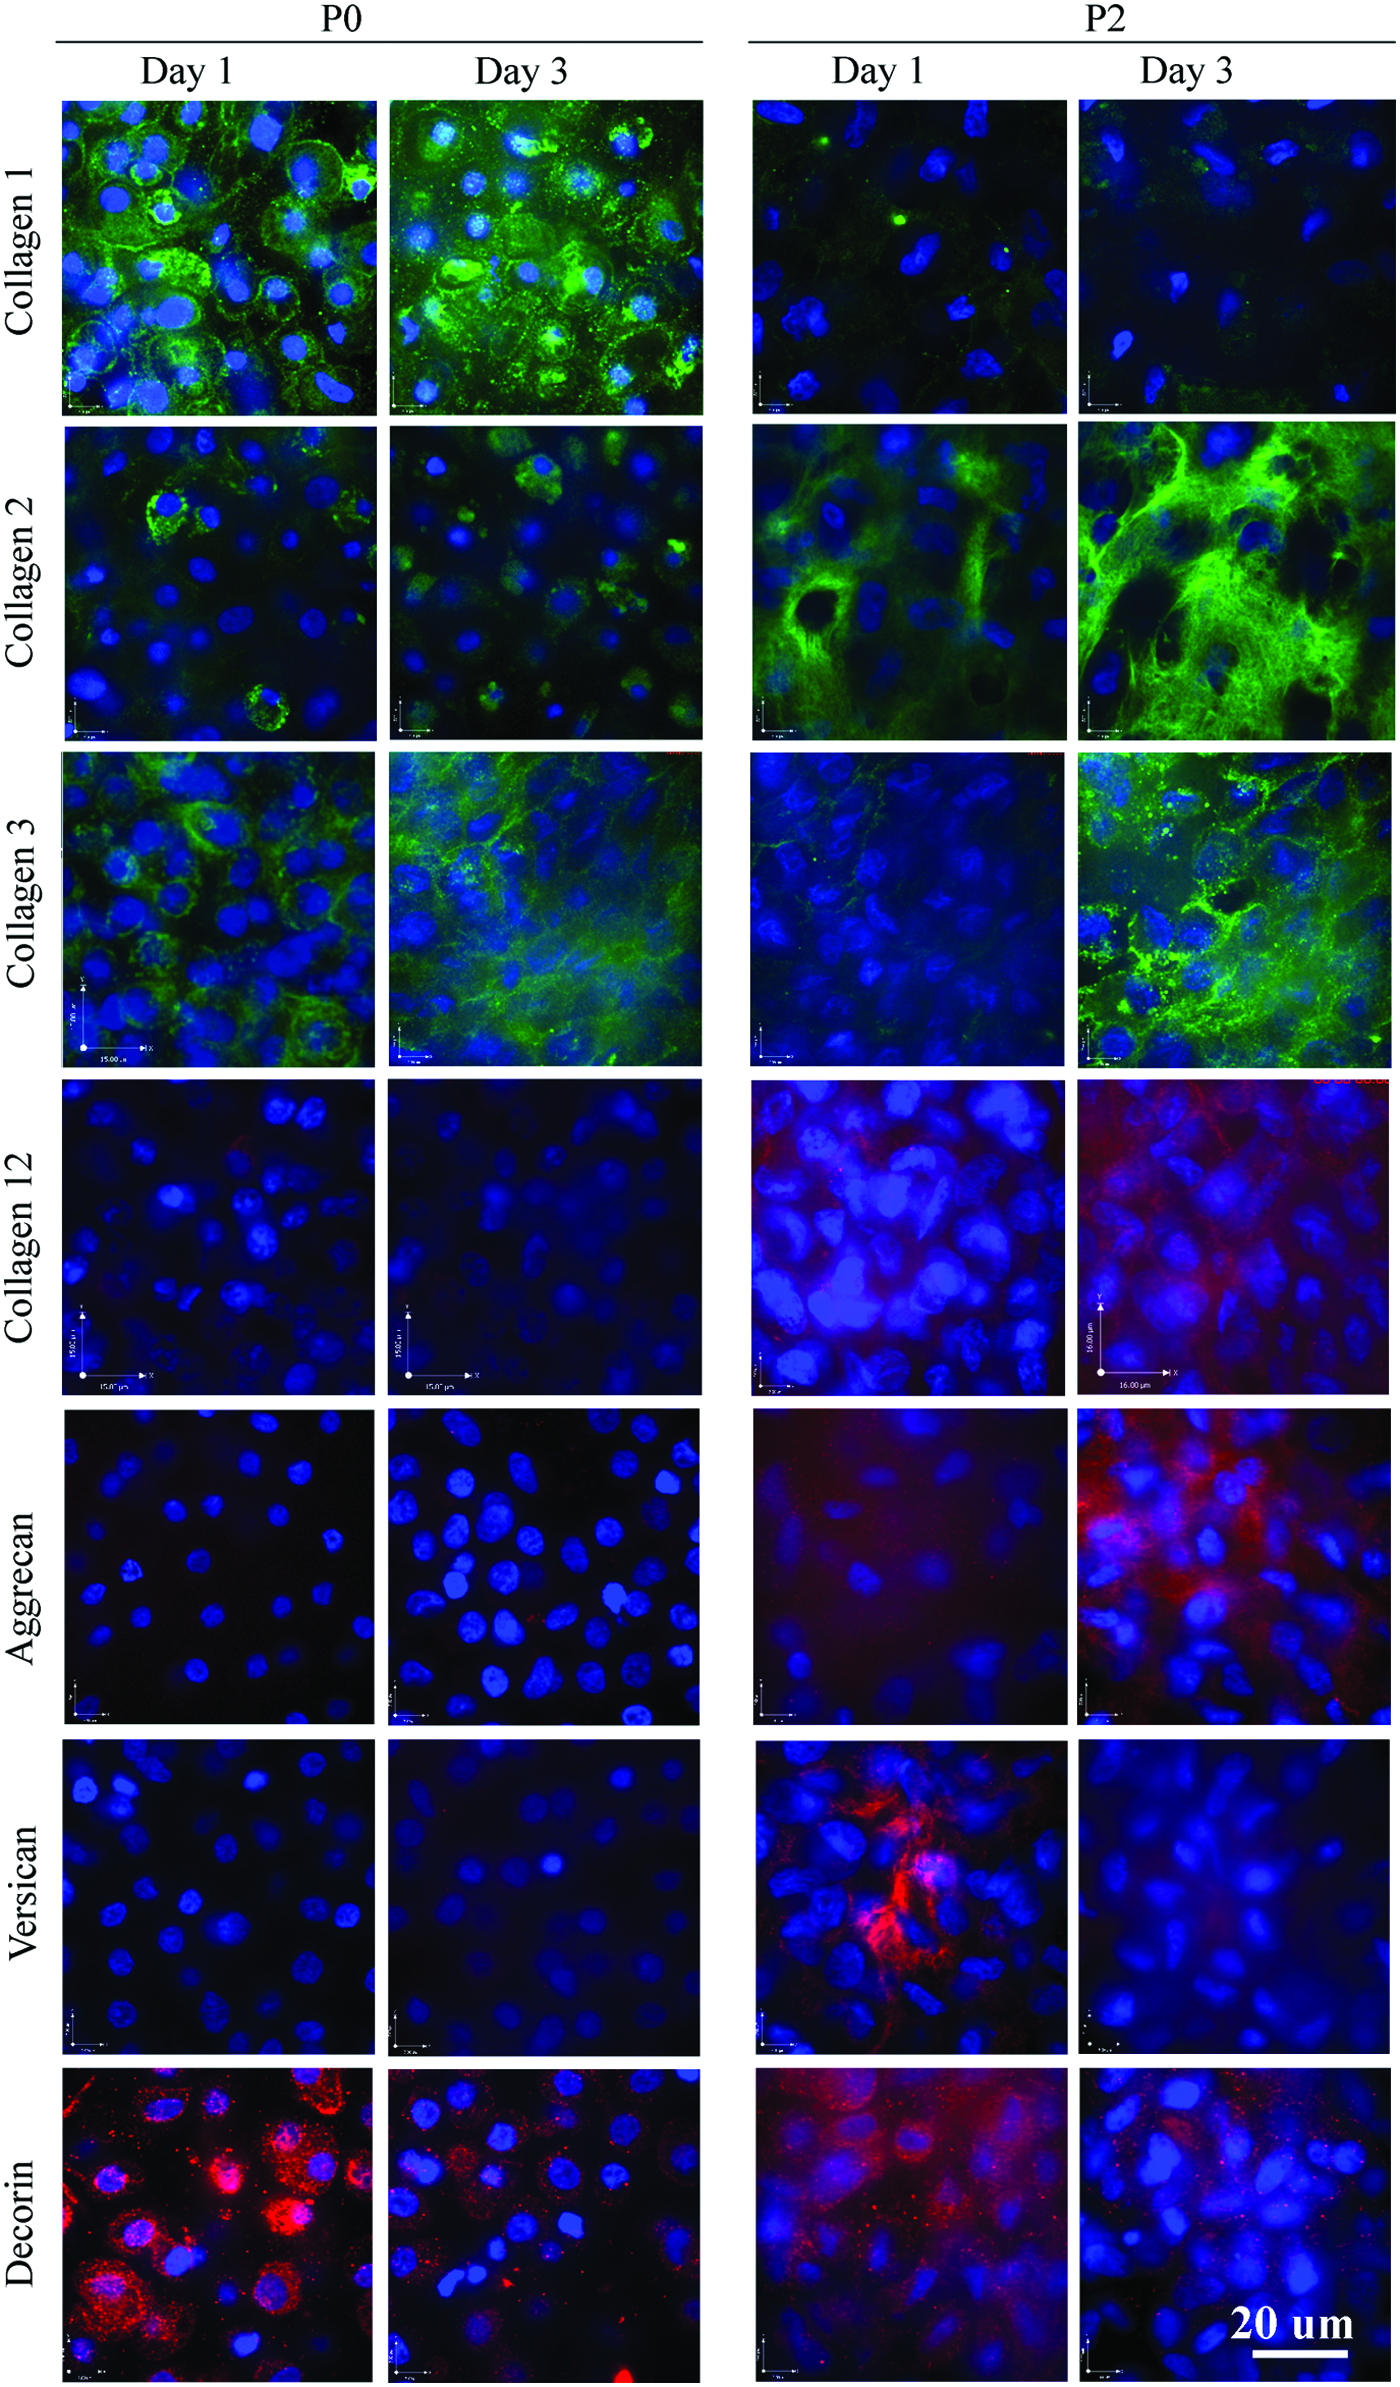
P2 cells accumulate aggrecan, versican, and collagens type II and XII. P2 and P0 cells were grown in serum-free three-dimensional culture for 1 or 3 days and then harvested and stained for various proteins. Immunoreactivity was detected using a fluorescent (either green or red) conjugated secondary antibody and confocal microscopy. Nuclei are stained with DAPI (blue). All images are taken at 100× magnification. Color images available online at www.liebertpub.com/tea
In previous studies, we showed the differential ability of P0 and P2 cells to form cartilage tissue when grown in the presence of serum. P0 cells will generate tissue, whereas P2 cells grown in the presence of FBS will not.23,27 To confirm the findings observed in SF cultures, we immunostained the cells cultured in serum-containing media at the same time points. P0 cells accumulated aggrecan, collagens type II and XII, and versican as early as 1 day in culture, whereas P2 cells grown in the presence of FBS did not accumulate collagen type XII or versican, similar to P0 cells grown SF (Fig. 6).

P0 cells accumulate aggrecan, versican, and collagens type II and XII when grown in culture in media supplemented with 20% fetal bovine serum. P2 and P0 cells were grown in culture containing serum for 1 or 3 days and then harvested and stained for various proteins. Immunoreactivity was detected using a fluorescent (either green or red) conjugated secondary antibody and confocal microscopy. Nuclei are stained with DAPI (blue). All images are taken at 100× magnification. Color images available online at www.liebertpub.com/tea
Discussion
To date, identifying a cell source, culture conditions, and/or scaffold that allow for articular cartilage tissue engineering has been problematic. By taking advantage of in vitro culture systems that do or do not support hyaline cartilage tissue formation in vitro, it was possible to identify matrix molecules that were differentially expressed within the first 3 days of culture. Our study showed that versican, collagens type XII, II and III, decorin, and aggrecan were present in the matrix produced by cells that were going to form hyaline cartilage in vitro. As collagen types II and III, decorin, and aggrecan were present in small amounts in the cultures of passaged cells in serum-containing and primary cells in serum-free conditions (conditions that do not form tissue), suggests that their presence in the early time points (day 1) may not be sufficient to promote tissue formation. Collagen type II and aggrecan are clearly necessary for cartilage formation as they are the major components of articular cartilage and were observed to increase over time in chondrogenic cultures only. In contrast, type XII collagen and versican were absent from the ECM, under conditions in which cells were not destined to form cartilage tissue. Importantly, cells that form tissue whether grown in the presence or absence of serum both showed accumulation of these two molecules, supporting a role for them in early matrix accumulation. Further study will be required to confirm if these molecules are required for tissue formation. Interestingly, analysis of the secretome of redifferentiating passaged chondrocytes showed that these two molecules were secreted, suggesting that versican and type XII may be suitable for use to screen conditions in high-throughput assays to identify chondrogenic-promoting conditions.
The early time points (less than 10 days of culture) selected for this study were appropriate for three reasons. First, P2 redifferentiation appears to be occurring during the first week as the chondrogenic genes, collagen type II, aggrecan, sox9, and COMP, were significantly upregulated by day 8 relative to day 2 of culture. Second, as early as 3 days of culture, a significant difference in collagen retention was detected between the cells that formed cartilage and those that did not. The data also showed that a greater number of unique proteins/peptides were detected in media from cultures that will form cartilage (P2 in SF) even up to 8 days than those that do not (P0 SF).
In keeping with our results, others have also shown a role for versican, a chondroitin sulfate proteoglycan, and collagen type XII in early cartilage tissue formation.27–34 Versican has been shown to be expressed during chondrogenesis, particularly in differentiating cells. Versican expression is localized in limb precartilage mesenchyme condensation, a precursor stage to chondrocyte differentiation.28,29 Shepard et al. have shown impaired joint morphogenesis and reduced limb length in chick versican knockdown studies. 30 Versican overexpression, particularly the G1 portion or the V3 isoform, in chick wing buds led to enhanced chondrogenesis. 35 In keeping with its role in chondrogenesis, versican gene expression levels rapidly decrease during growth and is expressed at low levels in mature articular cartilage. 32 Versican may facilitate chondrogenesis by binding TGFβ in the matrix and regulating its signaling. 30 Notably, the G3 domain of versican binds fibrillin, tenascin, and heparan sulfate proteoglycans and may be involved in retention of the cartilage ECM. 36
Type XII collagen is a member of the FACIT collagen subfamily.37–39 Gregory et al. evaluated the distribution of collagen XII in rat cartilage from embryonic joint development through adulthood 33 and showed that collagen XII was synthesized at the articular surface shortly after joint cavitation when an articular cartilage zone is first identified. Immunostaining detected collagen XII in the cartilage, which increased with age through day 28. This collagen has also been detected in fetal bovine articular cartilage and perichondrium. 34 Interestingly collagen type XII plays a role in regeneration of tissues other than cartilage. Wei et al. showed that type XII collagen colocalizes with tenascin and fibronectin in the regenerating newt limb, 40 as gene expression was detected in the wound epithelium and mesenchyme as regeneration proceeded. Early contribution of collagen XII to the developing matrix is further supported by the fact that α1[XII] collagen gene was decreased by the mid-bud and late-bud blastema stages. 40 How collagen type XII effects these changes is unknown, but influencing collagen alignment 33 or by binding to other molecules such as COMP, 41 which are known to effect matrix organization and retention, is a possibility. Alternatively, collagen type XII may be influencing cell differentiation as knockout mice show delayed endothelial cell maturation. 42 Polacek et al. have shown that type XII collagen is present in the secretome of human passaged chondrocytes. 43 Interestingly, collagen type XII was not detected in cartilage explant secretome, suggesting a role for this collagen during redifferentiation and/or matrix accumulation. It is not known whether versican and type XII collagen interact in some way to influence matrix accumulation.
The presence of type I collagen, a marker of dedifferentiation, in the secretome of P2 cells was expected and may be due to the gradual change in the phenotype of P2 cells during the first week of culture. In support of this, type I collagen gene expression was stable during the first week of culture but decreased by over 100-fold by day 10. Similarly, mesenchymal stromal cells differentiate to chondrocytes slowly and have also been shown to require about 10–14 days. 44 Importantly, there was no evidence of retention of type I collagen within the nascent P2 ECM. Interestingly, levels appeared higher for chondrocyte-specific proteins in the P0 secretome, including collagen type II and COMP, under conditions in which the cells do not form cartilage. This suggests that these cells produce matrix molecules characteristic of cartilage but do not retain them in sufficient amounts to form tissue. The reason(s) for this requires further investigation.
It was not surprising that cells forming cartilage tissue have a different ECM as compared to cells that do not, as numerous studies have shown that the microenvironment as well as other factors may influence cell function.45–47 Our data do not determine if cells produce an ECM that favors accumulation of molecules such as collagen type XII and versican or whether cells grown in the right culture media produce these molecules that then favor cartilage tissue formation. However, our study does suggest that collagen XII and versican may serve as early biomarkers of the ability to form hyaline cartilage. This may be a way to assess the chondrogenic potential of cells grown under specific conditions and/or on scaffolds as these molecules are present in the secretome.
In summary, versican, collagens XII, III, and II, decorin, and aggrecan are early matrix molecules accumulated by passaged chondrocytes that will form cartilage tissue in vitro. However, versican and collagen type XII are accumulated only by cells that will form hyaline cartilage. Further study is required to determine if these molecules are also accumulated by passaged human chondrocytes and their role in promoting hyaline cartilage formation.
Footnotes
Acknowledgments
This work was made possible with the assistance of Ihor Batruch, Chris Smith, and Maria Pavlou of the Advanced Centre for Detection of Cancer Laboratory at Mount Sinai Hospital. We thank Mr. Harry Bojarski and Ryding-Reading Meat Packers, Toronto, for providing bovine tissues. This work was supported by funding from the Department of Defence W81XWH-10-1-0787.
Disclosure Statement
No competing financial interests exist.
References
Supplementary Material
Please find the following supplemental material available below.
For Open Access articles published under a Creative Commons License, all supplemental material carries the same license as the article it is associated with.
For non-Open Access articles published, all supplemental material carries a non-exclusive license, and permission requests for re-use of supplemental material or any part of supplemental material shall be sent directly to the copyright owner as specified in the copyright notice associated with the article.
