
Abstract
Ferromagnetic fiber networks have the potential to deform in vivo imparting therapeutic levels of strain on in-growing periprosthetic bone tissue. 444 Ferritic stainless steel provides a suitable material for this application due to its ability to support cultures of human osteoblasts (HObs) without eliciting undue inflammatory responses from monocytes in vitro. In the present article, a 444 fiber network, containing 17 vol% fibers, has been investigated. The network architecture was obtained by applying a skeletonization algorithm to three-dimensional tomographic reconstructions of the fiber networks. Elastic properties were measured using low-frequency vibration testing, providing globally averaged properties as opposed to mechanical methods that yield only local properties. The optimal region for transduction of strain to cells lies between the ferromagnetic fibers. However, cell attachment, at early time points, occurs primarily on fiber surfaces. Deposition of fibrin, a fibrous protein involved in acute inflammatory responses, can facilitate cell attachment within this optimal region at early time points. The current work compared physiological (3 and 5 g·L−1) and supraphysiological fibrinogen concentrations (10 g·L−1), using static in vitro seeding of HObs, to determine the effect of fibrin deposition on cell responses during the first week of cell culture. Early cell attachment within the interfiber spaces was observed in all fibrin-containing samples, supported by fibrin nanofibers. Fibrin deposition influenced the seeding, metabolic activity, and early stage differentiation of HObs cultured in the fibrin-containing fiber networks in a concentration-dependant manner. While initial cell attachment for networks with fibrin deposited from low physiological concentrations was similar to control samples without fibrin deposition, significantly higher HObs attached onto high physiological and supraphysiological concentrations. Despite higher cell numbers with supraphysiological concentrations, cell metabolic activities were similar for all fibrinogen concentrations. Further, cells cultured on supraphysiological concentrations exhibited lower cell differentiation as measured by alkaline phosphatase activity at early time points. Overall, the current study suggests that physiological fibrinogen concentrations would be more suitable than supraphysiological concentrations for supporting early cell activity in porous implant coatings.
Introduction
T
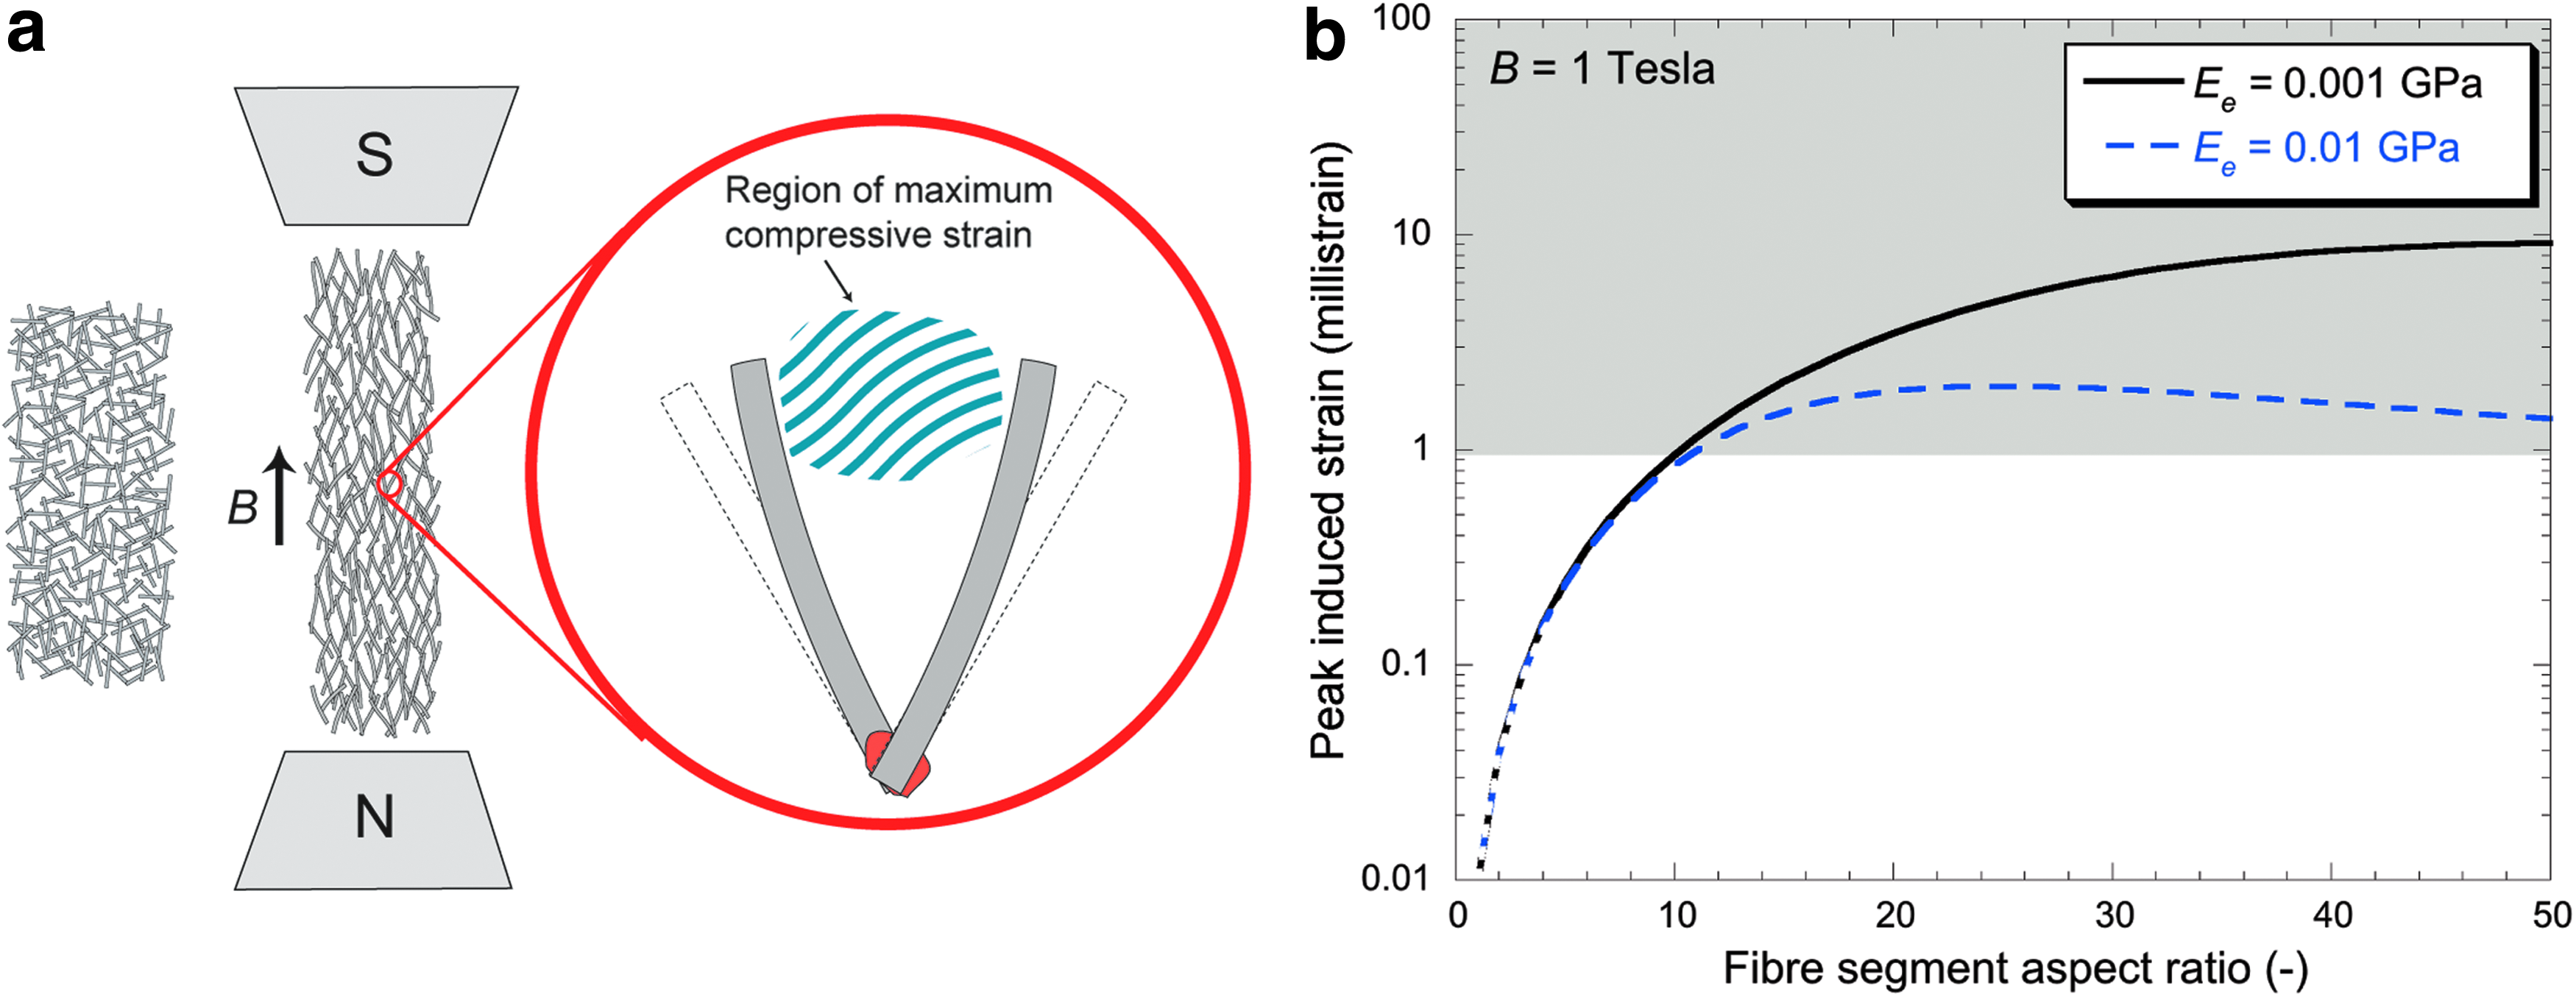
The rationale behind a porous magneto-active layer is to induce in vivo modeling of in-growing periprosthetic bone by the application of an external magnetic field of clinical magnitude. The aspect ratio (length/diameter) of fiber segments between joints represents an important controllable design parameter. When a magnetic field is applied, these fiber segments tend to become aligned along the field direction, inducing deflections of individual fibers and mechanical straining of any compliant matrix material filling the interfiber space (see Fig. 1a). Figure 1b shows predictions for the peak strain 2 induced within in-growing bone tissue, as a function of the fiber segment aspect ratio, for two matrix stiffness levels, for a field strength of 1 T (typical of fields currently employed for diagnostic purposes). Since the stiffness of granulation tissue is around 0.001 GPa 12 and that of immature bone is in the range of 0.03 to 0.1 GPa 12 and strains of ∼1 millistrain13,14 are known to be effective in stimulating bone growth, this plot suggests that beneficial therapeutic effects might be possible in the early stages of healing using fields no greater than those already employed for diagnostic purposes. For a given fiber material, the strain field in the interfiber space can be controlled via the fiber segment aspect ratio and the magnitude of the imposed magnetic field. From Figure 1, it can be inferred that networks with relatively high fiber segment aspect ratios would be more readily deformable by the application of a magnetic field. An important issue in this context is that high porosity is expected to lead to reductions in mechanical properties. Depending on the fiber volume fraction, the network architecture (isotropic or highly oriented), and the fiber segment aspect ratio, experimentally measured Young's moduli values are no higher than a few GPa.15–19
The elastic properties of highly porous materials are most commonly measured using conventional mechanical (static) testing with the majority of studies focusing on compressive testing as it is easier to carry out compared with tensile testing or even bending. However, it is well known that in highly porous materials inelastic straining commonly occurs at low applied loads. Dynamic methods, on the other hand, such as vibration and ultrasonic testing, involve much lower applied loads than conventional static methods and therefore have the potential to give fast and accurate low-strain amplitude measure of the elastic properties. Further, static methods typically utilize small test specimens yielding only local properties whereas dynamic methods can provide globally averaged properties. Correct selection of the most appropriate method depends on the type of materials to be investigated, their shape, and the practical difficulties associated with each of the aforementioned methods. 20 For instance, in vibration, specimen shape is important as it determines the ease with which different vibrational modes are excited. It is also important that the wavelength of the ultrasonic wave is much greater than the scale of the inhomogeneity in the porous material. Very “lossy” materials may be unsuitable for ultrasonic testing as it will be hard to obtain a strong ultrasonic transmission, in which case static testing may be more appropriate. For highly porous metallic networks of the type investigated in this study, the elastic properties were determined with good accuracy using vibration testing.
When cells migrate into porous fiber networks, they initially attach to the fiber surface and junction regions (see image in Fig. 2c from day 1 of the current study). Depending on the seeding density, filling the interfiber space could take a few weeks. 9 Deposition of fibrous proteins may contribute to attachment of cells within the interfiber spaces and thus influence the transduction of strain to cells within the networks. Fibrin is produced from fibrinopeptide chains during acute-stage inflammatory responses due to enzymatic lysis of fibrinogen by thrombin.21–23 It is a natural, biodegradable fibrous protein commonly used for clinical and experimental tissue engineering applications, 24 including surgical tissue adhesives, 25 delivery of growth factors, 26 genes, 27 and cells 28 as well as tissue engineering for cartilage,29,30 skin, 31 and bone.32–34 The deposition of fibrin at early time-points during physiological responses to implantation coupled with its wide-spread acceptance in clinical and tissue engineering applications recommend this natural biopolymer for in vitro studies with ferritic fiber networks.
Representative scanning electron micrograph images showing
Physiological plasma concentrations of fibrinogen fall within the range of 1.5 and 5 g·L−1.35–37 Concentrations above 5 g·L−1 have been used for tissue engineering and cell delivery applications,28,33,38,39 while higher concentrations of 50 to 115 g·L−1 have been used in clinical sealants. 25 The majority of studies on the effects of fibrinogen concentration on cell responses have focused on concentrations above 5 g·L−1 with few focused on physiological concentrations.38–42 The results of these studies consistently demonstrated a negative correlation between cell activity and fibrinogen concentration.38,39,41
In the present work, physiological fibrinogen concentrations were compared with supraphysiological concentrations, using static in vitro seeding of HObs, in order to determine the effect of fibrin deposition on cells infiltrating within the porous ferromagnetic fiber networks. The hypothesis was that fibrin deposition would facilitate early cell attachment within the interfiber spaces. Network architecture was characterized using X-ray nano-tomography and in-plane network elastic constants (Young's moduli and Poisson's ratios) were measured using low-frequency vibration testing. Cell attachment, proliferation, metabolic activity, and early stage differentiation (see Supplementary Data) in the networks were examined for 1 week following fibrin deposition.
Materials and Methods
Sintered fiber networks
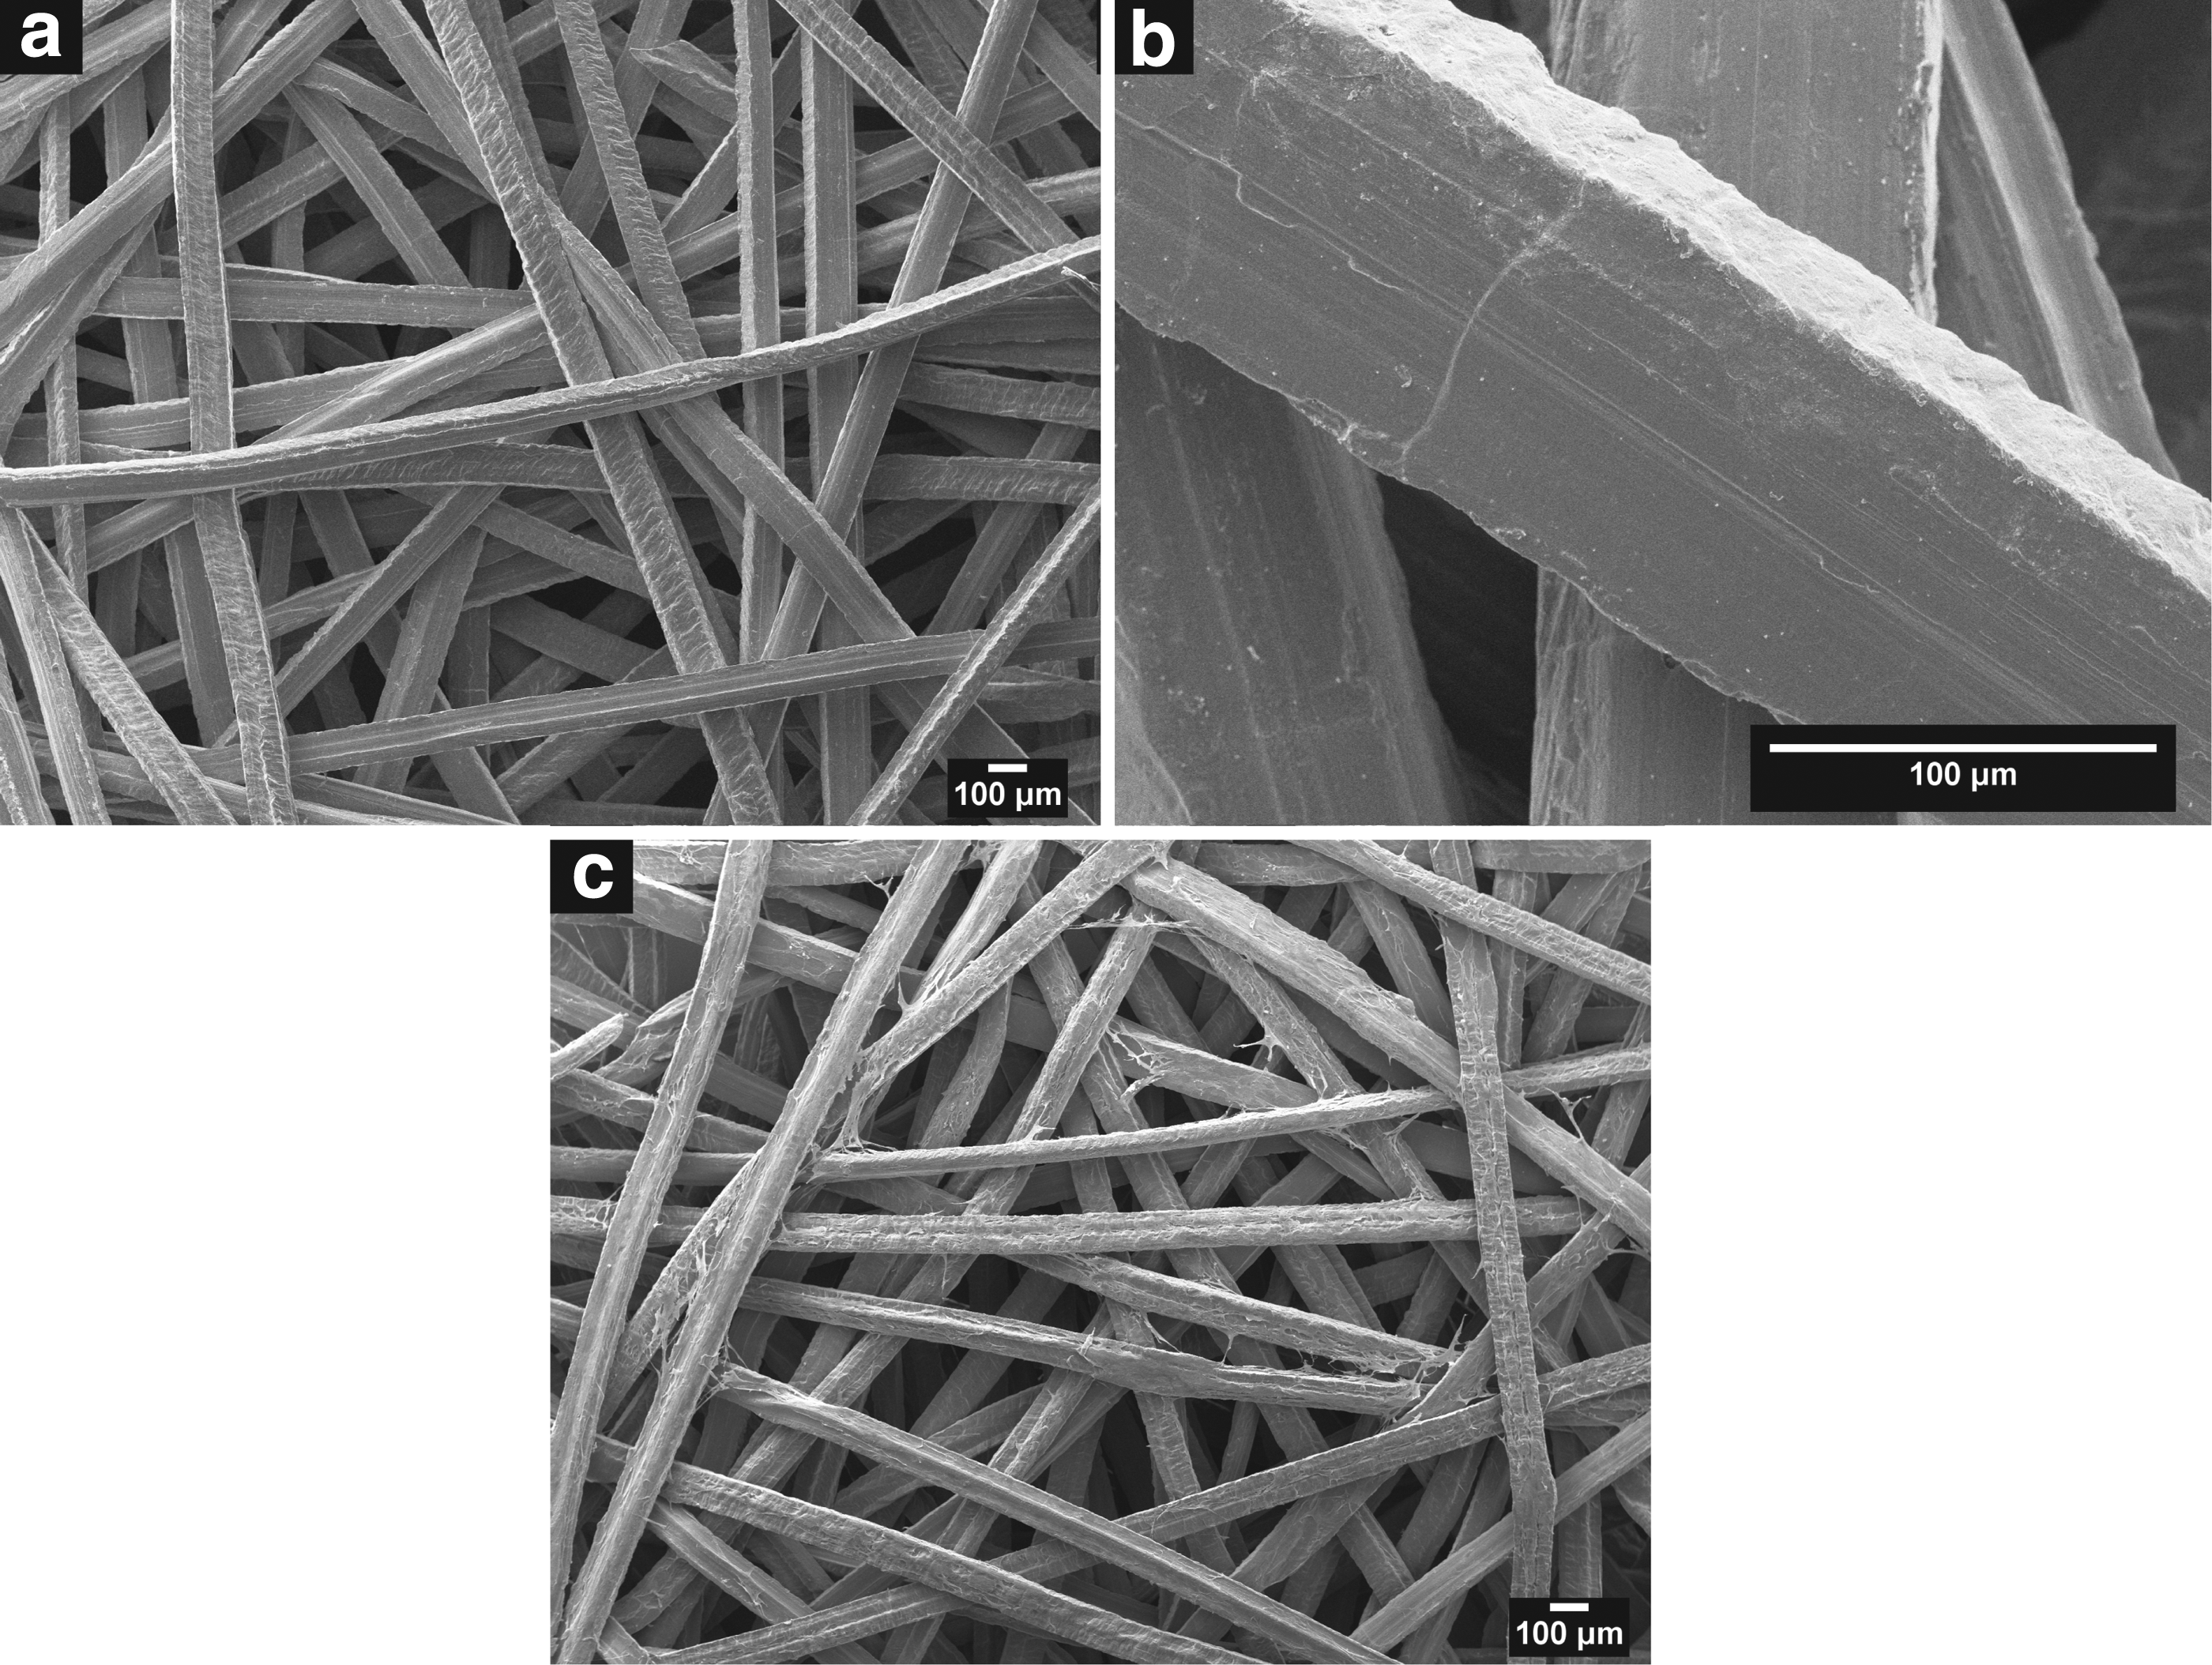
Fiber network plates (Nikko Techno Ltd.) were made from 444, a ferritic stainless steel. The chemical composition in weight percent (wt%) is given in Table 1. Typical fiber distribution and surface morphology are illustrated in the scanning electron micrographs of Figure 2a and b. The fiber networks were manufactured by shaving 80 μm fibers off a 100 μm-thick sheet, hence the rectangular fiber shape shown in Figure 2b. The fibers had an average length of 165 mm and occupied 17 vol%. The fibers were randomly laid to form a sheet and compressed and bonded together at cross-over points by solid-state sintering. Fiber networks were supplied as flat sheets with thicknesses of 1, 2, and 5 mm. Based on our previous study 15 on solid-state sintered 316L fiber networks, it was found that, for a given fiber volume fraction, the network stiffnesses were comparable, irrespective of the thickness of the sheets, suggesting that there were no significant architectural differences between the different sheet thicknesses. For cell culture, discs of 10±0.5 mm diameters were cut out from sheets of 1 mm using a punch press. The discs were ultrasonically cleaned for 15 min in a sequence of acetone, ethanol, and distilled water. Samples were dried at 60°C for 1 h and then sterilized by dry heat at 160°C for 2 h.
Fiber network architecture
The procedure for extracting architectural parameters from the networks by means of X-ray tomography has been described in detail elsewhere.15,43
In this study, two 444 samples were electro-discharge machined from the network plates into cubes of 5 mm. Tomography scans, with a 7 μm spatial resolution, were acquired using a General Electric Phoenix X-ray Nanotom system (GE Sensing & Inspection Technologies GmbH) equipped with a submicron focal spot X-ray source. The samples were rotated at angular increments of 0.25°, through 360°. To avoid edge effects, a subvolume of 4×4×4 mm3 was analyzed.
Segmentation (i.e., identification of the different phases) of the tomography scans was achieved by indicator kriging, 44 which is a local, spatially adaptive thresholding algorithm. During image segmentation, each voxel in the gray-scale tomography scans is assigned to either the fiber phase or the air (interfiber space) phase. The output of the segmentation procedure is a stack of binary images featuring only those two phases. The indicator kriging algorithm was calibrated using the fiber volume fractions obtained from a volumetric technique (weight and sample dimensions) and a density value of 7760 kg·m3 for 444. The reconstructed three-dimensional (3D) fibers were then reduced to their medial axes using a skeletonization algorithm known as 3D medial axis (3DMA) algorithm (currently available from Nihon Visual Science, Inc.).44–46 The medial axis is essentially a network of “one-dimensional” paths and nodes at path intersections. This network is topologically identical to that of the fiber networks. Once the path and nodes are defined, the number of fiber segments (sections between the joints) and the mean segment length can be determined. It should be noted that in the context of the fiber networks, a “fiber” is different from a “fiber segment”; that is, a single fiber can contain a number of fiber segments as fibers meet at intersections. The 3DMA algorithm determines the local fiber orientations by computing the diagonalized inertia tensor of the reconstructured fibers. The three values (eigenvalues) correspond to the moments of inertia about the principal axes, while the eigenvectors (the axes within which the eigenvalues are defined) denote the principal directions of orientation. For a fiber with a rectangular cross-section, the smallest eigenvalue corresponds to the fiber axis and the associated eigenvector provides information on the fiber orientation.
Network elastic properties (plate vibration testing)
The in-plane elastic constants of the network plates were determined by measuring the low-frequency vibrational resonance modes of fiber network plates with free boundaries. Using thin-plate bending theory,
47
the measured mode frequencies, together with the plate dimensions and density, were used to estimate the constants D1, D2, D3, and D4 of the plate (D1 and D3 are associated with bending of the plate middle surface, D2 with Poisson's ratio coupling between the in-plane directions, and D4 with out-of-plane twisting of the middle surface). After using an iterative process
47
to improve the accuracy of these constants, the in-plane elastic constants were determined using the following relationships:
where Ex and Ey are Young's moduli in the x- and y-directions (in-plane directions), respectively; Gxy is the shear modulus in the x-y plane; and vxy and vyx are the in-plane Poisson's ratios. The detailed procedure followed to obtain the elastic constants for fiber network plates can be found elsewhere. 15
The experimental setup used to measure the resonant frequencies involved a loudspeaker driven by a sine-wave generator, an amplifier, and a standard frequency counter. The network plate was supported over the loudspeaker, mounted beneath a large flat surface, on small blocks of soft polymeric foam. It is essential to place these foam supports underneath the nodal lines of the anticipated mode. The frequency (within a range of 50–300 Hz, read from the frequency counter) of the sine wave was carefully tuned until the desired vibration mode was observed. This was visualized by sprinkling powder over the surface of the plate and observing the powder accumulating along the nodal lines (i.e., lines where the amplitude of vibration is zero). Sketches of some of the measured mode shapes are shown in Table 2. Two-millimeter-thick network plates were cut into square (140×140 mm2) and rectangular (140×175 mm2) shapes, with respective densities of 1249 and 1189 kg·m3.
In Vitro Cell Culture
Sourcing and culture of cells
All cell culture reagents were obtained from Invitrogen and all other chemicals from Sigma except where indicated.
HObs (406-05f) were obtained from the European Collection of Cell Cultures. HObs were maintained in growth medium composed of McCoy's medium supplemented with 10% (v/v) fetal bovine serum, 1% (v/v) penicillin–streptomycin (104 U·mL−1 penicillin and 10 g·L−1 streptomycin), and 30 μg·mL−1 of vitamin C (Wako GmbH). Cultures were incubated at 37°C in a humidified atmosphere containing 5% CO2 and the medium was replaced every 2–3 days. When cultures reached 80% confluence, cells were detached from the culture flask using TrypLE® for further subculture. Cells from the fifth passage were used for all experiments.
Fibrin deposition
Thrombin was prepared under aseptic conditions as a 0.025 U·μL−1 solution in Dulbecco's phosphate buffer solution (DPBS) and frozen at −20°C until seeding. Before seeding, the fiber networks were wetted with growth medium (1 h, 20°C). Samples were placed on a sterile, hydrophobic polytetrafluoroethylene (PTFE) filter membrane (Merck Millipore) to prevent droplet spreading. Fibrinogen and thrombin solutions were prepared under aseptic conditions in sterile vials, respectively, to each fibrinogen concentration (3, 5, or 10 g·L−1) or thrombin concentration (0.1 U per mg fibrinogen) using growth medium (37°C). A 50 μL droplet of fibrinogen solution was added to each fiber network sample, followed by a 50 μL droplet of thrombin solution. Medium (100 μL) without fibrinogen or thrombin was added to control networks. The solutions were mixed by pipetting and incubated for 1 h at 37°C in an atmosphere of 5% CO2 in air to allow for fibrinogen lysis and fibrin deposition in the networks.
Cell seeding
Cell seeding was carried out 1 h after fibrin deposition on a sterile PTFE filter membrane (Merck Millipore) to prevent droplet spreading. Cells (5×10⁴ cells per network) were added to the fiber networks in a 100 μL droplet of growth medium and mixed gently by pipetting. The samples were incubated for 4 h at 37°C in an atmosphere of 5% CO2 in air to allow for cell attachment. After this period, samples were transferred to individual wells in a 24-well untreated polystyrene culture plate and growth medium (1 mL) was added to each well. Samples were incubated at 37°C in an atmosphere of 5% CO2 in air for the specified culture times.
Morphology and distribution of fibrin
Optical microscopy, scanning electron microscopy (SEM), and confocal laser scanning microscopy (CLSM) were used to qualitatively investigate fibrin morphology and attachment to the fiber networks. For optical and scanning electron microscopy, samples were washed twice with DPBS, fixed for 1 h at 20°C in 3% (v/v) glutaraldehyde:1% formaldehyde solution in DPBS, washed three times with DPBS, and dehydrated in graded series of ethanol (70%, 85%, 95%, and 100%). Samples were dried using hexamethyldisilazane. For optical microscopy, samples were placed on a glass slide with top face upward and imaged using the dark-field mode on a Leica DMLM upright microscope equipped with an EC3 camera and an Application suite V3 imaging software. The images were processed in Fiji imaging software to change from color to black and white. Then, for SEM imaging, the samples were mounted on aluminum stubs with carbon tape, gold coated (2.4 kV, 90 s), and observed under a Zeiss Evo MA 15 SEM. The numbers and diameters of fibrin nanofibers were approximated in Fiji imaging software using top-view SEM micrographs.
For CLSM imaging of fibrin, fibrinogen solutions for each concentration were supplemented with 1% v/v Alexa Fluor® 594 human fibrinogen solution in growth medium (1 g·L−1). Samples lacking Alexa Fluor® 594 were used as a control for background fluorescence. Samples were washed once with DPBS, fixed with 4% (w/v) formaldehyde in PBS (Affymetrix) (10 min, 20°C), washed twice with DPBS solution, and imaged using a Leica SP2-UV0351/356 confocal microscope after 1 day of culture. Sequential z-stacks were imaged for individual wavelengths and reconstructed as max z-projections using Fiji imaging software. Z-projections for each wavelength were overlaid and scale bars were added to produce the final image.
Morphology and distribution of HObs
CLSM of HObs enabled observation of cell morphology and distribution in the fiber networks. Samples were washed once with DPBS, fixed with 4% (w/v) formaldehyde in PBS (Affymetrix) (10 min, 20°C), washed twice with DPBS solution, and permeabilized (10 min, 6°C) in pH 7.2 buffer composed of sucrose (10.3 g), sodium chloride (0.292 g), magnesium chloride (0.06 g), 4-(2-hydroxyethyl)-1-piperazineethanesulfonic acid (HEPES) buffer (0.476 g), and Triton-X (0.5 mL) in distilled water (100 mL). Samples were incubated with 5% (v/v) goat serum albumin in DPBS (30 min, 20°C) to block nonspecific binding, washed twice with DPBS, and incubated with Alexa Fluor 488® phalloidin (1 h, 20°C), using a 1:100 dilution in DPBS. Samples were washed three times with 0.05% tween-20 in DPBS, mounted with slowfade® gold antifade mountant containing 4′,6-diamidino-2-phenylindole (DAPI), and imaged using a Leica SP2-UV0351/356 confocal microscope. CLSM images were analyzed in Fiji as mentioned before to a maximum depth of 155 μm.
Cell proliferation and metabolic activity
The CyQuant® assay for deoxyribonucleic acid (DNA) was used according to the manufacturer's instructions to determine cell number at each time point (days 1, 3, and 7). After aspirating the medium, the samples (n=3) were washed once with DPBS and frozen at −80°C until measurement. After thawing samples, CyQuant® lysis solution containing ribonuclease (1.35 Kunitz U·mL−1) was added to each sample and the solution was agitated for 1 h. CyQuant dye was added to 50 μL aliquots of the cell lysate and the DNA content was measured fluorimetrically (excitation 485 nm, emission 520 nm) on a Fluostar Optima multidetection microplate reader (BMG Labtech). A reference standard curve of known cell number versus fluorescence was prepared for each assay, using cell aliquots that were counted and frozen on the day of seeding and stored at −80°C, in order to convert the measured fluorescence values into cell numbers.
The alamarBlue® assay (Serotec) was used to measure cell viability by quantification of intracellular metabolic activity at each time point (days 1, 3, and 7). Samples (n=3) were incubated for 4 h with fresh growth medium (37°C) supplemented with 10% (v/v) alamarBlue® reagent. Following incubation, 100 μL of medium from each well was transferred in triplicate to a black 96-well microplate. Fluorescence (excitation 544 nm, emission 590 nm) was measured using the Fluostar Optima microplate reader. The percent reduction of alamarBlue® was calculated using the following formula
48
:
where
Statistical analysis
Averages of three independent experiments, with three tested samples per fibrin concentration, were expressed as the arithmetic mean±standard deviation. Data were analyzed for homogeneity of variance with Levene's test. Data with homogenous variance were analyzed for statistical significance by two-way analysis of variance, followed by Tukey's post-hoc test for multiple comparisons based on concentration and time. Data without homogenous variance were analyzed for statistical significance using the Games-Howell post-hoc test. Differences were considered statistically significant at p-values of <0.05.
Results
Network architecture
Figure 3a shows a tomographic reconstruction of the 444 network. By reducing the fibers to their medial axes (Fig. 3b), the local fiber orientations and other architectural characteristics, such as the fiber segment lengths, can be extracted. The results obtained from both samples analyzed are summarized in Table 3. The fiber inclination angle θ stands for the angle between the fiber axis and the through-thickness direction. Figure 3c shows a histogram of the fiber inclination angle showing the probability
for a fiber segment to lie at an angle of θi, where

As determined using the volumetric method (see “Fiber network architecture” subsection).
Network elastic properties
The measured resonant frequencies for rectangular and square network plates are shown in Table 2. The resonant frequencies for the first three mode shapes (Table 2), obtained using a rectangular plate, lead to first estimates of D1, D3, and D4. To estimate D2, the square plate (with adjusted aspect ratio 47 ) was used to observe the “X” and “O” (ring) vibration mode frequencies (mode Nos. 4 and 5 in Table 2). The accuracy of these first estimates of D1, D2, D3, and D4 was improved using an iterative method, 47 employing numerical calculations of plate frequencies based on the Rayleigh-Ritz method. Since there should be no preferred in-plane direction in the fiber network material, this iterative process was carried out assuming in-plane transverse isotropy. The final iterated values of the four constants were used to obtain predictions of mode frequencies for the two shapes of plate (only the dimensions were changed). This resulted in considerable redundancy in the comparison. Many more modes, apart from the ones shown in Table 2, were examined in order to get a best fit of the plate's four bending constants to the pattern of measured natural frequencies. It can be seen, for the low-frequency modes of both plate shapes in Table 2, that the general pattern of measured frequencies fits the predictions well enough that one can have some confidence in the fitted bending constants, interpreted in an averaged sense over the areas of both plates and over all directions of wave propagation. The iterated and adjusted final D1–D4 values were related to the in-plane engineering elastic constants (Ex, Ey, v xy , v yx , and Gxy) via Equation (1). The elastic constants are summarized in Table 4. It can be seen that the moduli values are similar in the in-plane directions, suggesting that the network exhibits transverse isotropy.
Morphology and distribution of fibrin
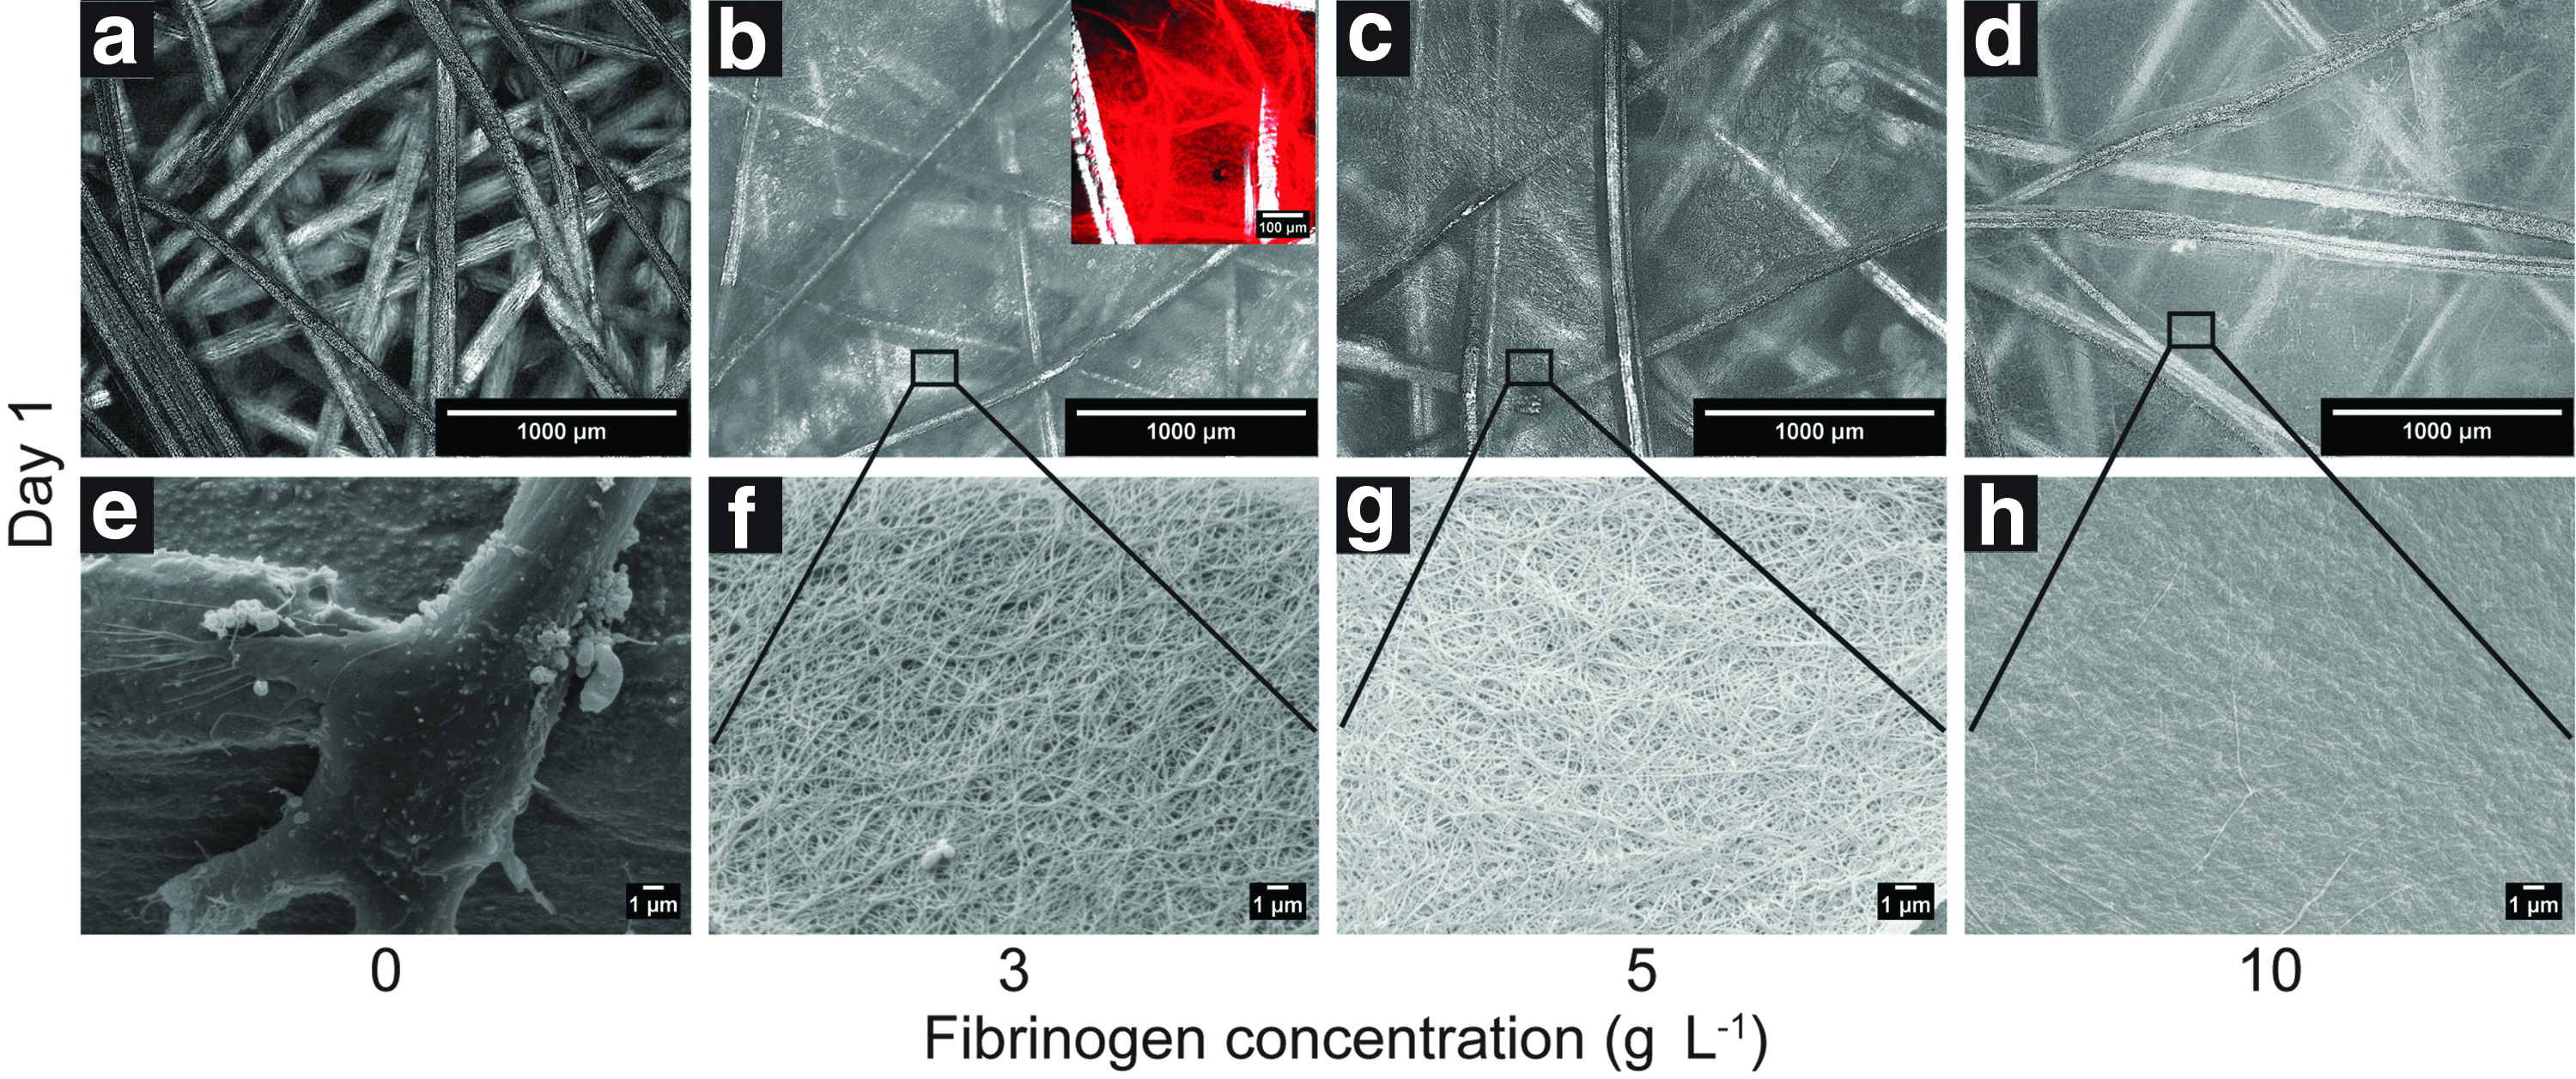
Figure 4a–c shows optical scanning electron images of the top surfaces of stainless steel fiber networks containing fibrin. It can be seen that fibrin (gray multishaded material between and on top of metal fibers) was deposited over the surface of the fiber networks for all concentrations. No observable differences between the fibrin concentrations were noticed. The nanofibrous composition of this material was confirmed by high-magnification SEM images, such as those in Figure 4f–h. An estimate of the average diameter of the fibrin nanofibers, obtained from such images, was ∼90 nm (over 50 fibers per concentration were measured) for all fibrinogen concentrations. While the diameter of the nanofibers remained constant with increasing fibrinogen concentration, the number of fibrin nanofibers per unit of surface area increased, contributing to a decrease in the pore space between the fibrin nanofibers, qualitatively observed using SEM images, such as those illustrated in Figure 4f–h.
Optical
The deposition of fibrin, rather than cell deposition of collagen, was confirmed by qualitative analysis of CLSM images, similar to the inset in Figure 4b, showing the top view of a fiber network containing fibrin supplemented with 1% fluorescently labeled fibrin. Fibrin deposition (red fluorescence) was observed over and between the metal fibers (observed as gray in reflectance mode).
Morphology and distribution of HObs
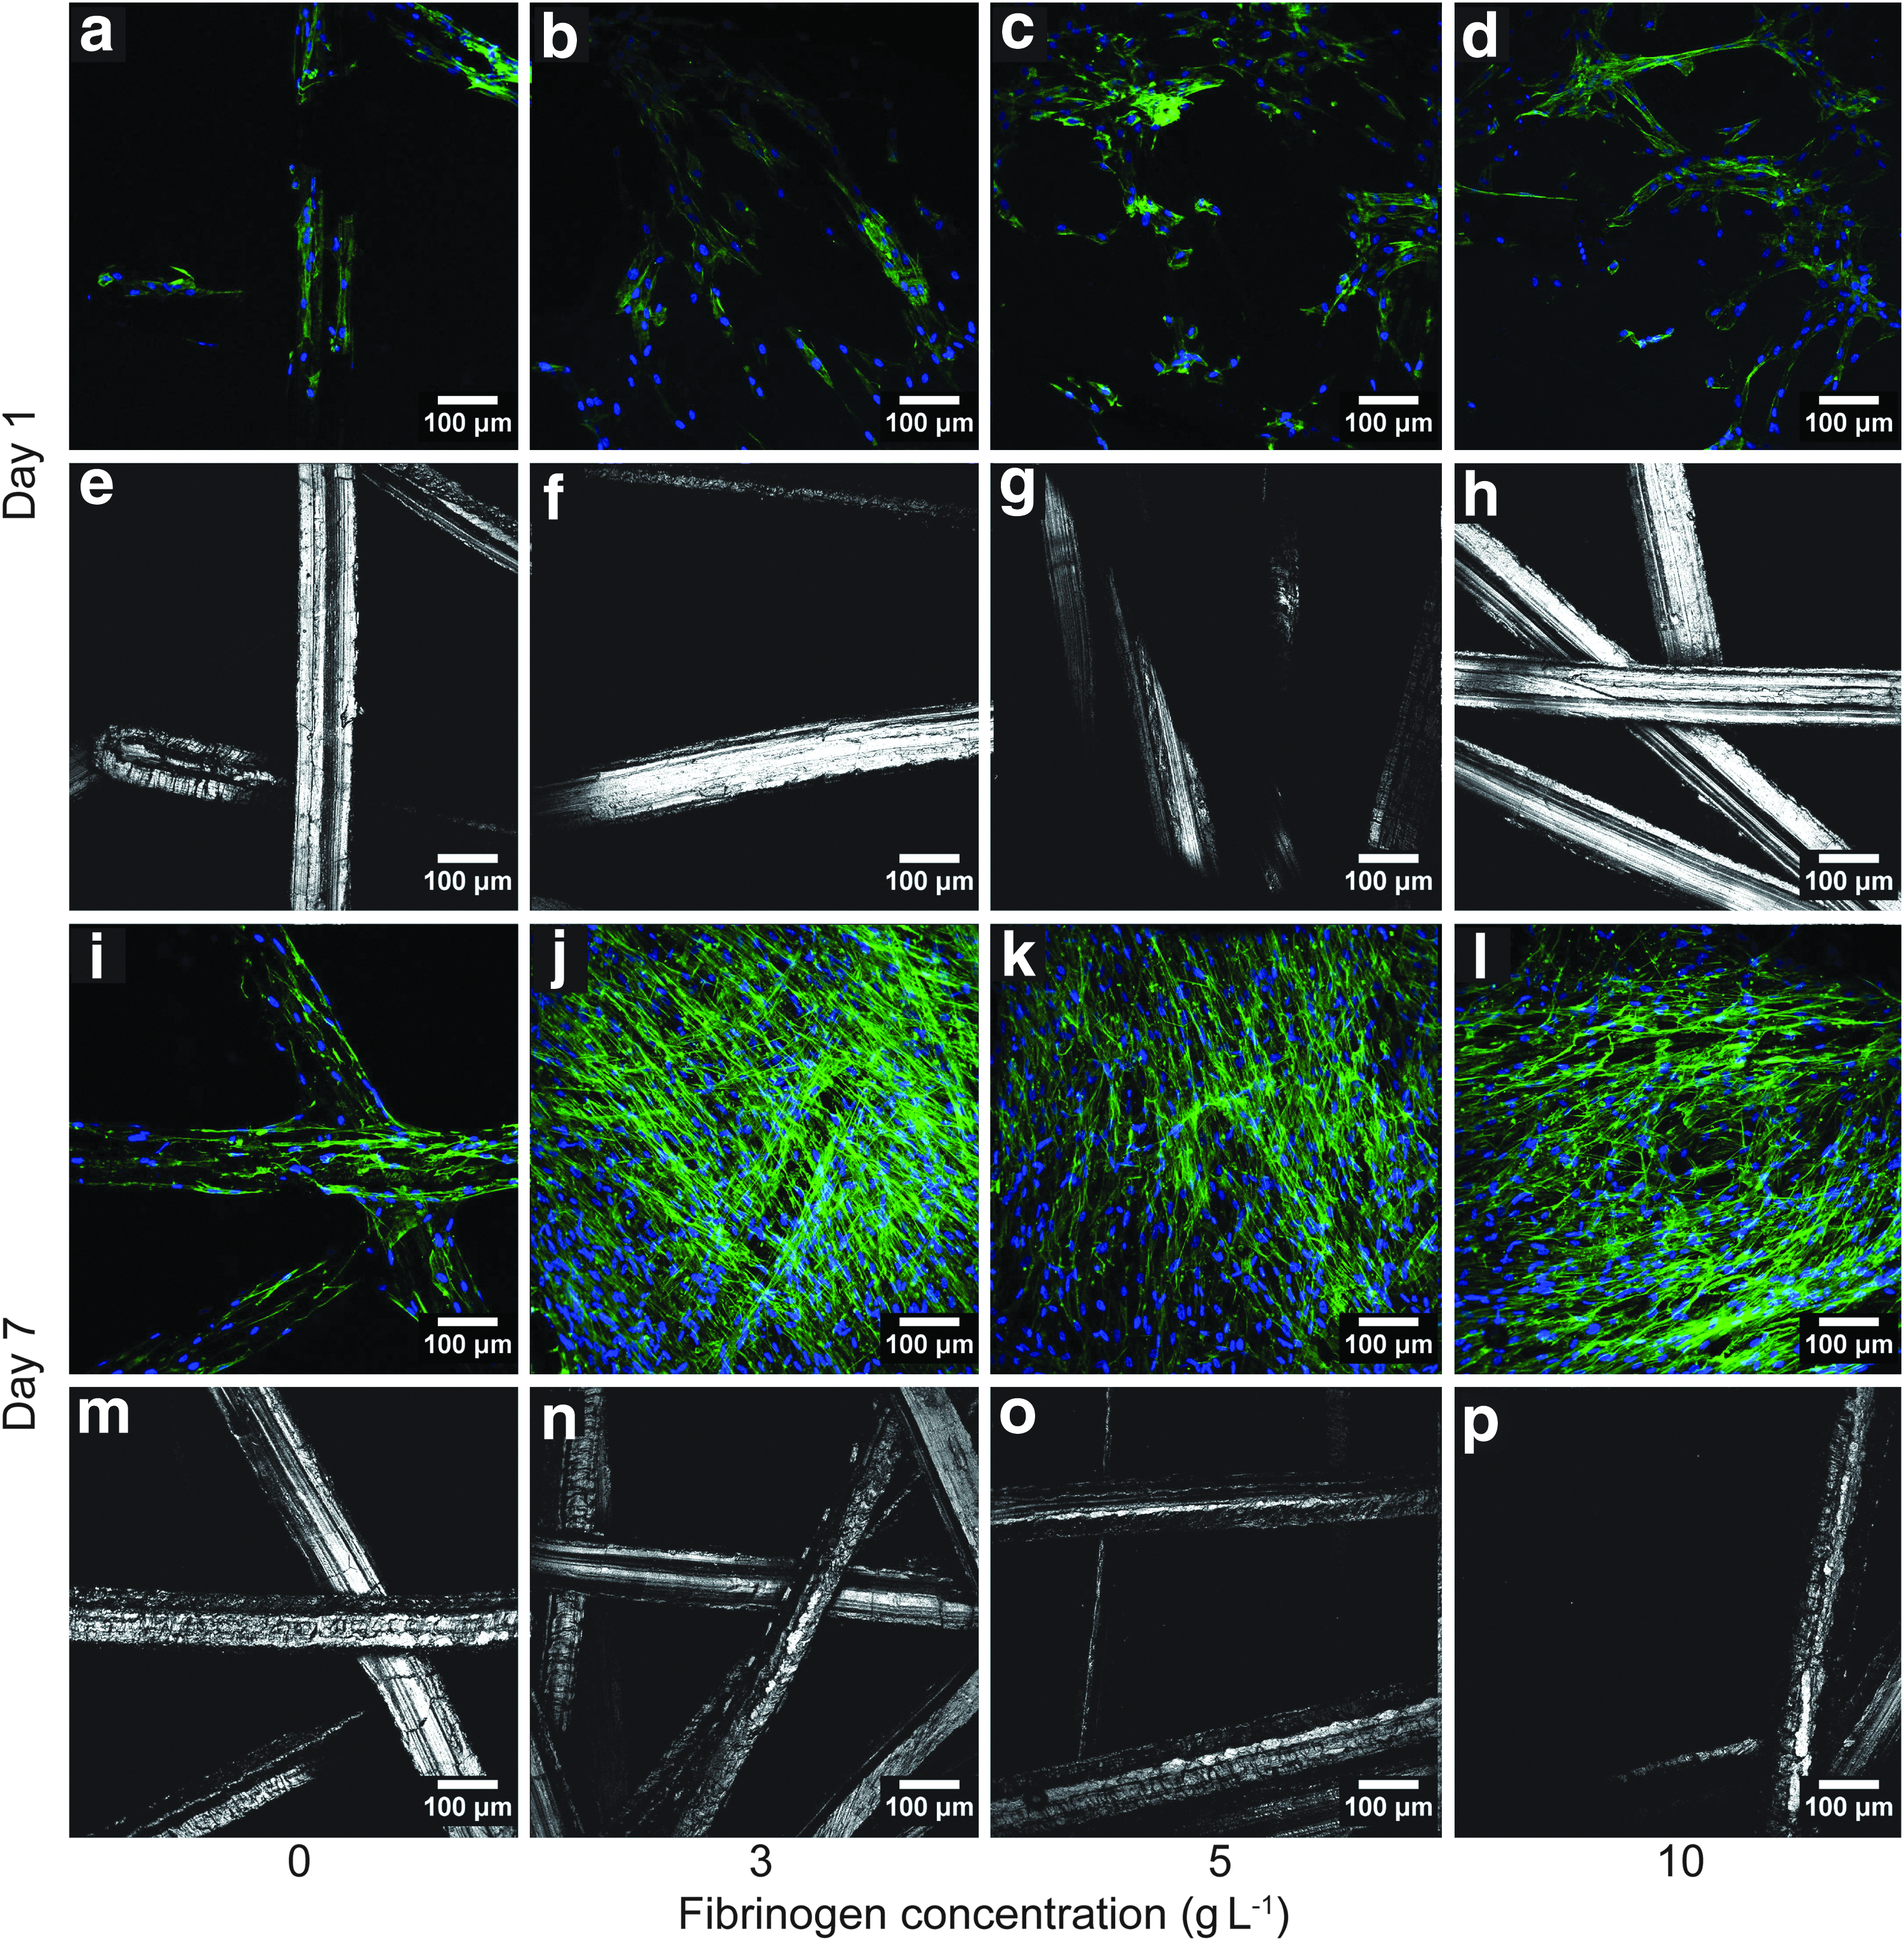
Figure 5 shows representative fluorescence images of HObs following 1 and 7 days of culture. Comparison of control networks without fibrin (Fig. 5a, e, i, m) and fibrin-containing networks (Fig. 5b–d, f–h, j–l, n–p) indicated noticeable differences in the HObs' attachment pattern. For control samples without fibrin, cells with well-spread morphologies were observed only on the metallic fiber surfaces and junctions as shown in Figure 5a, e, i, and m. This association of the cells solely with the metallic fibers for the control samples continued throughout the duration of the study as indicated by Figure 5i. In contrast, all of the fibrin-containing samples showed cell attachment over and between the fibers throughout the duration of the study (Fig. 5b–d, f–h, j–l, n–p). For all samples, the observed number of HObs increased between days 1 and 7.
CLSM images showing top views of stainless steel fiber networks following fibrin deposition from
Representative SEM images of the top surface of the fiber networks, following fibrin deposition and cell culture for 7 days, are shown in Figure 6. For all fibrin-containing samples, fibrin nanofibers, confirmed by fluorescence images (see inset in Fig. 4b), were observed beneath the cell bodies and cytoplasmic projections in high-magnification images (Fig. 6).
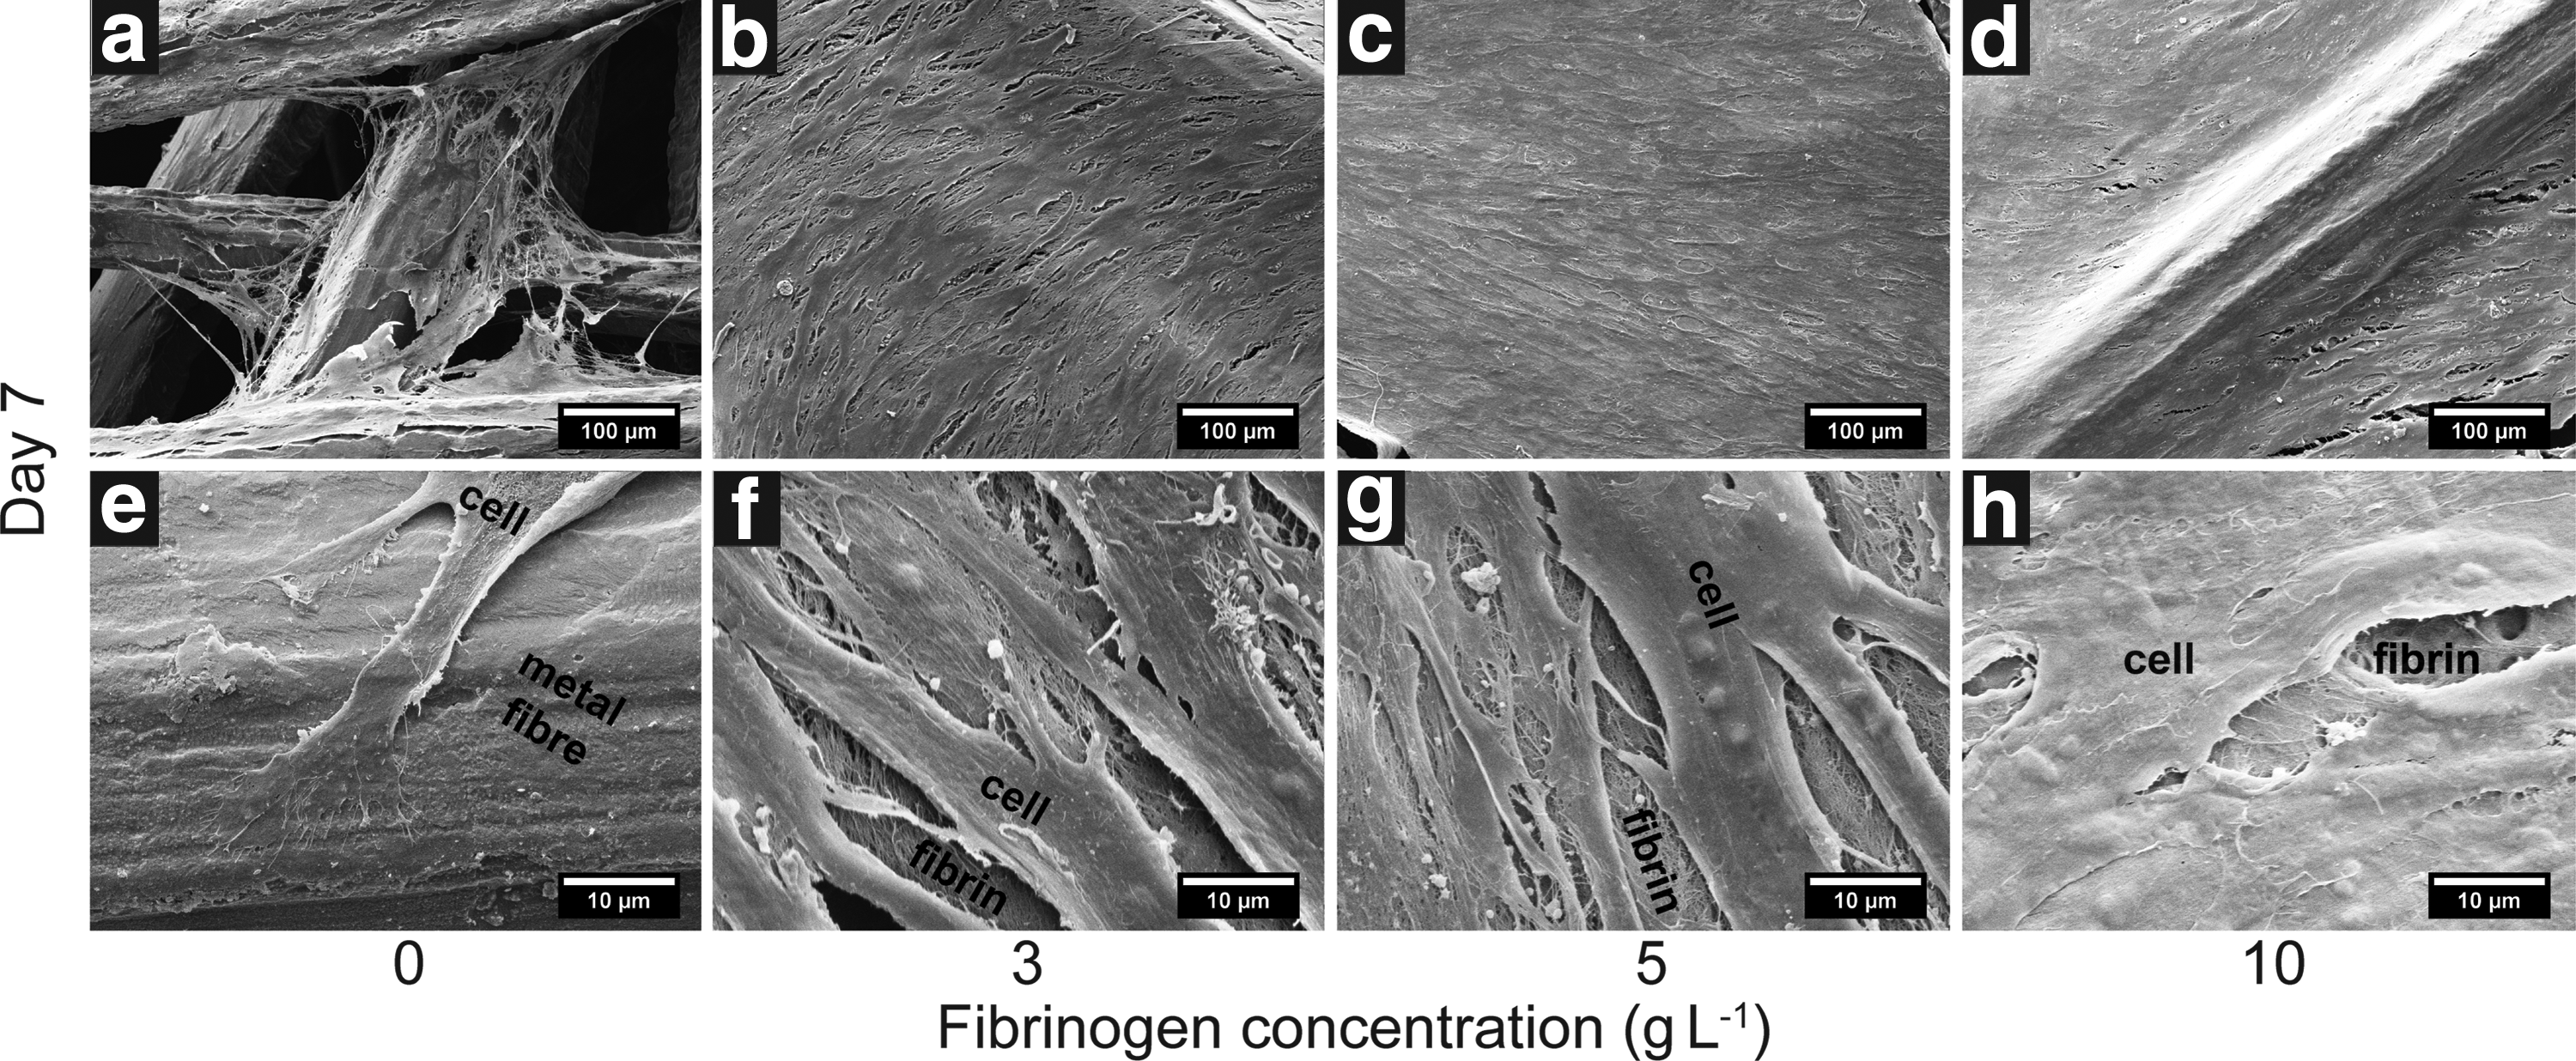
SEM images showing top views of stainless steel fiber networks following fibrin deposition from
Cell proliferation and metabolic activity
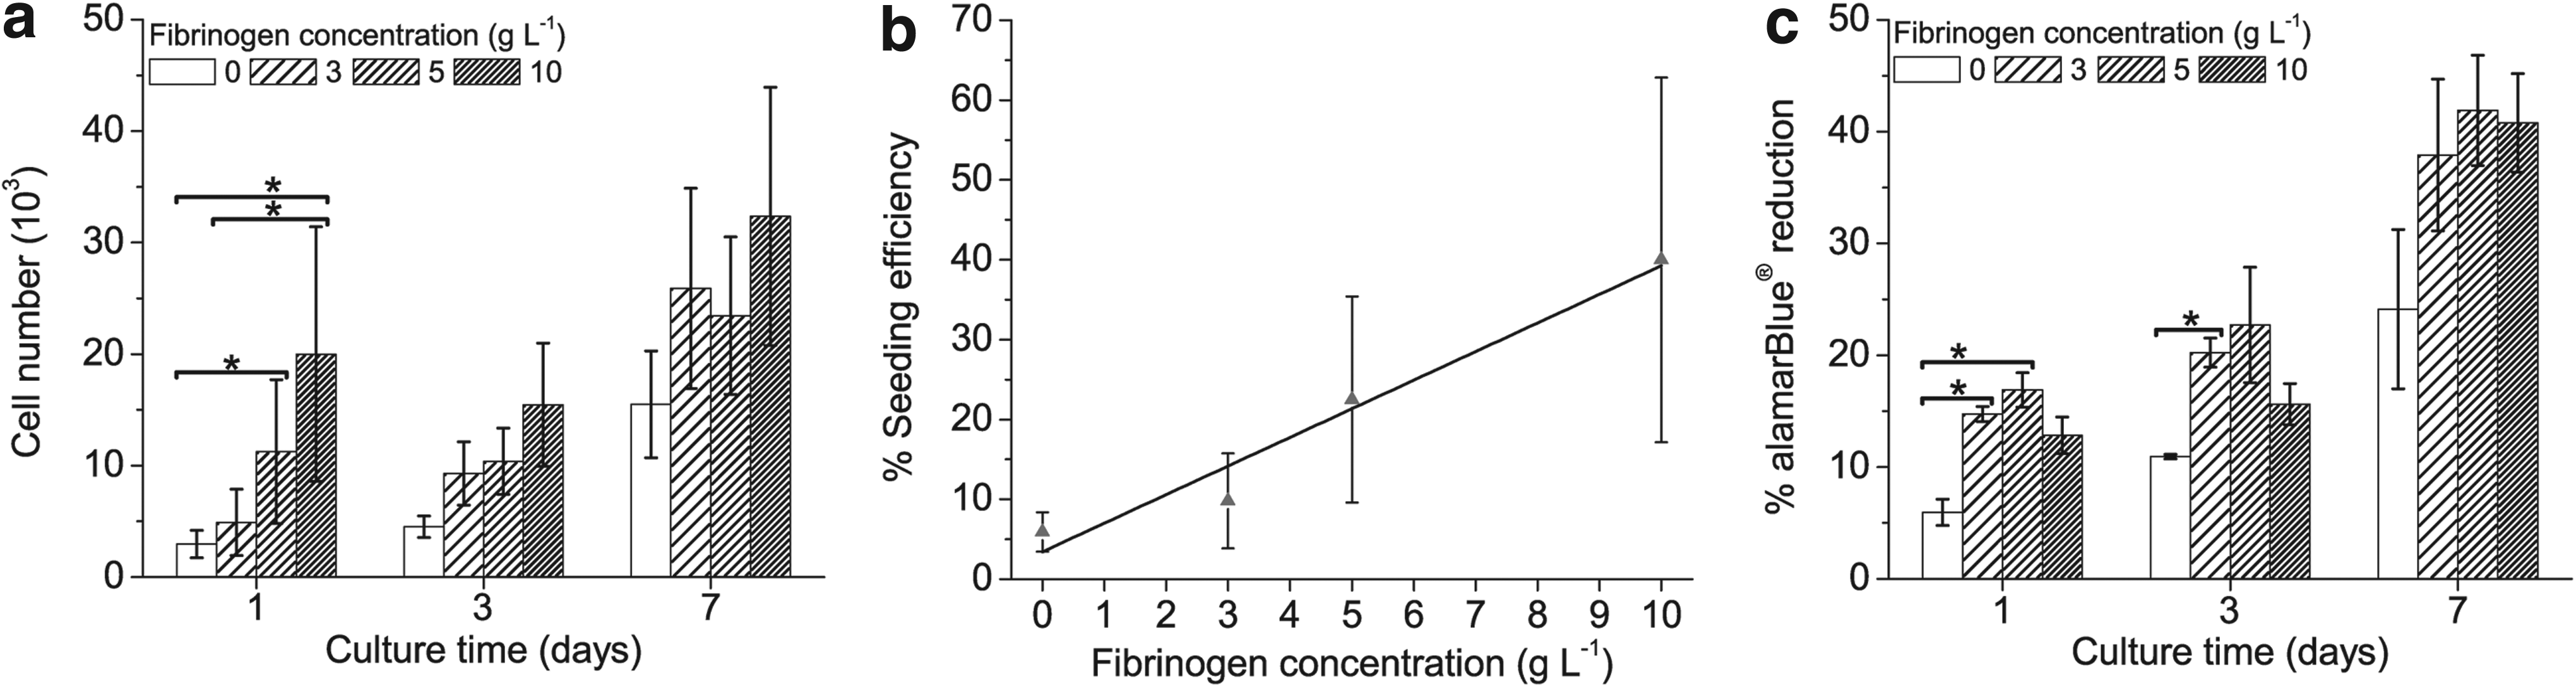
Figure 7a shows the number of HObs measured by CyQuant DNA analysis of the samples following 1, 3, and 7 days of culture. Significantly higher cell numbers were measured on the supraphysiological (10 g·L−1) and high physiological (5 g·L−1) concentrations of fibrin compared with networks with control samples without fibrin. Further, significantly higher numbers of cells were measured on supraphysiological concentrations compared with low physiological concentrations. For all networks, there was a significant increase in the numbers of HObs between 1 and 7 days of culture. Figure 7b shows the number of cells attached to each sample as a percent of the initial seeding concentration. The results show a significant positive correlation between fibrin concentration and the percent of HObs seeded on the networks.
CyQuant® analysis for deoxyribonucleic acid (DNA) of HObs seeded onto fibrin-coated fiber networks showing
Figure 7c shows the metabolic activity of HObs as measured by the reduction of alamarBlue® reagent. Cells cultured on physiological (3 and 5 g·L−1) concentrations had significantly higher metabolic activity than control samples without fibrin after 1 day in culture. No significant differences were measured between cells cultured on supraphysiological concentrations and other concentrations. After 3 days of culture, HObs cultured on low physiological concentrations (3 g·L−1) also had significantly higher metabolic activity compared with the control samples, while supraphysiological and high physiological concentrations were statistically similar to control samples.
Discussion
The current work presents the first study concerning the effect of fibrin nanofiber deposition on in vitro responses of HObs to porous networks composed of 444 ferromagnetic stainless steel fibers. These ferromagnetic fiber networks have been proposed as a bone regeneration scaffold designed to induce in vivo modeling of in-growing periprosthetic bone by the application of an external magnetic field of clinical magnitude. The present study builds upon earlier work with these stainless steel grades in fully dense form 8 and as fiber networks.9,11 These earlier studies established the suitability of these fiber networks for in vitro cell culture with a range of different cell types, including human mesenchymal stem cells and osteoblasts. It was observed that cell attachment at early time points was associated solely with the surfaces and junctions of the metal fibers.9,11 Similar findings were observed in the networks used in the present study as illustrated in Figure 2c. However, theoretically the optimal region for transduction of strain to cells in vivo lies within interfiber spaces as depicted in Figure 1a. 2
In this study, it is proposed that the deposition of fibrin at early time points, either as the result of physiological processes or clinical application, would facilitate cell attachment in interfiber regions. This hypothesis was investigated using in vitro cultures of HObs. The effect of fibrinogen concentration on the cell responses, in terms of morphology, proliferation, and metabolic activity, was considered with a focus on physiological levels as the study aimed to create an in vitro model of the clinical application of these fiber networks as an in vivo implant coating.
The network employed contains 17 vol% of 444 ferritic stainless steel fibers. As illustrated in Figure 2a, the interfiber spaces are of the order of 400–500 μm, which are considered suitable for allowing the ingress of cells and nutrients and subsequent vascularization during bone formation. 49 The network architecture and fiber volume fraction are important parameters because they affect the spatial distribution of the fibrin within the network. Architecture is also important for the network-mediated cellular responses and subsequent bone formation. Architecture characterization showed that the majority of the fibers are lying in-plane (Table 3). In addition, the mean segment length (distance between the joints) was estimated to be 425±6 μm, as shown in Table 3. Using the equivalent fiber diameter based on the fiber cross-sectional area (80×100 μm2), it follows that the fiber segment aspect ratio (length/diameter) is ∼4.25.** Such a value for the fiber segment aspect ratio is relatively low; ideally, higher aspect ratio values are desirable as Figure 1b shows that networks with relatively high fiber segment aspect ratios (>10) would be more readily deformable by the application of a magnetic field.
The in-plane Young's moduli of the 83% porous networks are a few GPa (∼5 GPa), suggesting that the networks have moduli in the same range as other porous metallic coatings used commercially in prosthetic implants. For example, Regenerex™ (Biomet), which is a titanium coating, has a stiffness of ∼1.6 GPa with 67% porosity50,51 whereas Trabecular Metal™ (Zimmer), which is made of porous tantalum, has a Young's modulus of ∼3 GPa with porosity of 75–85%.50,52 In the case of the fiber networks, it is important to note that the stiffness of the fiber material, the fiber volume fraction, the fiber orientation distribution, and the fiber segment aspect ratio are relevant to the magnitude of the Young's modulus values. For instance, the through-thickness Young's modulus of these networks is expected to be significantly lower due to the fact the fibers are lying in-plane and therefore would offer very low resistance to vertical displacement. Also, a higher fiber segment aspect ratio, which is desirable for generating high strains to in-growing bone tissue, would make the networks more readily deformable, resulting in a decrease in stiffness. The corollary is that if a network of this type is to be employed for such an application, all these parameters need to be controlled and optimized.
The cell culture studies were designed in consideration of the in vivo conditions for application of the fiber network as an orthopedic implant coating. In keeping with this approach, one side of the networks was exposed to fibrin and cell attachment as the opposite side would be sintered to the prosthesis surface. Consistent with an in vitro model of acute inflammatory responses, fibrin deposition was carried out prior to HOb infiltration. The study compares fibrin deposition from physiological fibrinogen concentrations between 1.5 and 5 g·L−1 as an in vitro model of in vivo inflammatory responses.35–37 A supraphysiological (10 g·L−1) concentration was also included as the majority of studies on this topic have focused on concentrations higher than 5 g·L−1.38,39 Deposition of fibrin, with similar nanometer-scale diameters, was observed throughout the thickness of the fiber networks in both SEM and CLSM images (Figs. 5 and 6). The general observation of decreased nanofiber pore sizes agreed well with the literature reports on fibrin deposition. 41
Cell attachment of HObs was observed over the surface of the fiber networks and within interfiber spaces in both CLSM and SEM images (Figs. 5 and 6). Cell proliferation was evident between days 1 and 7 for all samples. However, while the cells in the fibrin-containing samples proliferated between the fibers (Fig. 5b–d, f–h, j–l, n–p), without fibrin, HOb attachment and proliferation was confined to the metal surfaces (Fig. 5a, e, i, m). Cell attachment was similar for all fibrinogen concentrations, qualitatively observed by CLSM. For all time-points and fibrin-containing samples, HObs attached onto the fibrin and metal fibers, spreading into morphologies typical of osteoblasts cultured in vitro, with numerous cytoplasmic projections visible at high magnifications (Fig. 6f–h). In contrast, cell attachment in control samples was confined to the surface of the metal fibers and junctions as the HObs required the support of the underlying metal fibers (Fig. 6a, e).
The effects of fibrin deposition on the ability of HObs to proliferate and metabolize within the fiber networks were dependent on concentration and culture time. Cells on scaffolds with supraphysiological fibrinogen concentrations had similar metabolic activities than those with physiological concentrations despite significantly higher cell numbers. These results support earlier reports38,39,41 of decreasing cell activities with increasing fibrinogen concentrations. Considering physiological concentrations, the higher fibrinogen concentration (5 g·L−1) resulted in significantly higher cell numbers with a similar significant increase in metabolic activities. The lower fibrinogen concentration (3 g·L−1) resulted in greater cell metabolic activity to control samples of similar cell numbers. Generally, increased fibrin deposition contributed to increased cell numbers but decreased cell metabolic activities. A potential explanation for this inverse relationship between cell activity and fibrinogen concentration could be the decreased pore sizes in supraphysiological concentrations as suggested in a previous study. 41 As indicated by Vavken et al., 41 this inverse relationship could contribute to inhibition of medium and nutrient transfer to cells within the fibrin. This hypothesis provides the foundation for further studies in this area.
Conclusions
The results of the current study demonstrate that deposition of fibrin nanofibers significantly affects the responses of HObs seeded into porous fiber networks composed of 444 ferritic stainless steel. Such “magneto-active” networks have been proposed as surface layers on prosthetic implants. The local fiber orientations and other architectural characteristics, such as the fiber segment lengths, were measured using X-ray nano-tomography. The measured Young's moduli were independent of the in-plane direction, suggesting that the network exhibits transverse isotropy. In terms of magnitude, the stiffness values were comparable with those of porous metallic coatings used commercially.
Attachment of HObs was observed over the fiber surfaces and within the interfiber spaces in fibrin-containing networks. Fibrin deposition influenced the seeding and metabolic activity of HObs in a concentration-dependant manner. While seeding efficiency increased with fibrinogen concentration, cell metabolic activities decreased, suggesting a negative correlation between cell viability and fibrinogen concentration. The results recommend physiological fibrinogen concentrations for promoting early cell attachment within the interfiber spaces of porous implant coatings.
Footnotes
Acknowledgments
This research was supported by the European Research Council (Grant No. 240446). Financial support for R.A.B. was provided via the National Institute for Health Research. The authors would like to thank Ms. Anne Bahnweg for assistance with SEM and Dr. Jeremy Skepper for assistance with CLSM.
Disclosure Statement
No competing financial interests exist.
References
Supplementary Material
Please find the following supplemental material available below.
For Open Access articles published under a Creative Commons License, all supplemental material carries the same license as the article it is associated with.
For non-Open Access articles published, all supplemental material carries a non-exclusive license, and permission requests for re-use of supplemental material or any part of supplemental material shall be sent directly to the copyright owner as specified in the copyright notice associated with the article.