




Abstract
We previously found that the combination of an autologous bone mesenchymal stem cell-derived extracellular matrix (aBMSC-dECM) scaffold with bone marrow stimulation could enhance hyaline cartilage regeneration. We suspected that chondrogenic differentiation could be induced by the aBMSC-dECM scaffold. This study aimed to investigate whether aBMSC-dECM scaffolds could promote chondrogenic differentiation without exogenous growth factors. BMSCs were seeded on aBMSC-dECM scaffolds and cultured in vitro with or without transforming growth factor-β3 (E+ or E− group). Atelocollagen scaffolds were used as controls (C+ or C− group). The chondrogenic differentiation was evaluated by histological, biochemical, and real-time polymerase chain reaction assays. After 3 weeks, cartilage-like tissue with a homogeneous structure, a high cartilaginous matrix content (proteoglycan and type II collagen), and high expression levels of cartilage-associated genes (COL2A1, ACAN, and SOX9) were observed in the E+, E−, and C+ groups. In addition, BMSCs in each scaffold (E group or C group) were preconditioned with chondrogenic media in vitro for 1 week, and then implanted in the backs of nude mice for 3 weeks. Three weeks later, cartilage matrix formation (proteoglycan and type II collagen) was achieved only in the E group, confirmed by safranin O staining and immunohistochemical staining for type II collagen. Taken together, these results indicate that aBMSC-dECM scaffolds could induce chondrogenic differentiation. Thus, they could be successful candidate scaffolds for cartilage tissue engineering.
Introduction
T
It is well understood that autologous scaffolds can effectively overcome these disadvantages and largely improve the quality of cartilage tissue engineering owing to their enhanced safety and efficacy.8,9 For example, Chen and colleagues used poly (D,L-lactic-co-glycolic) acid (PLGA) mesh as a template to fabricate autologous MSC-derived extracellular matrix (ECM) scaffolds and found that these promoted chondrogenic differentiation without any exogenous growth factors.8,10 Moreover, we developed a novel autologous BMSC-derived ECM (aBMSC-dECM) scaffold without any template and found that implantation of this scaffold into osteochondral defect sites following BMS in a rabbit model enhanced hyaline cartilage regeneration.11,12 Furthermore, previous studies have indicated that the chondrogenic potentiality of human synovium-derived stem cells could be achieved on a decellularized stem cell matrix 13 and that specific cell-derived ECM scaffolds could provide various signals to control the chondrogenic differentiation of MSCs. 10 However, little is known regarding whether the aBMSC-dECM scaffold itself might induce chondrogenic differentiation. In this study, in vitro culture and in vivo implantation were performed to further determine whether the aBMSC-dECM scaffold could promote chondrogenic differentiation of BMSCs without any exogenous growth factors.
Materials and Methods
Isolation and culture of BMSCs
The use of laboratory animals was approved by the Institutional Animal Experiment Committee of Nanjing Medical University. The experimental protocol met the guidelines of the National Institutes of Health. In our study, five New Zealand white rabbits (aged 2 weeks) were euthanatized using an overdose injection of pentobarbital, then the BMSCs were isolated and cultured as reported previously. 14 Briefly, the bone marrow was flushed from the tibias and femurs using phosphate-buffered saline (PBS), and mononuclear cells (MNCs) were obtained using density gradient centrifugation with Lymphoprep (Axis-Shield, Oslo, Norway) at 800 g for 20 min. Then, the cell fractions were resuspended with Dulbecco's modified Eagle's medium (DMEM; Gibco, Grand Island, NY), which contains 10% fetal bovine serum (FBS; Gibco), 100 U/mL penicillin, and 100 μg/mL streptomycin (Gibco). The isolated MNCs were then seeded (density: 1.0 × 10⁵ cells/cm2) and cultured (37°C, in a 5% CO2 atmosphere, 95% humidity). Forty-eight hours later, the nonadherent cells were removed, and the adherent BMSCs were further cultured to grow into an aBMSC-dECM membrane. During the culture period, certain BMSCs (passage 1) were collected for cell seeding. Therefore, these cells were pooled, aliquoted, and frozen in DMEM containing 20% FBS and 10% dimethyl sulfoxide.
Preparation of aBMSC-dECM scaffolds
The aBMSC-dECM scaffolds were prepared according to a previous description.
12
In brief, to stimulate ECM deposition, when the primary BMSCs reached a confluence of 70–80%, 50 μg/mL
In vitro culture of cell–scaffold constructs
Shortly after the preparation of the aBMSC-dECM scaffolds, autologous BMSC aliquots were thawed and subcultured. The scaffolds were sterilized in 75% ethanol (10 h), washed with PBS (thrice), and immersed overnight in culture media to remove all traces of ethanol. Then, the BMSC suspensions (passage 3; cell density: 3 × 10⁶/mL) were dynamically seeded on the scaffolds over 90 min with a nutator, as reported previously. 15 Atelocollagen scaffolds (Koraku, Tokyo, Japan) were used as experimental controls.
After cell seeding, the cell–scaffold constructs were transferred to 6-well plates and cultured in vitro. The in vitro study comprised four groups (n = 18 each): (1) C+, BMSC-atelocollagen scaffold constructs cultured in a chondrogenic-defined medium (DMEM supplemented with insulin–transferrin–selenium mixture, 100 nM dexamethasone, 50 μg/mL
In vivo implantation of cell–scaffold constructs
For the in vivo study, the cell–scaffold constructs were prepared as above, and then cultured in vitro in a chondrogenic-defined medium without TGF-β3 for 1 week (E and C groups). Six-week-old male nude mice (n = 12 per group) were anesthetized with chloral hydrate solution (0.4 mg/g). Under sterile conditions, the backs of the mice were incised, and four constructs from the same group were implanted into the subcutaneous tissue. Four mice (carrying four constructs each) of each group were sacrificed to assess chondrogenic differentiation at 1, 2, and 3 weeks after implantation. 16
Gross observation and volume measurement
The gross morphology of in vitro and in vivo constructs was assessed by shape and color. Construct firmness was tested by a pinch test. The volumes of in vitro and in vivo constructs were measured from three-dimensional images obtained by a CCD camera that was equipped with a previously described computer vision system.16,17
Histological analysis
The in vitro and in vivo constructs were evaluated by histological staining with safranin O and von Kossa and by immunohistochemical analysis of type II collagen expression. In brief, the constructs were fixed with 4% formaldehyde for 24 h, dehydrated and embedded in paraffin, sectioned at 4-μm thickness, and then stained with safranin O and von Kossa. For von Kossa staining, the sections were incubated with 3% silver nitrate solution under ultraviolet light for 1 h, and then counterstained with toluidine blue. For immunohistochemical analysis, the sections were sequentially treated with 3% H2O2 and proteinase K, and then were incubated with a mouse monoclonal antibody against rabbit type II collagen antibody (1:100; Acris, Herford, Germany) for 1.5 h at ambient temperature. Then, the sections were incubated with a biotinylated secondary antibody against mouse IgG (1:200; Maixin, Fuzhou, China) for 10 min, washed, and incubated with a peroxidase-conjugated streptavidin solution. The sections were counterstained with hematoxylin and mounted later for microscopic observation (BX53; Olympus, Tokyo, Japan). The percent area of positive staining was measured with a computer-assisted automated image analyzer (Image-Pro plus 6.0; Media Cybernetics, Inc., Bethesda, MD).18,19 The software measured 10 random fields per slide and calculated the ratio of the area showing positive staining to the whole area of each construct.
Real-time polymerase chain reaction
The expression level of genes associated with the cartilage matrix (COL2A1, ACAN, SOX9, COL1A2, and COL10A1) was assessed in the in vitro constructs (n = 6 each) using real-time polymerase chain reaction (PCR). Briefly, total RNA was extracted with TRIzol reagent (Gibco), and PCR was performed using a quantitative PCR kit (Toyobo, Osaka, Japan) and an ABI 7500 fast real-time PCR system (Applied Biosystems, Foster City, CA). Glyceraldehyde-3-phosphate dehydrogenase (GAPDH) was used as an internal reference. All reactions were run in triplicate. The sequences of primers used in this study are as follows: COL2A1 forward 5′-CAGGCAGAGGCAGGAAACTAAC-3′, COL2A1 reverse 5′-CAGAGGTGTTTGACACGGAGTAG-3′; ACAN forward 5′-ATGGCTTCCACCAGTGCG-3′, ACAN reverse 5′-CGGATGCCGTAGGTTCTCA-3′; SOX9 forward 5′-GTACCCGCACCTGCACAAC-3′, SOX9 reverse 5′-TCCGCCTCCTCCACGAAG-3′; COL1A2 forward 5′-GCGGTGGTTACGACTTTGGTT-3′, COL1A2 reverse 5′-AGTGAGGAGGGTCTCAATCTG-3′; COL10A1 forward 5′-ATCAGCCACTGGGAAGCC-3′, COL10A1 reverse 5′-TTCGGTCCACTTGGTCCTC-3′; and GAPDH forward 5′-CGTCTGCCCTATCAACTTTCG-3′, GAPDH reverse 5′-CGTTTCTCAGGCTCCCTCT-3′. The fluorescence intensity was recorded under the following setting: 15 s at 90°C and 60 s at 60°C, for 40 cycles. At last, the gene expression value of individual constructs was carefully calculated relative to GAPDH expression using the 2−ΔCt method. 19
Chemical assays
The DNA and glycosaminoglycan (GAG) contents of the in vitro constructs (n = 6 per group) were measured by chemical assay as described previously.
12
Briefly, the constructs were dried (at 37°C for 48 h) and then digested (at 60°C for 24 h) with a papain solution (5 mM
To determine the total DNA content, a Quit-iT dsDNA kit (Invitrogen, Eugene, OR) was used. DNA from salmon testes (Sigma-Aldrich) was used to generate a standard curve. In brief, the supernatant was reacted with Hoechst dye 33258 for 30 min in the dark, following which the intensity of fluorescence was measured using a 96-well plate reader with excitation and emission wavelengths of 360 and 460 nm, respectively (Perkin-Elmer LS-55, Waltham, MA).
GAG content was measured by a dimethylmethylene blue (DMB) colorimetric assay. Briefly, the supernatant was mixed with DMB solution for GAG binding. The GAG-dye complexes were then collected by centrifugation (12,000 g, 10 min). The GAG content was calculated according to a standard curve of sulfate chondroitin from shark cartilage (Sigma-Aldrich) at 530 nm on a Benchmark plus microplate spectrophotometer (Bio-Rad, Tokyo, Japan).
Microcomputed tomography imaging
The in vivo constructs (n = 8 per group) were analyzed to assess hypertrophic changes by microcomputed tomography (CT) equipped with a SkyScan 1072 scanner and its associated analysis software (SkyScan, Antwerp, Belgium), which was previously described. 18 Briefly, the constructs were tightly enclosed in plastic wrap to minimize movement. Image acquisition was conducted at 100 kV and 98 mA at an image resolution of 24 μm. To segment the constructs from the background, the same threshold was applied to the images. Two-dimensional images were used in our study to generate three-dimensional renderings. For quantitative analysis of calcified matrix volumes, each construct was manually segmented in each three-dimensional image. Then, a second evaluation was performed for the calculation of the volume of the calcified matrix.
Statistical analyses
All data are expressed as mean ± standard deviation (SD). The effects of time (3, 10, and 21 days) on volume, the percent area of positive staining, and the chemical content of in vitro constructs in each group were evaluated by one-way analysis of variance (ANOVA). The differences of volume, the percent area of positive staining, and the chemical contents of the in vitro constructs among the C+, E+, C−, and E− groups at 21 days and the effects of time (1, 2, and 3 weeks) on the volume of in vivo constructs in the C and E groups were also analyzed by one-way ANOVA, followed by a post hoc test (Student–Newman–Keuls). The volume difference of the in vivo constructs between the C and E groups at 3 weeks was compared using Student's t test. A value of p < 0.05 (two-sided) was considered statistically significant. All statistical analyses were carried out using SPSS 13.0 (SPSS, Chicago, IL).
Results
Gross observation and volume of the in vitro constructs
For gross observation, the constructs were obviously different in size and shape between groups. During in vitro culture, a significant decrease in construct volume was observed in all groups except the E+ group (Fig. 1A). After 21 days, the volumes of the in vitro constructs were 1.22 ± 0.24, 10.89 ± 2.09, 0.16 ± 0.04, and 8.07 ± 0.58 mm3 in the C+, E+, C−, and E− groups, respectively. The volumes of the constructs in the E− group were greater than those in the C+ and C− groups at 21 days, whereas no significant difference was found compared with those of the E+ group (Fig. 1B).
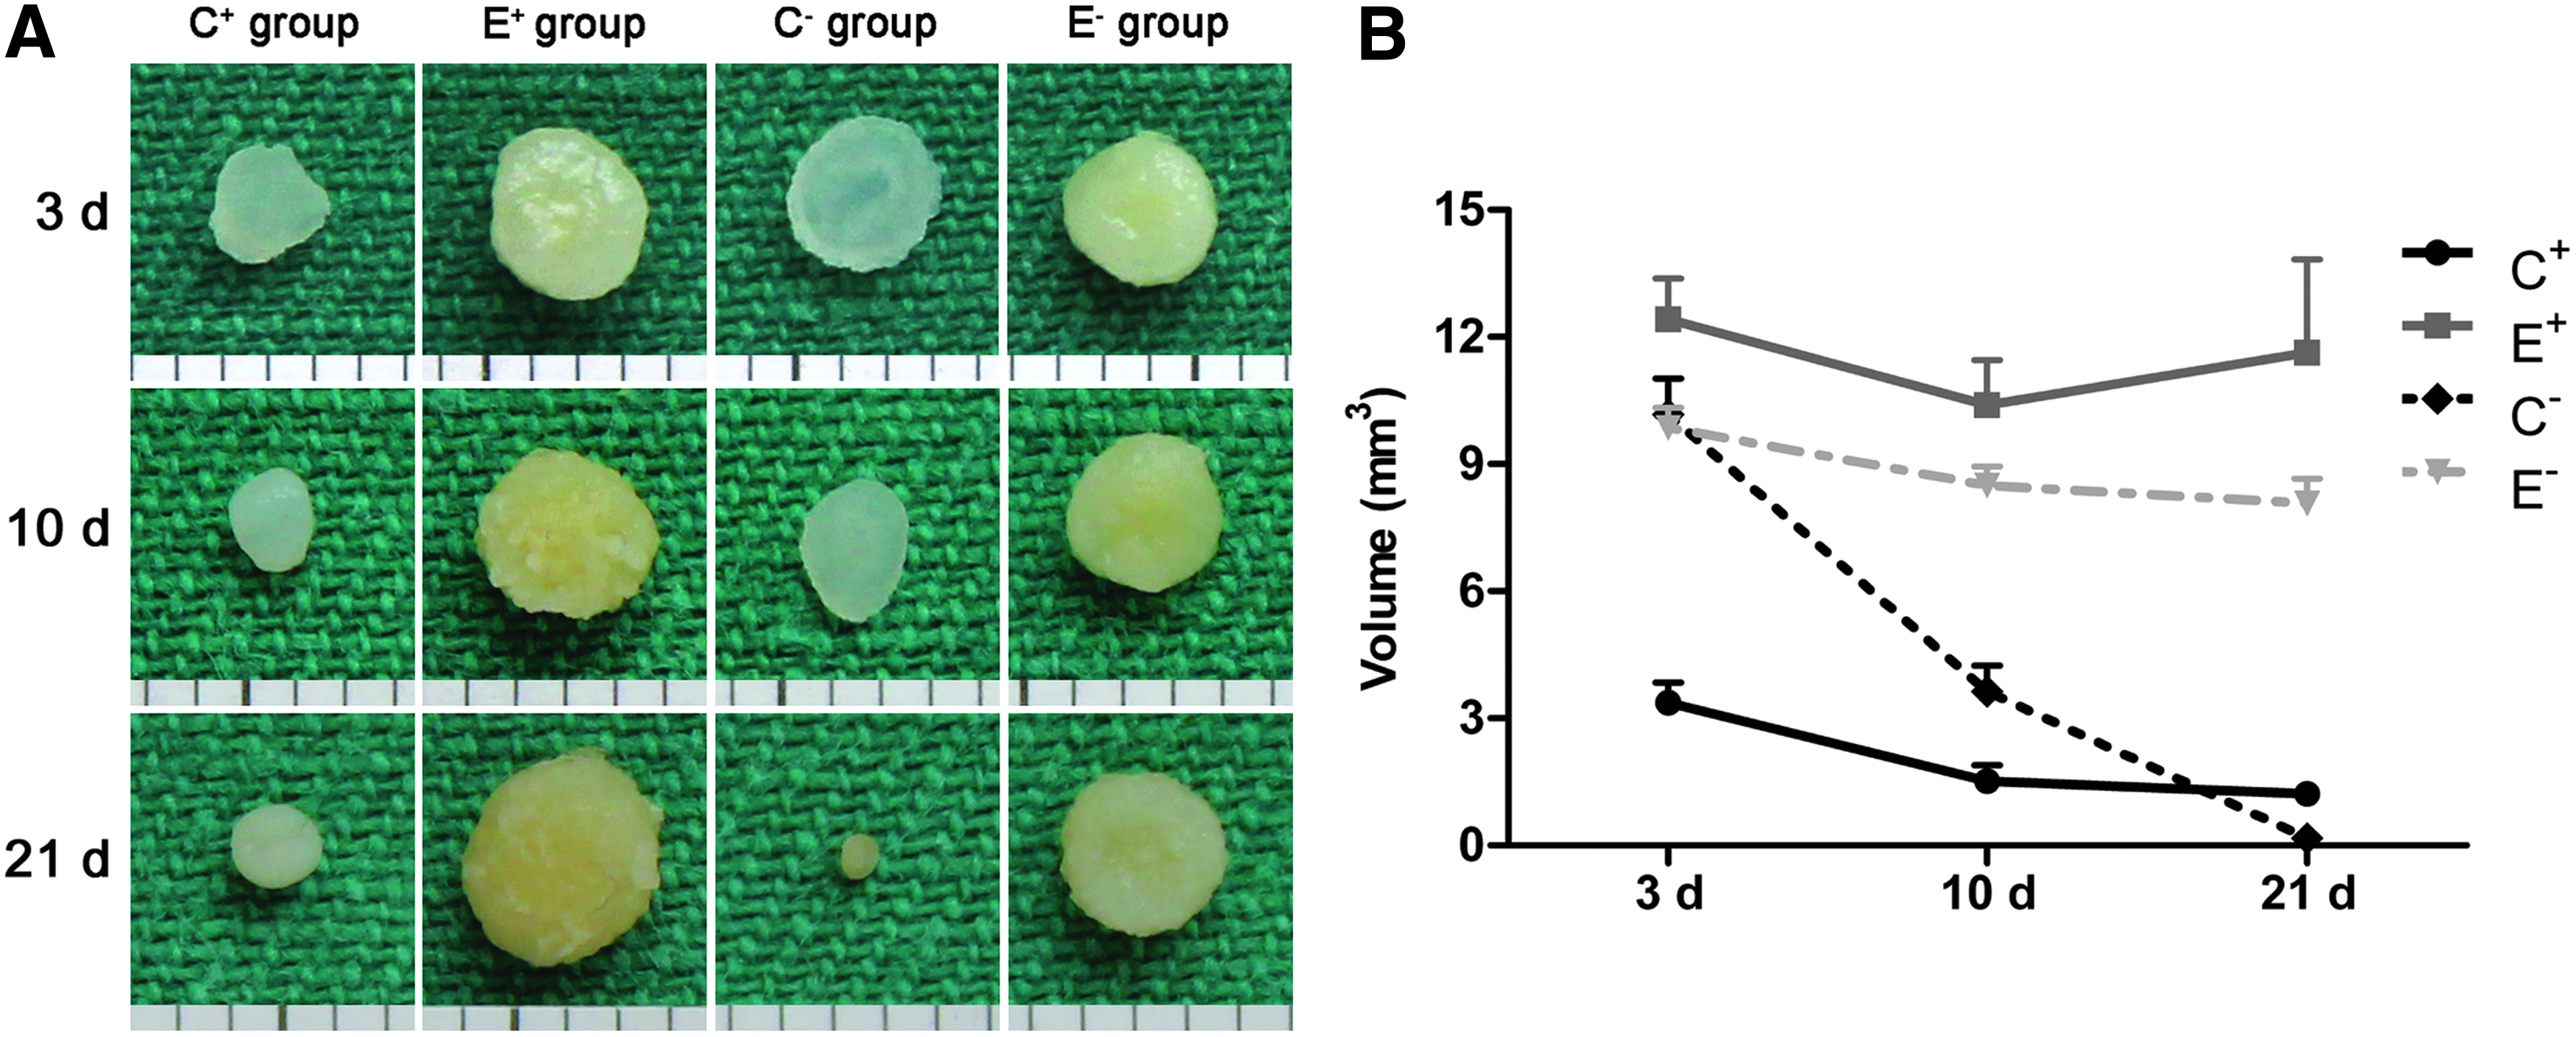
Gross observation and volume measurement of the in vitro constructs after 3, 10, and 21 days.
Histological and immunohistochemical analyses of the in vitro constructs
Safranin O staining confirmed that cartilaginous structures were formed in the C+, E+, and E− groups. Cartilaginous structures containing lacunae and exhibiting metachromatic staining were evident in the C+, E+, and E− groups; however, strong metachromatic staining was observed in the cartilaginous structures of the E+ group (Fig. 2A). The area of positive sulfate proteoglycan staining in the C+, E+, and E− groups increased significantly over time. No significant difference was noted between the C+ and E− groups at 21 days after in vitro culture (Fig. 2B, C). The expression of type II collagen showed a similar pattern of positive staining in the C+, E+, and E− groups (Fig. 3A). The area of positive type II collagen staining increased gradually during the culture period; however, no significant difference was noted between the E+ and E− groups at 21 days (Fig. 3B, C). Cartilaginous lacuna-like structures, sulfate proteoglycan, and type II collagen staining were not observed in the C– group during the in vitro culture. The differentiated BMSCs in the E+ group showed no change during the entire period of culture. However, hypertrophic changes of BMSCs were found at 21 days in both the C+ and E− groups.

Accumulation of sulfate proteoglycan of the in vitro constructs after 3, 10, and 21 days.

Accumulation of type II collagen of the in vitro construct after 3, 10, and 21 days.
Expression of cartilage matrix-associated genes from the in vitro constructs
Real-time PCR was used to evaluate mRNA expression in the in vitro constructs. The expression levels of cartilaginous markers (COL2A1 and ACAN), a key chondrogenic regulator (SOX9), a key hypertrophic marker (COL10A1), and a key differentiation marker (COL1A2) were assessed in the in vitro constructs. On day 3, cells in all groups showed low expression of COL2A1, which encodes type II collagen. During in vitro culture, the E+ and E− groups showed constantly increasing expression levels of COL2A1 (Fig. 4A) and decreasing expression levels of COL1A2 (Fig. 4D), which encodes type I collagen. COL2A1 expression was higher in the C+ group than in the E− group, but was downregulated by 50% on day 21 (Fig. 4A). The expression of ACAN, which encodes the core protein aggrecan, increased over time in groups C+, E+, and E−, whereas its expression was downregulated in the C− group (Fig. 4B). SOX9 expression followed the same trends as those observed with respect to the changes in COL2A1 and ACAN expression in each group. Specifically, its expression level was upregulated over time in the E+ and E− groups, but decreased in the C+ and C− groups (Fig. 4C). The expression of COL10A1, which encodes type X collagen, was higher in the C+ group than in the E+ group at different time points, whereas its expression was the highest in the E− group on day 21. In contrast, COL10A1 maintained a very low expression level in the C− group throughout in vitro culture (Fig. 4E).
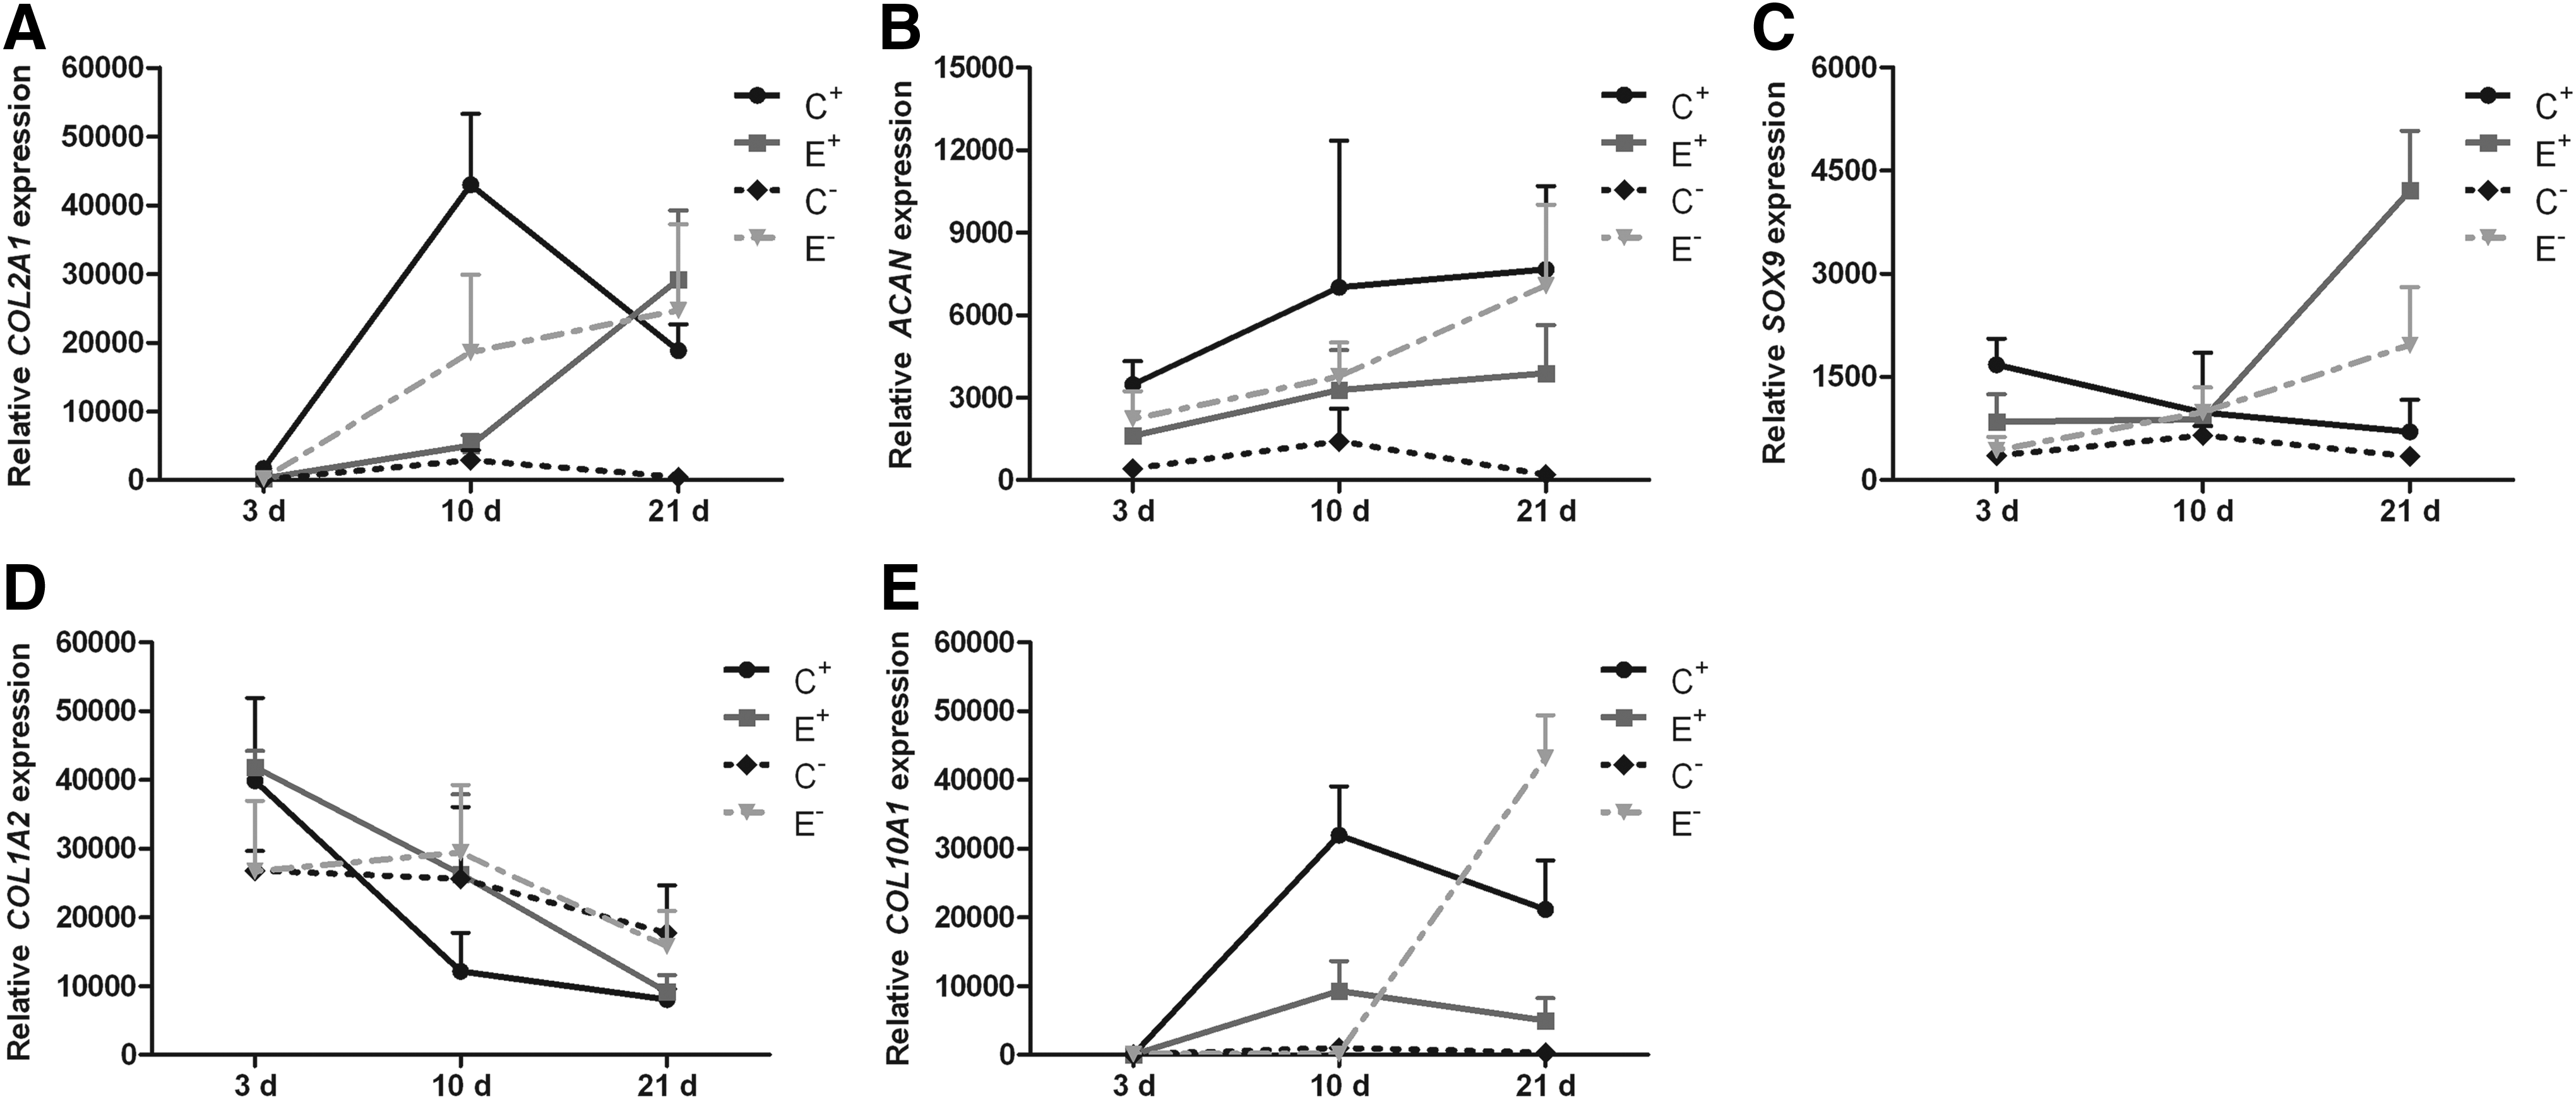
Gene expression of the in vitro constructs after 3, 10, and 21 days. The expression value of cartilage matrix-related genes, including COL2A1
Chemical assessments of the in vitro constructs
The total DNA content of each construct was maintained at a high level in the E+ and E− groups during the in vitro culture, but decreased over time in the C+ group (Fig. 5A). The DNA content was significantly lower in the C+ group than in both the E+ and E− groups on day 21 (both p < 0.05; Fig. 5a). The amount of GAG significantly increased with time in the C+, E+, and E− groups (Fig. 5B); however, the E+ and E− groups had a higher amount of GAG than the C+ group on day 21 (both p < 0.05; Fig. 5b). The GAG/DNA ratio increased gradually over time in all groups (Fig. 5C); however, this ratio was significantly higher in the E− group than in the C+ group on day 21 (p < 0.05; Fig. 5c). The DNA and GAG content of the constructs could not be measured in the C− group because of the small sample weight.
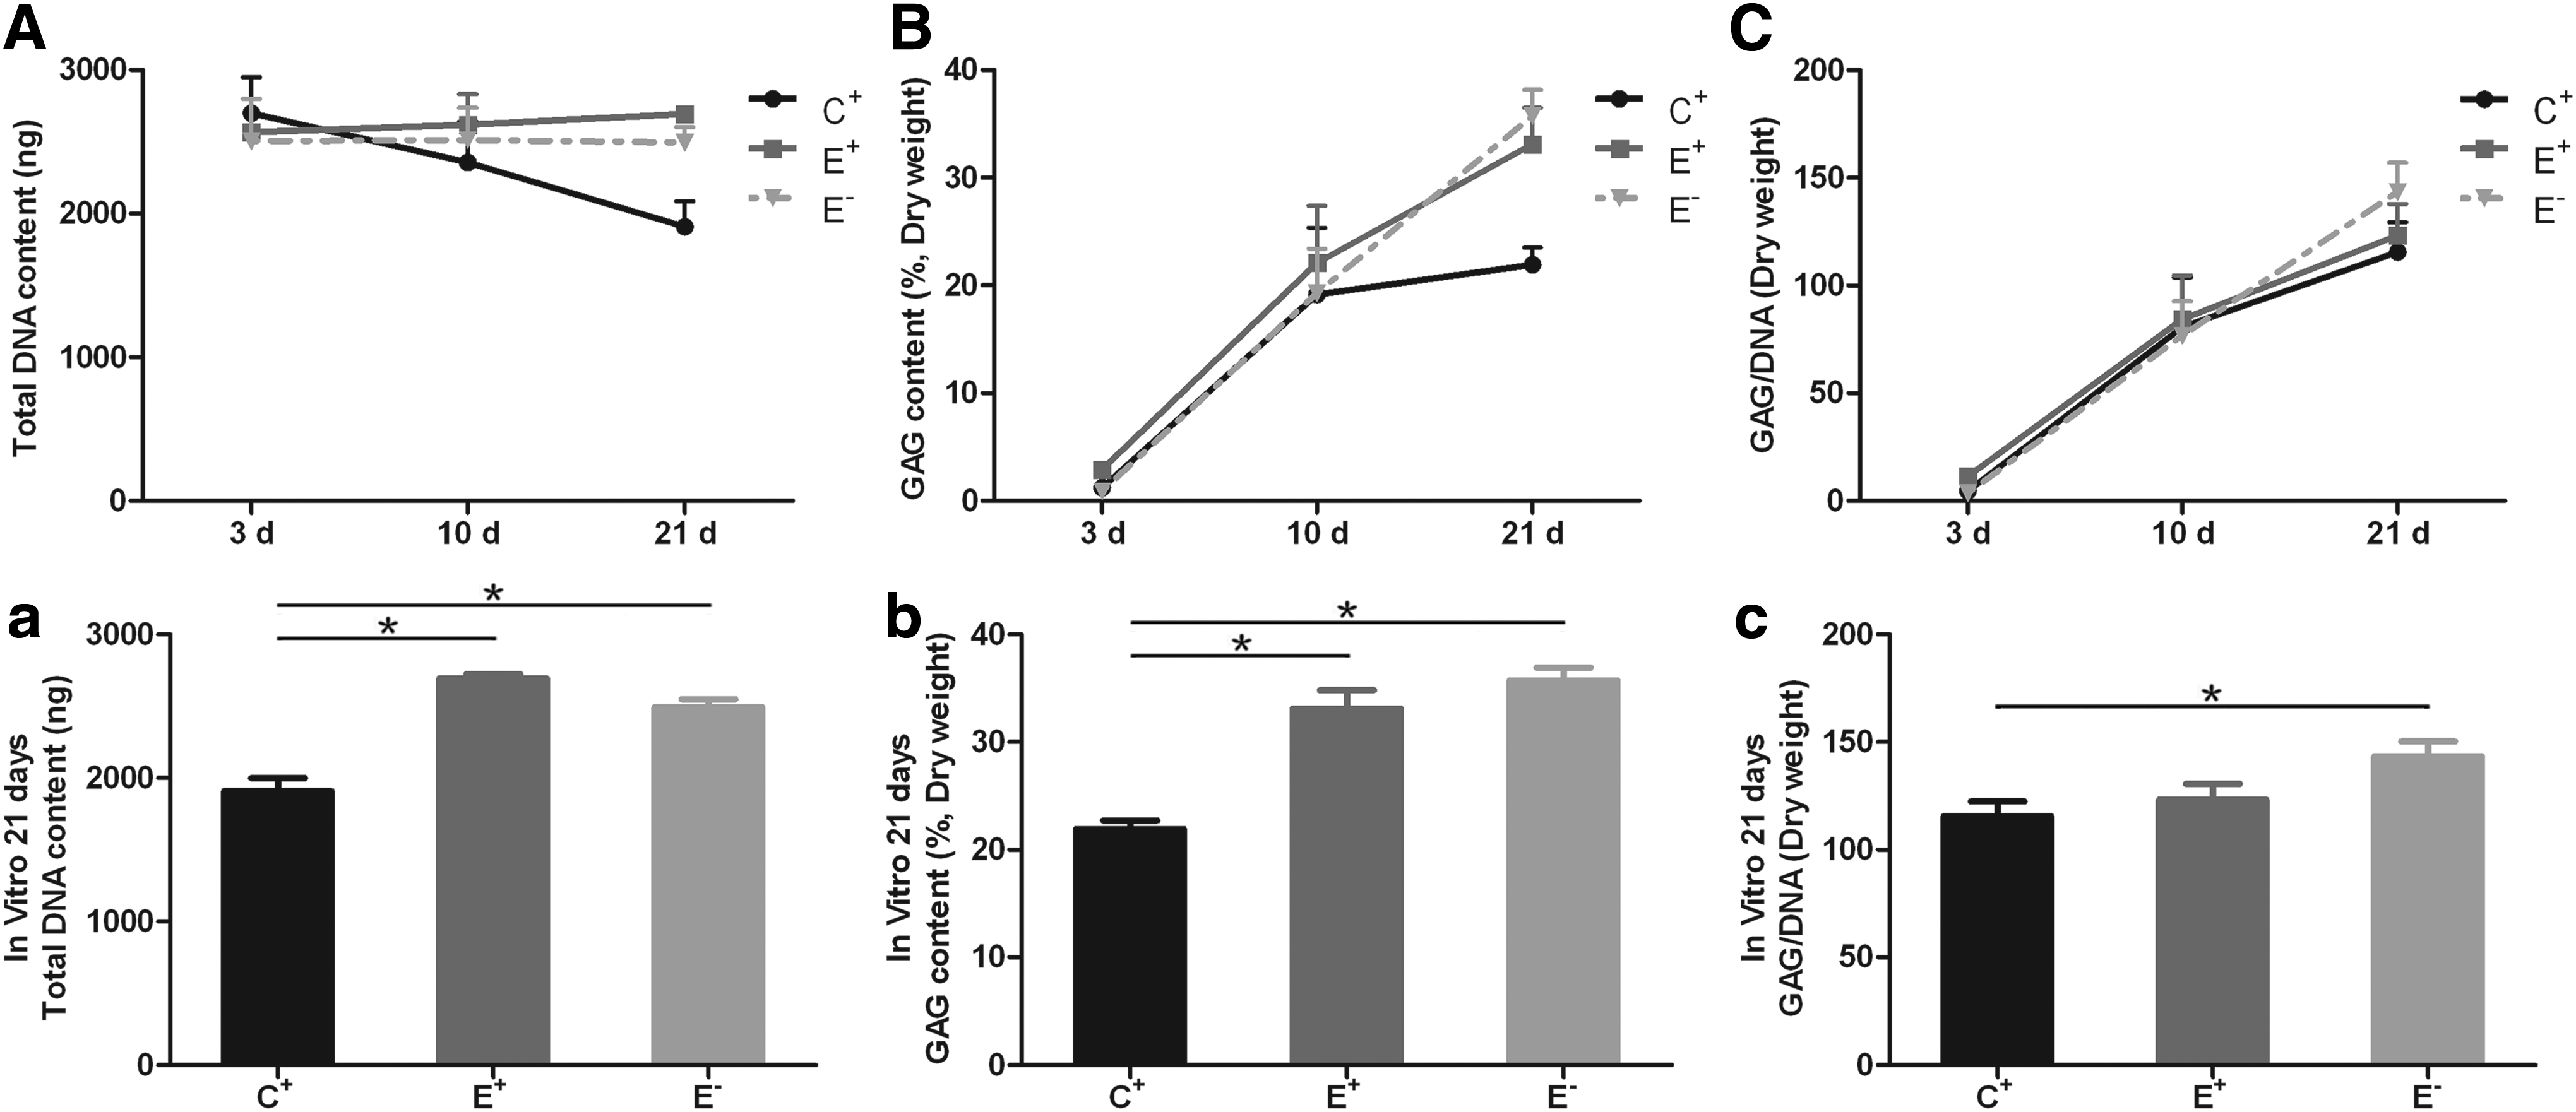
Total DNA content
Gross observation and volume measurement of the in vivo constructs
The in vivo constructs (Fig. 6D, 6E) in the E group showed whitish, hyaline cartilage-like morphology after 1 and 2 weeks; however, their surfaces (Fig. 6F) hardened after 3 weeks. The in vivo constructs in the C group (Fig. 6A–C) appeared as gray fibrous-like tissue. The constructs of the E group maintained their size and shape at baseline during the in vivo implantation, whereas the volume of the constructs significantly decreased in the C group. The estimated volume of the construct was significantly larger in the E group than in the C group (6.67 ± 0.87 vs. 0.09 ± 0.03 mm3; p < 0.001) at 3 weeks after in vivo implantation (Fig. 6G).
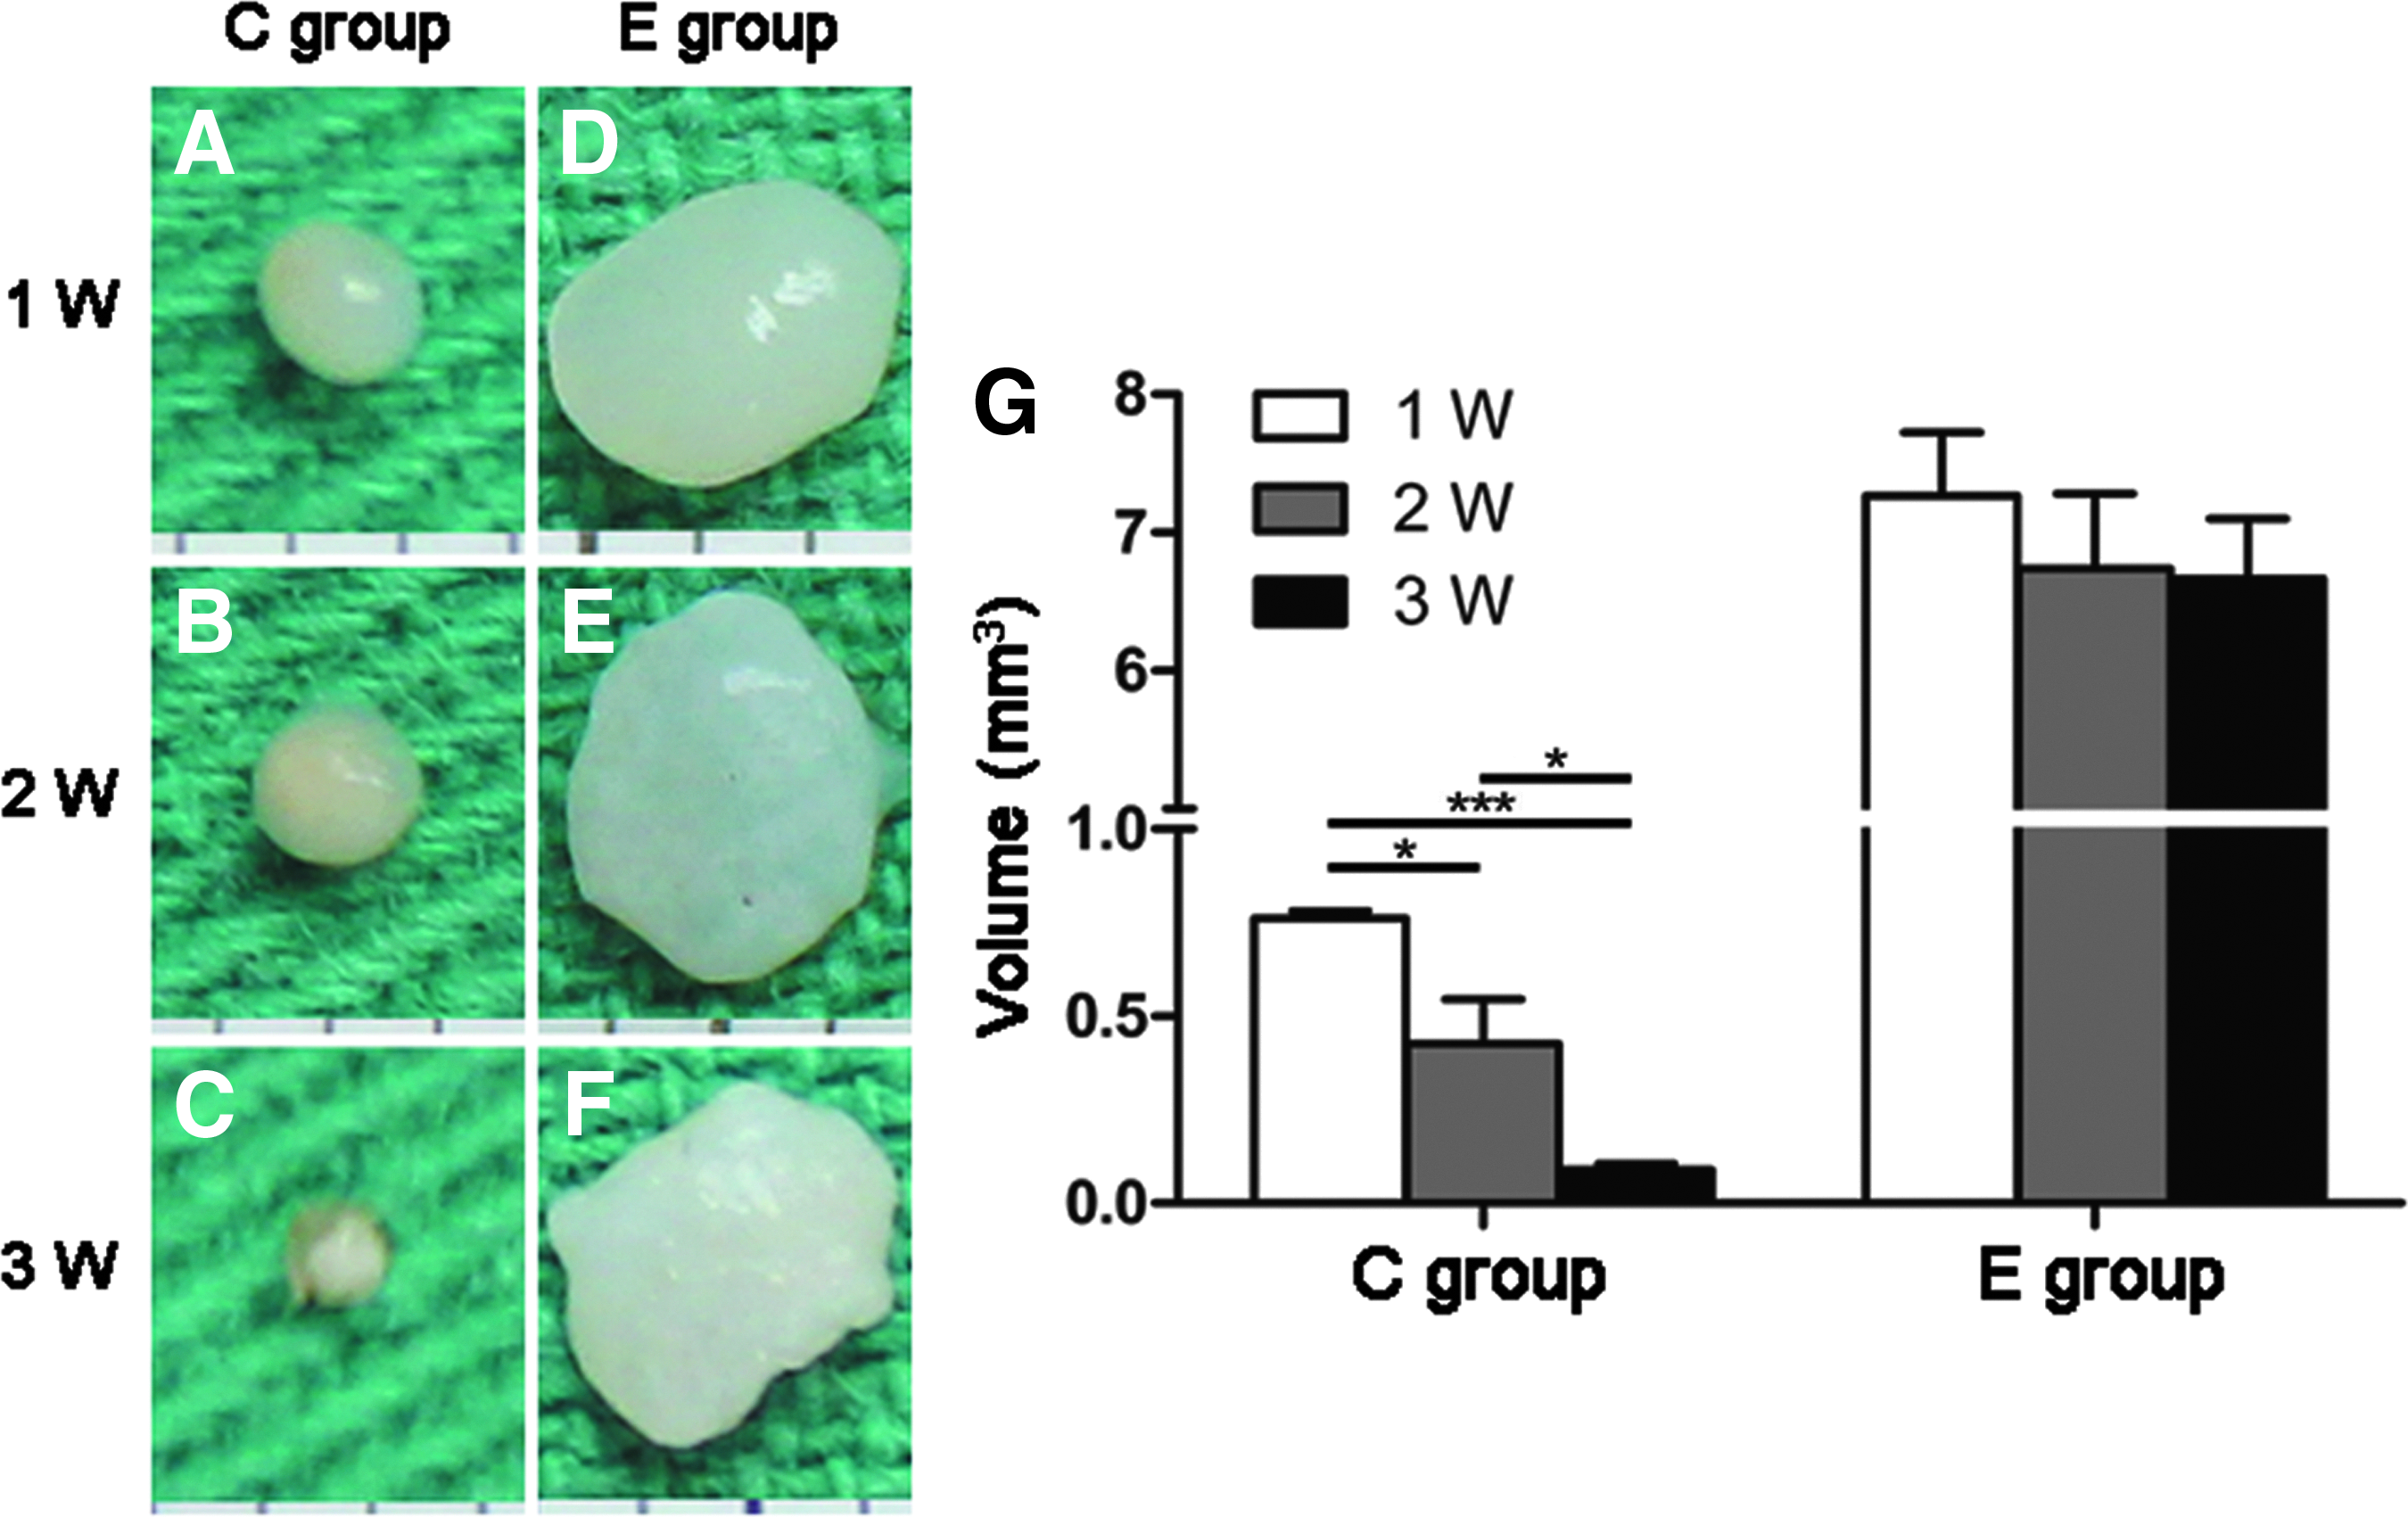
Gross observation and volume measurement of the in vivo constructs.
Expression of chondrogenic markers of the in vivo constructs
The chondrogenic differentiation of the in vivo constructs was confirmed by safranin O staining and immunohistochemical analysis of type II collagen. The accumulation of sulfate proteoglycan and type II collagen was observed in the E group (Fig. 7A). No significant difference was observed in distribution or intensity between the outer and inner regions of the E group at 1 week. After 2 weeks, the expression of sulfate proteoglycan and type II collagen was decreased slightly, especially in the outer region (Fig. 7B, C). No positive sulfate proteoglycan and type II collagen staining was found in the C group during the entire implantation period. Notably, in morphology, the differentiated cells in the E group were predominantly rounded; these cells were encapsulated in lacunae, which were similar to chondrocytes in native cartilage. These round shapes and lacunar structures were not observed in the C group.
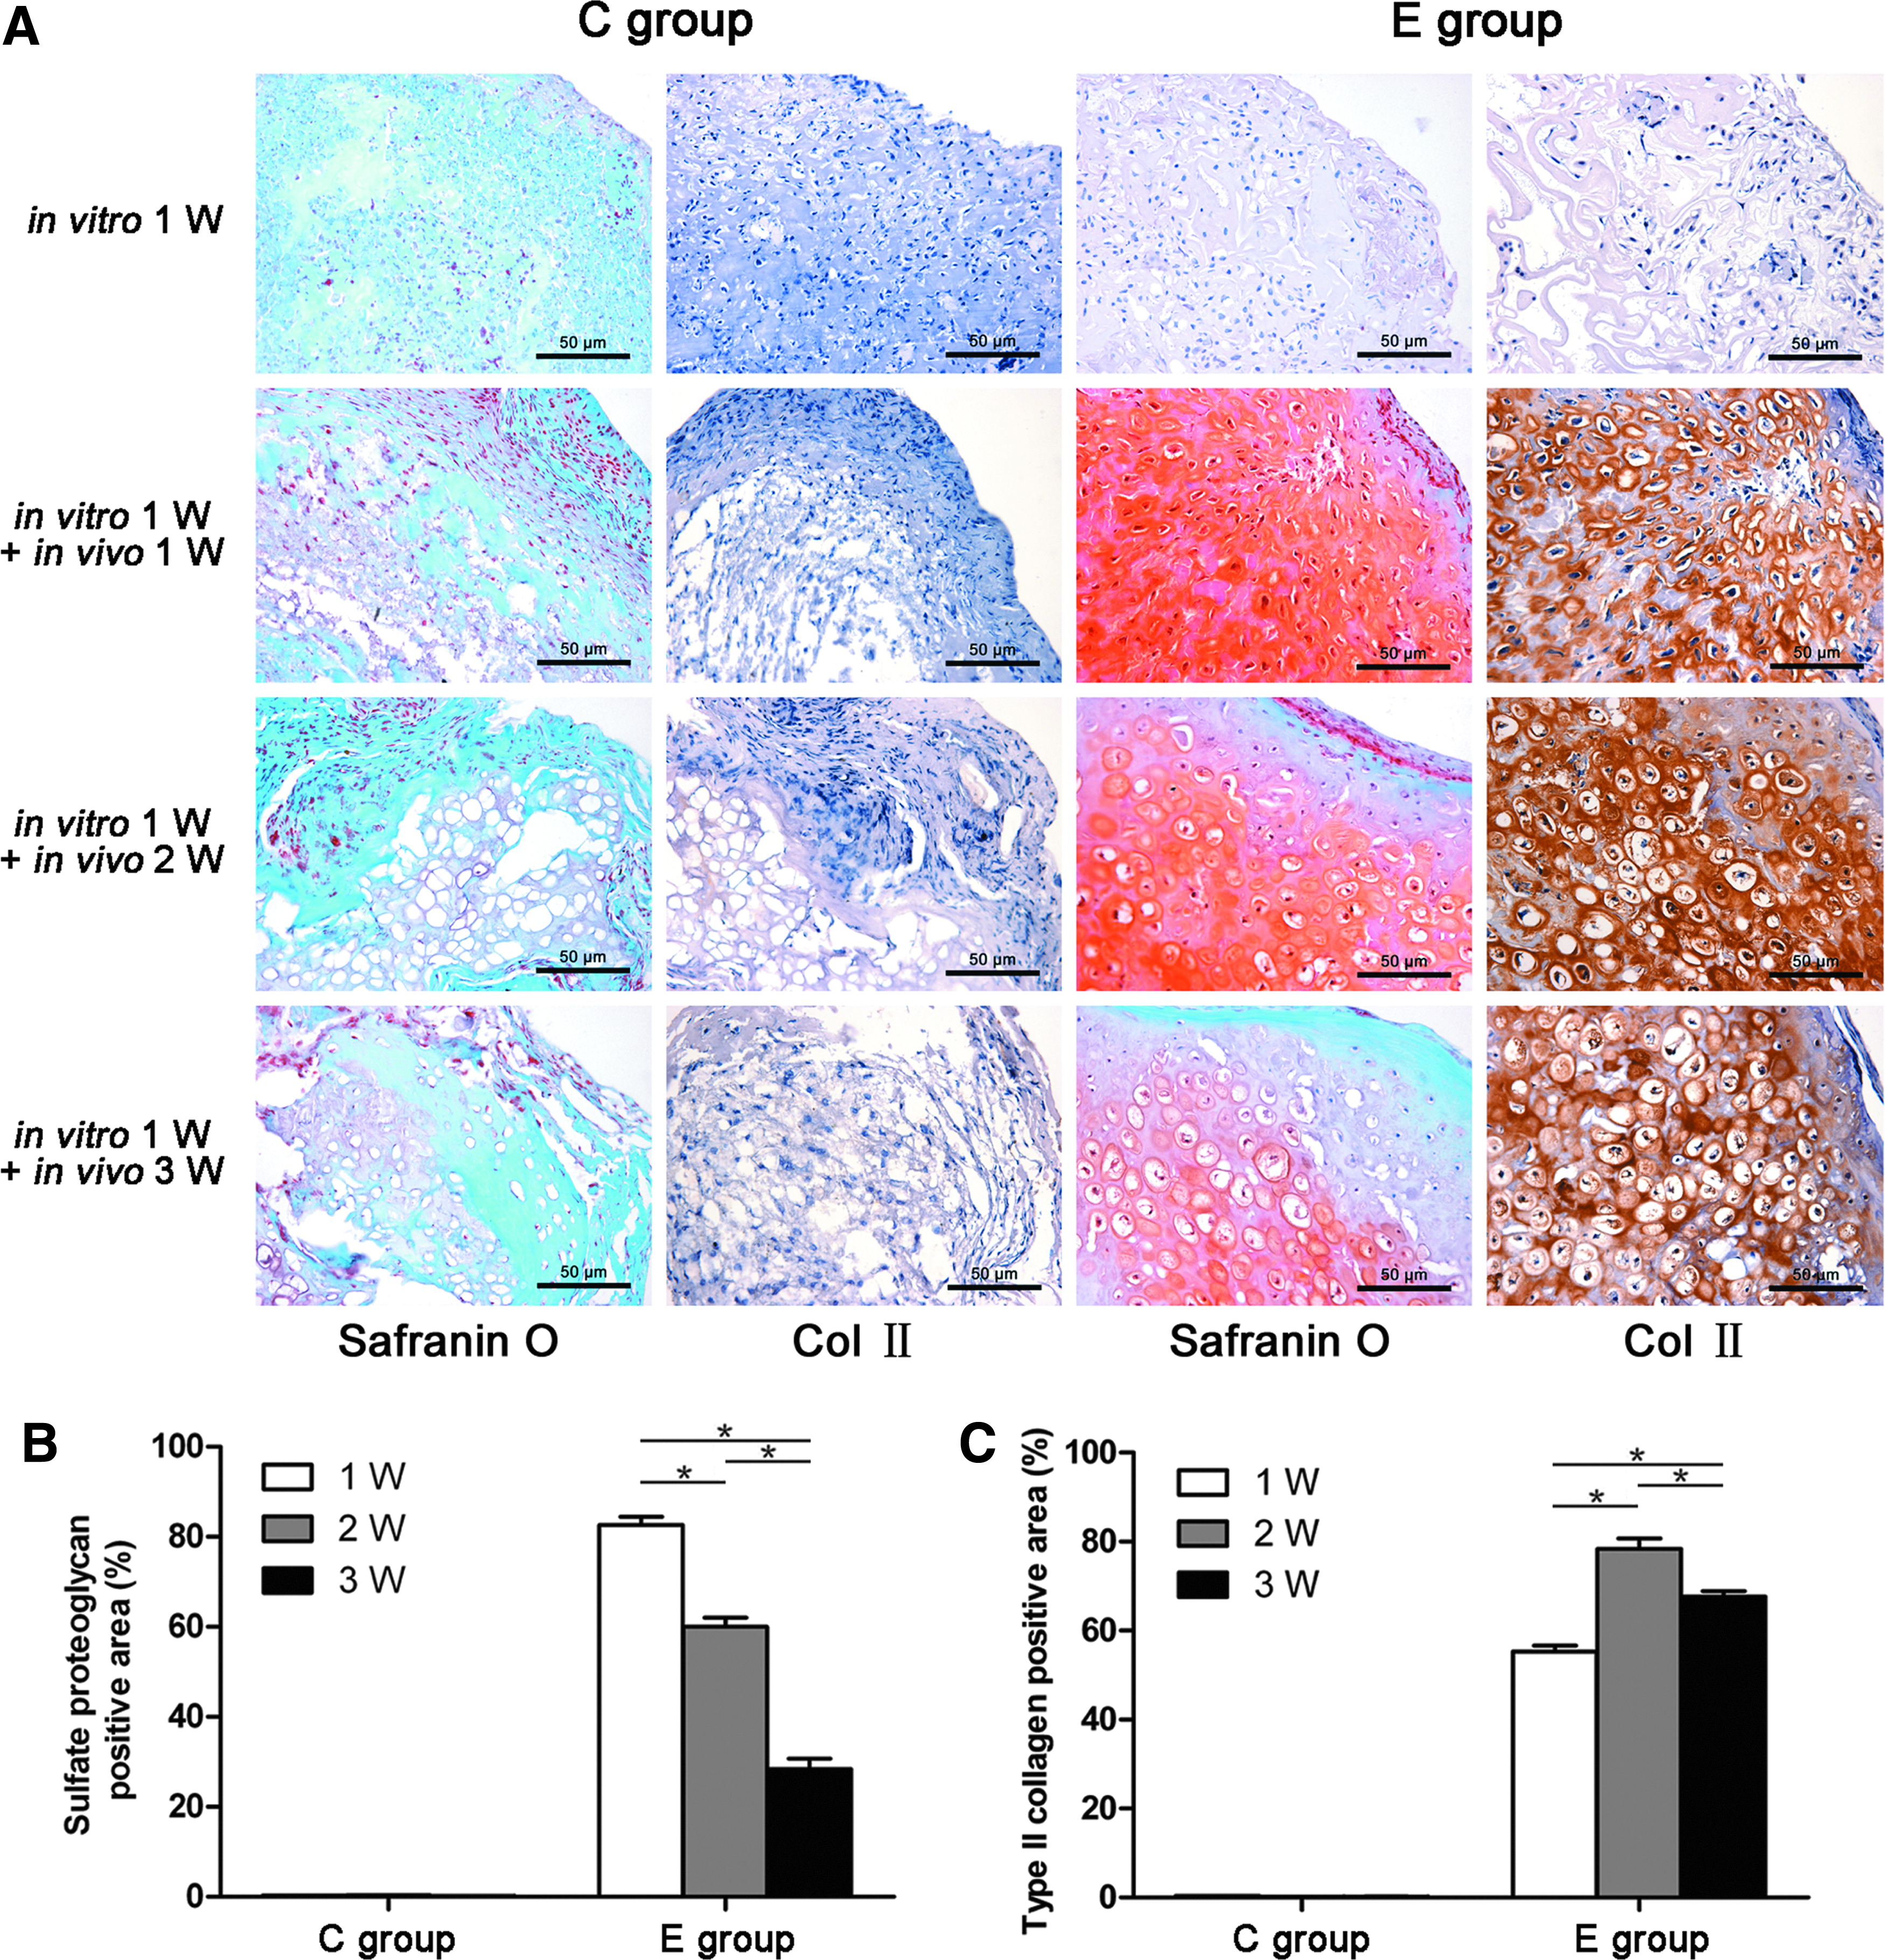
Expression of chondrogenic markers of the in vivo constructs.
Expression of hypertrophic markers in the in vivo constructs
Three-dimensional reconstruction and quantitative analysis using micro-CT indicated that calcified matrix formation was formed first in the outer regions of the constructs in the E group at 2 weeks after implantation, and then spread to the central region, corresponding with an increased volume of the calcified matrix after 2 weeks. No calcified matrix was observed in the C group (Fig. 8A, B). Von Kossa staining further confirmed that a hypertrophic change occurred in the E group. Black staining, indicative of calcified mineral deposits, was found in the outer regions of the E group and spread gradually to the central regions, with the positive area gradually increasing throughout the in vivo implantation period (Fig. 8A, C).
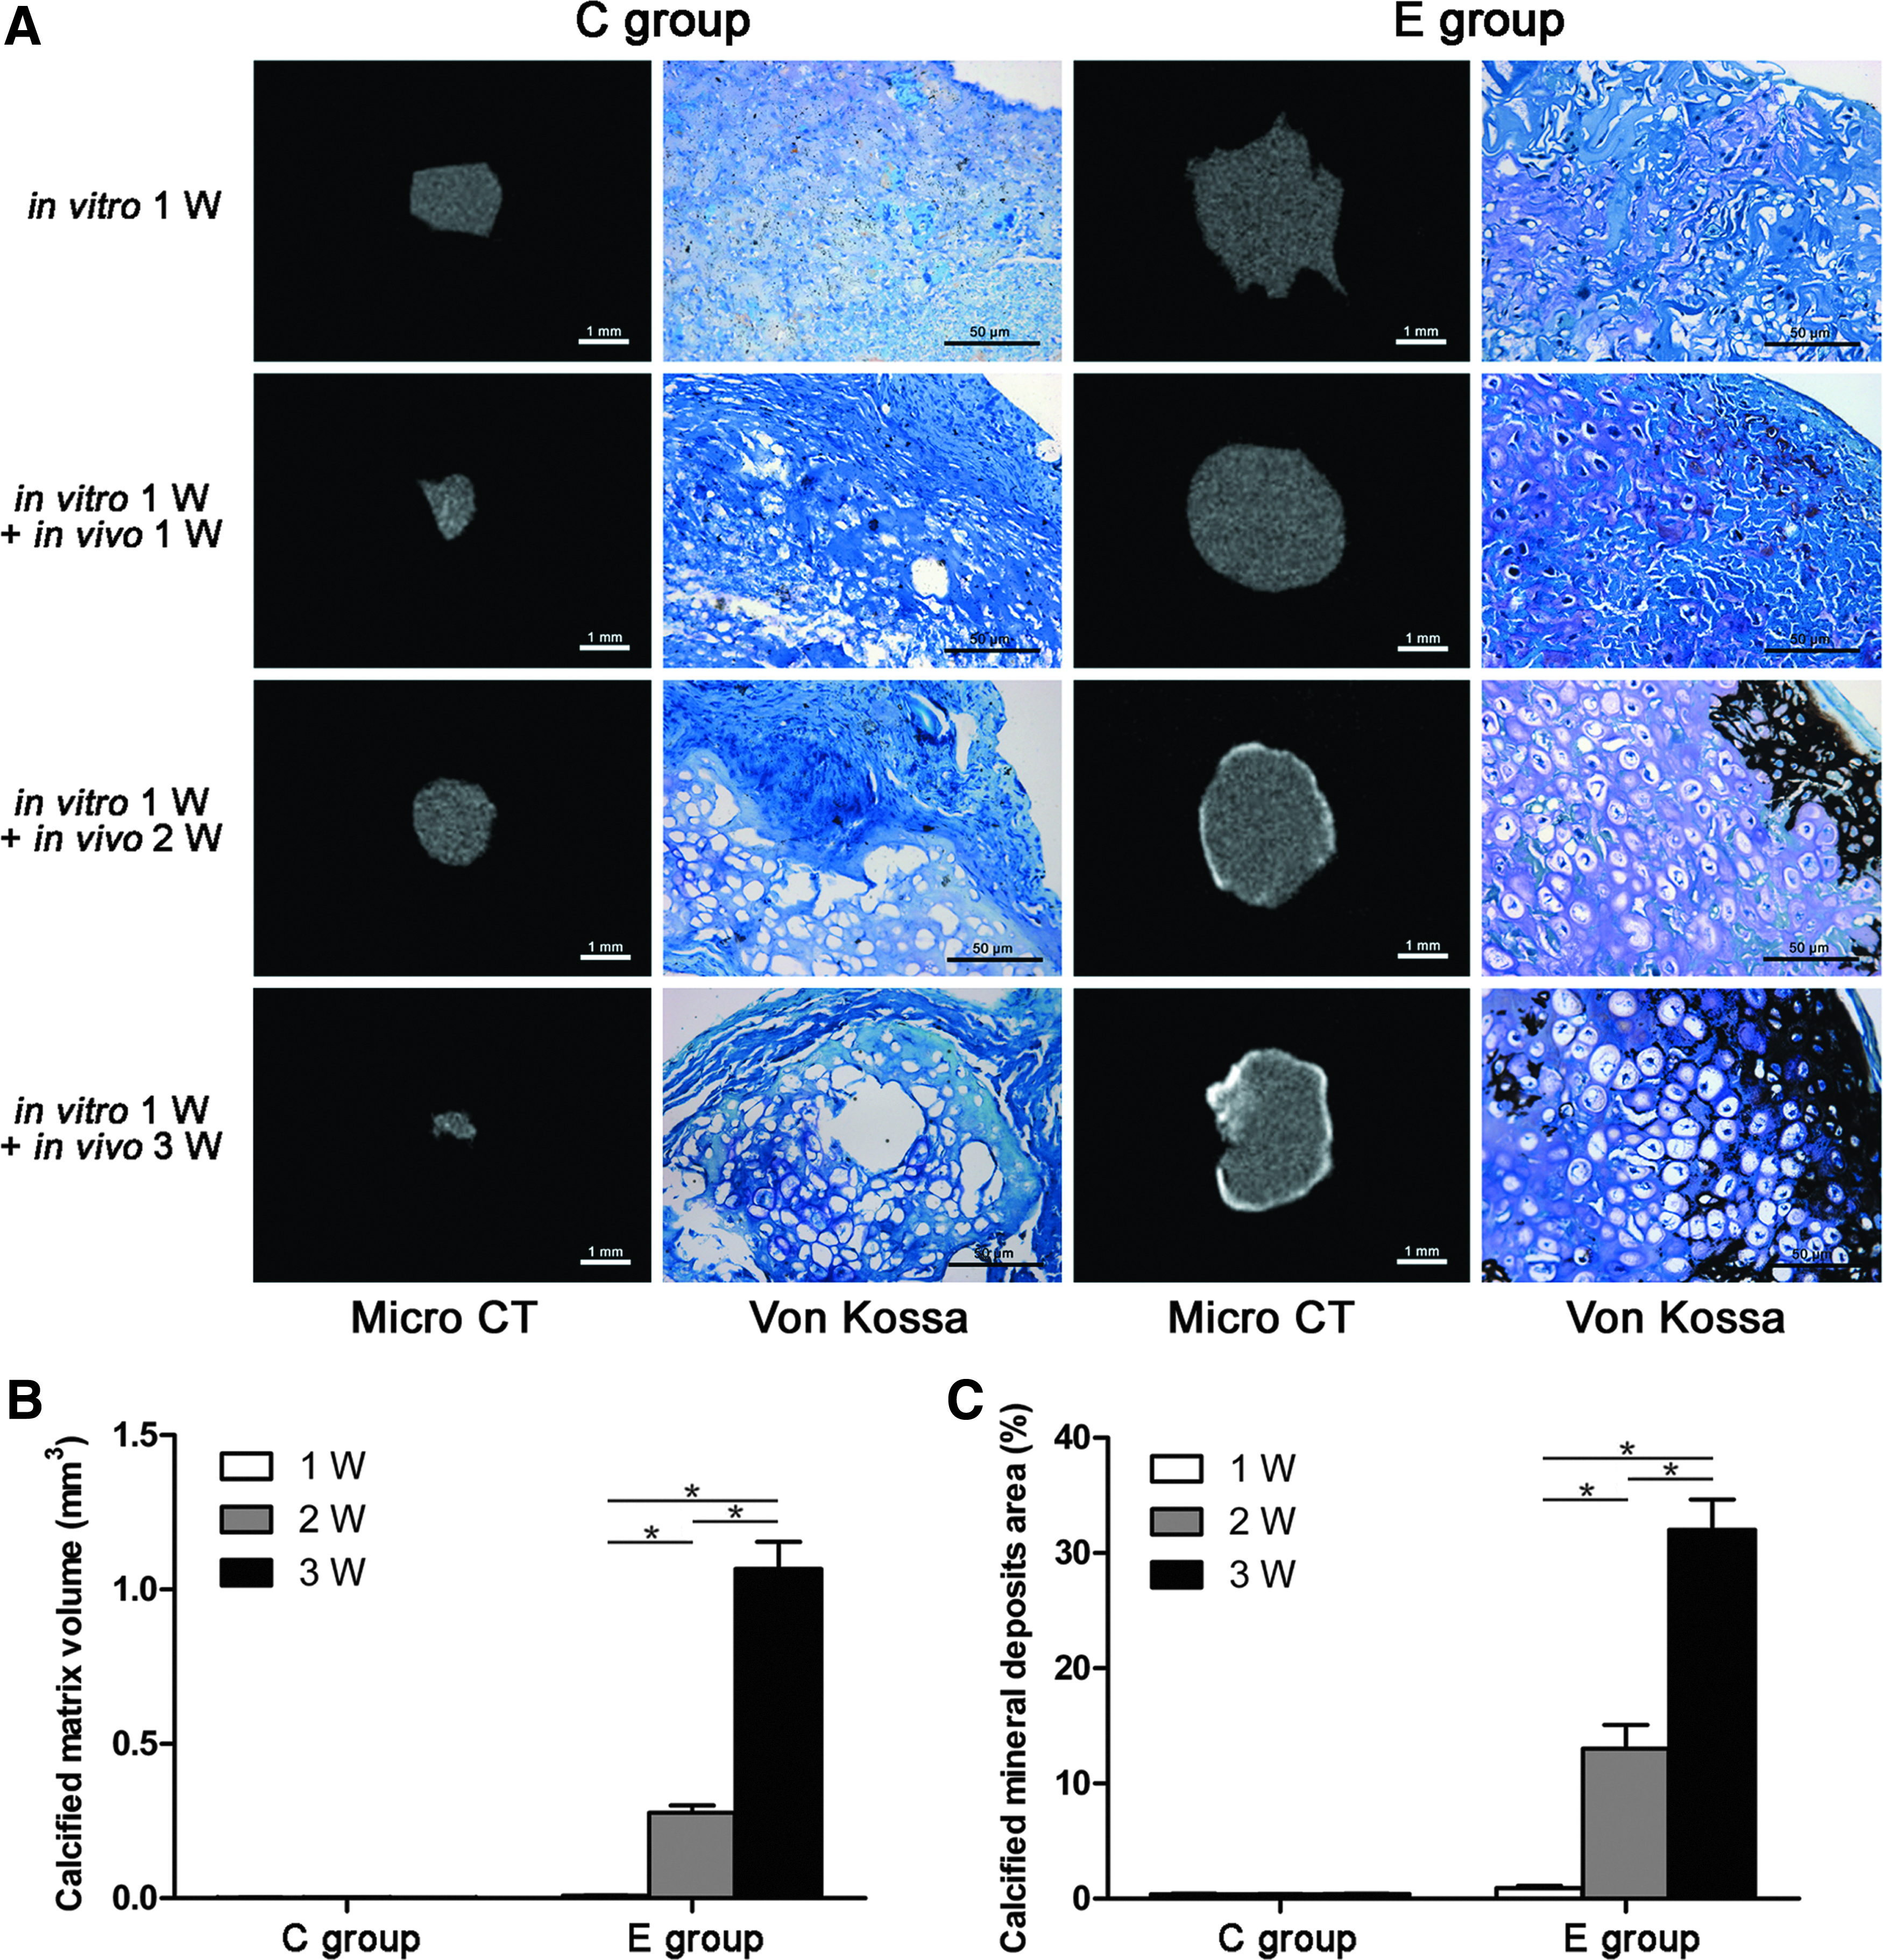
Expression of hypertrophic markers of the in vivo constructs.
Discussion
In this study, we attempted to determine whether the aBMSC-dECM scaffold could promote chondrogenic differentiation of BMSCs without any exogenous growth factors. The in vitro constructs were observed with a homogeneous structure, high cartilaginous matrix content, and high expression level of cartilage-associated genes in both the E+ and E− groups. The in vivo constructs showed cartilage formation in terms of accumulation of cartilage matrix only in the E group. These results suggested that the aBMSC-dECM scaffold possessed chondrogenesis-inducing activity, thereby promoting chondrogenic differentiation of autologous BMSCs.
Multipotent BMSCs that are able to differentiate into chondrocytes have been successfully used for cartilage tissue engineering. 20 Nevertheless, a major limitation of cartilage tissue engineering with BMSCs is that exogenous growth factors are required to induce chondrogenic differentiation.12,21 One of the most common strategies to achieve this is the incorporation of growth factor-loaded microparticles into the tissue engineering materials. However, this does not mimic the natural presentation of the factors, and this approach has been associated with the uncontrolled release of growth factors that are not normally secreted outside of cells. Furthermore, the latter application raised regulatory issues related to binding factor conformation and activity.22–24
Bioactive scaffolds have been expected to play a crucial role in the induction of chondrogenic differentiation. 25 Compared with atelocollagen scaffolds, in this study, only aBMSC-dECM scaffolds underwent chondrogenesis and accumulated large amounts of cartilaginous matrix (consisting of sulfate proteoglycan and type II collagen) when cultured without TGF-β3 in vitro. In addition, BMSCs in aBMSC-dECM scaffolds upregulated their expression of cartilaginous genes (COL2A1, ACAN, and SOX9), irrespective of whether TGF-β3 was added into the culture media or not. These findings were further confirmed by our in vivo study, which demonstrated that when the cell–scaffold constructs were implanted into the subcutaneous tissue of nude mice, chondrogenic differentiation occurred in the E group, whereas no evidence of chondrogenesis was found in the C group. These data indicate that the aBMSC-dECM scaffold can support chondrogenic differentiation of BMSCs without the requirement of exogenous growth factors. Choi et al. reported that a porcine, chondrocyte-derived ECM scaffold could not only support chondrogenic differentiation of rabbit BMSCs in vitro but also delay the degeneration of chondrogenic phenotypes in vivo, 21 suggesting that such a porcine chondrocyte-derived ECM scaffold might provide a favorable and native cartilage-like environment. Meng et al. found that a tricalcium phosphate-collagen-hyaluronan scaffold could induce chondrogenic differentiation of human MSCs without any exogenous growth factors. 25 Comparatively, we observed that the aBMSC-dECM scaffold also independently induced chondrogenic differentiation. However, the mechanism by which the aBMSC-dECM scaffold induces chondrogenesis remains unclear. One potential option that relates to the observation is that cell proliferation is tightly linked to the chondrogenic differentiation of MSCs. 26 The aBMSC-dECM scaffold was obtained from autologous BMSCs as well as their ECM components, providing a biocompatible environment for cell adhesion and proliferation. Accordingly, the aBMSC-dECM scaffold might provide an environment conducive to chondrogenic differentiation. A second possibility is that the MSC-derived ECM might protect stem cells from oxidative stress, thereby enhancing proliferation and inhibiting apoptosis. 12 Additionally, ECM materials comprise a complex mixture of molecules that are beneficial to chondrogenic differentiation.27,28 We also found that several component growth factors in the aBMSC-dECM scaffold, including basic fibroblast growth factor and TGF-β1, might efficiently regulate the chondrogenesis of stem cells (unpublished data). Third, local high cell density might be another factor that induces chondrogenic differentiation. 29 It has been reported that direct cell–cell interaction is important for stem cell differentiation and that low cell density culture exhibits less significant differentiation than high cell density culture. 30 Therefore, the high cell density used in our study might also contribute to chondrogenic differentiation. 25 Finally, several factors of the scaffold itself, such as pore size, total porosity, pore shape, pore interconnectivity, and limited contraction during culture, are known to influence chondrogenic differentiation. For example, Im et al. reported that chondrogenic differentiation was enhanced in scaffolds with a pore size of 400 μm, 31 which is similar to the pore size of the aBMSC-dECM scaffolds used in this study. 12 In addition, more thorough consideration of scaffold size and shape should be made with respect to our results of chondrogenesis ability because of differential scaffold contraction. 29 The constructs of the E group maintained their size and shape during in vivo implantation, whereas the volume of the constructs significantly decreased in the C group, suggesting that the aBMSC-dECM scaffolds might be relatively more supportive of chondrogenesis.
Another major limitation of cartilage tissue engineering with BMSCs is the lack of stability of the chondrogenic phenotypes. Xue et al. stated that the chondrogenic phenotypes in PGA/PLA scaffolds are lost rapidly when cell differentiation is not completed. The loss of chondrogenic phenotypes appears to accompany increased matrix calcification, 32 and PLGA scaffolds seeded with MSCs show matrix calcification after in vivo implantation. 33 In our study, when the constructs were cultured with TGF-β3, we found that the E+ group could better resist hypertrophic change, as evidenced by positive staining for sulfate proteoglycan and type II collagen. Compared with the E+ group, the C+ group showed higher expression of COL10A1 during the in vitro culture. However, hypertrophic changes were noted in the outer region of the E group at 3 weeks after in vivo implantation. This might be because the subcutaneous environment is favorable for the invasion of blood vessels that could support hypertrophic change of the construct. 34 We also observed that the wall of the aBMSC-dECM scaffold cultured in vivo had completely degraded by 2 weeks. The degradation is too rapid to provide biological function for BMSCs, which are helpless for stabilizing the chondrogenic phenotype. Nonetheless, we also found that the chondrogenic phenotype was maintained at a higher level and in a larger area in the in vivo constructs using the aBMSC-dECM scaffold compared with the phenotype obtained using other scaffolds such as the PGA/PLA, 32 PGA, 21 and PLGA scaffolds. 33
There are some limitations in our study. First, hypertrophic change of the in vivo construct is followed by vessel invasion. 35 As our in vivo analysis was based primarily on the expression of chondrogenic and hypertrophic markers, the expression of angiogenic markers during the in vivo implantation should be evaluated as well. Second, time for in vivo implantation was limited to 3 weeks. Although our previous studies showed that the construct in the experiment group could show significant differences compared with that of the control group at 3 weeks after in vivo implantation, limited culture time might lead to some bias in the results. 12 Finally, cartilage hypertrophy and calcium deposition were found in the nude mouse model, which differ substantially from the condition of patients with joint disorders. Additional studies will be required to examine and assess the clinical utility of the scaffolds we developed in this work in experimental cartilage defect models and subsequently in patient care.
Conclusions
In summary, this study demonstrated that aBMSC-dECM scaffolds can induce chondrogenesis through promotion of the chondrogenic differentiation of BMSCs and that they could be successful candidate scaffolds for cartilage tissue engineering.
Footnotes
Acknowledgments
The authors thank Professor Hong-Guang Xie, General Clinical Research Center, Nanjing Medical University Nanjing First Hospital, for his critical comments on the manuscript. This research was supported by the National Nature Science Foundation of China (81171745).
Disclosure Statement
No competing financial interests exist.