
Abstract
We aim to demonstrate that regeneration of chronic tympanic perforations with heparin-binding epidermal growth factor-like growth factor (HB-EGF) delivered by an injectable hydrogel restored hearing to levels similar to that of nonperforated tympanic membranes. Chronic tympanic membrane perforation is currently managed as an outpatient surgery with tympanoplasty. Due to the costs of this procedure in the developed world and a lack of accessibility and resources in developing countries, there is a great need for a new treatment that does not require surgery. In this study, we show in a mouse model through measurement of auditory brainstem response and distortion product otoacoustic emissions that tympanic perforations lead to hearing loss and this can be predominantly recovered with HB-EGF treatment (5 μg/mL). Our animal model suggests a return to function between 2 and 6 months after treatment. Auditory brainstem response thresholds had returned to the control levels at 2 months, but the distortion product otoacoustic emissions returned between 2 and 6 months. We also show how the vibration characteristics of the regenerated tympanic membrane, as measured by laser Doppler vibrometry, can be similar to that of an unperforated tympanic membrane. Using the best available methods for preclinical evaluation in animal models, it is likely that HB-EGF-like growth factor treatment leads to regeneration of chronic tympanic membrane perforations and restoration of the tympanic membrane to normal function, suggesting a potential route for nonsurgical treatment.
Introduction
T
Materials and Methods
All animal work was approved by Stanford's Administrative Panel on Laboratory Animal Care. The experimental protocol for the cohort of mice is shown in Figure 1. As a summary, a cohort of 10 mice (one side used for control and the other side used for treatment) underwent hearing testing as a baseline. Chronic perforations were created in their right ears only, followed by hearing testing at 3 months once this chronic perforation was established. The chronic perforations had HB-EGF treatment applied, the perforations were allowed to heal, and then hearing tests were conducted at both 2 and 6 months after initial HB-EGF treatment. Upon testing, the mice were sacrificed and tympanic membranes were exposed for assessment by sound-driven laser Doppler vibrometry (LDV). There was one instance of mouse mortality that occurred during the anesthesia for the final hearing test measurement after completion of the hearing testing. This mouse (M1) was included in all auditory brainstem response (ABR) and distortion product otoacoustic emission (DPOAE) results, but excluded from the LDV measurements.

Developing KB-R7785 chronic TM perforations. The figure shows the experimental study method for the mouse cohort. HB-EGF, heparin-binding epidermal growth factor-like growth factor; LDV, laser Doppler vibrometry; TM, tympanic membrane.
All mice used for all experiments were purchased from Jackson Laboratories (Florida) and were 6–10-week-old male CBA/CAJ (15–25 g) when the first perforations were made and before HB-EGF treatment. All otoscopy and surgical interventions were performed using inhaled isoflurane at 3–4% for induction and 1–2% for maintenance.
Hearing threshold measurements
ABR and DPOAE measurements were taken as previously described. 6 Frequencies measured were 4.0, 5.7, 8.0, 11.3, 16.0, 23.0, 31.9, and 46.1 kHz. When the pure tone average was calculated, the mean of all the above listed frequencies was used. Briefly, the ABR potentials were measured through needle electrodes positioned in the postauricular tissue and at the vertex of the head, with a ground electrode placed in the rear leg. A bioamplifier (DP-311; Warner Instruments, Hamden, CT) amplified the signal 10,000 times. The sound intensity level was raised in 10 dB steps (10–80 dB) SPL. At each sound level, 260 responses were measured and averaged. At each frequency, the peak-to-peak value of the ABR was measured and the threshold was calculated as when this value was five standard deviations above the noise floor. The threshold was set arbitrarily at 80 dB SPL for averaging purposes if an ABR response was not detected at 80 dB SPL. DPOAEs were measured in the external auditory canal by a probe tip microphone (type 4182; Brüel & Kjaer, Denmark). The frequency response of this microphone was measured using a free-field microphone with a flat frequency response out to 100 kHz (type 4939; Brüel & Kjaer). This calibration curve was then used to adjust the DPOAE amplitudes. The sound stimuli for eliciting DPOAEs were two 1-second sine-wave tones of differing frequencies (F2 = 1.22 × F1). F2 ranged from 4 to 46.1 kHz. The two tones were of equal intensities and stepped from 20 to 80 dB SPL in 10 dB increments. The amplitude of the cubic distortion product was measured at 2 × F1−F2. The threshold at each frequency was calculated to be when the DPOAE was >5 dB SPL and two standard deviations above the noise floor. The threshold was set arbitrarily at 80 dB SPL for averaging purposes if a DPOAE was not detected at 80 dB SPL.
Mouse model of chronic TM perforation
The mouse model of chronic TM perforation has been previously published.
5
In brief, chronic perforations were created on the right side only using a curved microneedle to create a subtotal perforation in the pars tensa. A piece of gel foam, approximately equal to the size of the newly created perforation, with 10 nM KB-R7785 [4-(N-hydroxyamino)-2R-isobutyl-3S-methylsuccinyl)-
HB-EGF treatment
Recombinant mouse HB-EGF purchased from Prospec (New Jersey, catalog number CYT-068) at 5 μg/mL dose was delivered through a hydrogel delivery system. The treatment gel was injected through the external auditory canal, to the chronic perforation side only, using a syringe and 27-gauge needle, through and onto the TM to fill the middle ear cavity, and into the medial part of the external ear. The total volume delivered by syringe was ∼0.04 mL in each case. The hydrogel construction was performed according to a previously published technique.7,8 Sodium metabisulfite (SMBS) was mixed with the hydrogel prepolymer solution to form a cross-linked hydrogel within a few minutes.
Preliminary dose–response calculation
To determine the optimal dose to be used for these experiments, a preliminary cohort was treated as described above with escalating doses of HB-EGF. Mice had chronic perforations formed and then were randomly allocated to receive one of the following doses using the same technique described above (0 mg/mL n = 16 perforations, 10 ng/mL n = 16 perforations, 100 ng/mL n = 17 perforations, 500 ng/mL n = 16 perforations, 1 μg/mL n = 16 perforations, 5 μg/mL n = 24 perforations, 10 μg/mL n = 18 perforations, 50 μg/mL n = 18 perforations).
Tympanic membrane preparation
The animal was euthanized under general anesthesia by cervical dislocation and the body placed on ice and transferred to the LDV setup in a nearby laboratory. The pinna was removed at the bony cartilaginous junction and the bony ear canal was removed partially until the entire annulus of the TM could be viewed in one position of the microscope. An aluminum-coated glass microsphere (D = 30–100 μm; Cospheric, Santa Barbara, CA) was placed at the umbo to enhance laser light reflectivity.
Noncontact LDV
A CLV-3D LDV system (Polytec GmbH, Waldbronn, Germany) was mounted on three motorized linear translation stages and the LDV lasers were reflected into the specimen by a dichroic mirror so that the specimen could be imaged through a Zeiss OPMI-1 operating microscope during measurements. The measurement software, SyncAv (v0.26), is a custom Labview (National Instruments, Austin, TX)-based data acquisition program that performs synchronous averaging between up to two output and six input channels. For the present experiment, a National Instruments PXI data acquisition computer with a maximum sampling rate of 204.8 kHz was used. The sampling rate, fast Fourier transform (FFT) length, and number of averages were 120 kHz, 4096, and 10, respectively. SyncAv was also used to operate the translation stages and focus the LDV system on the reflective bead.
Sound stimuli consisting of 85 pure tones logarithmically spaced from 1 to 60 kHz and equalized to a constant pressure of 94 dB SPL using the SyncAv StimEq function were presented. The acoustic pressure within 2 mm of the umbo was measured using a Sokolich G-II ultrasonic probe microphone system and the three LDV output channels were simultaneously recorded. The 3D velocity transfer function, defined as the maximum umbo velocity in 3D space divided by pressure at the eardrum, was calculated using MATLAB (Mathworks, Natick, MA). 9 Finally, the data were grouped by frequency into bins centered at the frequencies used for the hearing threshold measurements and averaged.
Statistical analysis
STATA version 13.0 was used for analysis. For all measurements, a linear mixed model was conducted, including frequency and cohort as fixed effects (and their interaction) and mouse as a random effect. The LDV data were log transformed for analysis purposes. Statistical significance was set at 5% and data were analyzed using the R environment for statistical computing. 10 Pearson's chi-square test for goodness of fit with Bonferroni adjustments was performed to compare a given dose with other doses given in the dose escalation preliminary study.
Results
Figure 2 shows ABR (left column) and DPOAE (right column) measurement as a function frequency at key time points of the study for the treated ear (dashed lines) and the untreated ear (solid lines).

Hearing outcomes of HB-EGF treatment of chronic tympanic membrane perforations. The ABR and DPOAE thresholds in decibels (db) during the study. At baseline, both the treatment and control ears are not significantly different. As would be predicted, the treatment ears show a hearing loss after creation of a chronic perforation. This hearing loss returns in the treatment ear after 2 months as measured by the ABR and within 2–6 months as measured by the DPOAE. At the 6-month measurement, there is no significant difference between the treated ears and the control ears. ABR, auditory brainstem response; DPOAE, distortion product otoacoustic emission.
Preliminary dose–response calculation
The results for the dose escalation to determine the optimal dose are presented in Figure 3. The optimal dose was determined by 5 μg/mL as this dose showed significant perforation closure over lower doses with higher doses not showing any significant difference (Table 1). Perforation closure was 6.2% at 0 mg/mL (n = 16 perforations), 12.5% at 10 ng/mL (n = 16 perforations), 6.2% at 100 ng/mL (n = 17 perforations), 29.4% at 500 ng/mL (n = 16 perforations), 37.5% at 1 μg/mL (n = 16 perforations), 91.7% at 5 μg/mL (n = 24 perforations), 72.2% at 10 μg/mL (n = 18 perforations), and 77.8% at 50 μg/mL (n = 18 perforations).

Dose escalation effect of HB-EGF. The figure shows a dose–response curve to determine the optimal dose, determined by number of perforations healed, to be used for these experiments; a preliminary cohort was treated as described above with escalating doses of HB-EGF. The numbers of chronic perforations at each dose are displayed above the curve at the time point.
Pearson's chi-square test for goodness of fit with Bonferroni adjustments was performed to compare a given dose with other doses given in the dose escalation preliminary study. The optimal dose was determined by 5 μg/mL as this dose showed significant perforation closure over lower doses, with higher doses not showing any significant difference. Bold highlights those comparisons showing a significant difference between doses in terms of efficacy.
Baseline hearing
There were no statistical differences in ABR (p = 0.92) or DPOAE (p = 0.30) thresholds between the control side and the treatment side in the cohort of mice at the beginning of the study.
Hearing results after chronic perforation
After the chronic perforations were created, hearing was significantly worse at 8, 11.3, 16, 31.9, and 46.1 kHz for ABR in the perforation side compared with the control side. Hearing was also significantly worse in the chronic perforation side at 8, 11.3, 16, 23, 31.9, and 46.1 kHz for the DPOAE.
Hearing results after HB-EGF treatment
After treatment of chronic perforations with HB-EGF, at 2 months, there was no difference compared with the control side in the ABR except at 4 kHz (4 kHz p = 0.01, 5.7 kHz p = 0.13, 8 kHz p = 0.78, 11.3 kHz p = 0.15, 16 kHz p = 0.06, 23 kHz p = 0.38, 31.9 kHz p = 0.27, 46.1 kHz p = 0.96). There was, however, a difference in the DPOAE at 2 months with the control ear being worse at 4 kHz (p = 0.03) and the treated ears being worse at 5.7, 11.3, 16, 23, and 46.1 kHz (p = 0.02, p < 0.001, p < 0.001, p < 0.001, and p < 0.001, respectively), with no difference at 8 or 31.9 kHz (p = 0.16, p = 0.91, respectively). At 6 months, this difference was significantly reduced, with treated ears having slightly worse hearing at 4 kHz (p = 0.01) using the ABR and control ears having slightly worse hearing at 4 kHz (p = 0.03) and treated ears worse at 5.7, 11.3, and 46.1 kHz (p = 0.02, p < 0.001 and p = 0.01) using the DPOAE. For the subsequent ABR scores, hearing was no different between treated and control ears (5.7 kHz p = 0.12, 8 kHz p = 0.78, 11.3 kHz p = 0.14, 16 kHz p = 0.15, 23 kHz p = 0.06, 31.9 kHz p = 0.38, and 46.1 kHz p = 0.27). For the subsequent DPOAE scores, again there was no difference in hearing between treated and control ears (8 kHz p = 0.94, 16 kHz p = 0.18, 23 kHz p = 0.26, and 31.9 kHz p = 0.15). At 6 months for the DPOAE, where the treatment group was poorer than the control, the difference in actual hearing was minimal (5.7 kHz = 1.6 dB, 11.3 kHz = 6.4 dB, and 46.1 kHz = 3.8 dB).
Laser Doppler vibrometry
The mean LDV results for the control and treated ears at 6 months are shown in Figure 4. In both groups, the mean normalized umbo velocity increased from 4.0 until 11.3 kHz. Above 11.3 kHz, the control group mean continued to increase, while the treatment group mean decreased slightly. There was no significant difference between the treatment and control groups at the lower and middle frequencies 4.0, 5.7, 8.0, 11.3, 16.0, and 23.0 kHz (p = 0.09, p = 0.08, p = 0.17, p = 0.47, p = 0.80, and p = 0.51). There was, however, a significant difference between these groups at 31.9 and 46.1 kHz (p < 0.001, p < 0.001), with the treatment group having a smaller LDV score (with the treatment group scoring on average 0.73 and 0.53 for 31.9 and 46.1 kHz, respectively, compared with 1.29 and 1.08 for control). In general, variability was higher in the treated group, with a standard deviation of 0.67 for the treatment group compared with 0.52 for the control.
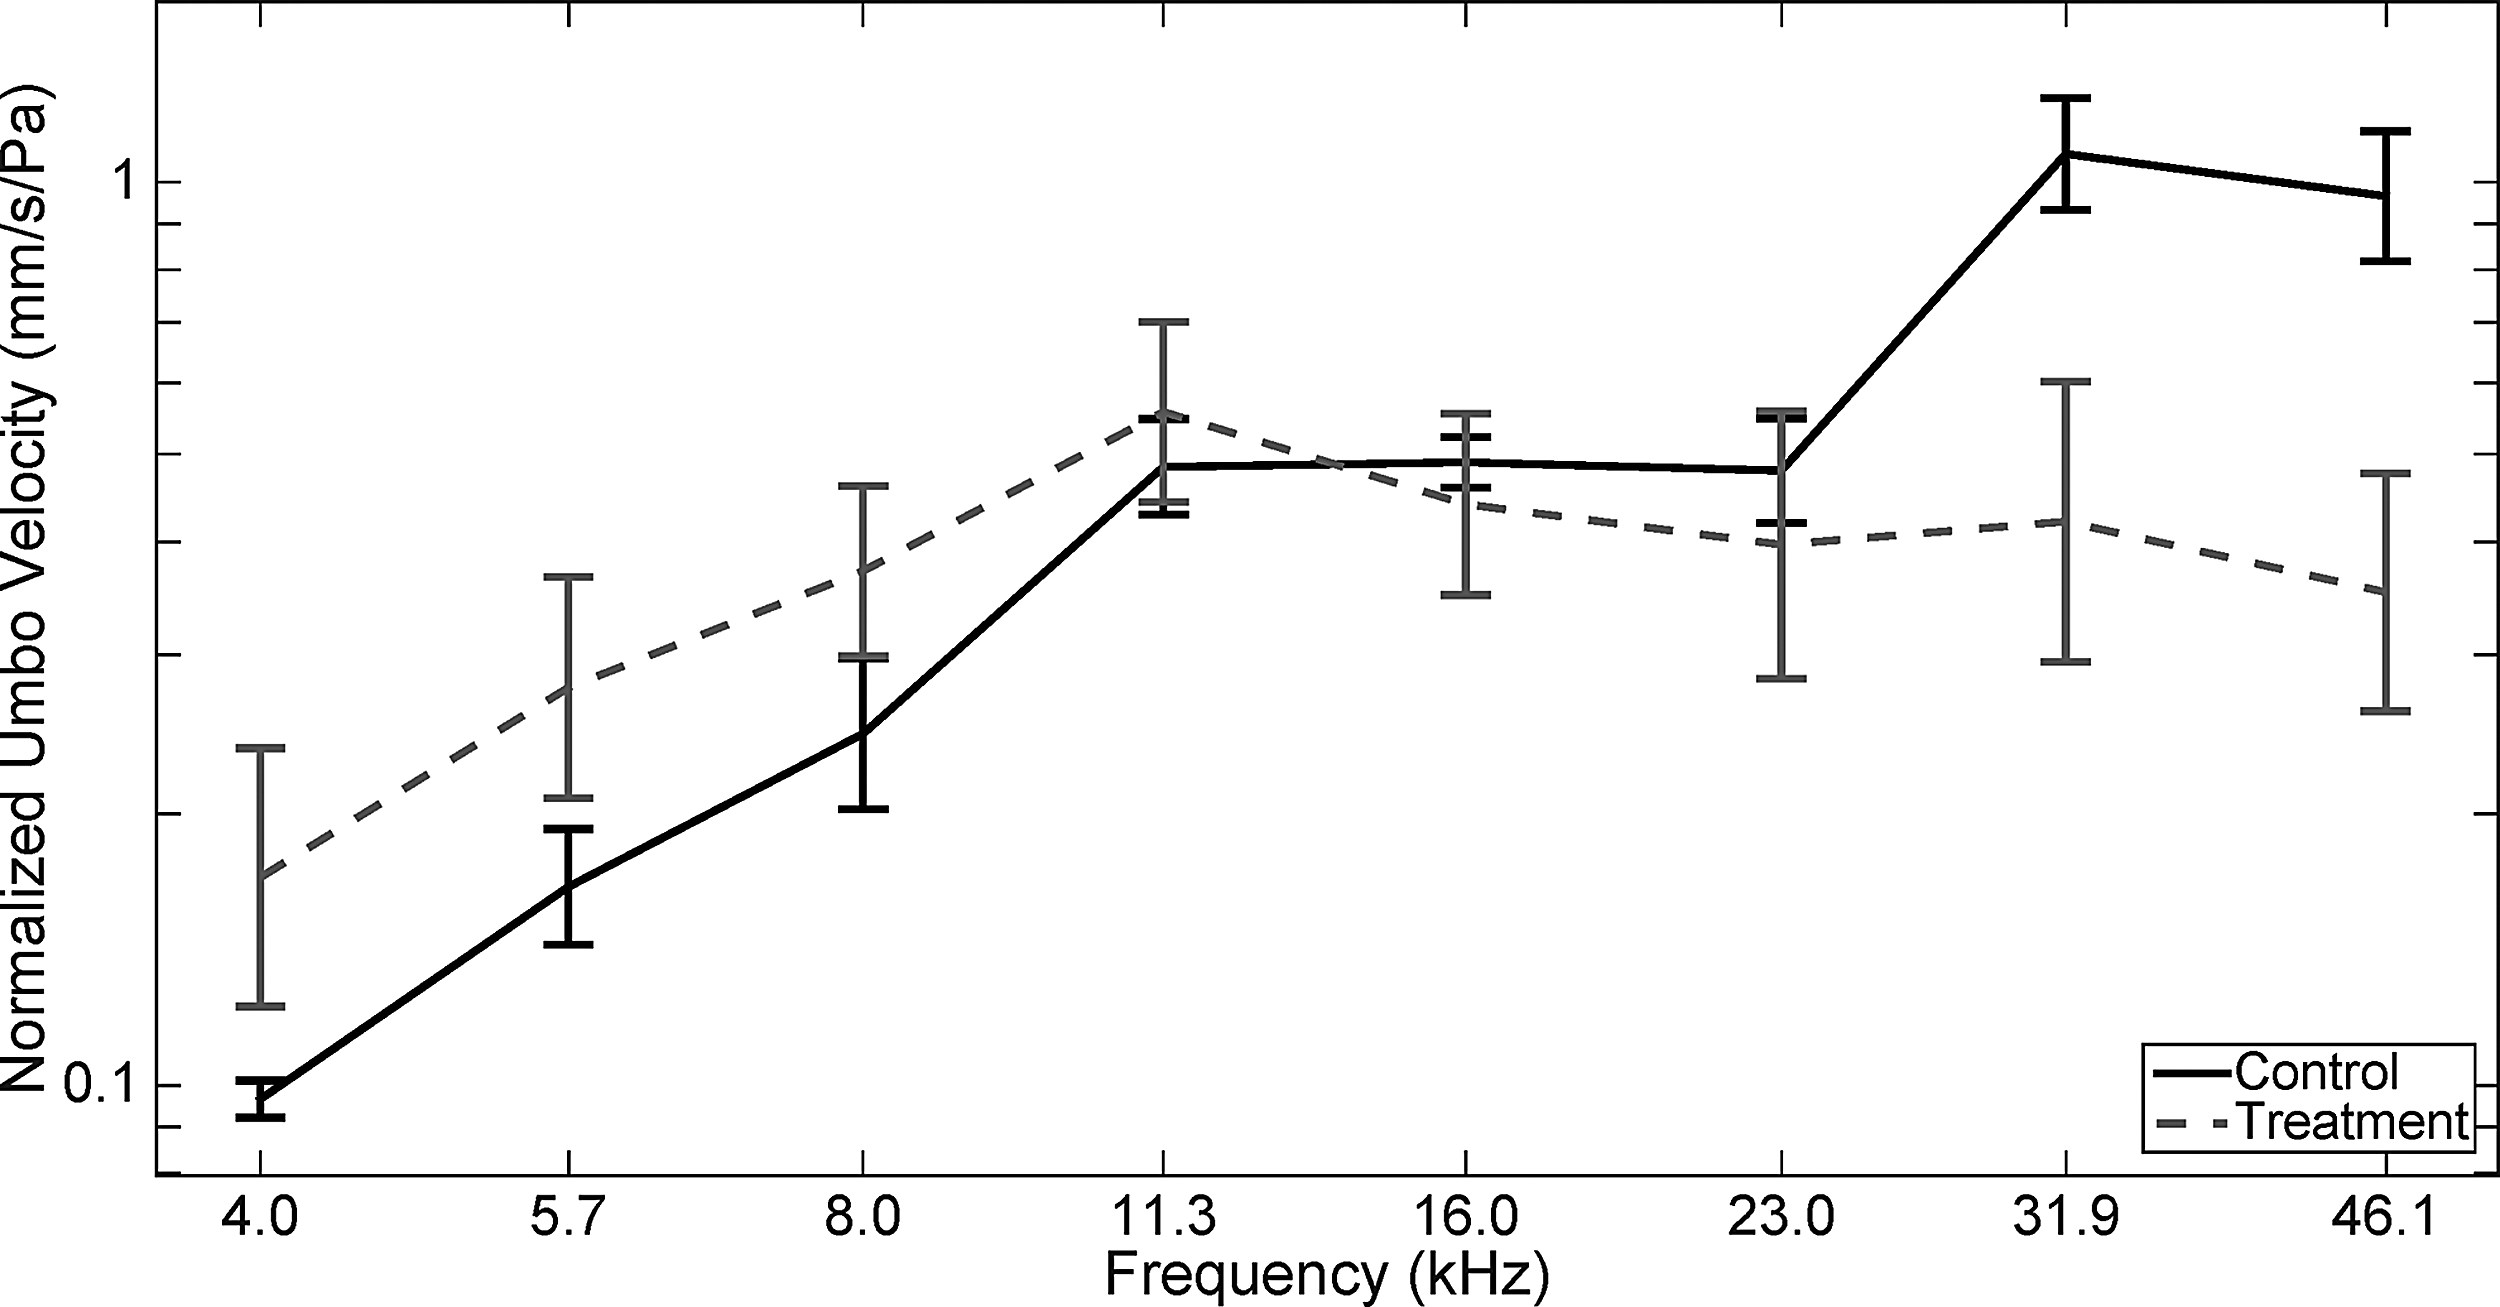
LDV results of HB-EGF treatment of chronic tympanic membrane perforations. The figure shows the mean umbo velocity (normalized by pressure at the tympanic membrane) of the control and treatment groups, grouped into frequency bins corresponding to the frequencies used for the ABR and DPOAE measurements. Standard error bars are shown at each frequency. In both groups, the normalized velocity increases from 4.0 to 11.3 kHz before leveling off, although slight differences can be observed at higher frequencies. Overall, no significant difference was found between the two groups except at 31.9 and 46.1 kHz (p < 0.001, p < 0.001), with the treatment group having a smaller LDV score (with the treatment group scoring on average 0.73 and 0.53 for 31.9 and 46.1 kHz, respectively, compared with 1.29 and 1.08 for control).
Tympanic membrane macroscopic appearance and correlation with LDV
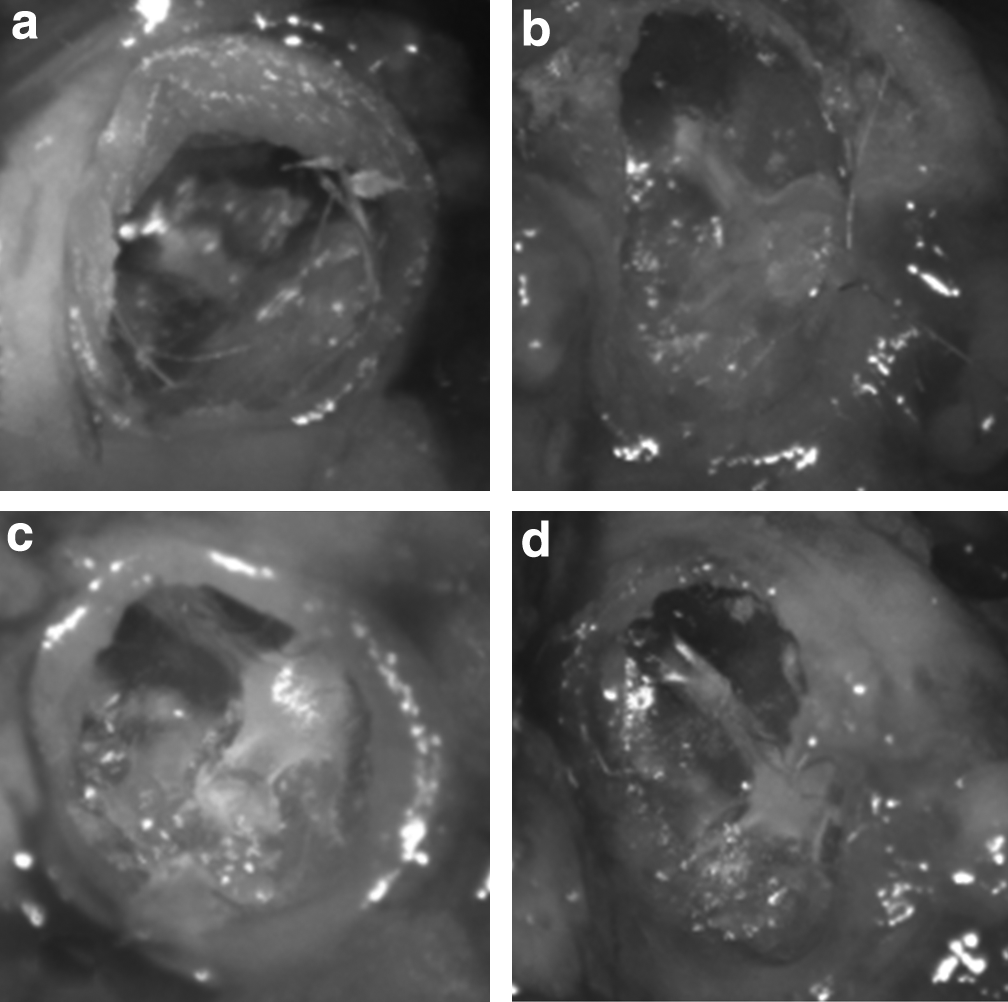
The macroscopic appearances of the TMs immediately before LDV are shown in Figure 5. Healing with tympanosclerosis at the umbo attachment was seen in mouse M3T, which also had a low-magnitude response with LDV (not shown). M8 shows a small healed fracture at the malleus handle, a complication that likely occurred during the initial creation of the perforation model. Other low-magnitude responders (M4, M6, M9, and M10, not shown) were noted to have significant dry debris, which required cleaning with a fine-tipped brush and saline before measurement using LDV. Examples (M6, M9) of the before and after cleaning images of two of these TMs are shown in Figure 6. There were no subjective macroscopic features of the other TMs of note.

Microscopic appearance of the tympanic membrane cohort. The figure shows the microscopic appearance of the TMs before measurement with the LDV. The samples are labeled according to mouse (M) and whether the sample is the control (C) side or the treatment (T) side. Sample M5C is shown as the LDV lining up the laser target onto the reflective bead to demonstrate the anatomical location of the measurements.
Sample tympanic membranes before and after debris removal. The figure shows examples (M6, M9) of the before and after cleaning images of the TMs (M6 before
Discussion
The efficacy of HB-EGF, at this dose and in this delivery method, to regenerate chronic TM perforations, including histological closure, in animal models has already been shown.2,5,11 In particular, it has advantages over other proposed growth factors in efficacy and in the ability to stimulate keratinocyte progenitors to proliferate and migrate.5,11,12 It is thought to work by both epidermal growth factor receptor-dependent and independent mechanisms to primarily stimulate proliferation and migration of tympanic membrane progenitor cells.3,5 Using this model, the histology of healing has been shown to resemble that of normal TMs. Just as in real-life situations, some TMs in this model heal without any macroscopic changes, while others heal with tympanosclerosis of differing degrees. This occurs with and without the presence of normal eustachian tube dysfunction or bacteria in the middle ear.5,11,12 Using the same model, safety and nontoxicity (both ototoxicity and systemic toxicity) have been demonstrated.5,11–14 Other emerging regenerative methods for the potential treatment of chronic TM perforations either demonstrate poor efficacy or still need to be evaluated in terms of functional outcomes.15–25
In vivo testing of hearing function in animal models relies on the ABR and DPOAE.26–28 Auditory evoked potentials in mice are thought to be similar to that in humans, but reliance of measurement requires stability of a number of factors in the measuring suite.29,30 The core facility at our institution provides a regulated environment with the ability to standardize electrode configuration, both the stimulation and recording parameters, and the ability to calibrate the acoustic stimulus. Despite this standardized environment within the single institution, it is possible to have varied thresholds between institutions and between species of mice and so the internal controls are valuable. 27 Given that (with respect to hearing) ∼99% of murine genes have a human ortholog, the murine model is a suitable animal model to test the outcomes of preclinical treatment for hearing restoration. 31 The murine species used in this experiment has shown stable ABR responses up to around 12 months, at which time, deterioration and elevation of thresholds have been observed to occur.32,33 This may explain the small elevation, ∼10 dB that occurred in both the treatment and control ears at the final time point when the age of the mice was older than 12 months.
The LDV represents one of the best available methods to measure the vibration characteristics of the TM in situ, but is not without its limitations.34,35 Measuring more than one point can be performed in the same specimen, but when comparing between specimens, exact comparable anatomical locations must be used.36,37 In our study, we chose a point on the TM immediately adjacent to the attachment of the handle of malleus. Vibrations of TM at different locations vary with frequency and ideally more than one location should be measured for comparison. However, it would be technically challenging to match another exact anatomical location given the differences between individual animals. 38
In this study, LDV measurements could only be performed postmortem on treated and untreated ears. This precluded the possibility of measuring the vibration response after perforation, but before treatment, for comparison with the healed state. Nevertheless, the negative influence of TM perforations on sound-driven umbo velocity is well documented. 39 In our study, the LDV characteristics of the treatment group resembled that of control except at the two highest frequencies tested. There was no difference in ABR or DPOAE between the control and treatment groups, suggesting that the reported single-point 3D-LDV measurements are not well correlated with hearing at above 30 kHz in either the control group or the treated group. It is known that the TM breaks into modes at higher frequencies and these modes of vibrations are integrated along the malleus handle. 40
With regard to both ABR and DPOAE, our animal model suggests a return to function between 2 and 6 months after treatment. ABR thresholds had returned similar to the control levels at 2 months, but the DPOAE returned between 2 and 6 months. The DPOAE is more sensitive to conductive hearing loss as the signal travels through the middle ear once in the forward direction and the generated emission again in the backward direction, unlike the ABR where the response involves only one passage through the middle ear.28,35,41 Given the design of the study, as we did not directly follow a cohort of untreated chronic perforations over the long term, we are unable to comment on whether there is an effect of chronic perforations on the hearing, other than that created by the perforation itself, in the long term.
Using the best available methods for preclinical evaluation in animal models, it is likely that HB-EGF regeneration of chronic tympanic membrane perforations, in an animal model, returns the tympanic membrane to near-normal function. The effect of this TM regeneration in restoring hearing function is highlighted by the partial loss of hearing after chronic perforation, which is returned to near-normal levels after treatment. Further work, including optimal duration of therapy, is required before translation into humans.
Footnotes
Acknowledgments
This study received support from the Garnett Passe and Rodney Williams Memorial Foundation, Stanford's SPARK, Stanford Child Health Research Institute, NIH R01AR057837 (NIAMS, Y.Y.), NIH R01DE021468 (NIDCR, Y.Y.), DOD W81XWH-10-1-0966 (PRORP, Y.Y.), R01 DC05960 (S.P.), and Wallace H. Coulter Foundation (Y.Y.).
Disclosure Statement
The authors disclose the following potential conflicts of interest: Filed patents: U.S. Non Provisional No. 61/823,749, April 2014 (P.S.M, S.K., Y.Y.); and U.S. Non Provisional No. 61/810,101, April 2014 (S.K., Y.Y.).