
Abstract
The ability of cells to secrete extracellular matrix proteins is an important property in the repair, replacement, and regeneration of living tissue. Cells that populate tissue-engineered constructs need to be able to emulate these functions. The motifs, KTTKS or palmitoyl-KTTKS (peptide amphiphile), have been shown to stimulate production of collagen and fibronectin in differentiated cells. Molecular modeling was used to design different forms of active peptide motifs to enhance the efficacy of peptides to increase collagen and fibronectin production using terminals KTTKS/SKTTK/SKTTKS connected by various hydrophobic linkers, V4A3/V4A2/A4G3. Molecular dynamic simulations showed SKTTKS-V4A3-SKTTKS (P3), with palindromic (SKTTKS) motifs and SKTTK-V4A2-KTTKS (P5), maintained structural integrity and favorable surface electrostatic distributions that are required for functionality. In vitro studies showed that peptides, P3 and P5, showed low toxicity to human adipose-derived stem cells (hADSCs) and significantly increased the production of collagen and fibronectin in a concentration-dependent manner compared with the original active peptide motif. The 4-day treatment showed that stem cell markers of hADSCs remained stable with P3. The molecular design of novel peptides is a promising strategy for the development of intelligent biomaterials to guide stem cell function for tissue engineering applications.
Introduction
T
Recently, human adipose-derived stem cells (hADSCs) have become an attractive source of cells for regenerative medicine and for tissue engineering applications such as heart valve tissue engineering due to their abundance, availability, pluripotency, and similarity to valvular interstitial cells.12,13 With bioactive small molecules such as peptides, one can target specific functions for tissue repair.14–18 A well-known pentapeptide motif from procollagen with the amino acid sequence KTTKS has been shown to stimulate production of collagen and fibronectin in human dermal fibroblasts and corneal fibroblasts, but never on stem cells.19–21 The molecular design of the peptide could be optimized further to be used for this specific purpose.
Molecular modeling provides efficient tools to design the molecular basis of biomimetic peptides.22,23 We here describe a novel peptide modification capable of enhancing the capacity of hADSCs to produce collagen and fibronectin that are involved in cross talk between cells and ECM, which is relevant to tissue engineering. 24
Materials and Methods
Computational modeling
Molecular modeling of a novel design of peptides with dual motifs
The three-dimensional molecular models of peptides were generated using Discovery Studio, v3.5 (Accelrys) 25 (Table 1). Seven peptides (named peptide [P1] to peptide [P7]) were designed. Three types of terminals (derived from the functional motif KTTKS) were used in the modeling to assess their structural contributions: (i) KTTKS; (ii) SKTTK, an inverse form of KTTKS; and (iii) SKTTKS, a palindromic motif. To identify suitable linkers for connecting these hydrophilic motifs, three types of hydrophobic linkers comprising small amino acids were examined: (i) V4A3, (ii) V4A2, 26 and (iii) A4G3. For each system, four peptide chains were produced and aligned at regular spatial intervals to provide possibilities to increase stability by intermolecular hydrogen bonds and hydrophobic interactions.
Molecular dynamic simulations
The peptides were prepared to perform molecular dynamic (MD) simulations using GROMACS simulation package, V4.5.4.27,28 The GROMOS96 force field was applied to the structures. 29 The peptides were solvated with SPC3 30 water model in a cubic box with a size of 1.5 nm. Periodic boundary conditions were applied in all directions and the systems were neutralized by adding counter ions. The resulting systems contain ∼50,000 atoms. A twin range cutoff was used for long-range interactions: 0.8 nm for van der Waals interactions and 1.4 nm for electrostatic interactions. All bond lengths were constrained with the LINCS 31 algorithm. The SETTLE 32 algorithm was applied to constrain the geometry of water molecules. The steepest descent algorithm was applied to energy minimize the systems with a tolerance of 2000 kJ/mol/nm. The energy-minimized systems were subjected to 100 ps pre-equilibration. They were subsequently subjected to 30 ns of production MD simulations with a time step of 2 fs at constant temperature (300 K), pressure (1 atm), and number of particles, without any position restraints. 33 Snapshots were collected at every 10 ps. The tools available within GROMACS were used to analyze the collected trajectories. The initial phase of MD simulation (5 ns) was an equilibration period for the systems, thus it was not considered for analyses.
Cluster analysis
The representative structures were selected using cluster analysis, in which the collected trajectories with 3000 structures were grouped into clusters based on their structural deviation. The top-ranked cluster that represented a frequently occurring conformation was chosen from each system for representation. The collected structures were analyzed using Discovery Studio and PyMOL. 1
Surface electrostatic potential calculation
The representative structure from each system was used to calculate electrostatic distribution by solving a linear Poisson–Boltzmann equation. The PARSE force field was applied to the structures using PDB2PQR v1.8. 34 The Adaptive Poisson–Boltzmann Solver tools were utilized to calculate the electrostatic surface potential with dielectric constant of 80 and 2 for solvent and solute, respectively. 35
In vitro experiments
Materials
All chemicals were purchased from Sigma Chem. Corp., unless otherwise specified.
Peptides
Four peptides (Table 2) were purchased from Activotech with peptide purity >95% provided by the company through analytical high-performance liquid chromatography and mass spectrometry.
Methods
Cell culture
hADSCs were purchased from Lonza (PT-3273; Lonza) and cultured in culture medium comprising adipose-derived stem cell basal medium, 10% fetal calf serum (FCS), 1%
Peptide preparation
Peptides P0, PA, P3, and P5 were prepared at 1.25, 12.5, and 125 μM. The samples in the form of powder were weighed out in a biological class II safety cabinet (Thermo Scientific; MSC-Advantage), dissolved in minimal dH2O with sonication (Ultrawave) for 10 min, and reconstituted with 2% FCS culture medium.
Cell morphology and metabolic activity assay for hADSCs
Triplicates of hADSCs between passages 2 and 4 were seeded into 24-well plates with 10,000 cells/well in 500 μL of 10% FCS for 24 h to allow cell adhesion. Medium was changed to 2% for 24 h to allow cell synchronization. This was followed by exchanging the medium with 500 μL of 2% FCS as negative control, 2% FCS with 250 μM ascorbic acid additive as positive control, and 2% FCS with 125 μM of peptides P0, PA, P3, and P5. All samples were cultured for 4 days, followed by observation under a light microscope (Nikon) and cell metabolic activity was determined using the MTS assays (CellTiter 96 Aqueous One Solution Cell Proliferation Assay; Promega). After 4 h of incubation at 37°C, 100-μL aliquots were taken and the absorbance at 450 nm was determined with a 96-well plate reader (TECAN; Infinite F200 Pro).
Immunostaining of fibronectin and collagen
hADSCs between passages 2 and 4 were seeded in eight-well chamber slides with 3000 cells/well in 200 μL of 10% FCS for 24 h to allow cell adhesion. Medium was changed to 2% for 24 h to allow cell synchronization. This was followed by exchanging the medium with 200 μL of 2% FCS as a negative control; 2% FCS 1 mM
Collagen quantification
Triplicates of hADSCs between passages 2 and 4 were seeded in eight-well chamber slides with 3000 cells/well in 200 μL of 10% FCS for 24 h to allow cell adhesion. Medium was changed to 2% for 24 h to allow cell synchronization. This was followed by exchanging the medium with 200 μL of 2% FCS as a negative control, 2% FCS with 250 μM ascorbic acid as a positive control, and 2% FCS with (1.25, 12.5, and 125 μM) peptides P0, PA, P3, and P5. Ascorbic acid was used as a positive control due its ability to activate procollagen gene transcription and stabilization of its mRNA and to stimulate crosslinking between the collagen triple helix by stimulating the enzyme prolyl hydroxylase.19,36–38 All samples were cultured for 4 days before analysis. The level of collagen expression was measured using the protocol modified from Jones et al. 21 At day 4, media were removed and the collagen deposited on the surface was analyzed. Seventy percent ice-cold ethanol was used to fix deposited materials on the surface of culture dishes. To ensure complete fixation of the collagen deposited on the surface, samples were transferred to −80°C for 30 min. The ethanol was removed and samples were treated with 0.1% Sirius red/picric acid solution overnight at 4°C with gentle agitation. The unbound dye was removed on the following day with six gentle washes using distilled water. Samples were then treated with 150 μL of 1 M NaOH to dissolve the collagen–dye complex with gentle agitation for 30 min at room temperature. Then, 100 μL of the aliquots was transferred into a 96-well plate and absorbance measurements were taken at 540 nm using a plate reader (TECAN; Infinite F200 Pro). Type I rat tail collagen (Corning®) was used to construct a standard curve by drying known concentrations of the collagen on tissue culture plastic and treating with the protocol described above. All data are represented as mean ± standard deviation.
Fibronectin enzyme-linked immunosorbent assay
Triplicates of hADSCs between passages 2 and 4 were seeded in eight-well chamber slides with 3000 cells/well in 200 μL of 10% FCS for 24 h to allow cell adhesion. Medium was changed to 2% for 24 h to allow cell synchronization. This was followed by exchanging the medium with 200 μL of 2% FCS as a negative control; 2% FCS containing 1 mM
Flow cytometry analysis
Flow cytometry analysis (FACS) was used to investigate the incidence of stem cell surface marker expression for hADSCs treated with P3. Triplicates of 1 × 10⁶ hADSCs were plated in T25 cell culture flasks and allowed to adhere overnight. Medium was changed to 2% FCS for 24 h to allow cell synchronization. hADSCs were treated with 125 μM P3 for 4 days at 2% FCS before being harvested using trypsin (Sigma). hADSCs (5 × 10⁵/mL) were incubated with the primary antibody (all primary antibodies [CD44, CD90, CD105, CD73, CD45, CD61, CD31] were obtained from BD Biosciences except negative control, which is protein G-purified antibody [OX8 hybridoma obtained from ECACC]) in binding buffer (1 × PBS [Sigma]) containing 2% FCS (Sigma) for 30 min on ice. These were washed in binding buffer twice, then incubated with the secondary antibody (rabbit anti-mouse Ig FITC [Dako]) for 30 min on ice and kept in a dark room. Before FACS analysis, the cells were washed twice in the binding buffer and data were acquired on Beckman Coulter FC500 flow cytometer.
Statistical analyses
All the in vitro experiments were repeated a minimum of three times. All statistical analyses were performed with one-way analysis of variance with post hoc Tukey's multiple comparison test using PRISM6 software (GraphPad Software, Inc.) and p < 0.05 was considered significant. Data are presented as mean ± standard deviation unless stated otherwise.
Results
Structural analyses of peptides
The peptides with V4A3 linker
To analyze the structural stability of peptides to maintain their functional motifs, the representative structure for each peptide was selected from simulations using the cluster analysis. P1 did not maintain its stability during MD simulations (Fig. 1A), especially chains of the peptide were highly deviated. The number of hydrogen bonds (that maintain structural integrity) in P1 and P2 were comparatively less than P3 during MD simulations (Figs. 1A, B, and 2A). In P1 and P2, most of the hydrogen bonds were formed in their disordered states. On the other hand, the stability of P3 illustrates high possibility for ordered alignment of chains using the linker, V4A3, through intermolecular interactions (Figs. 1C and 2A).

Molecular interactions of linkers. The representative structures of the seven peptides are shown as ribbons;
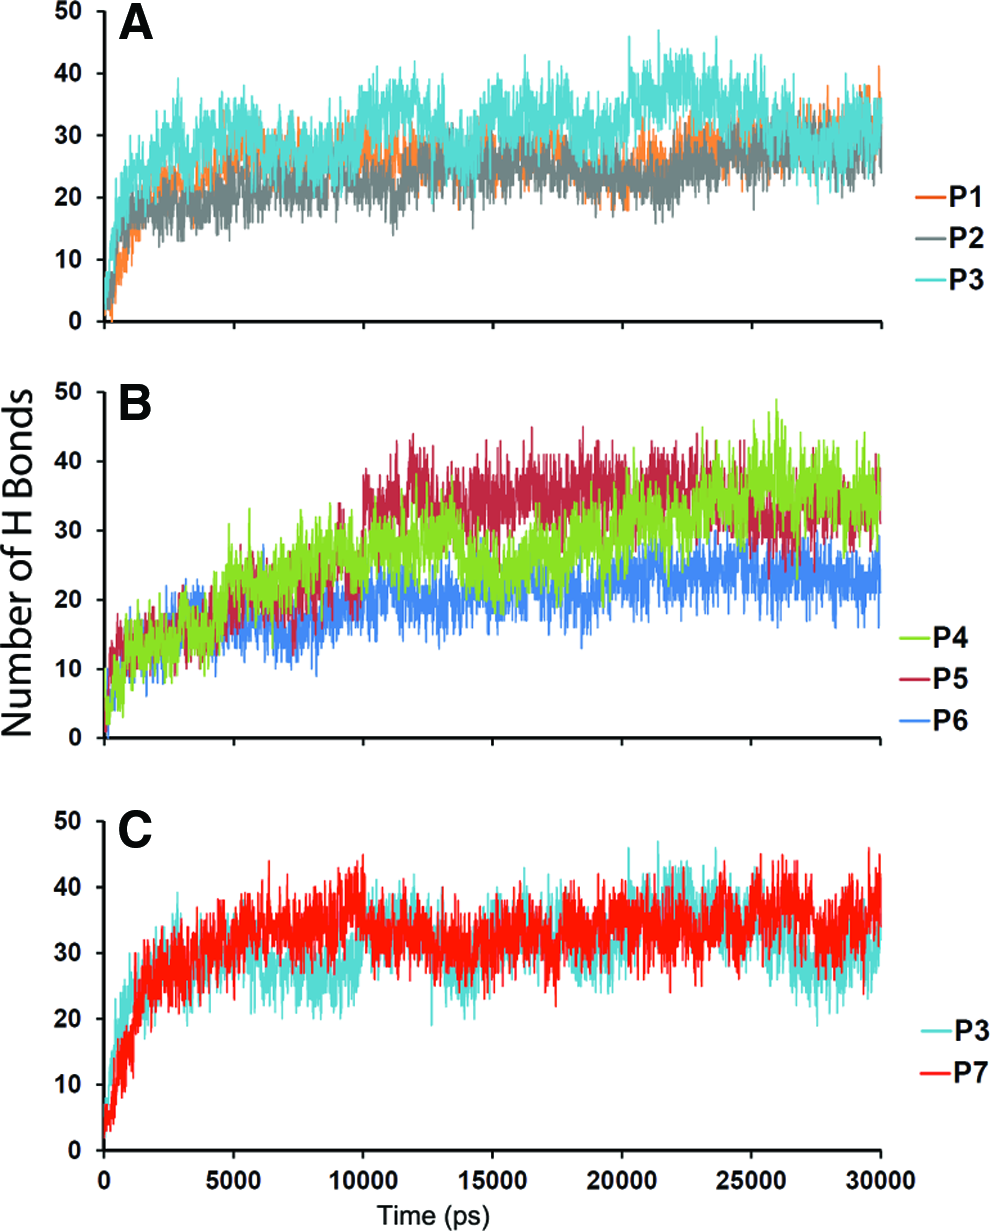
Dynamic interactions of peptides. Total number of intermolecular hydrogen bonds of peptides during molecular dynamic simulations;
The peptides with V4A2 linker
P4 and P6 displayed a disordered state that appeared like a spherical structure with a minimal possibility for projection of motifs on N- and C-terminals (Fig. 1D, F). Although they maintained their total number of hydrogen bonds in the course of the MD simulations (Fig. 2B), most of them were randomly formed in their disordered state. Interestingly, P5 was stable and exhibited possibility for ordered alignment with significant number of interchain hydrogen bonds, which were maintained in the course of MD simulation (Figs. 1E and 2B).
The peptide with A4G3 linker
To examine the positional contribution of residues in the linker region, P3 and P7 were modeled with the same length, but with a modified hydrophobic linker. The latter has A4G3 instead of V4A3. However, this modification did not appear to be sufficient for stability of chains (Fig. 1G). It probably leads the chains of P7 to form random self-folding or a disordered state. Although we observed an increase in the total number of hydrogen bonds during the simulation of P7 (Fig. 2C), the interchain hydrogen bonds were minimal and inconsistent. This demonstrates the importance of positioning four valine residues at the hydrophobic core, followed by three alanine residues for maintaining stability. This is consistent with the experimental study on the linker V4A2 of a peptide amphiphile, where the position of V4 is essential for mechanical stability. 26 These results show that the linkers of P3 and P5 appear to be stable to present the motifs at the terminals for their function.
Map of surface electrostatic distribution
The distribution of surface electrostatics demonstrated that peptides are positive in nature due to the four lysine residues in each chain except the negatively charged carboxylic group of C-terminals and a few hydrophobic patches in the middle (Fig. 3). The packing of hydrophobic residues using hydrogen bonds can be essential for the association of chains of peptides and presentation of charged motifs. P1 showed that its hydrophobic patches were not packed consistently (Fig. 3A). In peptides 2, 3, and 5, hydrophobic patches were packed in an ordered manner in the middle (Fig. 3B, C, and E). However, peptides 3 and 5 showed proper hydrophobic segmentation to act as a spacer between the charged terminals. The surface potential of peptides 4, 6, and 7 was irregularly packed and the motifs appeared not to be presentable (Fig. 3D, F, and G). Noticeably, in P7, both the terminals found each other and formed a ring-like structure. The results of P3 and P5 illustrate the importance of the molecular design with proper segmentation of electrostatic properties for presentation of motifs.

Electrostatic potential surface. Surface map of the representative structures are shown;
Radius of gyration
We have analyzed the conservation of association of chains during MD simulations by measuring the distribution of atoms around the central axis for each system (Fig. 4). P1 showed maximal fluctuation along the timescale and was unable to maintain the compactness (Fig. 4A), whereas peptides 2 and 3 were able to preserve the association of their chains and this is explained by the plateaus in the graph after the initial period of equilibration. In particular, P3 maintained the plateau at the same level throughout the simulation. Peptides 4, 6, and 7 exhibited a considerable decrease in association (Fig. 4B). In contrast, P5 preserved the integrity all over the simulation. The radius of gyration indicates that the association of chains of peptides 3 and 5 maintained their overall structural integrity.
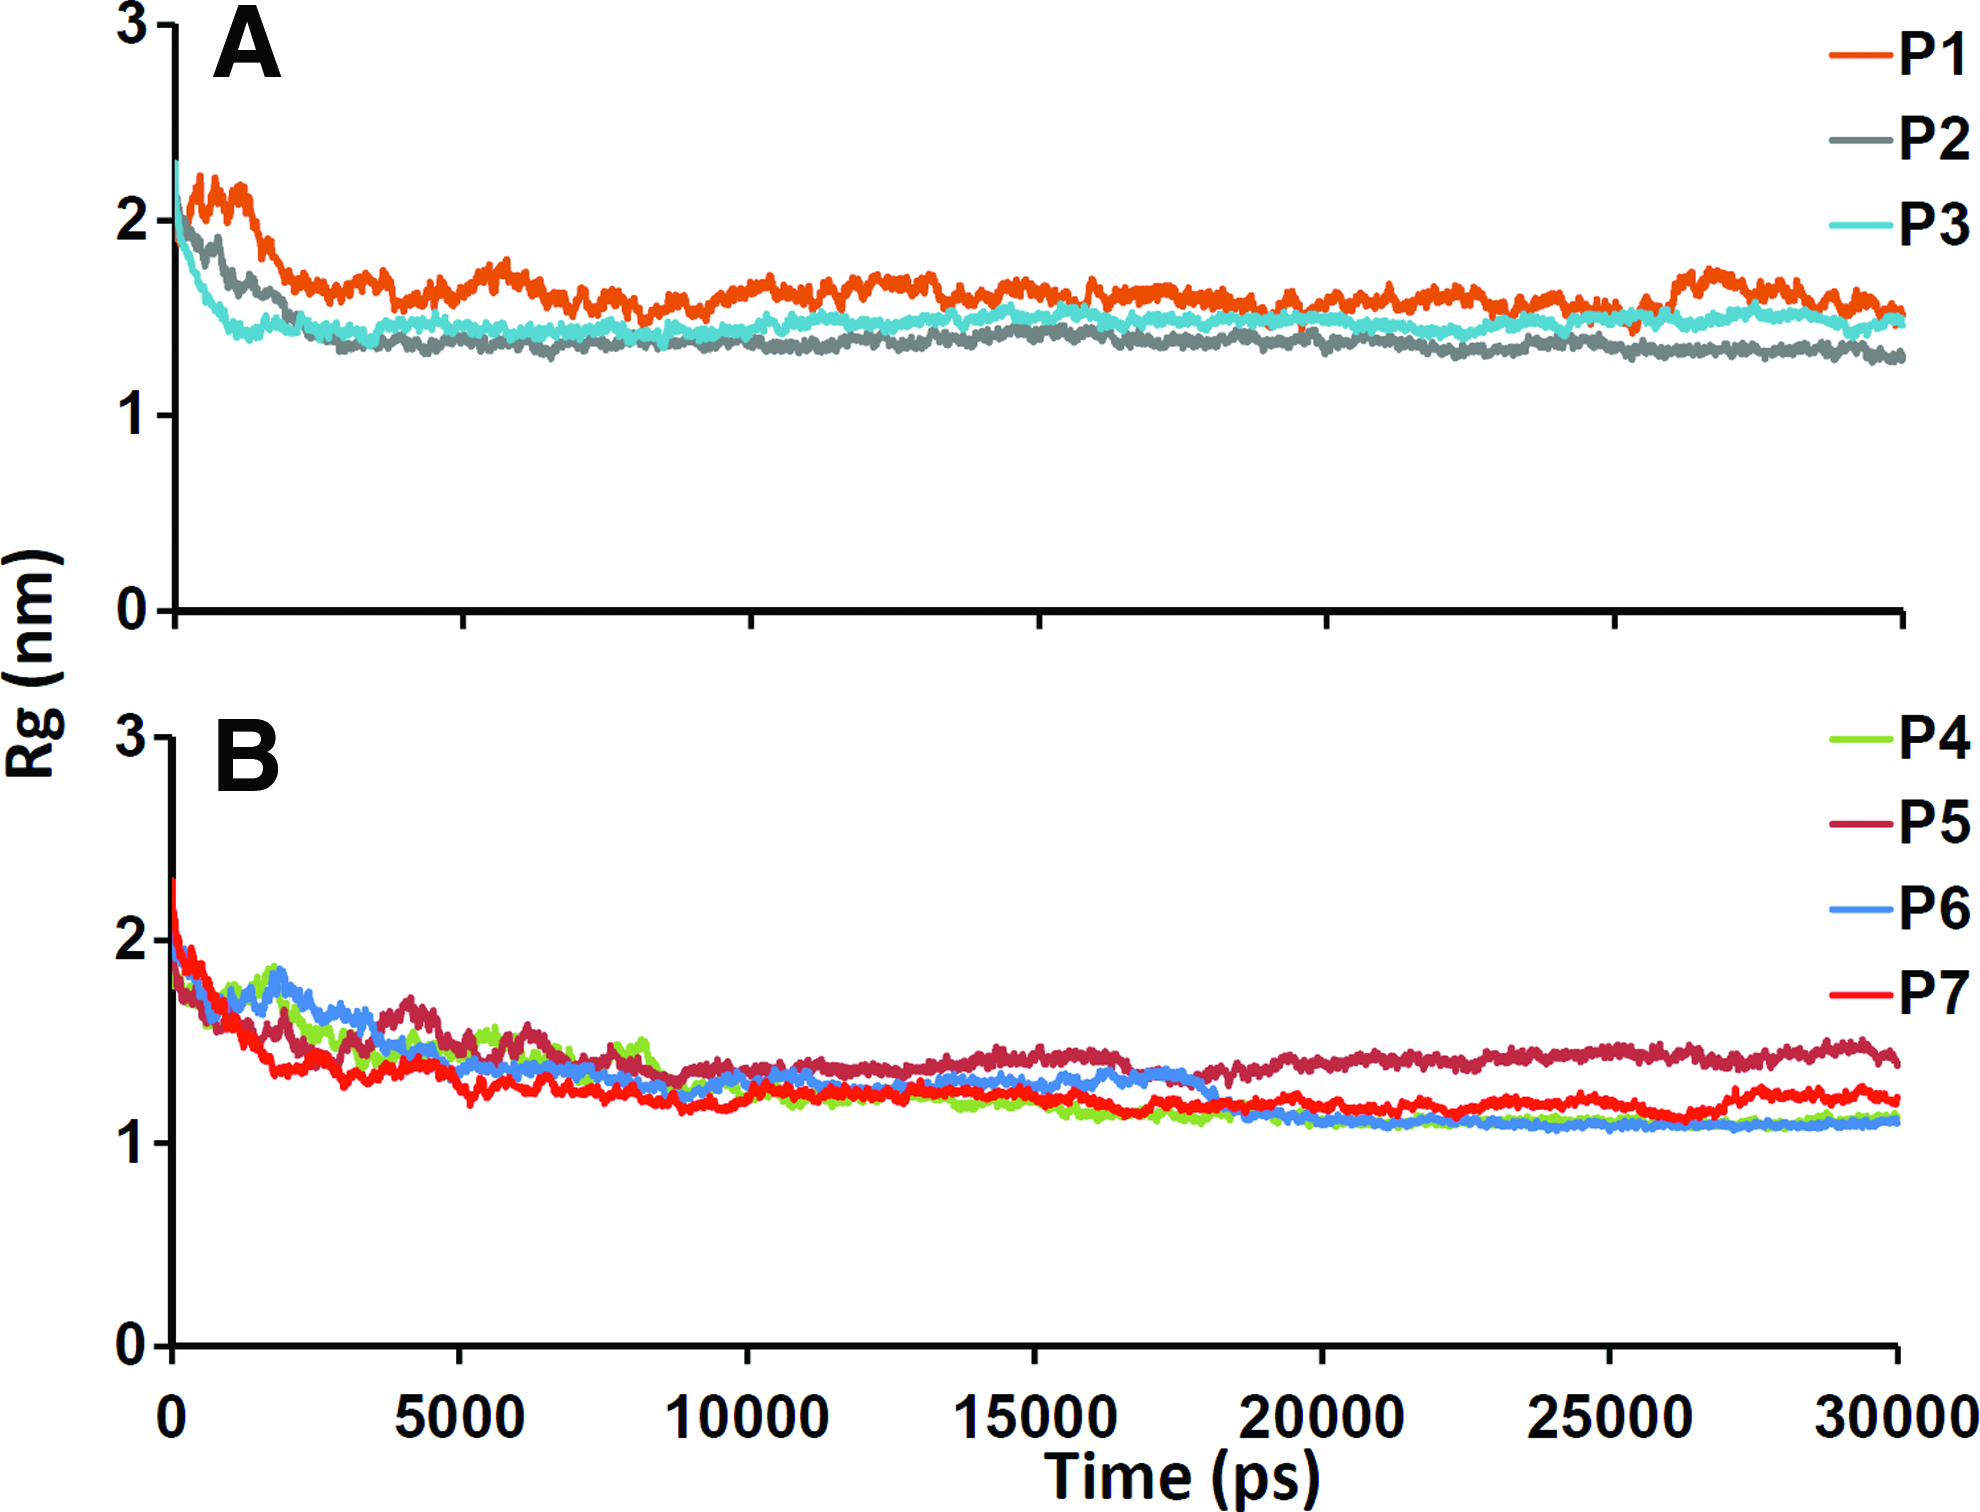
Radius of gyration. Dynamic molecular association around the central axis of each system.
Selection of peptides for in vitro experiments
Peptides 3 and 5 showed potential characteristics to form stable structures at the interchain level by regular hydrogen bonds. The possibilities were high for the presentation of their charged motifs due to the positioning of suitable segmentation of electrostatic properties. The structural packing of the linkers of these two peptides consistently maintained a similar pattern throughout their simulations. Therefore, these two peptides were prioritized from the modeling and examined along with the known peptide KTTKS (P0) and palmitoyl-KTTKS (PA) (Table 2) for their toxicity and their ability to stimulate hADSCs to secrete collagen and fibronectin in vitro.
Cell morphology and metabolic activity
The representative bright-field images of hADSCs (Fig. 5) showed (at the 125 μM peptide concentration) a typical fibroblast-like morphology after 4 days in culture with P0, P3, and P5, except PA that adopted a spherical morphology, as shown in Figure 5B.
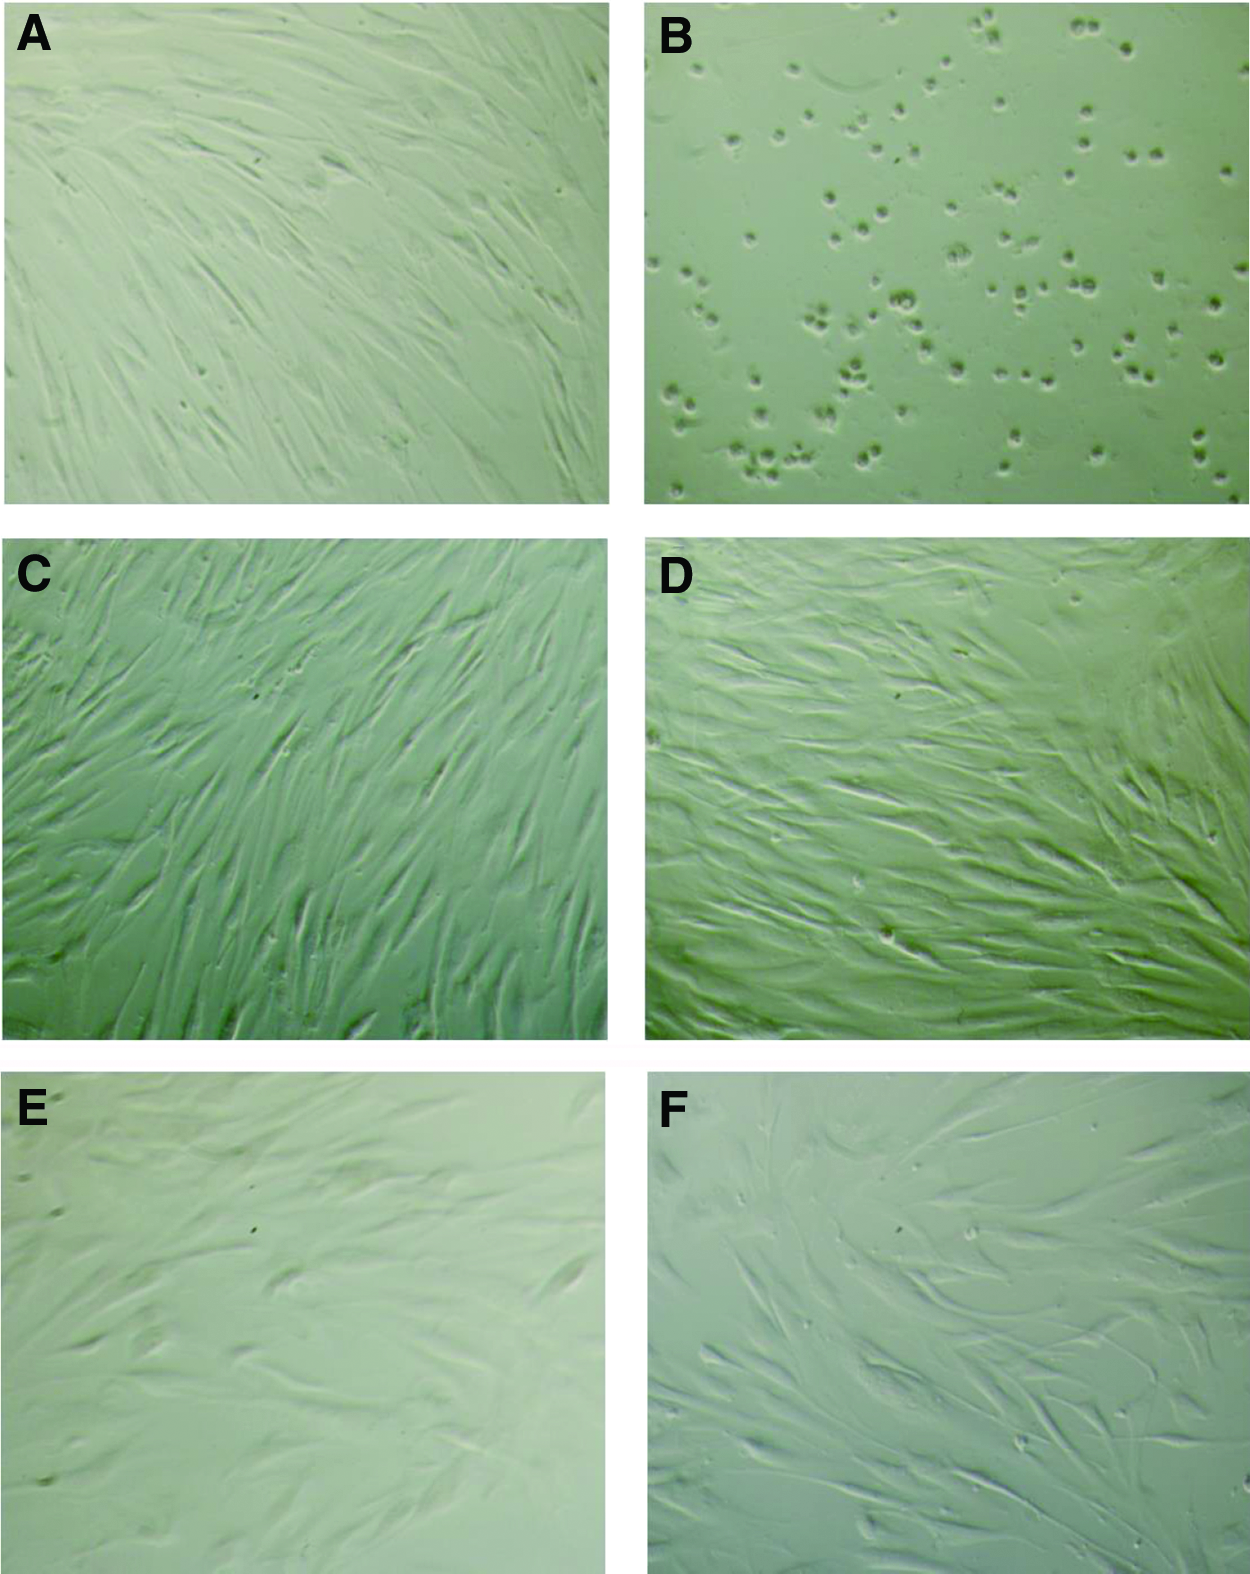
Bright-field images of hADSCs. The cells treated with 125 μM of peptides at 4 days.
Figure 6 shows the assessment of cell metabolic activity after 4 days of culture with the peptide through MTS assay. The negative control, ascorbic acid, P0, P3, and P5 showed optical density reading of 0.188 (±0.027), 0.159 (±0.029), 0.146 (±0.037), 0.169 (±0.020), and 0.149 (±0.028), respectively. Positive control, P0, P3, and P5 showed no statistically significant difference between negative controls at p < 0.05, except the PA that showed significant reduction of MTS with optical density reading of 0.016 (±0.003).
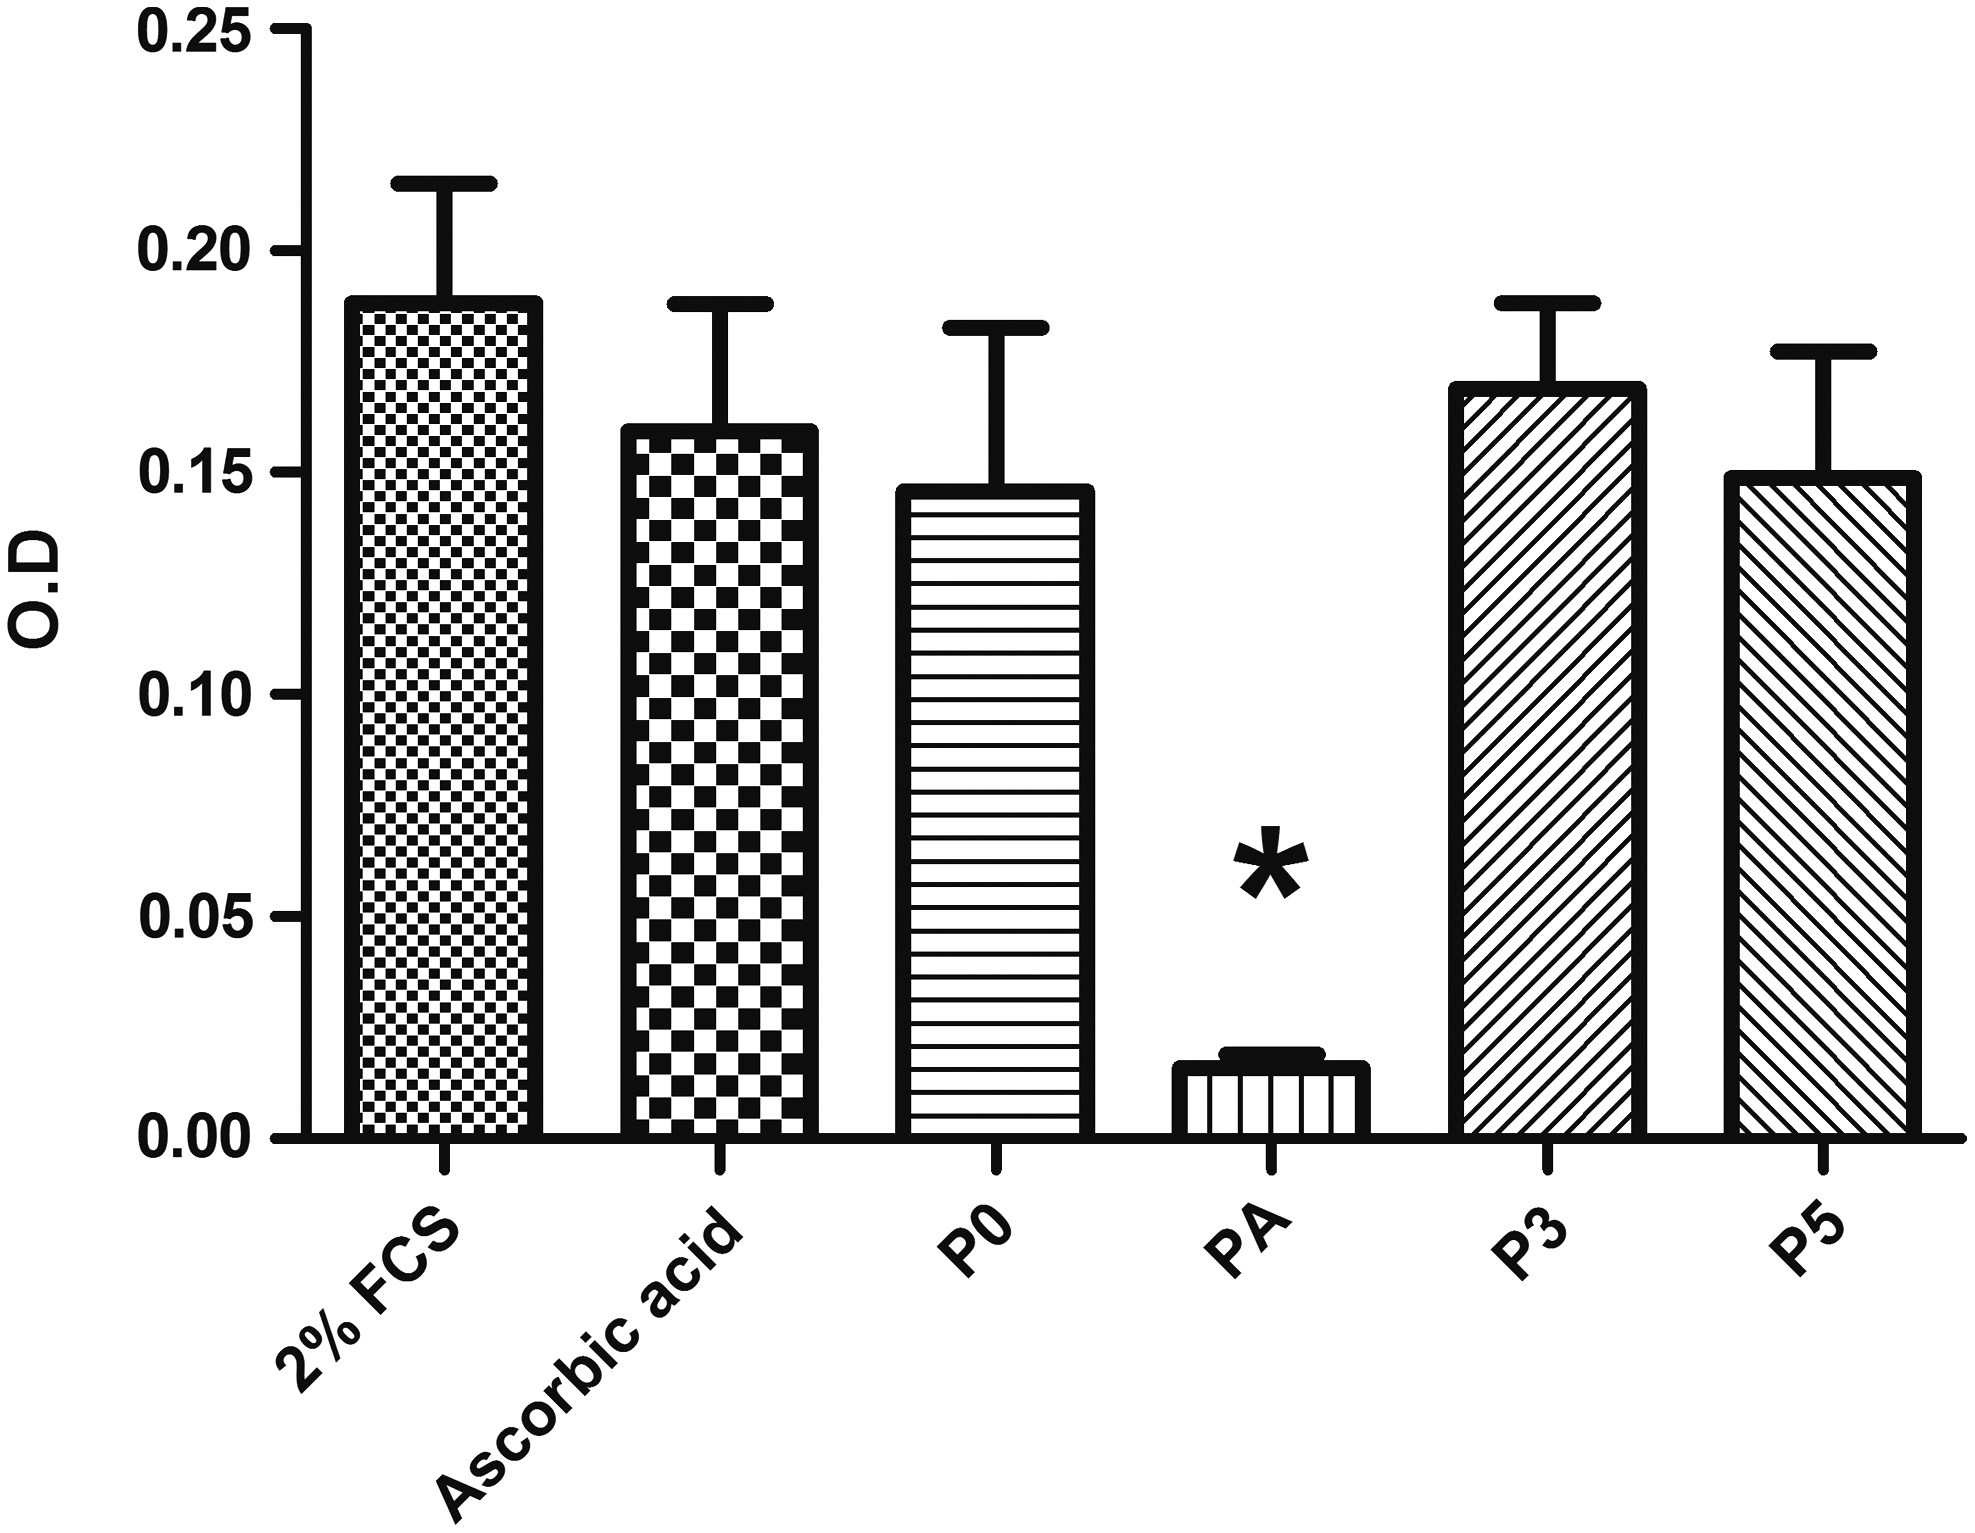
Metabolic activity of hADSCs. After 4 days of treatment with negative control (2% FCS), positive control (250 μM ascorbic acid), and 125 μM of peptides, KTTKS (P0), palmitoyl-KTTKS-COOH (PA), peptide 3 (P3), and peptide 5 (P5). (Data are expressed as mean ± SD, *p < 0.05 compared with the negative control, n = 3). FCS, fetal calf serum; SD, standard deviation.
Immunofluorescence of fibronectin and collagen
Figure 7 shows the immunofluorescence images of collagen (red) and fibronectin (green) with increase in dosages of the peptide concentration at 1.25, 12.5, and 125 μM at 20 × magnification. Qualitatively, P0, P3, and P5 showed increased staining of collagen and fibronectin in a dosage-dependent manner. However, PA showed no increase in staining of collagen and fibronectin with increasing peptide concentration. Furthermore, at 125 μM, PA had a negative influence on cell proliferation, therefore a lack of staining was observed most likely due to cell detachment during the staining process. At 125 μM, P0, P3, and P5 showed significant increases in the staining of collagen and fibronectin compared with the negative control. P3 showed the most prominent fibronectin and collagen staining, followed by P5 and P0.

Immunostaining of Fibronectin and Collagen. Immunofluorescence staining of fibronectin (green) and collagen (red) of KTTKS (P0), palmitoyl-KTTKS-COOH (PA), peptide 3 (P3), and peptide 5 (P5) with increase in concentration at 1.25 M, 12.5 M, and 125 μM. Negative control comprises 2% FCS and positive control comprises 2% FCS 1 mM
Collagen stimulation
Figure 8 shows quantitated collagen deposition through Sirius red analysis. The negative control showed deposition of 22.44 (±1.20) μg/mL and the positive control showed 29.46 (±0.91) μg/mL. Increasing peptide concentrations of P0 at 1.25, 12.5, and 125 μM showed increasing collagen deposition at 21.25 (±0.75), 22.95 (±1.45), and 29.03(±3.91) μg/mL, respectively. Increasing peptide concentration of PA at 1.25, 12.5, and 125 μM showed increasing collagen deposition at 24.98 (±2.73), 24.78 (±5.99), and 39.39(±3.39) μg/mL, respectively. Increasing peptide concentration of P3 at 1.25, 12.5, and 125 μM showed increasing collagen deposition at 21.86 (±1.41), 23.07 (±1.61), and 56.00 (±3.12) μg/ml, respectively. Increasing peptide concentration of P5 at 1.25, 12.5, and 125 μM showed increasing collagen deposition at 23.53(±1.34), 24.50 (±1.29), and 42.86 (±1.53) μg/mL, respectively.
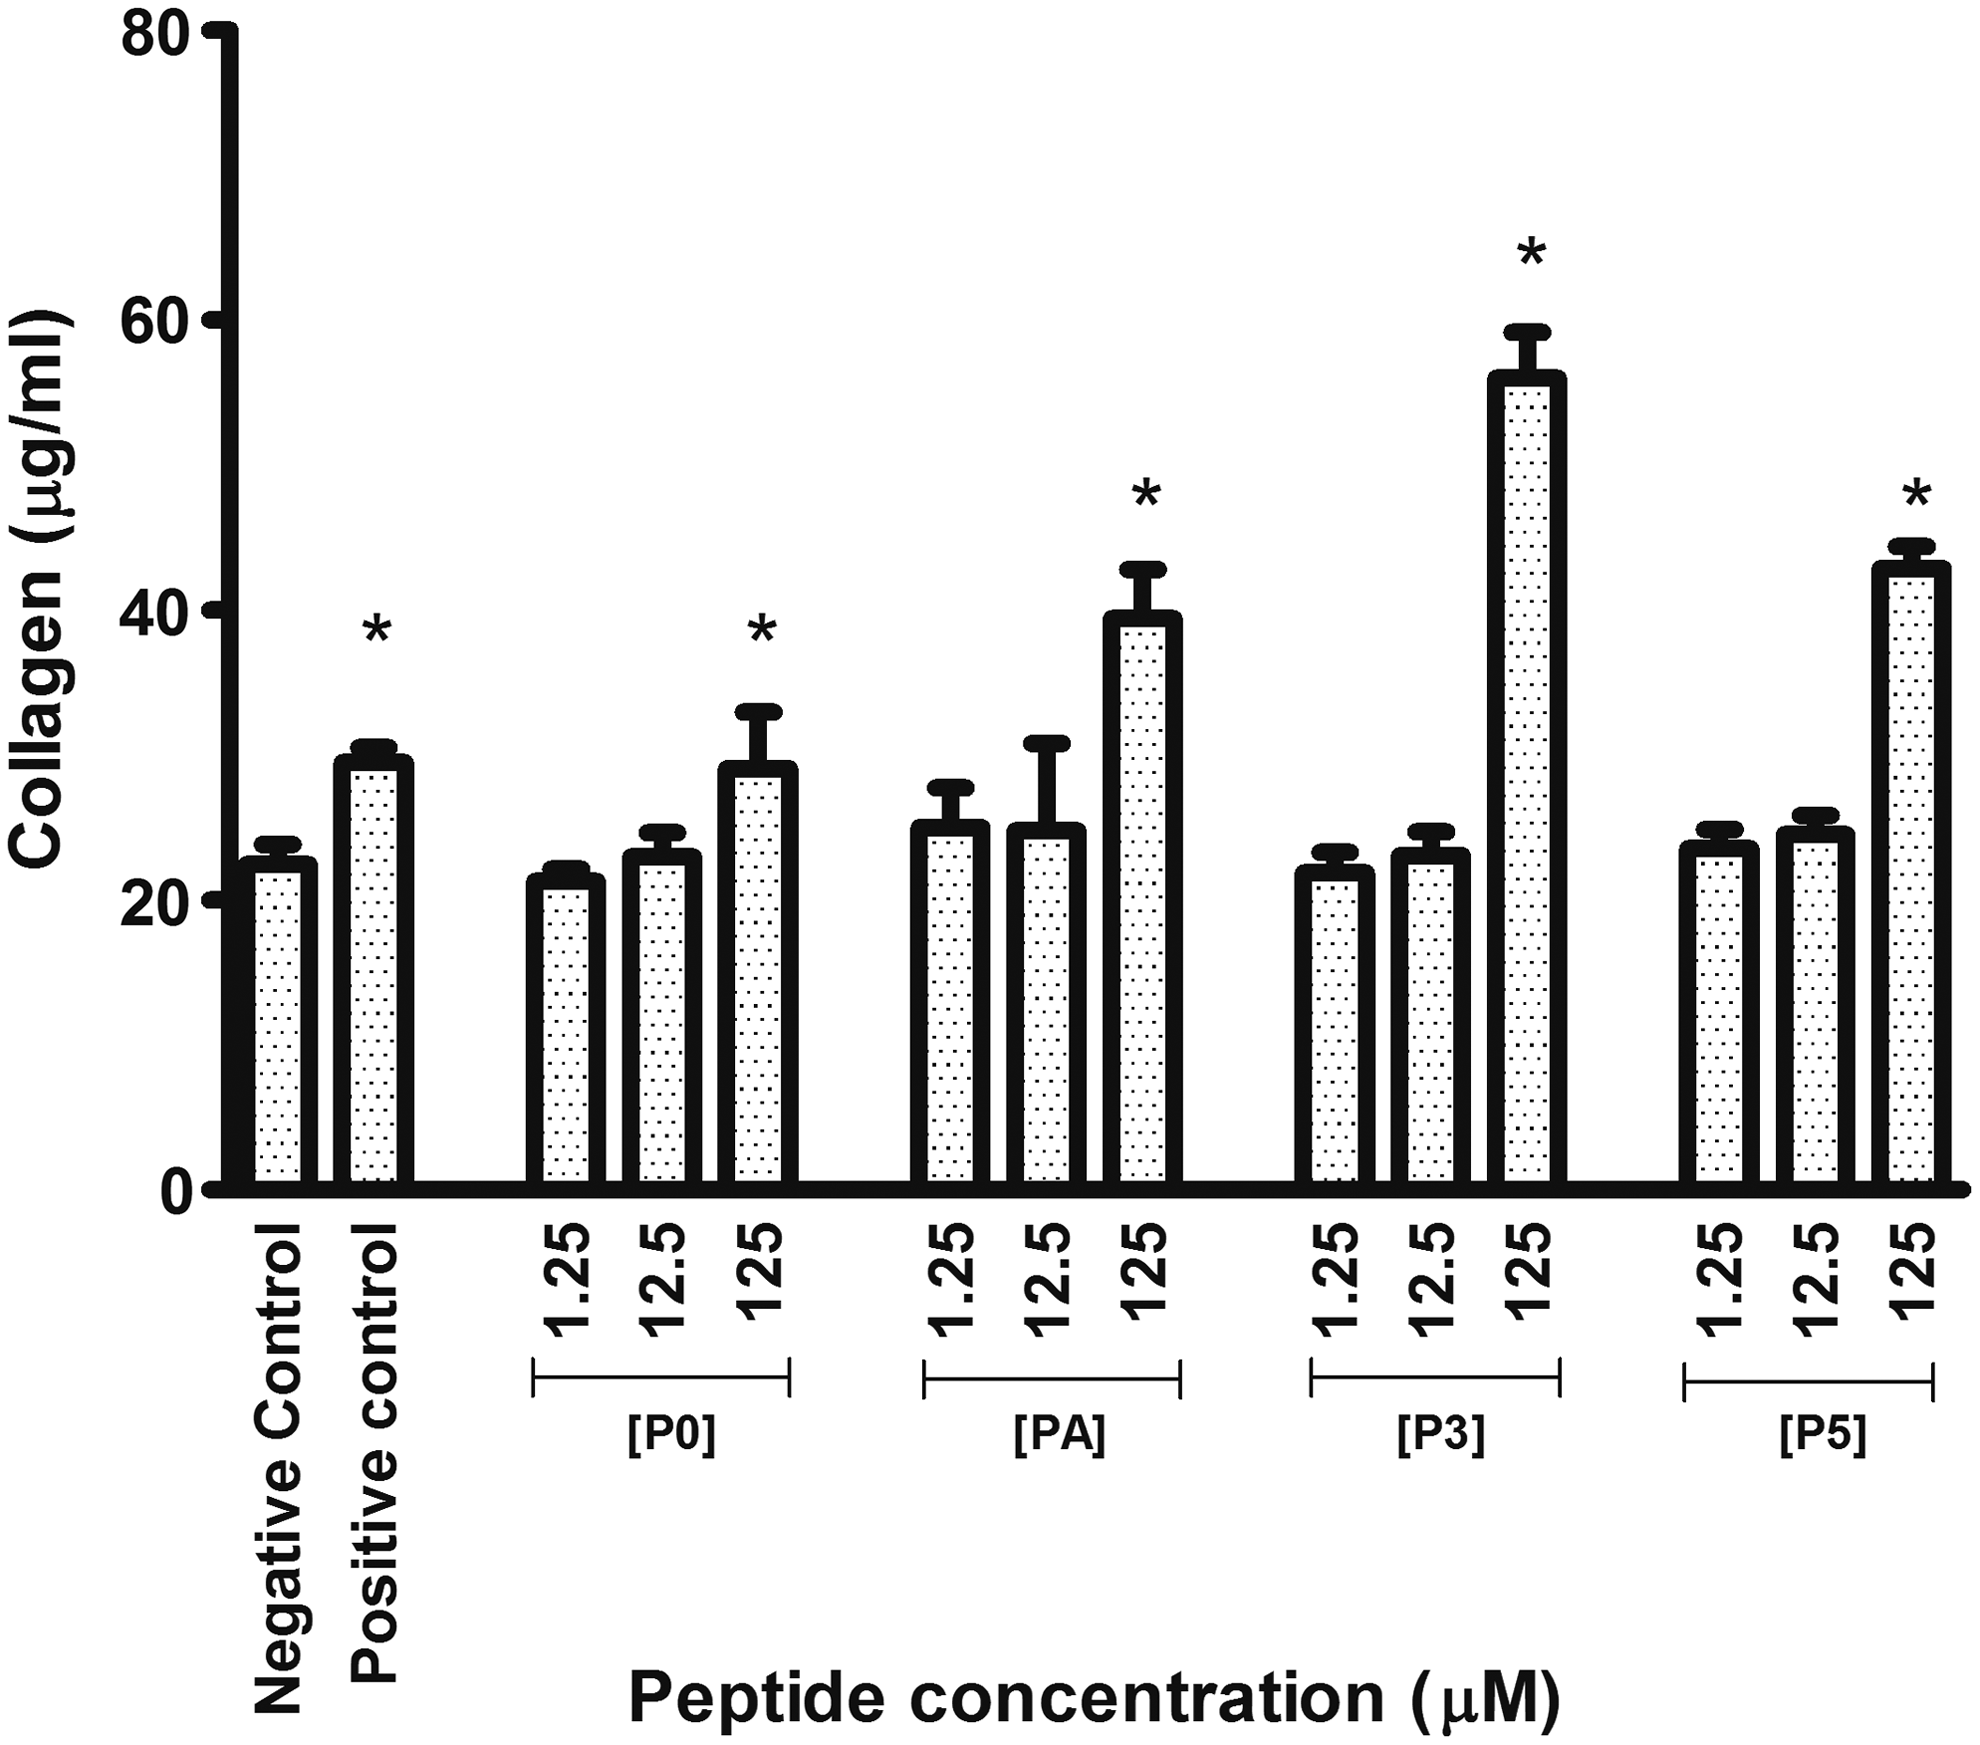
Concentration-dependent stimulation of collagen by hADSCs. (P0) KTTKS, (PA) palmitoyl-KTTKSCOOH, (P3) peptide 3, and (P5) peptide 5. Negative control comprises 2% FCS and positive control comprises 2% FCS with 250 μM ascorbic acid. All data are expressed as mean ± SD, *p < 0.05 compared with the negative control, N = 3. Observed on eight-well chamber slide with increased concentration of peptide at 1.25, 125, and 125 μM over 4 days.
There were no statistically significant differences between the negative control and P0, PA, P3, and P5 at 1.25 and 12.5 μM. However, at 125 μM, all these peptides showed statistically significant increase of collagen production compared with the negative control. Statistical comparison at p < 0.05 shows that the P3 peptide at 125 μM had the most significant increase [56.00 (±3.12) μg/mL) in collagen production compared with P5 [42.86 (±1.53) μg/mL], PA [39.39 (±3.39) μg/mL], and PO [29.03(±3.91) μg/mL].
Fibronectin stimulation
Figure 9 shows the quantitated fibronectin deposition using ELISA. The negative control showed 29.97(±2.61) ng/mL and positive control showed 88.03 (±1.18) ng/mL. Increasing peptide concentration of P0 at 1.25, 12.5, and 125 μM showed increasing fibronectin deposition at 33.37 (±2.40), 36.10 (±0.85), and 43.42 (±1.68) ng/mL, respectively. There were no statistically significant differences between the negative control and P0 at 1.25 and 12.5 μM. However, 125 μM of P0 showed increased fibronectin production compared with the negative control; 1.25 and 12.5 μM of PA showed no significant change in fibronectin deposition compared with the negative control at 37.12 (±0.60) ng/mL and 34.06 (±1.80) ng/mL, respectively. However, 125 μM of PA showed a statistically significant decrease of fibronectin production compared with the negative control at 17.62 (±1.15) ng/mL.
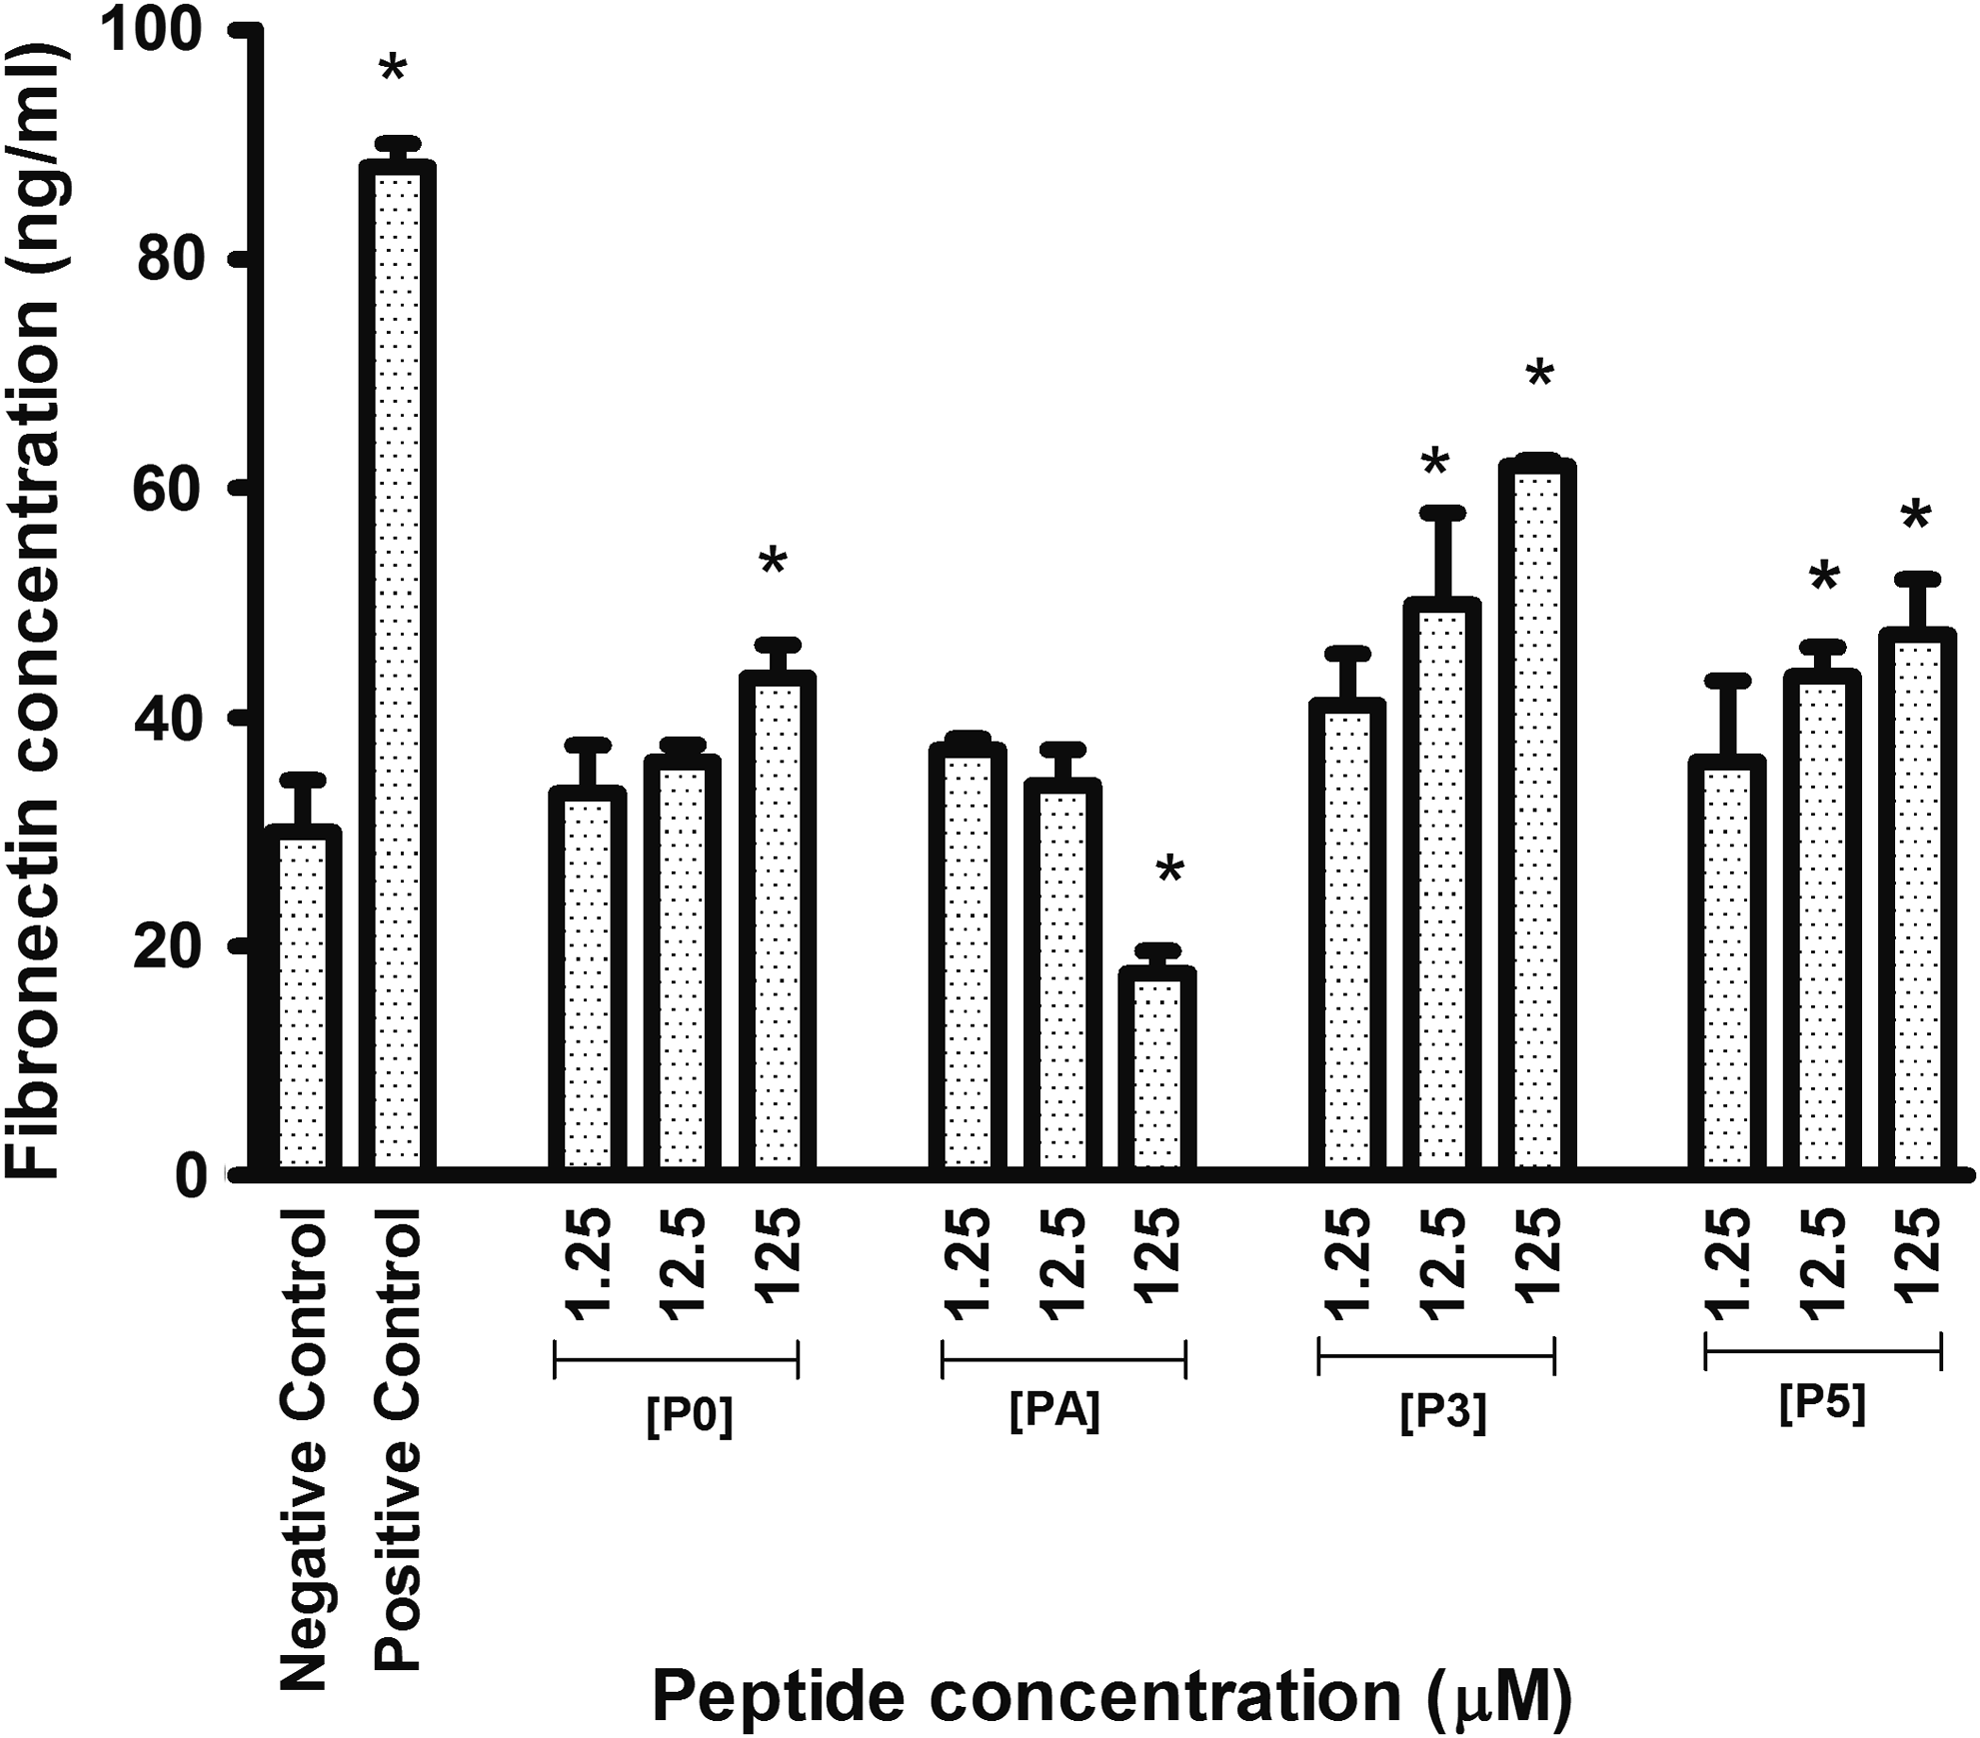
Concentration-dependent stimulation of fibronectin by hADSCs. (P0) KTTKS, (PA) palmitoyl-KTTKSCOOH, (P3) peptide 3, and (P5) peptide 5. Negative control comprises 2% FCS and positive control comprises 2% FCS 1 mM
Increasing peptide concentration of P3 at 1.25, 12.5, and 125 μM showed increased fibronectin deposition at 41.04 (±2.59), 49.81 (±4.64), and 61.90 (±0.31) ng/mL, respectively. Increasing peptide concentration of P5 at 1.25, 12.5, and 125 μM showed increased fibronectin deposition at 36.10 (±4.093), 43.59 (±1.45), and 47.17 (±2.82) ng/mL, respectively. There were no significant differences between the negative control and P3 and P5 at 1.25 μM. However, at 12.5 and 125 μM, P3 and P5 showed significant increased fibronectin production compared with the negative control. Statistical comparison showed that the P3 peptide at 125 μM had the most significant increase [61.90 (±0.31) ng/mL] in fibronectin production compared with P5 [47.17 (±2.82) ng/mL] and P0 [43.42 (±1.68) ng/mL], whereas the PA at 125 μM showed a significant decrease in fibronectin production.
Maintaining stem cell phenotype
P3 showed the most significant stimulation in the synthesis of collagen and fibronectin by hADSCs. Therefore, the typical expression profile of hADSCs (highly positive for CD44, CD90, CD105, CD73, and CD61 and negative for CD31 and CD45) was analyzed for P3-treated and untreated hADSCs by flow cytometry. As shown in Table 3 and Figure 10, the P3 had no effect on the profile of the typical hADSC surface markers during its 4 days of treatment. This suggests that the hADSC phenotype was maintained with P3 treatment.
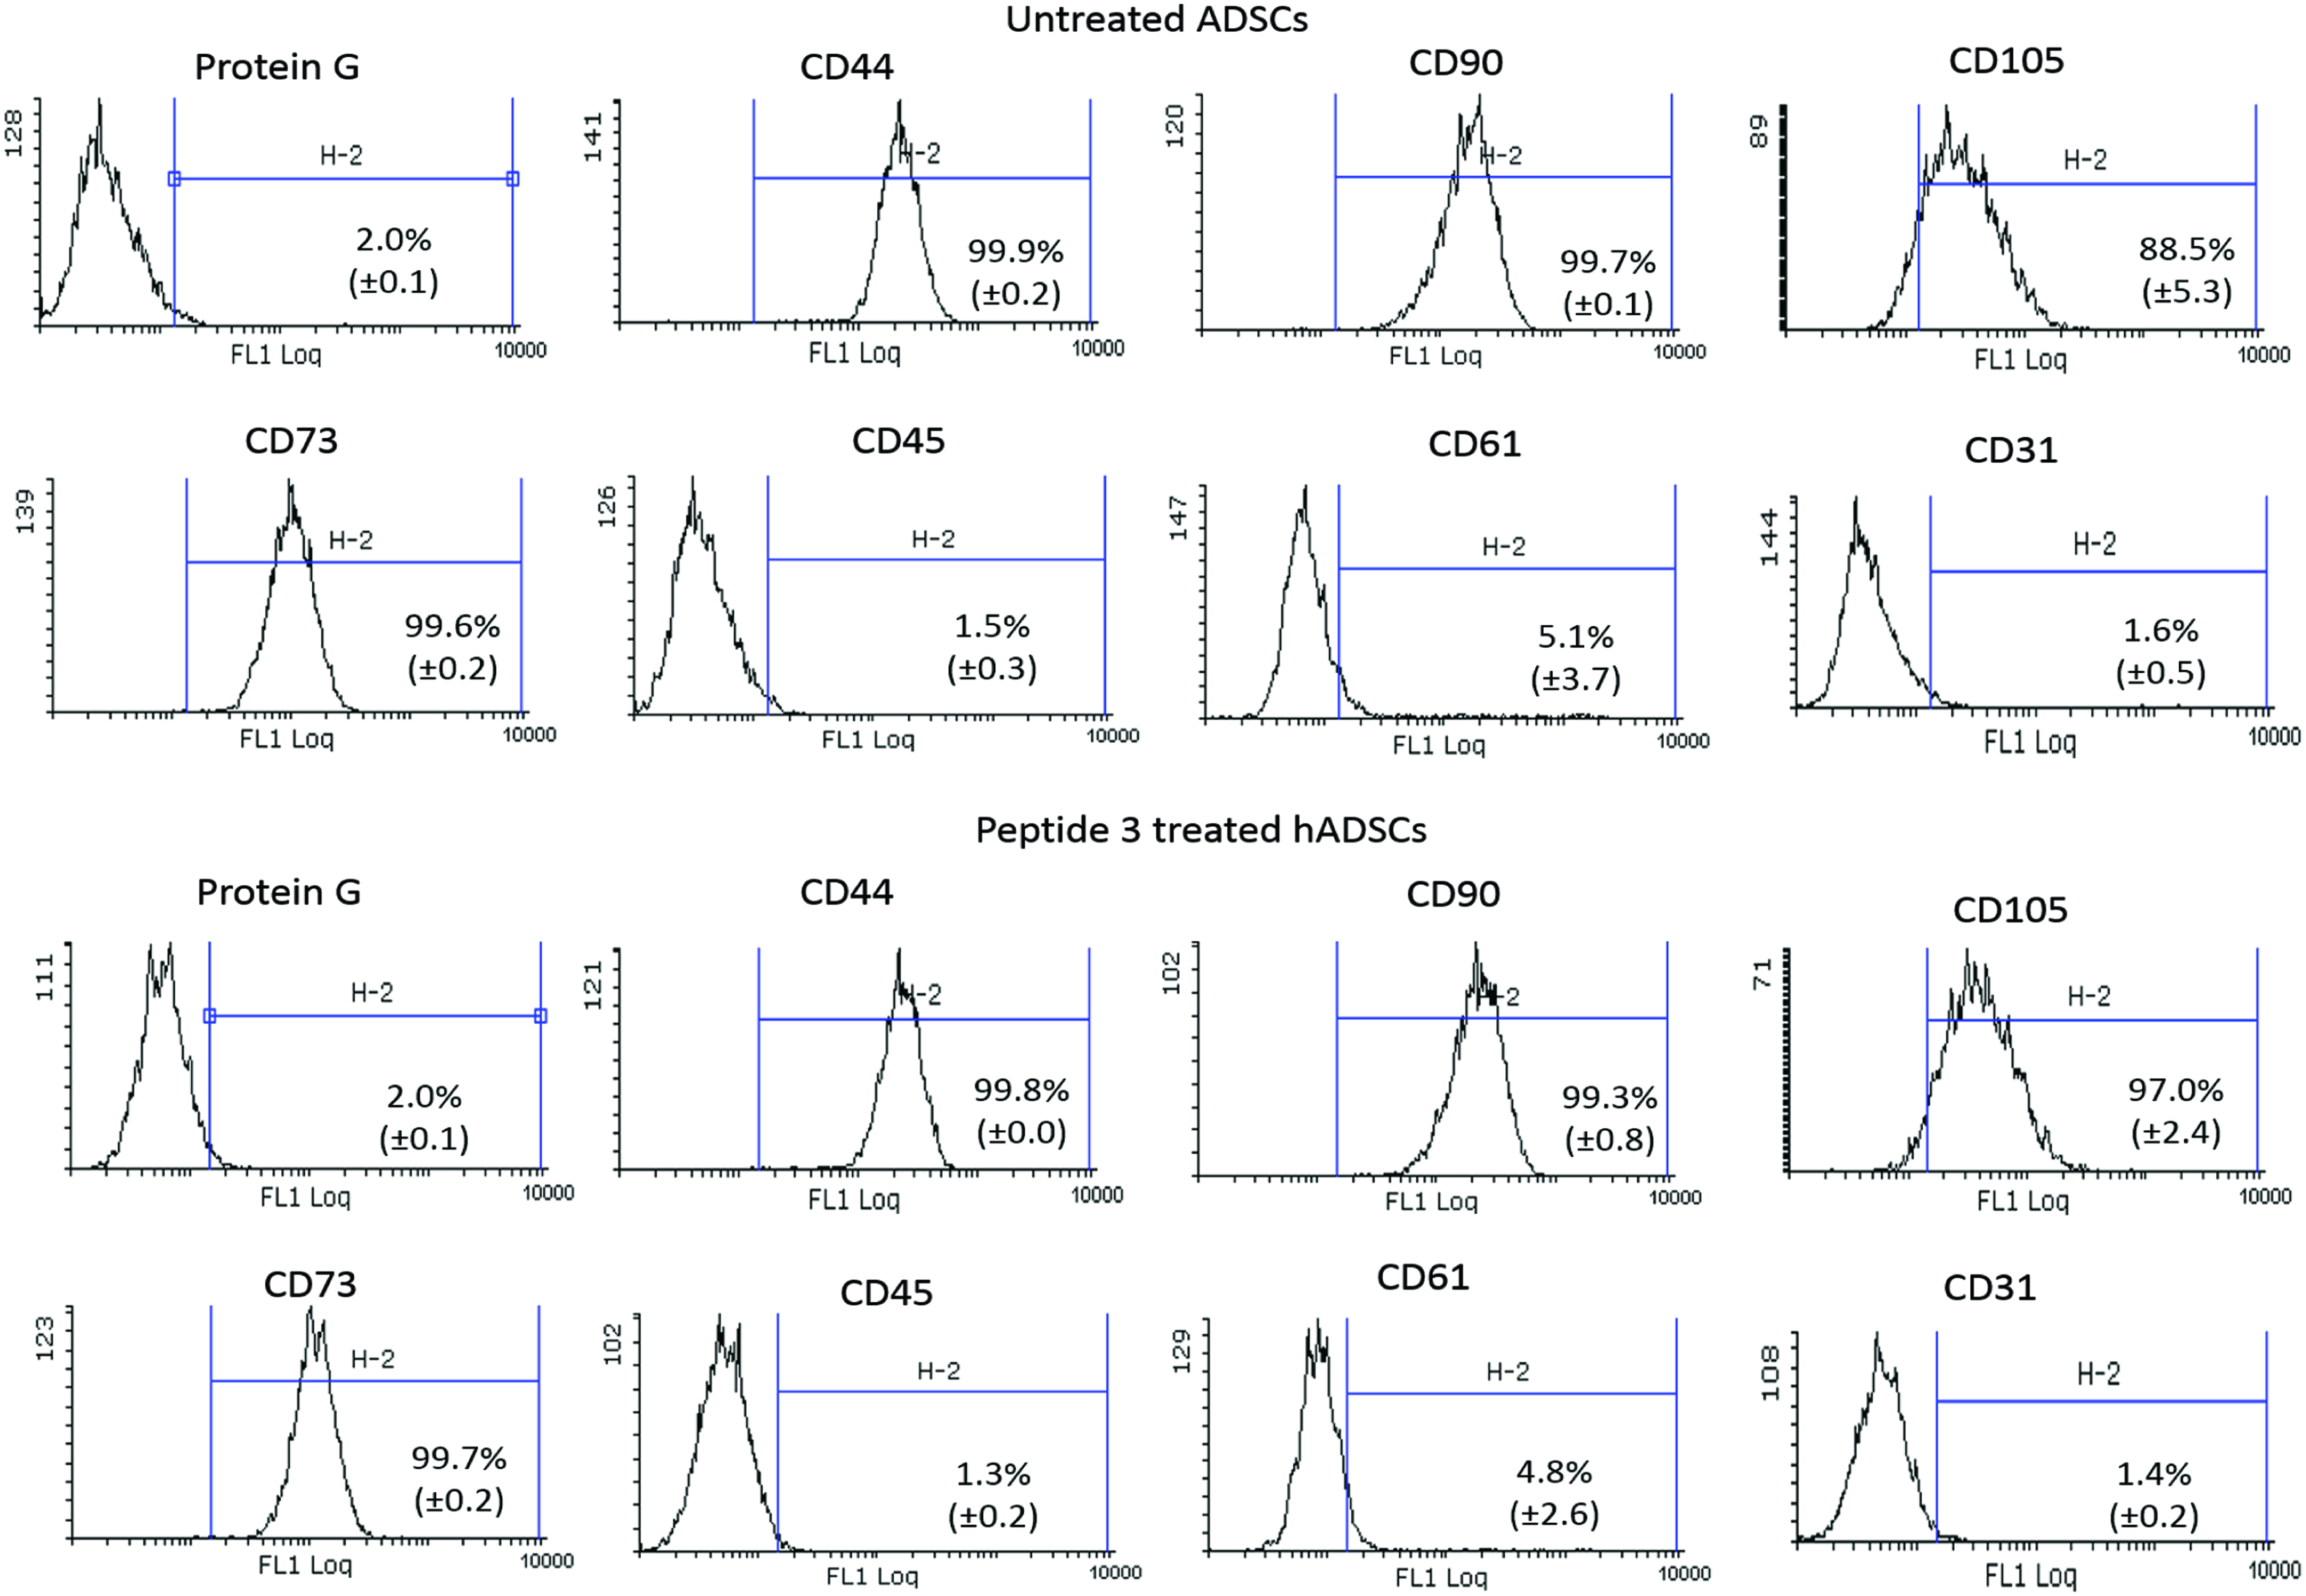
Flow cytometry analysis histogram of hADSCs. The typical expression profile of hADSCs (CD44, CD90, CD105, CD 73, CD45, CD 61, and CD31), as analyzed by flow cytometry. There were no significant differences in marker expression between untreated hADSCs and P3-treated hADSCs (p < 0.05, N = 3, mean ± SD). Color images available online at www.liebertpub.com/tea
There were no significant differences in marker expression between untreated hADSCs and P3-treated hADSCs (p < 0.05, N = 3, mean ± SD).
hADSC, human adipose-derived stem cell; SD, standard deviation.
Discussion
Designing bioactive molecules to stimulate production of ECM has attracted great interest in developing biomaterials for biomedical applications. In this study, we describe the use of molecular modeling to design a peptide that is capable of enhancing secretion of both collagen and fibronectin by hADSCs.
The previous studies on KTTKS and/or palmitoyl-KTTKS in nonpluripotent cell types showed stimulation of collagen and/or fibronectin for various applications, including wound healing.19–21,39 This study demonstrated that hADSCs are also capable of responding to these peptides to produce specific ECM proteins and the cell type is relevant to a wide range of tissue engineering applications, 13 including heart valves, wound healing, and vascular structure. Enhancement of the effects of the peptide KTTKS on collagen and fibronectin synthesis by hADSCs was achieved by design of a new peptide, P3 (SKTTKS-V4A3-SKTTKS), while conserving the phenotypic characteristics of the pluripotent cell type. The new architecture of P3 with palindromic motifs, SKTTKS, could be the reason for enhancing stimulation.
Katayama et al. 19 examined several effective possibilities from native procollagen and reported that KTTKS is the minimum requirement to have maximum activity. Our P2 and P5 support the same, and these have a disordered or reverse motif (SKTTK) and show less stability in the modeling and decreased functionality of P5 compared with P3 under experimental conditions. The mechanism of the original peptide KTTKS is still unknown and there is a detailed review explaining the complications, which prevent a clear understanding of the mechanism. 39
The design of P3 (SKTTKS-V4A3-SKTTKS) was developed with palindromic motifs, thus it can present the functional groups of the peptide at both terminals, which makes this a unique peptide compared with the previously reported functional peptides with single motif, KTTKS 19 and palmitoyl-KTTKS. 21 In the palindromic motif, the additional serine residue plays a crucial role to form a bioactive motif S/KTTK/S on both sides. The modeling suggests that regular hydrogen bonds between the linkers among the chains of P3 are responsible for intra- and intermolecular stability (Fig. 2A). In addition, the specific arrangement of surface electrostatic properties (hydrophilic–hydrophobic–hydrophilic) in P3 appears to be essential for structural packing in the middle and for presentation of motifs (Fig. 3C). The hydrophobic segmentation seems to be sufficient to keep functional groups away at both ends. This segmentation pattern mimics the property of bolamphiphiles,40,41 which has two polar heads on both ends of a hydrophobic segment, also the bolamphiphiles have potential implications in various biomedical applications.
In the P5 (SKTTKV4A2KTTKS), the linker V4A2 forms regular hydrogen bonds for the stability and alignment of chains for structural packing. This correlates with a study on a peptide amphiphile that has the same linker (V4A2), which contributes to mechanical stiffness by forming hydrogen bonds. 26 Although P5 fulfills the specifications of modeling, the production of collagen and fibronectin is comparatively lower than P3. This might be due to minimal functionality of the reverse motif (SKTTK) at the N-terminal. Nevertheless, this reverse motif along with KTTKS at the C-terminal appears to be stimulating hADSCs to produce increased amount of collagen compared with peptides, KTTKS (P0) and palmitoyl-KTTKS (PA). This is consistent with a previous study, where the presence of serine at the C-terminal of KTTKS plays an active role in collagen stimulation. 19
P3 has a palindromic design with structural stability to induce possible structural packing for the presentation of motifs, which seems to be the most efficient design to stimulate collagen production compared with P5. The magnitude of effects on collagen synthesis needs to be assessed against other known stimulants of collagen production (which may be greater than that observed with ascorbic acid). In addition, these two peptides can promote fibronectin production, while peptide 3 can maintain typical hADSC phenotype as demonstrated by FACS analysis. In contrast, palmitoyl-KTTKS (PA) showed reduced cell viability, despite this effect, it still showed significant collagen stimulation in hADSCs. This is consistent with a previous finding 21 where palmitoyl-KTTKS (PA) reduced viability of human corneal and dermal fibroblasts.
Conclusions
We have experimentally demonstrated that the proposed P3 can stimulate hADSCs to promote the production of collagen and fibronectin while maintaining the phenotype of hADSCs. Further assessments of the peptide are underway to prove the efficacy of the peptide in vivo. The design of dual palindromic motifs might present multiple functional groups for stimulation. The ability to instruct stem cells to produce essential components of ECM has profound implications in tissue repair for wound healing and biomedical applications. In particular, this bioactive peptide can be extremely useful to generate an intelligent biomaterial to orchestrate ECM production in situ for regenerative medicine and tissue engineering.
Footnotes
Acknowledgments
The authors would like to thank Dr. Othmane Bouhali and Mr. Faisal Chaudhry, Texas A&M University in Qatar, for providing supercomputing facility. They express their gratitude for the facility of high-performance computing at Imperial College London. The authors thank Dr. Christian Bollensdorff and Dr. Matthias Gabriel in Sidra for their valuable suggestions. No human or animal studies were carried out by the authors of this article.
Disclosure Statement
No competing financial interests exist.