




Abstract
Abdominal wall repair frequently utilizes either nondegradable or biodegradable meshes, which are found to stimulate undesirable biological tissue responses or which possess suboptimal degradation rate. In this study, a biologic mesh prototype made from carbodiimide cross-linked cholecyst-derived extracellular matrix (EDCxCEM) was compared with small intestinal submucosa (Surgisis®), cross-linked bovine pericardium (Peri-Guard®), and polypropylene (Prolene®) meshes in an in vivo rabbit model. The macroscopic appearance and stereological parameters of the meshes were evaluated. Tailoring the degradation of the EDCxCEM mesh prevents untimely degradation, while allowing cellular infiltration and mesh remodeling to take place in a slower but predictable manner. The results suggest that the cross-linked biodegradable cholecyst-derived biologic mesh results in no seroma formation, low adhesion, and moderate stretching of the mesh. In contrast to Surgisis, Peri-Guard, and Prolene meshes, the EDCxCEM mesh showed a statistically significant increase in the volume fraction (Vv) of collagen (from 34% to 52.1%) in the central fibrous tissue region at both day 28 and 56. The statistically high length density (Lv), of blood vessels for the EDCxCEM mesh at 28 days was reflected also by the higher cellular activity (high Vv of fibroblast and moderate Vv of nuclei) indicating remodeling of this region in the vicinity of a slowly degrading EDCxCEM mesh. The lack of mesh area stretching/shrinkage in the EDCxCEM mesh showed that the remodeled tissue was adequate to prevent hernia formation. The stereo-histological assays suggest that the EDCxCEM delayed degradation profile supports host wound healing processes including collagen formation, cellular infiltration, and angiogenesis. The use of cross-linked CEM for abdominal wall repair is promising.
Introduction
I
Synthetic nondegradable surgical meshes used for abdominal wall reconstruction can stimulate an intense foreign body response, leading to mesh area contraction.6–8 This abnormal tissue reaction is thought to contribute to abdominal wall stiffness, mesh-related complications, and chronic pain.9–11 Although there is no hernia recurrence, the implant repair area is contracted and stiff. Strategies such as increasing the pore size of meshes and manufacturing lighter synthetic meshes attempt to overcome this problem.7,12–16 In some studies, adoption of lighter meshes were associated with a higher recurrence rate of hernias14,17–19 and no advantage in reduction of chronic pain.20–23 In the presence of infection or potential contamination, synthetic mesh repair is not recommended as it is associated with a high risk of infection, pain, and hernia recurrence.24–26
Degradable allogenic/xenogenic biologic meshes have been widely used in the last decade to overcome the undesirable effects of synthetic meshes in high-risk patients (contamination or potential contamination, high recurrence group).27–32 Although these meshes alleviate the need for a staged abdominal reconstruction, there is accumulating evidence to suggest that these meshes are associated with stretching of the repaired area and high failure rates.28,33–35 This phenomena presents clinically as abdominal wall bulging, abdominal wall laxity, and hernia recurrence.36,37
The phenomena observed with biologic meshes have been attributed to the inherent properties of the material. The presence of aged dermal collagen and elastin fibres in dermal-derived materials is considered prone to stretching.37,38 In addition, the rapid in vivo degradation of noncross-linked meshes in the presence of contamination leads to inadequate restoration of the native abdominal tissue in a timely manner. Methods to improve the performance of biologic meshes have been employed, which includes the creation of multi-laminate constructs to increase bulk and mechanical strength, sourcing xenogenic fetal dermal-derived meshes, utilizing nondermal meshes and cross-linking processes to prevent degradation.34–36 Unfortunately, constructing multi-laminate meshes and cross-linking process are associated with seroma formation. 39 Cross-linking strategies such as glutaraldehyde render the biomaterial nondegradable.
For optimal abdominal wall regeneration, it is important that a desired biological tissue response is achieved. This includes a controlled degradation rate of the implanted mesh that would allow replacement of the mesh with host tissues with subsequent timely remodeling of the tissues to restore the function of the abdominal wall.
Neither nondegradable synthetic meshes nor rapidly degradable biologic meshes meet these criteria whereas a slowly degrading extracellular matrix could fulfill the required needs for abdominal wall repair by prolonging mesh degradation and tissue remodeling. Herein, a prototype of slowly degrading EDC-cross-linked cholecyst-derived extracellular matrix (EDCxCEM) was developed and its performance was compared with commercially available meshes, which were small intestinal submucosa (Surgisis®), cross-linked bovine pericardium (Peri-Guard®), and polypropylene mesh (Prolene®) in an in vivo rabbit model. 40
Materials and Methods
Materials
All reagents unless otherwise stated were purchases from Sigma Ireland, Ltd. (Dublin, Ireland). Fresh cholecysts of market weight farm-reared pigs were obtained from the local supplier Sean Duffy Exports Ltd. (Gort, Ireland).
Preparation of cross-linked CEM meshes
CEM was isolated and processed according to a method described elsewhere. 41 CEM meshes were then subjected to lyophilization. Lyophilized CEM meshes were dissected to ∼4 × 6 cm in size to match the hernia defects in the rabbit before cross-linking. The substrates were then hydrated in precooled 50 mM MES buffer on ice before cross-linking. EDC-cross-linked CEM (EDCxCEM) meshes were prepared by the carbodiimide cross-linking method. 41 The cross-linking feed concentration was 0.01 mmol EDC/NHS (1-ethyl-3-(3-dimethylamino-propyl) carbodiimide/N-hydroxysuccinimide) per mg of CEM. The molar ratio of EDC:NHS was kept constant at 1:1. The cross-linking proceeded in 50 mM MES buffer at pH 5.3 and 37°C with intermittent stirring for 4 h.
The cross-linked CEM meshes were washed at least five times with distilled water to remove excess cross-linker or byproducts. The EDCxCEM meshes were then used immediately or stored at 4°C and implanted within 48 h. The samples were sterilized with 0.15% peracetic acid in sterile water for at least 5 min, followed by washing in sterile water. Peracetic acid was reported to be an efficient disinfectant that deactivates not only bacteria but also viral loads.42–46 The meshes were then kept hydrated in a solution of sterile normal saline during surgery. Prolene, Surgisis (4-layer), and Peri-Guard meshes were used as per the manufacturer's instruction.
Implantation in rabbits
Forty eight male New Zealand White Rabbits (weight 3.0–3.5 kg) were used for this study. The animals were acclimatized for at least 1 week to the local environment before surgery. All procedures were conducted under the approval from the Institutional Animal Ethics Committee of National University of Ireland, Galway and a license was obtained from the Department of Health and Children, Dublin, Ireland as required by the Cruelty of Animals Act (1876). Certificate B (No. B100/3685).
Six rabbits were assigned to each group. Hairs were removed from the anterior abdominal wall with electric hair clippers. The rabbits were anesthetized using intramuscular Ketamine (35 mg/kg) and Xylazine (5 mg/kg). The hernia defect was created and repaired. Briefly, a midline incision was performed through the skin and subcutaneous fat. The rectus abdominus muscle was exposed on the left side. Excision of the rectus abdominus muscle was performed unilaterally on the left side including the peritoneal layer. A 4 cm longitudinal length was marked on the mid-portion of the rectus abdominus muscle. Excision was carried out for this longitudinal length (4 cm) along the borders of the linea alba and the linea semilunaris (width). 40 The resultant abdominal wall defect (the excised mid-portion of the rectus abdominus muscle of 4 cm length) was repaired with a similar sized mesh (like for like, “replacement”) using a running 4/0 polypropylene suture (tension-free inlay bridging technique). Each rabbit was randomized to receive either a polypropylene mesh (Prolene; Ethicon Endo-Surgical, Inc.), four layer small intestinal submucosa graft (Surgisis; Cook Medical, Inc., IN), glutaraldehyde cross-linked bovine pericardium (Peri-Guard; Synovis Surgical Innovations) or EDCxCEM. Each rabbit was given a standard dose of prophylactic antibiotic subcutaneous enrofloxacin (5 mg/kg) and subcutaneous analgesia butorphanol (0.25–0.4 mg/kg) for 48 h postsurgery. The rabbits were maintained in a controlled environment in cages until sacrifice. All rabbits were observed regularly for wound complications including infection, bleeding, seroma, and dehiscence. The time periods for the study were 28 and 56 days.
In the first week postsurgery, the presence of seroma at the mesh site was examined daily, followed by weekly observation from the second week onward. Examination for possible occurence of abdominal wall hernia was performed weekly until euthanasia.
At 28 and 56 days, the rabbits were euthanized with intravenous injection of 2 mL sodium pentobarbital (Dolethal®) under anesthesia. The anterior abdominal wall tissues were removed with care to preserve both rectus abdominis muscles and surrounding tissues. Mesh area stretching or contraction was noted, and any adhesion was removed before tracing the size of the mesh area with tracing paper. The mesh area was identified by the presence of polypropylene sutures used for securing the mesh at the time of repair and to identify host tissue ingrowth in place of the mesh. The dimension of the implant was measured as previously described. 40 Briefly, the mesh borders were traced using tracing paper and photographs were taken as required. The tracings were scanned to digital images and the mesh area dimensions (width, length, and mesh area) were determined using image analysis software (ImageJ v1.43; National Institutes of Health). The percentage contraction/stretching of the area, width or length of the implant area were evaluated with the following formula:
Percentage change = [(Implant left side) − (Control right side)]/(Control right side) × 100%
The presence of intra-abdominal adhesions were documented and scored using the Surgical Membrane Study Group (1992) scoring system (Fig. 1). 47 The mesh areas were then dissected and preserved in 4% neutral buffered formalin.

Schematic diagram showing a cross section of the implant area with the implant region, and fibrous tissue region, showing the CA and peripheral implant area. CA, central implant area.
Tissue processing and histology analysis
Formalin fixed tissues were dehydrated through a series of graded ethyl alcohol solutions (50%, 75%, 95%, and 100%), cleared with xylene and embedded in paraffin using an automatic tissue processor (Leica ASP 300; Leica Microsystems, Nussloch, Germany). Five micrometer thick paraffin sections were stained with Masson's trichrome stain. The stained sections were observed under light microscope and digital images captured for qualitative histomorphology and quantitative stereological analysis (BX51 microscope, DP-70 digital camera; Olympus Europe, Hamburg, Germany)
Quantitative stereological analysis
The stereological methods used for the quantitative analysis of tissue response and degradation parameters were conducted as previously reported by Garcia et al. 48 Briefly, the stereological approach is based on isotropic sampling. Since the abdominal wall is an anisotropic layered structure, it is stratified and requires the use of a vertical uniform random sampling method to obtain isotropy in the vertical sections. At least six nonoverlapping random fields of view per section per stereological parameter, six sections per mesh, and six meshes per group per time point were used for adequate sampling. The probes/test systems (counting grids/cycloids) provided by an image analysis software (ImageJ; National Institutes of Health) were used to enable point counts for stereological estimations.
The mesh site was divided into two regions, namely, the mesh region and the fibrous tissue region surrounding the mesh (Fig. 1). Each region was subdivided into the central area and the peripheral area of the mesh/fibrous tissue regions (Fig. 1). Stereological volume fraction (Vv) estimations of nuclei, fibroblasts, and native host collagen and/or residual mesh (mesh collagen or polypropylene fibers) were used to evaluate the tissue composition of each area. Length density (Lv), surface density (Sv) and radius of diffusion (Rdiff) estimations were used to evaluate the distribution of blood vessels in each area.
Statistical analysis
Statistical analyses were carried out using statistical software InStat® (GraphPad Software, Inc.). Statistical differences between groups were analyzed by one-way analysis of variance. Tukey's honestly significant difference test was used for post hoc evaluation for differences between groups. When the dataset did not satisfy the criteria for parametric tests, Kruskal–Wallis test was used with Dunn's multiple comparisons between groups. A p-value of <0.05 was considered to be statistically significant. All data represented were expressed as mean ± standard deviation.
Results
Macroscopic tissue explants examination
Figure 2 summarizes the appearance of the meshes after abdominal wall repair surgery at 28 and 56 days. No infection, skin irritation, ulceration, wound dehiscence; bleeding/haematoma, or development of hernia was observed for all groups. All animals resumed normal activity within 12–24 h after surgery.

Macroscopic appearance of the meshed meshes after abdominal wall repair surgery immediately (post-op), 28 and 56 days.
Examination of the explanted abdominal wall revealed that all Prolene meshes and Peri-Guard meshes remained macroscopically intact until day 56. The degradable meshes (EDCxCEM and Surgisis) showed different degrees of in vivo degradation at day 28 and 56. Macroscopically, both EDCxCEM and Surgisis meshes were visible at 28 days. Striking blood vessels and host connective tissue were observed to infiltrate the meshes from the mesh margin/edge of the defect interface. Compared to EDCxCEM, however, Surgisis showed a more advanced stage of degradation at both 28 and 56 days. By 56 days, none of the original Surgisis meshes were observed by macroscopic examination and they had been infiltrated by host tissue, at least on the peritoneal surface of the meshes. In contrast, parts of the EDCxCEM meshes were visible at day 56 and showed evidence of degradation and host tissue replacement. There was no mesh area stretching observed for both the EDCxCEM and Surgisis meshes at day 28. By day 56, stretching of the Surgisis meshes was evident. A much lesser degree of stretching of EDCxCEM meshes was observed.
Figure 3 shows seroma formation for both the Surgisis and Peri-Guard meshes during postoperative examinations. Seventy-five percent of Peri-Guard meshes showed evidence of seroma formation, typically within the first 3 days after surgery. In contrast to Peri-Guard meshes, seroma formation in the Surgisis group was delayed and typically detected clinically at least after 3 days postsurgery. There was no seroma observed in the Prolene and EDCxCEM groups.

Seroma formation in vivo:
Figure 4 shows adhesions that were evaluated upon euthanasia. All Surgisis meshes were free of adhesion at both day 28 and 56. At day 28, the EDCxCEM and Peri-Guard meshes were free of adhesions. At day 56, adhesions were confined to the suture lines at the mesh-host tissue interface in one rabbit from the EDCxCEM group and two rabbits from the Peri-Guard group. There was no noticeable complication (such as bowel dilatation or obstruction) from these adhesions. Adhesions complicated 50% of Prolene meshes at both 28 and 56 days. These adhesions involved the mesh areas. The area of the mesh involved varied from 30% to 70%. Again, no noticable complications was found due to these adhesions.

Intraabdominal adhesions in
Changes in mesh dimensions
The change of width, length, and total area of the meshes is demonstrated in Figure 5. Surgisis showed a statistically significant percentage change in mesh width from 5% at day 28 to 30% at day 56. In contrast to Surgisis, the EDCxCEM mesh did not show a statistically significant percentage change in mesh width (from 2.4% at day 28 to 6.6% at day 56). The Peri-Guard and Prolene meshes contracted significantly by day 56 (16.3% and 19.9%, respectively).
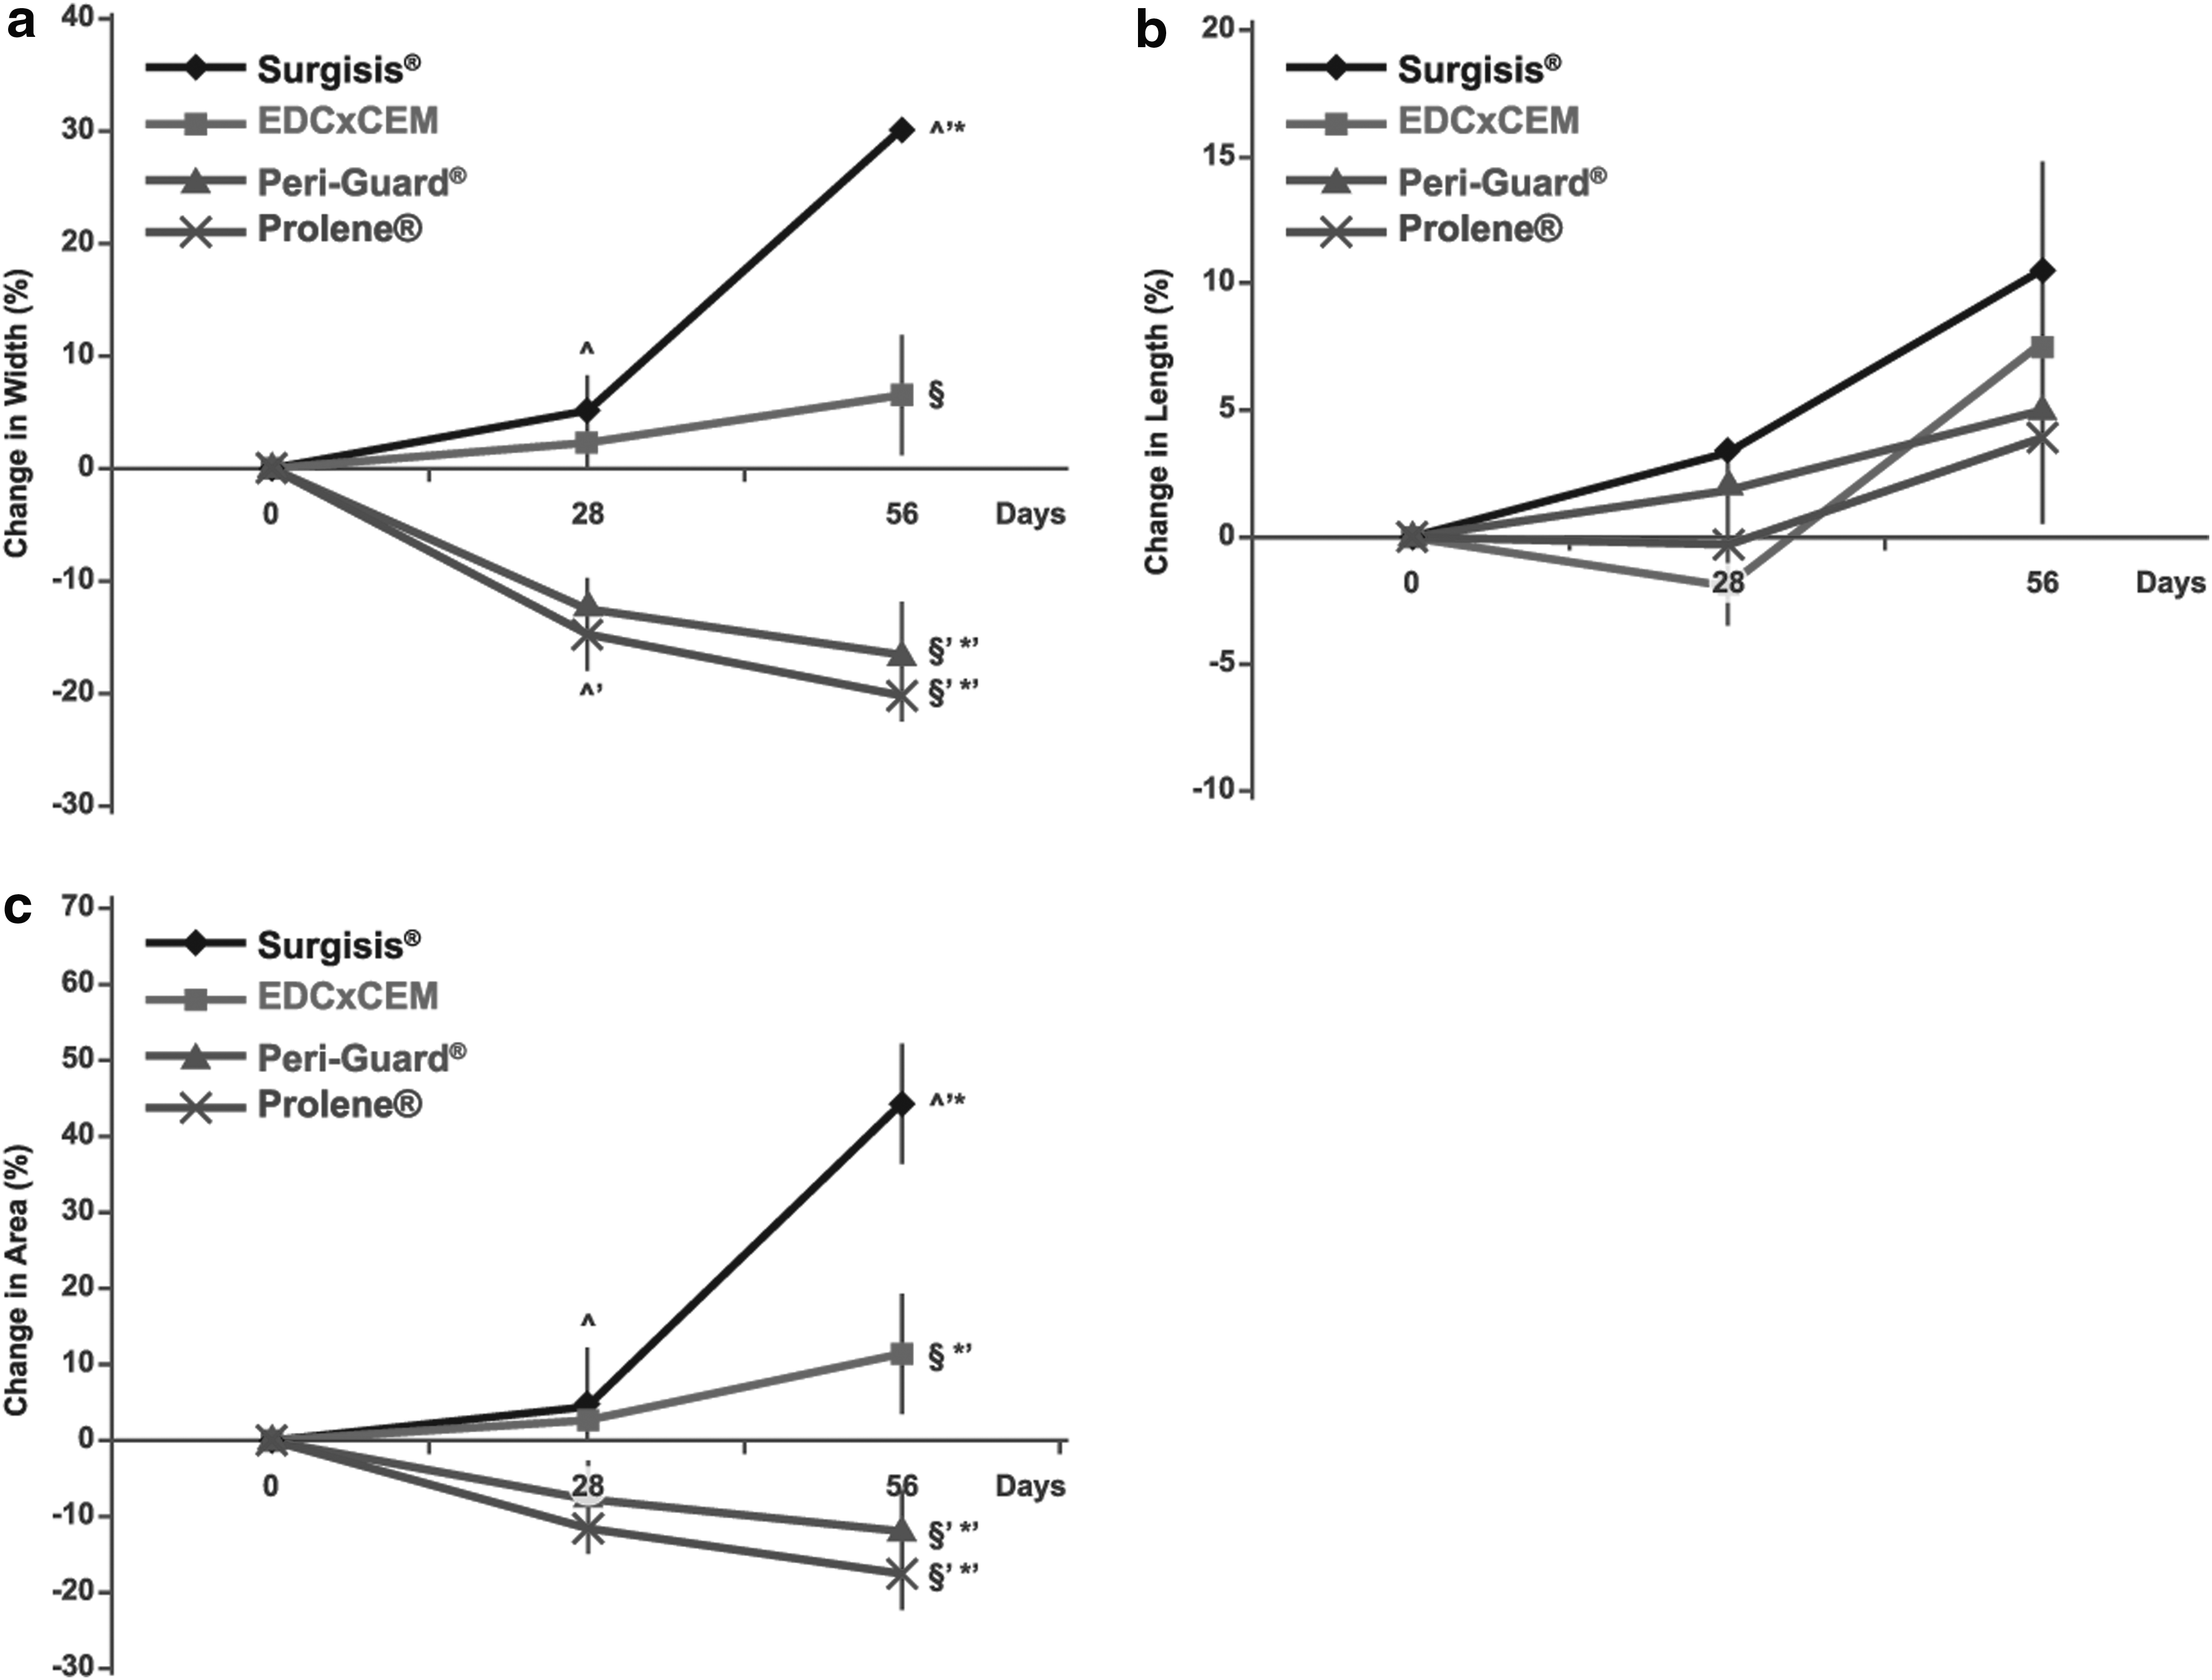
Percentage change in
As for the change in mesh length, all meshes showed an increase of between 4% and 10% at day 56. Since the change in length was compared against the initial excision length, some of this increase is likely due to the growth of the animals. No statistically significant difference was observed between groups.
The pattern of change in mesh area broadly follows the trend in the change of width. Surgisis showed the most significant percentage change in mesh area. The increase of 5% in area was not significant when compared to other groups at day 28. However, Surgisis underwent statistically significant stretching between day 28 and 56, resulting in 48% stretch in area by day 56. Changes to Surgisis mesh area was significantly different when compared with all other groups at day 56. The EDCxCEM mesh showed no statistically significant change in mesh area over time (from 3% at day 28 to 12% at day 56). Both, Peri-Guard (8–12%) and Prolene (12–18%) meshes showed increasing mesh area contraction from day 28 to 56, which were statistically significantly different compared with Surgisis and EDCxCEM meshes.
Descriptive histological analysis
Underneath the cutaneous tissue, all meshes showed fibrous connective tissues directly overlying the meshes. On the underside, a thin layer of neo-peritoneum was evident. Where there were adhesions, the neo-peritoneum was continuous to the adherent tissues. The regions of interest are the mesh region and the fibrous tissue region surrounding the meshes. Each region was subdivided into a central area and a periphery area in relation to the position of the meshes (Fig. 1). Figure 6 shows the histology sections of different meshes.

Masson's Trichrome stained histology sections showing mesh area and fibrous tissue area, and FBGCs in the tested groups. (Bar 50 μm). FBGC, foreign body giant cell.
Prolene (polypropylene)
Histologically, the central area of the mesh region showed multiple circular- or oval-shaped void spaces representing multiple polypropylene filament fibers. Connective tissue surrounded the areas between the filaments. These connective tissues were rich in collagen, fibroblasts, and occasional blood vessels. The collagen fibers were arranged in a disorganized manner and encircled polypropylene filaments where they were present. Some collagen bundles appeared more mature (denser and thicker) than other areas (looser and sparse). Inflammatory cells approximately one to five layers thick were intimately related to the polypropylene filaments. There were fibroblasts and sparse inflammatory cells within the connective tissues, away from the polypropylene filaments. There were no apparent difference between the central or peripheral area of the mesh regions between 28 and 56 days.
In the fibrous tissue region, the tissue was composed of collagen-rich connective tissues. Fibroblasts, inflammatory cells, and blood vessels were frequently observed in this region. In contrast to the disorganized arrangement in the mesh region, the collagen fibers in this region were more organized and orientated roughly parallel to the long axis of the musculature/surface of the mesh. This fibrous tissue area appeared to be more mature, denser, and less cellular at day 56 compared with day 28. There was no difference between the fibrous tissue areas whether they were related to the center or the periphery of the meshes.
Peri-Guard (bovine pericardium)
The collagen bundles of bovine pericardia were parallel and compact. The collagen structure in the center of the Peri-Guard meshes were intact with no sign of degradation or host cell infiltration. In the mesh region, there was no discernible difference between the appearance of the center and the periphery areas.
Inflammatory cells (lymphocyte and macrophages) surrounded the surface (5–10 layer thick) and were seen penetrating the surface of the densely packed collagen bundles at the interface between mesh and fibrous tissue regions. Foreign body giant cells (FBGCs) were occasionally observed at this interface. There was mild surface degradation of the mesh—evident by short segments of collagen bundles separating away from the main mesh with host cells in between. In the fibrous tissue region, further from the mesh surface, connective tissues with organized collagen, fibroblast, blood vessels, and few inflammatory cells were observed. These fibrous tissue areas matured from 28 to 56 days. A thin neo-peritoneum layer was evident on the underside with a similar inflammatory cellular area at the interface
Surgisis (small intestinal submucosa)
The collagen bundles of small intestinal submucosa meshes were roughly parallel with occasional curling. A multi-laminated appearance was evident especially in the intact central mesh core region. At 28 days, Surgisis collagen fibers at the mesh region were intact and acellular, with inflammatory cells infiltrating to ∼30–50% of the thickness of the mesh from the surface. This was observed both at the central and peripheral of the mesh areas, but more often observed in the central area. The inflammatory cells seen to penetrate the meshes from their surface were dense and composed of lymphocyte and macrophages. FBGCs were frequently seen with degraded collagen material within the cell bodies. There was some new collagen deposition and fibroblasts at this level.
By 56 days, a large proportions of the mesh had been degraded, leaving behind a thinner region of residual mesh collagen and they were fully infiltrated by host inflammatory cells. By this time, the inflammatory cells were less dense but occupy a larger area. The degraded meshes were replaced by host connective tissues.
In the fibrous tissue region, a dense inflammatory cells layer (10–20 layers) was observed at 28 days. These inflammatory cells surrounded and infiltrated the mesh surface layer by layer. By 56 days, this process of degradation was less intense. Connective tissues with a less dense inflammatory cells layer replaced this region previously occupied by mesh collagen bundles.
EDCxCEM (cross-linked CEM)
At 28 days, inflammatory cells were observed to penetrate the surface of the EDCxCEM mesh, ∼20% of its thickness. The layer of inflammatory cells was much less dense than those seen with Peri-Guard or Surgisis meshes. By 56 days, intact collagen bundles within the central mesh region were still present with progression of the host inflammatory cells toward the core of the mesh.
On the surface of EDCxCEM, the fibrous tissue region, degradation of surface collagen bundles was observed. Lymphocytes and macrophages were seen at this interface region. FBGCs were also seen, having engulfed collagen fibers that had separated from the mesh. Further away from the interface/fibrous tissue region, organized connective tissue comprised of collagen, blood vessels, and fibroblasts were laid down. Occasional inflammatory cells (lymphocytes and macrophages) were also observed but they were more frequent at the mesh surface. The host collagen fibers became denser and their orientation was more parallel and organized at day 56 indicating maturation and reorganization of the host connective tissue.
Quantitative stereological analysis
Figure 7 summarizes quantitation of stereological analysis among the groups. Changes to each parameter for each implant type and implant area (central or peripheral) are described, and any noteworthy observations are discussed.
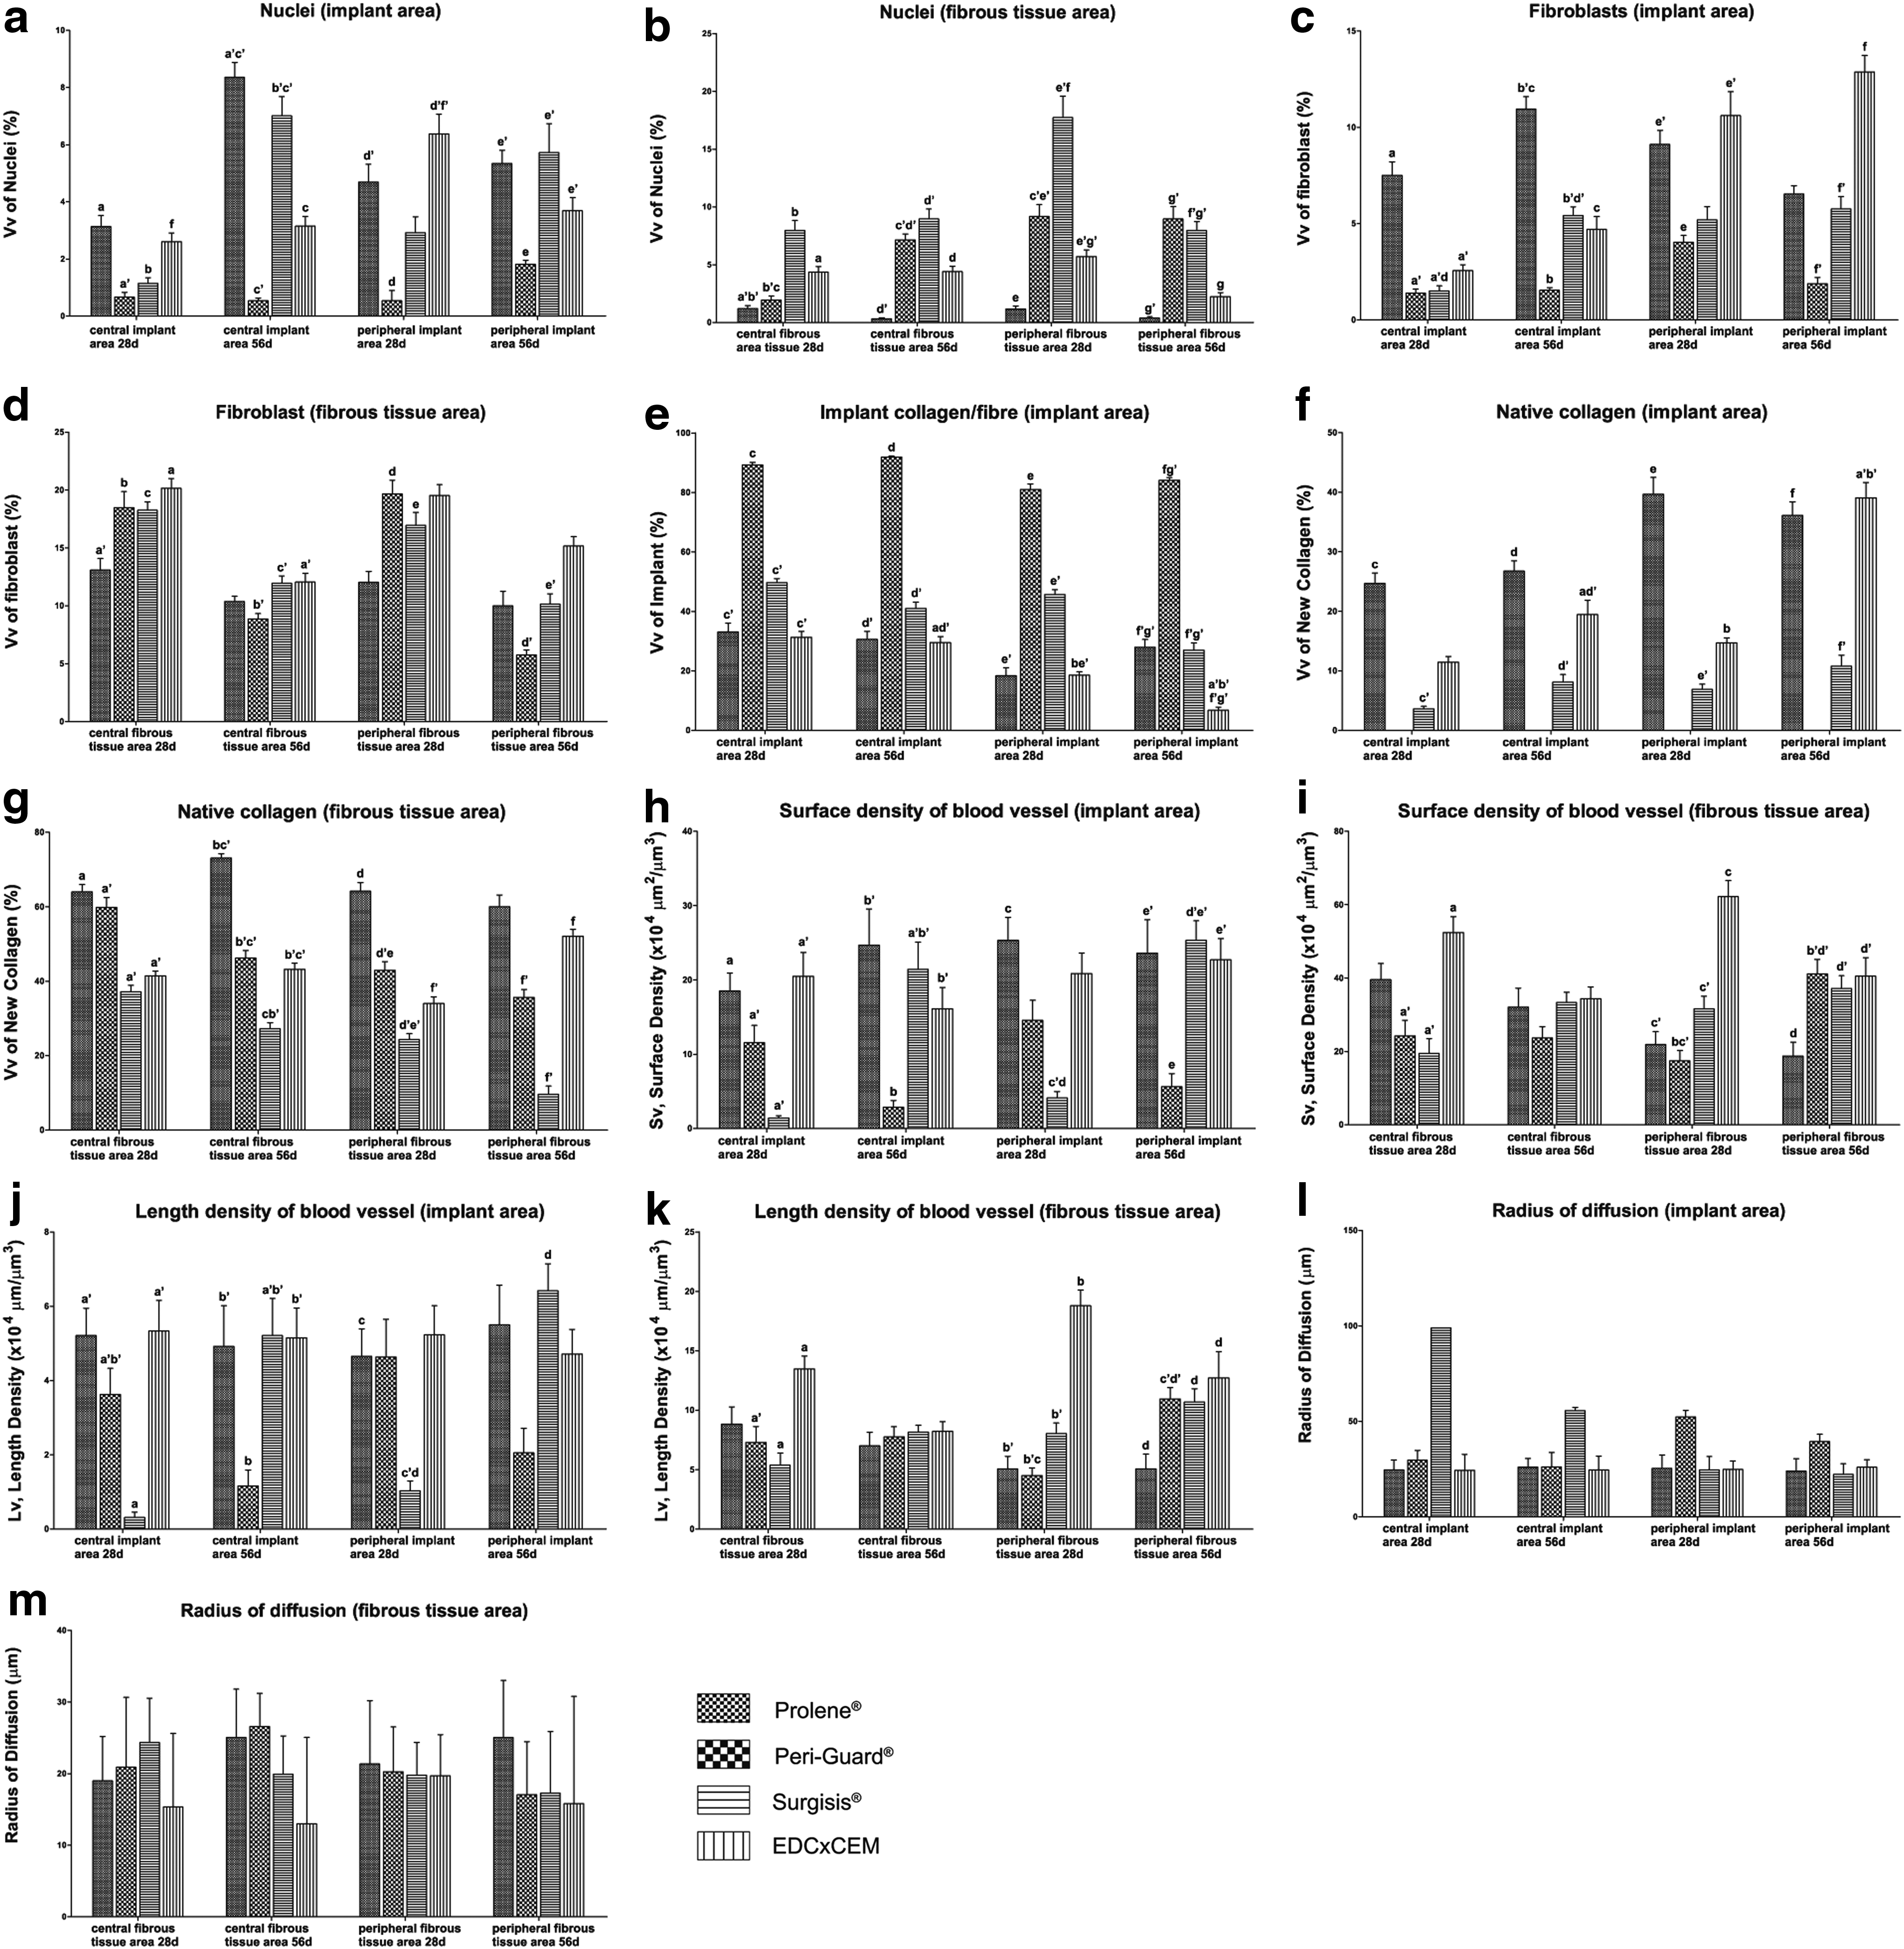
Quantification of stereological analysis in volume fraction of
Volume fraction of nuclei: implant region
In the central area of the implant region, the Vv of nuclei of the EDCxCEM mesh was not significantly different from the other three implant types at 28 days. By 56 days, the Vv of nuclei for EDCxCEM was maintained at a moderate level (3.2%), significantly higher than Peri-Guard (0.5%) and significantly lower than Prolene (8.4%) and Surgisis (7%).
In the peripheral area of the implant region, there was no statistical difference in Vv of nuclei for each individual implant group over time. However, the Vv of nuclei for Prolene (4.7%) and EDCxCEM (6.4%) was significantly higher than Peri-Guard (0.5%) at 28 days. By 56 days, the Vv of nuclei of Prolene (5.4%), Surgisis (5.7%), and EDCxCEM (3.7%) were all significantly higher than Peri-Guard (1.8%).
When the central implant area was compared to the peripheral implant area for each group, only the EDCxCEM group showed a statistically higher Vv of nuclei in the peripheral implant area (6.5%) compared to the central implant area (2.6%) at 28 days. These changes indicated that host cellular infiltration was significantly higher at the implant periphery, compared to the center area for EDCxCEM. The initial higher Vv of nuclei in the peripheral implant area suggested that the porous EDCXCEM implant facilitated early cellular infiltration at the implant periphery. Although, the Vv of nuclei of Prolene in the peripheral implant area was high, a statistical difference was not observed when compared with the central implant area (3.1% at 28 days; 8.4% at 56 days). This observation was not seen in Peri-Guard (a densely packed and highly cross-linked collagen) and Surgisis (a multi-laminate construct).
Volume fraction of nuclei: fibrous tissue region
In the central area of the fibrous tissue region at 28 days, EDCxCEM showed a significantly higher Vv of nuclei (4.4%) when compared with Prolene (1.2%). By 56 days, the Vv of nuclei of Peri-Guard has increased significantly (by threefold to 7.1%) to match that of Surgisis (8.9%). In contrast, at 56 days EDCxCEM maintained a similar Vv of nuclei (4.4%) as it was at 28 days, which was statistically higher than Prolene (0.3%), but statistically lower than Peri-Guard (7.1%) and Surgisis (8.9%).
In the peripheral area of the fibrous tissue region, the Vv of nuclei for the Prolene mesh (1.2%) at 28 days was significantly lower than all other implants. Surgisis (17.7%), however, showed the highest Vv of nuclei at 28 days. The Vv of nuclei of EDCxCEM (5.7%) was significantly higher than Prolene, and not statistically different from Peri-Guard or Surgisis. By 56 days, the Vv of nuclei for Surgisis had significantly decreased from 17.7% to 7.9% (by more than half) to the Vv of nuclei similar to that for Peri-Guard (8.9%). EDCxCEM implants showed a Vv of nuclei of 2.2% at 56 days, while Vv of nuclei for Prolene was 0.4%. The Vv of nuclei of EDCxCEM (2.2%) was statistically different from Peri-Guard (8.9%), Surgisis (7.9%), and Prolene (0.4%).
Similarly, the findings of Vv of nuclei in the fibrous tissue region demonstrated that the tissue response occurred at a faster pace in the periphery, compared with the central area. The initial higher fraction of nuclei in the periphery for Surgisis, Peri-Guard, and to a lesser extent for EDCxCEM indicates that host inflammatory cells were brought into the region to degrade these implants. Since four layer Surgisis, is a degradable scaffold, its rapid degradation profile is thought to cause an increased level of cellular activity, demonstrated by the high nuclei Vv at 28 days. In contrast, Peri-Guard being a nondegradable scaffold, resulted in a sustained and prolonged host inflammatory cellular response to degrade the foreign implant, and toxicity of glutaraldehyde may have intensified the inflammatory response. Since EDCxCEM is also a degradable scaffold, a similar cellular response to Surgisis was predicted. However, EDCxCEM implants had a slower degradation profile and without the toxicity of glutaraldehyde, and therefore, a reduced Vv of nuclei were observed.
Volume fraction of fibroblast–implant region
In the central implant region, Prolene implants showed statistically the highest Vv of fibroblasts for both 28 and 56 days (7.5% and 11%, respectively), Peri-Guard, Surgisis and EDCxCEM all showed similar Vv of fibroblasts at 28 days (1.4%, 1.5%, and 2.6%, respectively). The Vv of fibroblasts increased significantly to 5.4% for Surgisis at 56 days. Although the Vv of fibroblasts for EDCxCEM also increased from 2.6% to 4.7%, this was not statistically significant.
At the periphery of the implant region, the Vv of fibroblasts for Prolene (9.1%) and of EDCxCEM (10.6%) were statistically higher than Peri-Guard (4%). The Vv of fibroblasts for Surgisis was 5.2% at 28 days and remained unchanged (5.8%) at 56 days. By 56 days, Vv of fibroblasts of the EDCxCEM mesh increased and was statistically higher (12.8%), when compared with the Peri-Guard and Surgisis groups. In comparison, the Vv of fibroblasts of Peri-Guard and Prolene decreased to 1.8% and 6.5%, respectively.
Overall, it was observed that the Vv of fibroblasts broadly parallels the Vv of nuclei in the implant region. This supports the suggestion of continuous remodeling of the implant region by host inflammatory cells (represented by Vv of nuclei) which degrade and remove the implants, while host fibroblasts (represented by Vv of fibroblasts) replace the implant area with fibrous connective tissues. The high Vv of fibroblasts with Prolene was related to the spaces between the polypropylene filaments that allowed rapid connective tissue ingrowth both at the central and peripheral areas. This effect was also observed with EDCxCEM at the peripheral implant area (10.6% at 28 days; 12.8% at 56 days) as EDCxCEM has been shown to be fibroporous. However, in the central implant area, the Vv of fibroblasts for EDCxCEM was not as high as at the peripheral implant area at 56 days (4.7%), as it takes time for the fibroblasts to reach the central implant area.
Volume fraction of fibroblast–fibrous tissue region
In the central fibrous tissue region, the Vv of fibroblasts for Peri-Guard, Surgisis, and EDCxCEM were similar at ∼18–20% at 28 days. The Vv of fibroblasts for EDCxCEM (20.2%) was statistically higher than Prolene (13.1%) in this period. After 56 days, the Vv of fibroblasts for Peri-Guard (8.9%), Surgisis (11.9%), and EDCxCEM (12%) decreased to approximately half their initial level and these changes were statistically significant.
The Vv of fibroblasts in the peripheral fibrous tissue region showed the same pattern as the central fibrous tissue region. Peri-Guard, Surgisis, and EDCxCEM implants all showed high Vv of fibroblasts of up to 20% at 28 days. On day 56, the values decreased significantly for Peri-Guard (5.7%) and Surgisis (10.1%). The Vv of fibroblasts in both the central area and the peripheral area of the fibrous tissue region did not resemble the implant region. Fibroblasts showed a high volume fraction early in the healing process (28 days), and their density decreased after 56 days. For Prolene, this process occurred earlier as evident by the lower Vv of fibroblasts at 28 days.
Volume fraction of implant (implant collagen/mesh)
In the central implant region, the Vv of all implant types remained statistically unchanged from 28 to 56 days. The nondegradable Peri-Guard showed a stable Vv of 90% throughout the study period. The Vv of Surgisis decreased from 50% to 41% but this was not statistically significant. The Vv of EDCxCEM was virtually unchanged from 28 days (31.3%) to 56 days (29.6%). The Vv of the polypropylene fibers of Prolene mesh was also virtually unchanged from 28 days (33%) to 56 days (30.5%).
At the peripheral implant region, EDCxCEM showed a statistically significant decrease in Vv of implant from 28 to 56 days (18.5–6.8%). There was no significant change for Prolene (18.4–27.9%), Peri-Guard (81–84%), and Surgisis (45.7–27%) over time. Although Surgisis is a degradable implant and the Vv of Surgisis showed a decrease, it did not reach statistical significance at 56 days. As expected, the Vv of Peri-Guard was still very high at 84% at 56 days. Although not statistically significant, the Vv of Prolene mesh showed a visible increase from 18.4% to 27.9%, which may indicate the beginning of the process of host tissue maturation and contraction of fibrous connective tissue between its polypropylene mesh filaments.
When comparing the central implant region with the peripheral implant region, only the EDCxCEM group showed a statistically significant decrease in Vv of implant collagen at 56 days (29.6–6.8%). The Vv of implant in the peripheral implant area of EDCxCEM at 56 days (6.8%) was statistically lower than for all the other groups (Prolene [27.9%], Peri-Guard [84%] and Surgisis [27%]).
The Vv of implant collagen/mesh fibers can be used as an indication of scaffold degradation or changes in the mesh-tissue composite. Implant collagen displayed different morphology compared to native host collagen–implant collagens showed a denser and darker color, generally acellular and they stood out against the background host tissue morphology.
The central implant region showed less statistically significant changes than the peripheral implant region with Vv of implant collagen/mesh that evaluates scaffold degradation. In vivo degradation of degradable implants (EDCxCEM and Surgisis) was observed at the peripheral implant area, represented by their respective reduction in Vv of implant collagen over the study period and when compared to their respective central implant areas. The low Vv of Prolene and EDCxCEM illustrated the degree of porosity within these scaffold structures. In comparison, the dense collagen bundles arrangement in Peri-Guard and the layered small intestinal submucosa in Surgisis explained their overall higher Vv. The increase in Vv of Prolene suggests contraction of the implant area causing mesh contraction.
Volume fraction of native collagen–implant region
In the central implant region, there was a high Vv of native host collagen (24.6%) within Prolene meshes at 28 and 56 days (26.7%). The Vv of native collagen for Surgisis increased from 3.6% at 28 days to 8% at 56 days and the Vv of native collagen for EDCxCEM increased from 11.5% to 19.4%; however, both did not reach statistical significance. As expected, Peri-Guard showed negligible Vv of native collagen.
In the peripheral implant region, the Vv of native collagen for Prolene mesh was very high at 40% by 28 days, and this level was maintained at an average of 36% at 56 days. Although the Vv of native collagen for Surgisis showed an increase (6.9–10.8%), the changes were not significant. In contrast, EDCxCEM showed a statistically significant increase in Vv of native collagen from 28 days (14.7%) to 56 days (39%). Again, Peri-Guard showed negligible native collagen in this region.
When the peripheral implant region was compared to the central implant region, only the EDCxCEM mesh showed a statistically significant increase in Vv of native collagen. At 56 days, the Vv of native collagen in the peripheral implant region of EDCxCEM was 39%, significantly higher when compared to its central implant region (19.4%).
Native host collagen was rapidly laid down within the gaps of the Prolene mesh. The secretion of native extracellular matrix is produced by host tissue fibroblasts. Therefore, the Vv of host collagen resembled the pattern of Vv of fibroblasts in the implant region. Only the Vv of EDCxCEM showed statistical difference between the peripheral and central regions at 56 days. EDCxCEM encouraged collagen deposition by two mechanisms—its fibroporous nature (similar to Prolene mesh) and the remodeling of implant area following scaffold degradation, although this remodeling process is likely slower than Surgisis.
Volume fraction of native collagen–fibrous tissue region
In the central fibrous tissue region, Prolene showed statistically the highest Vv of native collagen when compared to other groups at both time points. The Vv of native collagen for Prolene at 28 days was 64%, and 73% by 56 days. The Vv of native collagen for Peri-Guard, EDCxCEM, and Surgisis were 59.8–46%, 41.4–43.2%, and 37.2–27.2% at 28 and 56 days, respectively. At 56 days, the Vv of native collagen for Surgisis was statistically the lowest compared with other groups.
Again in the peripheral fibrous tissue region, Prolene (64.2%) showed statistically higher Vv of native collagen at 28 days compared with Peri-Guard (42.9%), and Surgisis (24.4%), but not to EDCxCEM (34%). EDCxCEM showed a significant increase in Vv of collagen (from 34% to 52.1%) between 28 and 56 days. None of the other three groups showed this increase over time. By this time, the Vv of EDCxCEM became higher than both Peri-Guard (36%) and Surgisis (24%), and no difference to Prolene (60%).
It was observed that Prolene mesh showed the highest volume fraction of native collagen deposition at both time points. This was faster for Prolene because there was no implant degradation in the vicinity that delayed collagen matrix deposition. For the degradable biological scaffolds, however, collagen deposition had to be balanced with the demands of ongoing implant degradation. In the cases of Surgisis and EDCxCEM, it appeared depositions of collagen were reduced by the presence of degrading scaffolds.
Surface density of blood vessels: implant region
In the central implant region, Sv of blood vessels for Surgisis (1.43 × 104 μm2/μm3) was significantly lower than the other groups at 28 days (Prolene 18.5 × 104 μm2/μm3, Peri-Guard 11.5 × 104 μm2/μm3, EDCxCEM 20.5 × 104 μm2/μm3). After 56 days, Sv of blood vessels for Surgisis (21.4 × 104 μm2/μm3) had increased significantly to level similar to Prolene (24.7 × 104 μm2/μm3) and EDCxCEM (16.1 × 104 μm2/μm3). Peri-Guard showed a lower Sv of blood vessels (2.9 × 104 μm2/μm3) even at 56 days as blood vessels were unable to infiltrate the nondegradable and stiff Peri-Guard.
For the peripheral implant region, the Sv of blood vessels in this region was generally higher than the central area due to their location at the implant margins. This is due to the increased surface area in contact with host tissue that permits blood vessel infiltration. The Sv of blood vessels for Prolene (25.3 × 104 μm2/μm3) was significantly higher than Surgisis (4.1 × 104 μm2/μm3) at 28 days while the Sv of blood vessels for the EDCxCEM mesh was not significantly different when compared with the other groups at 28 days. The porosities of Prolene mesh and EDCxCEM architecture allowed blood vessels in growth. After 56 days, Sv of blood vessels for Surgisis (25.3 × 104 μm2/μm3) increased significantly (to level similar to Prolene [23.6 × 104 μm2/μm3] and EDCxCEM [22.7 × 104 μm2/μm3]), likely due to infiltration by cells and implant degradation at this time point. Since Prolene is a nondegrading macroporous material (allowing blood vessels within the mesh interstices) and EDCxCEM was designed to be slowly degrading (sustained blood vessels ingrowth as EDCxCEM was still undergoing degradation), the Sv of blood vessels were still high at 56 days. As expected, the Sv of blood vessels for Peri-Guard (5.6 × 104 μm2/μm3) was statistically the lowest when compared with the other groups at this time point.
Surface density of blood vessels: fibrous tissue region
At 28 days, in the central fibrous tissue region, the Sv of blood vessels of the EDCxCEM mesh (52.4 × 104 μm2/μm3) was statistically higher than Peri-Guard (24.2 × 104 μm2/μm3) and Surgisis (19.5 × 104 μm2/μm3), but not statistically different when compared to Prolene (39.6 × 104 μm2/μm3). Both the EDCxCEM and Prolene meshes had the highest Sv of blood vessels because they promoted early cellular infiltration and angiogenesis was stimulated at this early stage in the fibrous tissue area. After 56 days, the Sv of blood vessels for all four groups were similar, which indicated a continued host response to remodel or degrade the implants (EDCxCEM 34.3 × 104 μm2/μm3, Peri-Guard 23.7 × 104 μm2/μm3, Surgisis 33.4 × 104 μm2/μm3, and Prolene 32.1 × 104 μm2/μm3).
In the peripheral fibrous tissue region, the Sv of blood vessels of EDCxCEM (62.2 × 104 μm2/μm3) in this region was statistically higher than Prolene (21.9 × 104 μm2/μm3), Peri-Guard (17.5 × 104 μm2/μm3), and Surgisis (31.6 × 104 μm2/μm3) at 28 days. By 56 days, the Sv of blood vessels of EDCxCEM (40.5 × 104 μm2/μm3) has reduced and was no longer statistically higher than Peri-Guard (41.2 × 104 μm2/μm3) and Surgisis (37.1 × 104 μm2/μm3). The Sv of blood vessels for Peri-Guard significantly increased from 28 to 56 days, but there was no difference over time for the other groups. Prolene showed the lowest overall Sv at its 56 days time point (18.7 × 104 μm2/μm3) when compared to other groups which indicate completion of tissue remodeling and maturation of the peripheral fibrous tissue region of Prolene, while this process was still ongoing for the other implants.
Length density of blood vessels: implant region
In the central implant region, Prolene (5.2 × 104 μm/μm3), Peri-Guard (3.6 × 104 μm/μm3), and EDCxCEM (5.3 × 104 μm/μm3) all showed high Lv of blood vessels, while the Lv of blood vessels for Surgisis (0.31 × 104 μm/μm3) was statistically the lowest at 28 days time point. The presence of blood vessels within bovine pericardium could be explained by host vasculature present on the surface/edge of Peri-Guard (3.6 × 104 μm/μm3) as inflammatory cells attempt to infiltrate the collagen structure. After 56 days, the Lv of blood vessels for Surgisis increased significantly (5.2 × 104 μm/μm3) to Lv similar to Prolene (4.9 × 104 μm/μm3) and EDCxCEM (5.1 × 104 μm/μm3). This can be explained by cellular infiltration into Surgisis and progressive degraded at this stage. The Lv of blood vessels for Peri-Guard at 56 days (1.2 × 104 μm/μm3) was statistically lower when compared with Prolene, Surgisis, and EDCxCEM. The high initial length density of blood vessels seen with Prolene and EDCxCEM could be attributed to their porous nature.
In the peripheral implant area, Lv of vessels in this region showed the same pattern as the central implant region. There was a statistically significant increase in Lv of blood vessels for Surgisis from 28 days (1.03 × 104 μm/μm3) to 56 days (6.4 × 104 μm/μm3). There was no statistical difference when comparing the Lv of blood vessels between the different implant groups at 56 days
Overall, both Prolene and EDCxCEM showed a uniform Lv of blood vessels for both the central and peripheral implant areas at 28 and 56 days (ranging between 4.7 × 104 μm/μm3 and 5.5 × 104 μm/μm3. In contrast, Peri-Guard showed a decrease in the Lv of blood vessels from 28 to 56 days for both the central (3.6 × 104 μm/μm3 to 1.2 × 104 μm/μm3) and peripheral implant (4.6 × 104 μm/μm3 to 2.1 × 104 μm/μm3) areas. Surgisis showed increase in the Lv of blood vessels from 28 to 56 days for both the central (0.31 × 104 μm/μm3 to 5.2 × 104 μm/μm3) and peripheral implant (1.02 × 104 μm/μm3 to 6.4 × 104 μm/μm3) areas.
Length density of blood vessels: fibrous tissue region
The Lv of blood vessels in the central fibrous tissue region of EDCxCEM (13.5 × 104 μm/μm3) was statistically higher than Peri-Guard (7.3 × 104 μm/μm3) and Surgisis (5.4 × 104 μm/μm3) and not significantly different from Prolene (8.8 × 104 μm/μm3). The was reflected also by the higher cellular activity (high Vv of fibroblast and moderate Vv of nuclei) indicating remodeling of this region in the viscinity of a slowly degrading EDCxCEM implant. There was no statistical difference in the Lv of blood vessels at 56 days between the four groups (Prolene 7.0 × 104 μm/μm3, Peri-Guard 7.8 × 104 μm/μm3, Surgisis 8.2 × 104 μm/μm3, and EDCxCEM 8.2 × 104 μm/μm3).
The Lv of blood vessels in the peripheral fibrous tissue area was similar to the pattern seen at the central fibrous tissue area. The Lv of blood vessels of EDCxCEM (18.8 × 104 μm/μm3) was statistically higher than Prolene (5.1 × 104 μm/μm3), Peri-Guard (4.5 × 104 μm/μm3), and Surgisis (8.04 × 104 μm/μm3) at 28 days. However, there was a statistically significant increase of Lv of blood vessels for Peri-Guard from 28 days (4.5 × 104 μm/μm3) to 56 days (11.0 × 104 μm/μm3), which may be attributed to the continuing angiogenesis to support inflammatory cells to degrade the densely cross-linked pericardium. There was an increase in Lv of blood vessels for Surgisis from 28 days (8.04 × 104 μm/μm3) to 56 days (10.7 × 104 μm/μm3) but this increase was not statistically significant. In comparison, by 56 days, the Lv of blood vessels of Prolene implants (5.07 × 104 μm/μm3) was statistically the lowest, indicating maturation of its fibrous tissue area. Even though there was a decrease in Lv of blood vessels for the peripheral fibrous tissue area at 56 days for EDCxCEM (12.7 × 104 μm/μm3), indicating the early phase of host tissue maturation in this region, this decrease was not statistically significant.
Radius of diffusion
As expected the radius of diffusion was the lowest in the peripheral fibrous tissue region, followed by central fibrous tissue region. Since blood vessels ingrowth occurred from the periphery, it was expected that the central implant area would have delayed vessels ingrowth compared with the peripheral areas. Peri-Guard and Surgisis had the highest radius of diffusion at 28 days, and can be explained by their dense architecture or layering that prevented capillary ingrowth. At 56 days, the radius of diffusion for Surgisis improved to the levels similar to Prolene and EDCxCEM. This can be attributed to the degradation of Surgisis and hence, allowing blood vessels to infiltrate more readily.
Discussion
Seroma and adhesion formation remained a complication common to nondegradable meshes, whether they were synthetic or biologic in nature. We found that seroma complicated 75% of Peri-Guard meshes, which typically occurred within the first 3 days postsurgery (Fig. 3c). Interestingly, all Surgisis meshes were found to have seroma at 3 days postsurgery. The Peri-Guard mesh has a naturally thick and dense collagenous matrix that prevented large amounts of fluid from permeating through its layer immediately after surgery. In contrast, although each layer of Surgisis is thin, Surgisis is designed as a laminated construct. Once fluid entered these layers (within the initial 3 days) and coupled with the inflammatory process, trapped fluid within these layers had difficulty escaping (Fig. 3a). In a small clinical study comparing abdominal wall closure following open abdominal aortic aneurysm repair with primary closure versus augmentation with Peri-Guard meshes, seroma occurred in 10% of patients repaired with Peri-Guard meshes. 49 However, the authors had anticipated this and made multiple small incisions in the mesh during surgery and inserted drains to prevent seroma formation. The problem with the design of multilayered Surgisis was highlighted by Gupta and co-authors who reported a rate of seroma formation as high as 91%. Explanted Surgisis meshes revealed unincorporated middle layers. This prompted the authors to use a perforated version of the mesh in the latter part of the study. 39
Postoperative adhesion is a major cause of intestinal obstruction, and it may lead to bowel strangulation, necrosis, and mortality.50,51 Intraperitoneal contact with a polypropylene mesh is associated with a higher rate of adhesions and it is believed that the macroporosity and reticular structure of polypropylene meshes encourages fibroblasts integration and adherence to visceral peritoneum.52–54 The microporous laminar structure of polytetrafluoroethylenen is thought to encourage the formation of mesothelium cells parallel to the mesh surface and thus, reduce intraperitoneal adhesions.54–57 These hypotheses were consistent with our findings that adhesions formed in 50% of the rabbits implanted with polypropylene, and of these, at least 25% of the mesh surfaces were involved (Fig. 4). However, intraperitoneal placement of all three biologic meshes in this study were associated with very low adhesion rates. Biologic meshes are closer to a microporous laminar structure rather than a reticular macroporous structure. To avoid adhesions on the suture lines which occurred in our cases, we proposed modifying the suturing technique to reduce the amount of permanent suture material on the intraperioneal side or the use of absorbable sutures.
From the analysis done on changes to dimensions of the mesh area, we found that the changes to the mesh area width were the most reliable for distinguishing stretching or contraction of the mesh area. When we examine the changes in mesh area length, which demonstrated an increase for all mesh types, we can deduce that at least a proportion, if not all, of the increase/changes seen, were caused by growth. Therefore, based on our calculations, an expected stretch of 4% and up to 10% can be attributed to growth. Prolene meshes were known to shrink but there was a 4% increase in the mesh area length. This would mean that growth was reduced by mesh shrinkage in the Prolene group. Hence, it was likely that growth was above 4%. In comparison, the change in length was 10% for Surgisis meshes, a mesh known to stretch. All of the changes here could be attributed to mesh stretching or a proportion contributed by growth. Hence, it can be concluded that growth was expected to be above 4% and under 10% after 56 days.
Mesh shrinkage has plagued the performance of synthetic meshes since their introduction. We found that the area of the polypropylene shrank by 12% and 18% at day 28 and 56, respectively (Fig. 5). It is believed that scar tissues build up around synthetic filaments. When each filament is close together (small pore diameter <600–800 μm), the scar tissue will bridge from one filament to another across the narrow pores, forming a large scar plate across the mesh.15,58,59 Macroporous light weight meshes are designed to overcome this problem60–64 by spreading the filaments further apart and thus, prevent the scar tissue from bridging the wider pores.
In a preperitoneal implantation (without defect) in dogs, heavy weight polypropylene (Marlex) meshes were found to shrink by 45% in mesh area size after 4 weeks, associated with ∼25% shortening in both vertical and horizontal directions. The biggest changes were recorded between 4 and 8 weeks. 65 Intraperitoneal long-term placement of the Marlex mesh resulted in up to 15.8% shrinkage in a rabbit study at 1 year. 66 In another rabbit study comparing onlay versus sublay placement of polypropylene meshes to repair 3 × 3 cm pararectal defects on each side, mesh area showed an average reduction of 25.9%, 28.7%, and 29.0% at 30, 60, and 90 days, respectively. The onlay method (37.5% shrinkage at 90 days) showed a statistically higher shrinkage when compared with the sublay method (23.4% shrinkage). 67 Another study using a polypropylene mesh to repair a 7 × 5 cm defect in rabbits showed 13.8% shrinkage after 90 days. 68 However, in a subcutaneous implantation study in rats, a polypropylene mesh showed only 8.8% shrinkage at 56 days. 69 A clinical study of 30 patients using digital radiographic evaluation, the shrinkage of a heavy weight polypropylene (Prolene) mesh were estimated to be 7.8% at 90 days postsurgery. 70
The phenomena of mesh area stretching and its clinical relevance has been largely unexplored experimentally. In this study, stretching of the mesh area was found to affect Surgisis meshes significantly, where there was a 5% increase in size at day 28, and this increased to 48% at day 56 (Fig. 5). This can be explained by the degradation of the noncross-linked Surgisis meshes between day 28 and 56. Noncross-linked CEM was also found to degrade relatively quickly in a subcutaneous implantation rat model.41,71 By cross-linking CEM, the degradation of the EDCxCEM mesh was manipulated to prevent untimely degradation, 72 while allowing cellular infiltration and mesh remodeling to take place in a slower but predictable manner. 41 This was evident by the increase in the Vv of host tissue native collagen in the EDCxCEM group between day 28 and 56 (Fig. 7).
In this study, we elected to study the response from day 28 onward as acute inflammatory responses would be resolved at this point. Hence, host tissue responses that were related to the presence of the meshes in the period after the acute inflammation/surgical trauma phase could be evaluated. Following implantation, the processes of inflammation, mesh degradation, cellular infiltration, collagen deposition, and eventual tissue remodeling were observed. The extent of each process was determined by host factors and mesh characteristics—which has been previously reviewed by our group. 73
Inflammation was found to be a common feature to all meshes—whether biologic or synthetic, degradable or nondegradable. It is known that inflammation plays an essential role in wound healing provided that the process is appropriate and temporary.74–79 Prolonged inflammation can lead to tissue damage and fibrosis. If the cause of inflammation is not removed, the inflammation will become chronic, causing further damage to tissues. Similarly, if a mesh is not degradable or releases damaging nonbiodegradable products, the inflammation will become chronic, promoting fibrosis around the mesh (encapsulation) and/or a foreign body reaction.73,77,80–84 This will continue until the cause of the inflammation is removed.
It was generally accepted that cross-linked meshes were associated with FBGCs, which are not associated with noncross-linked meshes.85–87 FBGCs were assumed in general, to be associated with detrimental tissue response and generally not observed with degradable biologic meshes and have been cited as a negative feature.77,80,86 However, two interesting observations were found in this study. First, we found that FBGCs were consistently present in all mesh groups (Fig. 6). In the nondegradable mesh groups (Prolene and Peri-Guard), FBGCs were commonly found on the tissue–mesh interface. In the degradable mesh groups (EDCxCEM and Surgisis), however, FBGCs were often observed near the degrading mesh collagen, with small pieces of collagen observed within the giant cells. The degradation sites were observed on the mesh surface initially, but progressed to the thickness of the mesh by day 56 in both the Surgisis and EDCxCEM groups. FBGCs were known to participate in mesh degradation, as a response to “frustrated phagocytosis” when macrophages were unable to easily phagocytose the mesh in the early phase of chronic inflammation. Our observation confirmed that they actively participate in collagen-based mesh degradation. Second, we found that FBGCs did not persist in the mesh areas where the implanted mesh had degraded. This suggests that their presence in the mesh area were temporary and therefore, do not always interfere negatively with tissue remodeling. Hence, we hypothesize that FBGCs in the vicinity of degrading meshes is not a negative final consequence but rather a natural host tissue response to degradation in vivo. Further investigation is warranted to verify this.
The degraded areas showed a combination of loose immature collagen and mature denser collagen, with immature collagen being observed closer to the mesh (Fig. 6). These observations indicated that remodeling continued after the mesh had been degraded. The lack of mesh area stretching/shrinkage in the EDCxCEM group showed that the remodeled tissues was adequate to prevent hernia formation in the early period. Stretching of the Surgisis mesh would suggest untimely degradation and inadequate remodeling of the mesh area. In contrast, shrinkage of the Prolene mesh area signifies fibrosis due to continued foreign body reaction and disorganized remodeling of the surrounding tissue.
Neovascularization is essential for the process of initial wound healing and mesh remodeling. Neovascularization of biologic meshes is recognized as one of the crucial properties of biologic meshes to resists bacterial infection.88,89 Facilitation of early blood vessel ingrowth into the three-dimensional structure of meshes allows an increased number of host inflammatory cells to infiltrate the mesh. An environment within the mesh that benefited from inflammatory pathways helps to reduce and eliminate mesh infection.90,91 Although neovascularization is important, the ability of meshes to tolerate the presence of infection is hypothesized to be influenced by other factors, which include biomaterial porosity, degradability, and surface biochemical properties. When used in a potentially contaminated field, enhancing the meshes ability to resist increased level of enzymatic degradative activity is critical to the success of its clinical objective. One method to achieve this is by providing supplementary cross-linking to the collagen structure so that a higher concentration of degradative enzymes could be tolerated, and untimely degradation avoided. In our observation (Fig. 7), we found that stereological parameters for blood vessels were related to the ability to promote tissue infiltration in the earlier phase (day 28), and the demand of degradation and inflammation in the later phase (day 56). Completion of remodeling was associated with a decrease in the volume fraction of blood vessels and an increase in host collagen. This was observed as the remodeled area becomes less cellular and structurally more organized. Therefore, angiogenesis played an important role in supporting acute injury and inflammation, subsequent removal of the mesh and host degradation products, and finally contributed to the synthesis and maintenance of the remodeled host collagen matrix.
Conclusion
In this study, the cross-linked EDCxCEM mesh prototype was compared against three established clinical products. The overall macroscopic and stereological parameters were evaluated and their changes over time were summarized in the schematic diagram (Fig. 8). The EDCxCEM mesh exhibited optimal biological tissue response and degradation rate in a rabbit in vivo model. Cross-linked EDCxCEM mesh demonstrated potential as a promising biologic mesh for clinical application in abdominal wall repair.

Summary of macroscopic appearance (top) and stereological parameters (bottom) of four meshes investigated in this study.
Footnotes
Acknowledgments
We acknowledge the graphic design assistance of Mr. Maciej Doczyk and the editorial assistance of Mr. Keith Feerick. The authors gratefully acknowledge the financial support from Enterprise Ireland (Technology Development Grant). This publication has emanated from research conducted with the financial support of Science Foundation Ireland (SFI) and is co-funded under the European Regional Development Fund under Grant Number 13/RC/2073. We also acknowledge support from the Centre for Microscopy & Imaging funded by NUI Galway and PRTLI, Cycles 4 and 5, National Development Plan 2007–2013.
Disclosure Statement
No competing financial interests exist.