
Abstract
Melanoma cell sensitivity to targeted therapy molecules is dependent on the tumor microenvironment (cell–cell and cell–extracellular matrix interactions). Three dimensional (3D) in vitro cell culture systems better reflect the native structural architecture of tissues and are attractive to investigate cellular interactions. We have developed and compared several metastatic melanoma (MM) models: melanoma cells (SK-MEL-28 and SK-MEL-3, BRAF V600E mutant and SK-MEL-2 BRAF wt) cultured as a monolayer (2D) and cocultured on 3D dermal equivalents with fibroblasts to better unravel factors modulating cell sensitivity to a BRAF inhibitor (BRAFi, vemurafenib). Cell sensitivity to treatments was evaluated under various aspects: cell proliferation (cell counting, EdU incorporation, MTS assay), MAPK and PKB/Akt signaling pathway analysis (Western blotting), apoptosis (TUNEL), cytokine and growth factor release (ELISA), and histology (3D models). SK-MEL-28 and SK-MEL-3 cell proliferation inhibition upon BRAFi treatment was observed in both models, without apoptosis induction. SK-MEL-2 cell line was clearly resistant to BRAFi when cultured as a monolayer but not when cocultured with 3D fibroblasts embedded in a type I collagen matrix. Conditioned-media provided by 3D fibroblasts (dermal equivalents) underlined 2D SK-MEL-2 cell sensitivity to BRAFi. Cell culture supernatant analysis revealed that dermal equivalents released some soluble factors (interleukin [IL]-6, IL-8, hepatocyte growth factor, transforming growth factor); these secretions were modified during vemurafenib treatment. The heterotypic 3D melanoma model we have established summarizes paracrine signalization by stromal cells and type I collagen matrix, mimicking the natural microenvironment of cutaneous MM. This model could be a powerful tool for predicting drug efficiency.
Impact Statement
Three dimensional in vitro cell culture systems better reflect the native structural architecture of tissues and are attractive to investigate cancer cell sensitivity to drugs. We have developed and compared several metastatic melanoma (MM) models cultured as a monolayer (2D) and cocultured on three dimensional (3D) dermal equivalents with fibroblasts to better unravel factors modulating cell sensitivity to vemurafenib, a BRAF inhibitor. The heterotypic 3D melanoma model we have established summarizes paracrine signalization by stromal cells and type I collagen matrix, mimicking the natural microenvironment of cutaneous MM, and allows for the identification of potent sensitive melanoma cells to the drug. This model could be a powerful tool for predicting drug efficiency.
Introduction
Cutaneous melanomas have a high metastatic potential and can metastasize in-transit within the dermal and subdermal tissues. 1 The majority of melanomas have mutations associated with the MAPK pathway involved in cell growth, proliferation, and survival. The most common oncogenic activation of the MAPK pathway occurs with the constitutive activation of the BRAF kinase (with more than 97% BRAF mutation located in exon 600 of the gene). 2 Based on this frequent BRAF hyperactivation, BRAF inhibitors (BRAFis) emerged: vemurafenib was the first selective, reversible V600E BRAFi successfully developed and clinical trials demonstrated a median overall survival for patients who received vemurafenib to be significantly better compared with dacarbazine. 3 However, intrinsic mechanism of resistance (estimated in 10–15% of patients) and acquired resistance were unfortunately observed.
Cancer cell sensitivity to drugs is highly dependent on the microenvironment (cell–cell and cell–extracellular matrix interactions). Preclinical 3D in vitro coculture models are known to be more complex systems than monolayer cell culture and mimic the physiological environment more closely. Indeed, dermal equivalents reconstructed with fibroblasts provide a relevant environment for MM cells 4 and are able to modulate the melanoma cell response to doxorubicin, a well-known chemotherapeutic drug but classically not used for the treatment of MM. Currently the impact of this reconstructed tissue on MM cell response to BRAFi is not well understood.
To investigate the role of the microenvironment on MM cell sensitivity to BRAFi, we developed a 3D human dermal equivalent, with human dermal fibroblasts (HDFns) embedded in a collagen gel to mimic the cutaneous MM environment. MM cells were cultured as a monolayer or in the dermis, and the sensitivity of melanoma cells to vemurafenib was characterized. Our data revealed that the dermal equivalent mirrors the natural environment of MM as expected and that melanoma cell sensitivity to BRAFi requires dermal tissue. This model could be relevant for assessing intrinsic sensitivity of MM cells derived from patients and for personalized therapy.
Materials and Methods
Cell and tissue models
Monolayer cell (2D) culture
The human MM cell lines (SK-MEL-28 ATCC® HTB-72™, SK-MEL-3 ATCC HTB-69™, and SK-MEL-2 ATCC HTB-68™) were obtained from the American Type Culture Collection. HDFns were purchased from Life Technologies (Cascade biologics, Invitrogen cell culture). Cells were cultured as monolayers in minimum essential medium (MEM) (SK-MEL-28, SK-MEL-2), RPMI 1640 (SK-MEL-3), or Dulbecco's modified Eagle medium (DMEM) (HDFn). All cell culture media (Gibco, Invitrogen, France) were supplemented with 10% fetal bovine serum (FBS, Gibco, Invitrogen for melanoma cells; HyClone™ (United States) characterized for dermal fibroblasts), 2 mM
For treatment, MM cells were seeded on Falcon® polystyrene 24-well plates (104 cells/cm2) for 24 h allowing cell adhesion and spreading. Cells were then treated with increasing concentrations of vemurafenib (from 0.2 to 10 μM, Zelboraf®, selleckchem) for 48 h.
MM cells cocultured on dermal equivalent model (3D coculture)
The original bovine collagen type I solution (CellSystems Bio) was diluted from 3 to 1 mg/mL by adding MEM 10 × (Life Technologies, France), 1%
3D dermal equivalent models were first incubated at 37°C with 5% CO2 for 7 days (medium was changed every 2 or 3 days). MM lines (104 cells) were then added on the top of the dermal model with 1 mL of cell culture medium (MEM for SK-MEL-28 and SK-MEL-2, RPMI1640 for SK-MEL-3) and cultured for 24 h, before vemurafenib treatment for 48 h. The same time frame for assays and drug exposition was used on both the 2D and 3D coculture models to allow valid comparison.
Conditioned-media preparation
HDFns were seeded and cultured as monolayer or into a 3D collagen gel as described above with complete MEM. After 48 h treatment with BRAFi, the conditioned media (CM) were collected, centrifugated (500 g, 5 min), added to 1:1 with fresh complete MEM (0 or 10 μM vemurafenib), and placed on SK-MEL-2 cells for 48 h to assess the paracrine effect of fibroblasts on MM cell response.
Dermal equivalent characterization
For dermal equivalent models, samples were immersed in 4% paraformaldehyde overnight at 4°C and dehydrated by succession of ethanol baths and a xylene bath (1 h each). Then, each sample was embedded in paraffin blocks. Paraffin sections of 7 μm were then cut with a microtome (LEICA 2245). The cell organization in the reconstructed tissue was morphologically characterized using Hematoxylin, Eosin, and saffron (RAL Diagnostics and Q Path) or Masson's Trichrome Kit (RAL Diagnostics) stained paraffin sections. Images were taken by LEICA DMC 4500 Camera through LEICA DM 1000 LED microscope (France).
Cell proliferation assays
Cell proliferative index
After vemurafenib treatment, 2D cultured cells were detached from plates by incubation in 0.25% trypsin +1 mM ethylenediamine tetraacetic acid (EDTA) solution (Gibco, Invitrogen) for 5 min at 37°C. In the dermal equivalent model, the culture medium was removed and collagen gel containing cells was digested by 3 mL HBSS (Life Technologies) containing 200 U/mL type I collagenase (Life Technologies) for 5 h at 37°C. Dissociated cells (fibroblasts + MM) were then collected and counted using Malassez hemocytometer after Trypan blue staining. Cell proliferative index was calculated as the ratio between the number of living cells after treatment and the number of untreated cells. Cell viability was determined as the ratio between living cells and the number of total cells. All experiments were performed at least twice in triplicate (n ≥ 6).
Cell metabolic activity assay
Metabolic activity was quantified using MTS assay (CellTiter 96® Aqueous One Solution, Promega®). MTS solution (200 μL) was added to 1 mL of culture medium in each well for 2D monocultures and 5 mL of culture medium in each well for 3D coculture models (fibroblasts + MM). After 2 h of incubation at 37°C, three aliquots (100 μL) from each well were transferred into a 96-well cell culture plate (Corning Life Sciences, France). Optical density of samples was read by a Bio-Rad Model 680 microplate reader at 490 nm. The blank consisted of the culture medium containing MTS not bioreduced by cells. The absorbance reading of the blank was subtracted from all samples. Optical densities from test samples were then divided by the value obtained for the control, and the metabolic activity was expressed as percentages. All experiments were performed at least twice in triplicate (n ≥ 6). IC50 values for each cell line were calculated using nonregular regression (sigmoidal dose–response) of the plot of percentage inhibition versus inhibitor concentration in GraphPad Prism software.
EdU labeling
EdU staining (Click-iT® EdU Alexa Fluor® 488 Imaging Kit, Life Technologies) was conducted to measure cells' ability to proliferate upon BRAFi treatment (2D monoculture and 3D coculture). After 48 h of vemurafenib exposure, samples were first incubated in culture medium containing 10 μM EdU for 10 h to allow the incorporation of EdU into the DNA in proliferating cells. 2D cultured cells were then fixed for 15 min with 4% formaldehyde and permeabilized with 0.5% Triton® X-100 for 20 min. Click-iT reaction cocktail (100 μL) prepared from the assay kit was added. Samples were incubated at room temperature for 30 min and protected from light. 4′,6-diamidino-2-phenylindole (DAPI) solution (1 μg/mL) was applied onto each sample and incubated at room temperature for 30 min. Slides were mounted in VECTASHIELD H-1000 (Vector laboratories) and examined by epifluorescence microscopy (Leica DMI6000, exciting light at 450–490 and 512–542 nm). For 3D coculture models, frozen sections of samples were prepared: samples were immersed in 50% sucrose for 2 h then 2 M sucrose for 2 h at 4°C to displace water from cellular spaces. Samples were then blotted to remove excess sucrose solution and embedded in optimal cutting temperature (OCT) compound through a flash freezing procedure (samples were immersed in OCT inside a cylinder mold and placed upon the upper surface of liquid nitrogen for about 5 min). Flash-frozen tissue sections at 5 μm thickness were then cut into SuperFrost™ Ultra Plus slides by Cryostat LEICA CM3050 S (France). Tissues on slides were fixed (3.7% formaldehyde) and permeabilized (0.5% Triton X-100). EdU incorporation and DAPI staining were detected as described above. All experiments were performed at least twice, and EdU positive/negative cells were counted (n ≥ 6).
Clonogenicity assay
MM cells were seeded on six well plates (Falcon, 200 cells/well) for 24 h. Cells were then treated with vemurafenib for 15 days. After treatment, cells were fixed with methanol for 15 min and stained with 10% Giemsa (Sigma) for colony counting.
Apoptosis detection
To detect DNA fragmentation, a Click-iT Plus assay Alexa Fluor 594 (Life Technologies) was used. After BRAFi treatment as previously described, MM and HDFn 2D cell cultures were fixed for 15 min with 4% formaldehyde and permeabilized with 0.25% Triton X-100 for 20 min. For dermal equivalent models, samples were immersed in 4% formaldehyde overnight at 4°C and dehydrated. Then each sample was embedded in paraffin blocks. Paraffin sections of 7 μm were cut with a microtome (LEICA 2245), and the deparaffinization of tissue sections was needed before TdT reaction (succession of baths: xylene 5 min, 100% ethanol 5 min, 95% ethanol 5 min, 70% ethanol 5 min, and 1 × PBS 5 min). Tissue sections were permeabilized with the permeabilization reagent (Proteinase K solution) provided in the kit for 15 min. For the positive control, cells were incubated with 1 U of DNase I (Sigma) diluted in 1 × DNase I reaction buffer (20 mM Tris HCl, pH 8.4, 2 mM MgCl2, 50 mM KCl) for 30 min at room temperature.
A measure of 100 μL of TdT reaction buffer was added to each coverslip for 10 min at 37°C. Click-iT Plus TUNEL reaction cocktail was then added for 30 min at 37°C protected from light. Slides were mounted in VECTASHIELD H-1000 (Vector laboratories) and examined by epifluorescence microscopy (LEICA DMI 6000, exciting light at 450–495 and at 620–750 nm).
Cell signaling pathway analysis
For each experimental condition, complete cell extracts were prepared in RIPA buffer (HEPES KOH pH 7.4 [20 mM], sodium chloride (NaCl) [150 mM], EDTA [5 mM], sodium dodecyl sulfate (SDS) [0.1%], deoxycholate 0.5%, Triton 1%) complemented with protease and phosphatase inhibitors. Protein concentrations were determined with a BCA Kit (Thermo Fisher). Results were obtained by a spectrophotometer reading at 565 nm (Labsystems iEMS reader MF). A total of 200 μg of protein were precipitated with methanol (400 μL) and chloroform (100 μL). After centrifugation (10 min 16,000g), the pellet was resuspended with methanol (100 μL). The proteins were denatured in Laemmli sample buffer, heated at 99°C (5 min), loaded on SDS polyacrylamide gel electrophoresis, and transferred to nitrocellulose membranes using standard procedures. Membranes were saturated for 1 h in 5% milk in Tween-Tris-buffered saline (Tween 0.05%, NaCl 200 mM, Tris-HCl pH8), then rinsed and incubated overnight with rabbit monoclonal anti-p44/42 MAPK (ERK1/2) (# 4695, diluted 1/1000; Cell Signaling), rabbit monoclonal anti-phospho-p44/42 MAPK (T202/Y204) (# 9101; Cell Signaling), rabbit monoclonal anti MEK1/2 (#8727; Cell Signaling), rabbit monoclonal anti-phospho-MEK1/2 (Ser217/221) (#9154; Cell Signaling), rabbit polyclonal anti-Akt (#9272; Cell Signaling), rabbit monoclonal anti-phospho Akt (Ser473) (#4060; Cell Signaling), and mouse monoclonal anti-β-actin (Sigma Aldrich). Signals were detected using horseradish peroxidase-linked anti-mouse or anti-rabbit secondary antibodies (GE Healthcare). Protein expression was normalized to the loading control and the phosphorylated protein/total protein ratio was determined using the normalized values. Western blot experiments were reproduced at least thrice.
Soluble factor secretion analysis
After 48 h of vemurafenib exposure, cell culture supernatants from the upper and the lower part of the insert were harvested, pooled, and stored at −80°C. Cytokine and growth factor concentrations in cell culture media were quantified according to the protocol provided in the kits (Affymetrix eBioscience: interleukin [IL]-6 Human Uncoated ELISA kit; hepatocyte growth factor (HGF) Human Instant ELISA kit; transforming growth factor (TGF-β) beta-1 Human/mouse Uncoated ELISA Kit with plates; IL-8 Human Uncoated ELISA Kit with plates; Human tumor necrosis factor (TNF-α) ELISA Kit with plates; and Human IL-1 alpha Platinum ELISA Kit with plates). Experiments were performed at least twice in triplicate.
Statistical analysis
All statistical evaluations were performed using GraphPad InStat software. Continuous variables are expressed as mean ± standard deviation. As most of the continuous values measured had a nonGaussian distribution, nonparametric Dunn and Kruskal–Wallis tests were used for comparisons. A value of p < 0.05 was taken as significant.
Results
Three MM cell lines were studied: SK-MEL-28 and SK-MEL-3 lines both harboring a BRAF V600E mutation; SK-MEL-2 with wild-type BRAF. HDFn (was used for the establishment of the 3D dermal model) response to vemurafenib was also analyzed.
Characterization of the BRAFi effect on MM cell lines cultured as a monolayer (2D)
The effect of vemurafenib on cell proliferation capacity was assessed using different methods. First, total cell number was determined with trypan blue exclusion assay (Fig. 1A). Our data showed a significant decrease of the relative proliferation index of SK-MEL-28 cells cultured for 48 h with vemurafenib starting at the low concentration (0.2 μM). Proliferation of SK-MEL-3, SK-MEL-2, and HDFn was not significantly altered during the treatment, regardless of the BRAFi concentration. All cell viabilities remained high (more than 90%, data not shown). MTS assay (Fig. 1B) showed a significant decrease of SK-MEL-28 and SK-MEL-3 metabolic activities with IC50 = 1.16 and 0.95 μM, respectively. High BRAFi concentration (10 μM) had no significant impact on SK-MEL-2 cell proliferation (IC50 = 134.4 μM), but slightly decreased HDFn metabolic activity (IC50 = 39.4 μM). The percentages of proliferating cells were determined after EdU incorporation in treated cells (Fig. 1C); again a significant and dose-dependent decrease in DNA synthesis was observed when SK-MEL-28 and SK-MEL-3 cells were cultured with vemurafenib; the inhibitory effect of BRAFi on MM cell proliferation became significant for concentrations comprised between 0.5 and 2 μM. No significant effect was detected on SK-MEL-2 cells, and 10 μM vemurafenib weakly affected HDFn proliferation. To clarify the effect of vemurafenib on SK-MEL-3 cell line, clonogenicity tests were conducted on MM cells with long time contact between cells and BRAFi (Fig. 1D); BRAF mutant melanoma cells were sensitive to low concentrations of vemurafenib (below 1 μM), whereas the wild-type BRAF SK-MEL-2 cells were not (except for the highest concentration).
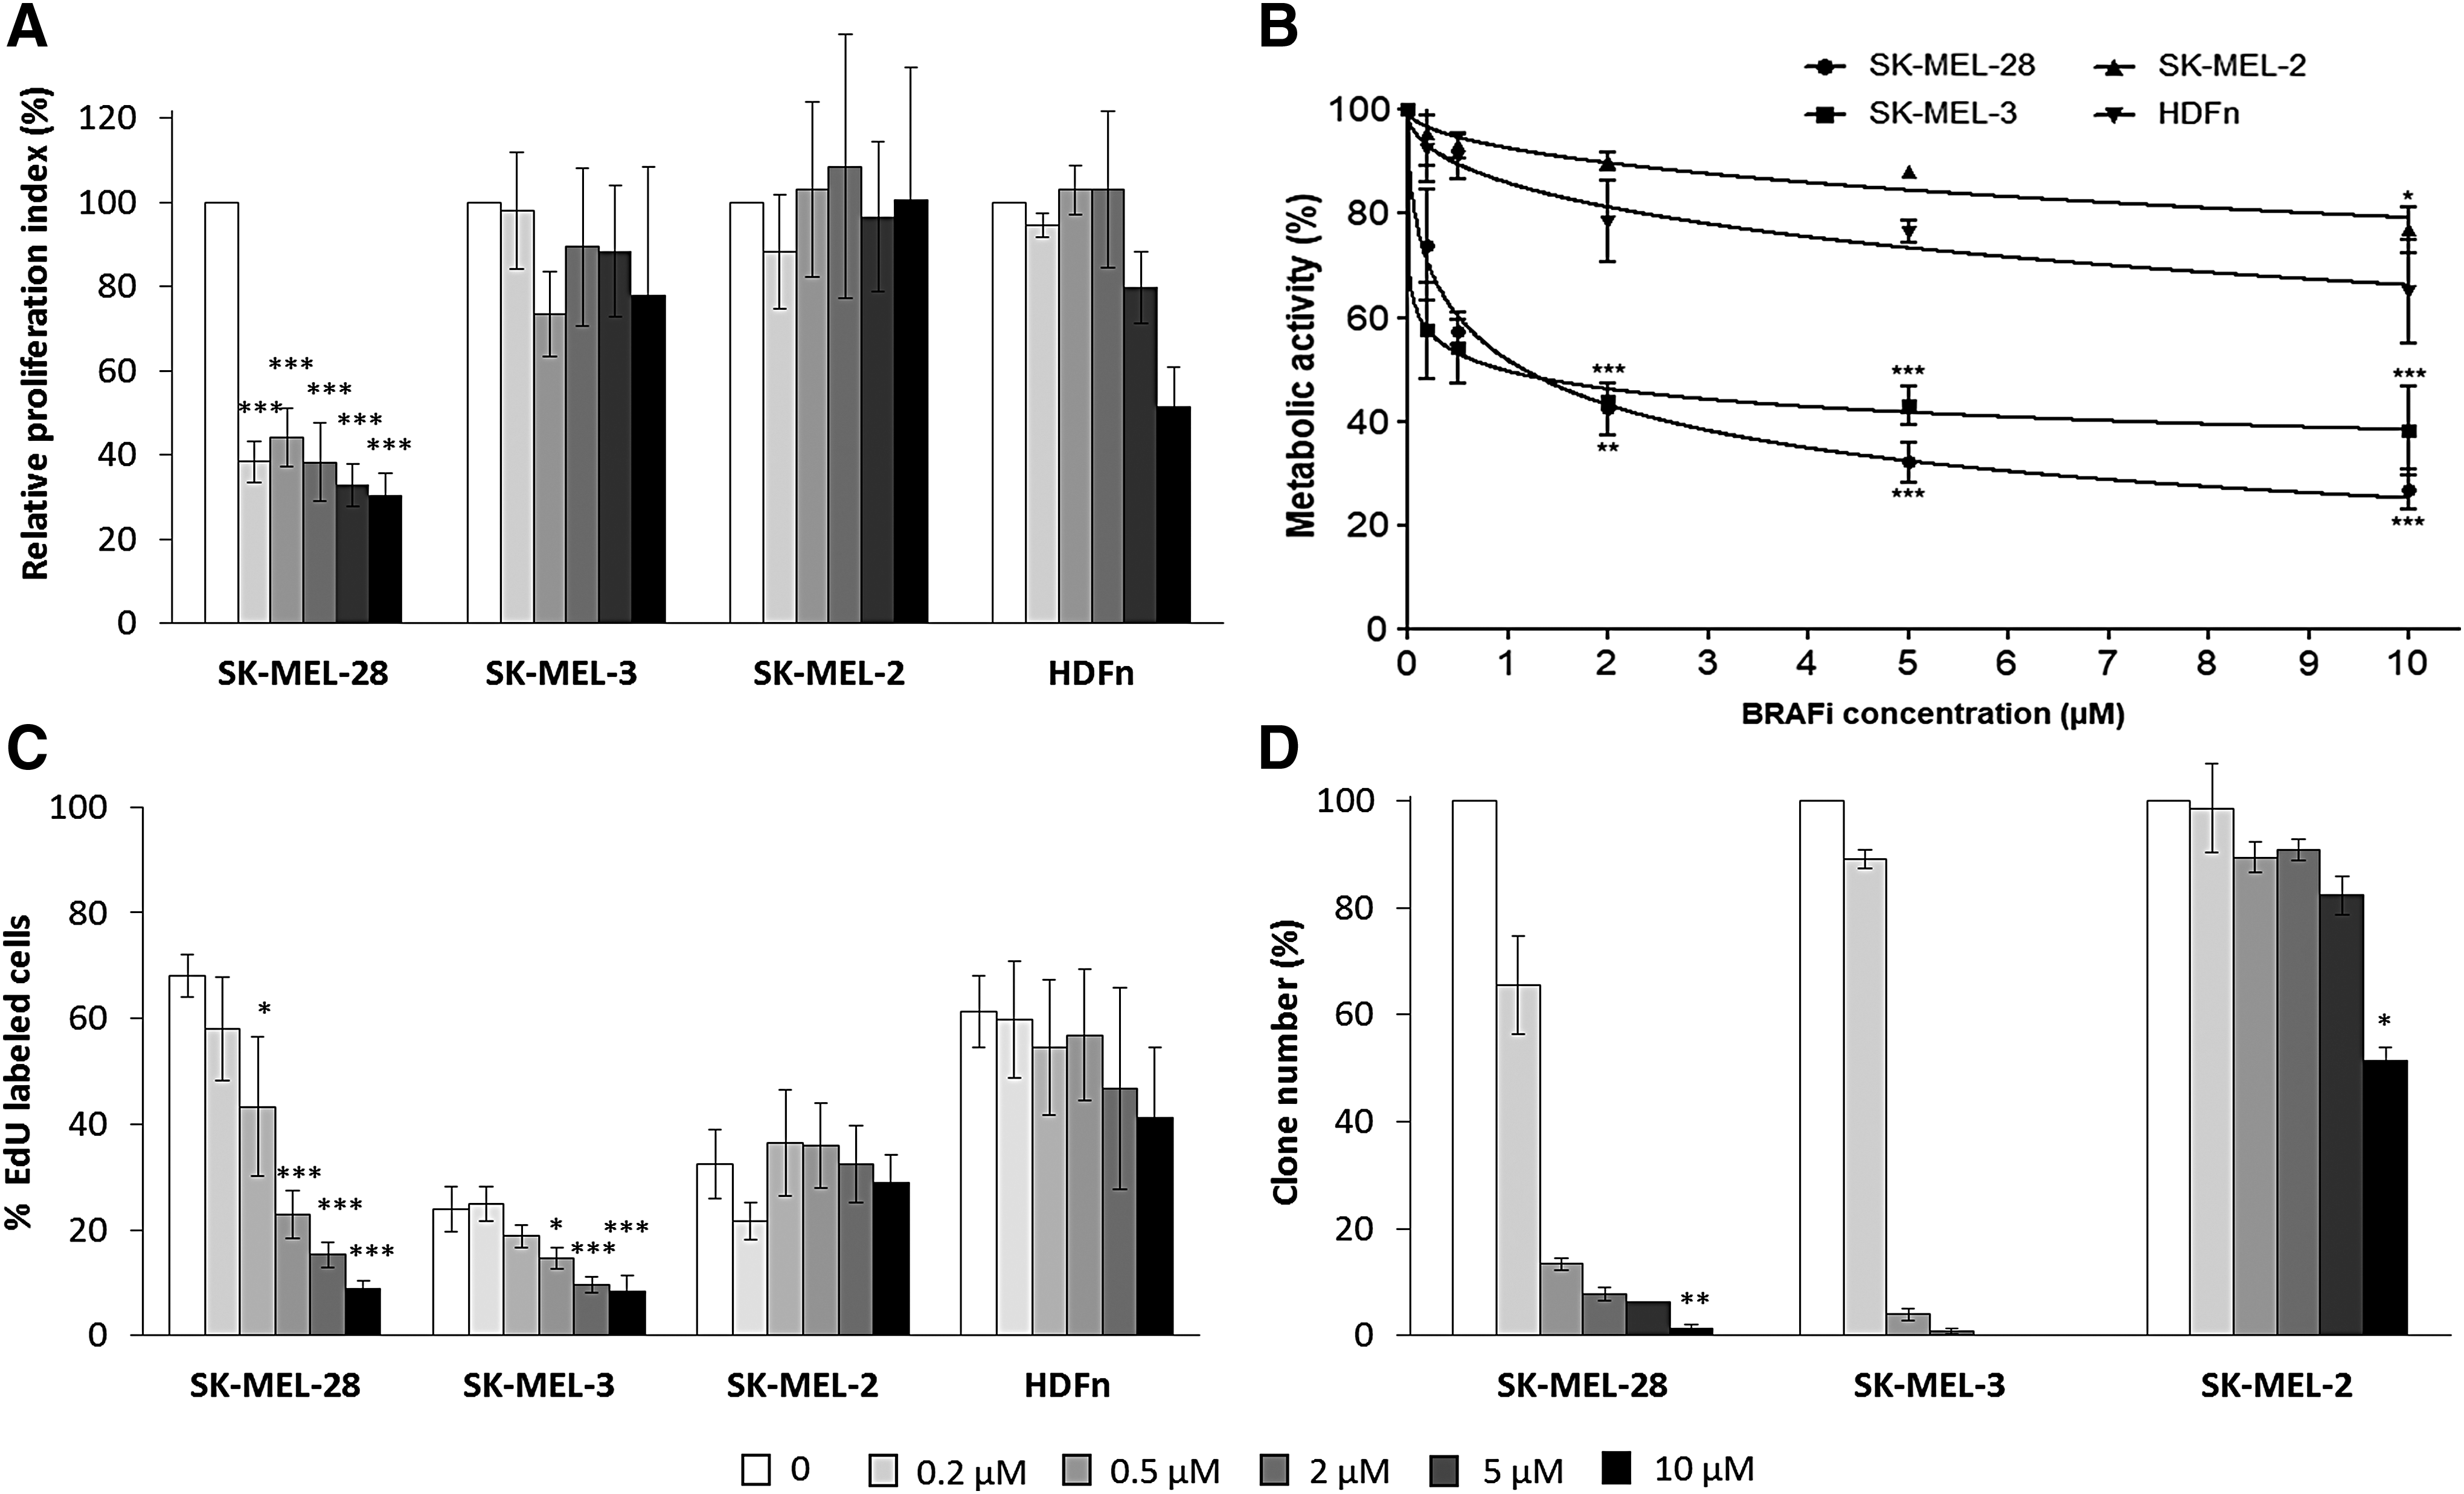
Characterization of BRAFi effect on MM cells and fibroblasts cultured as a monolayer. Melanoma cells (SK-MEL-28, SK-MEL-3, and SK-MEL-2) and HDFns were treated with different concentrations of vemurafenib for 48 h. Cell proliferation relative to untreated controls was assessed by cell counting
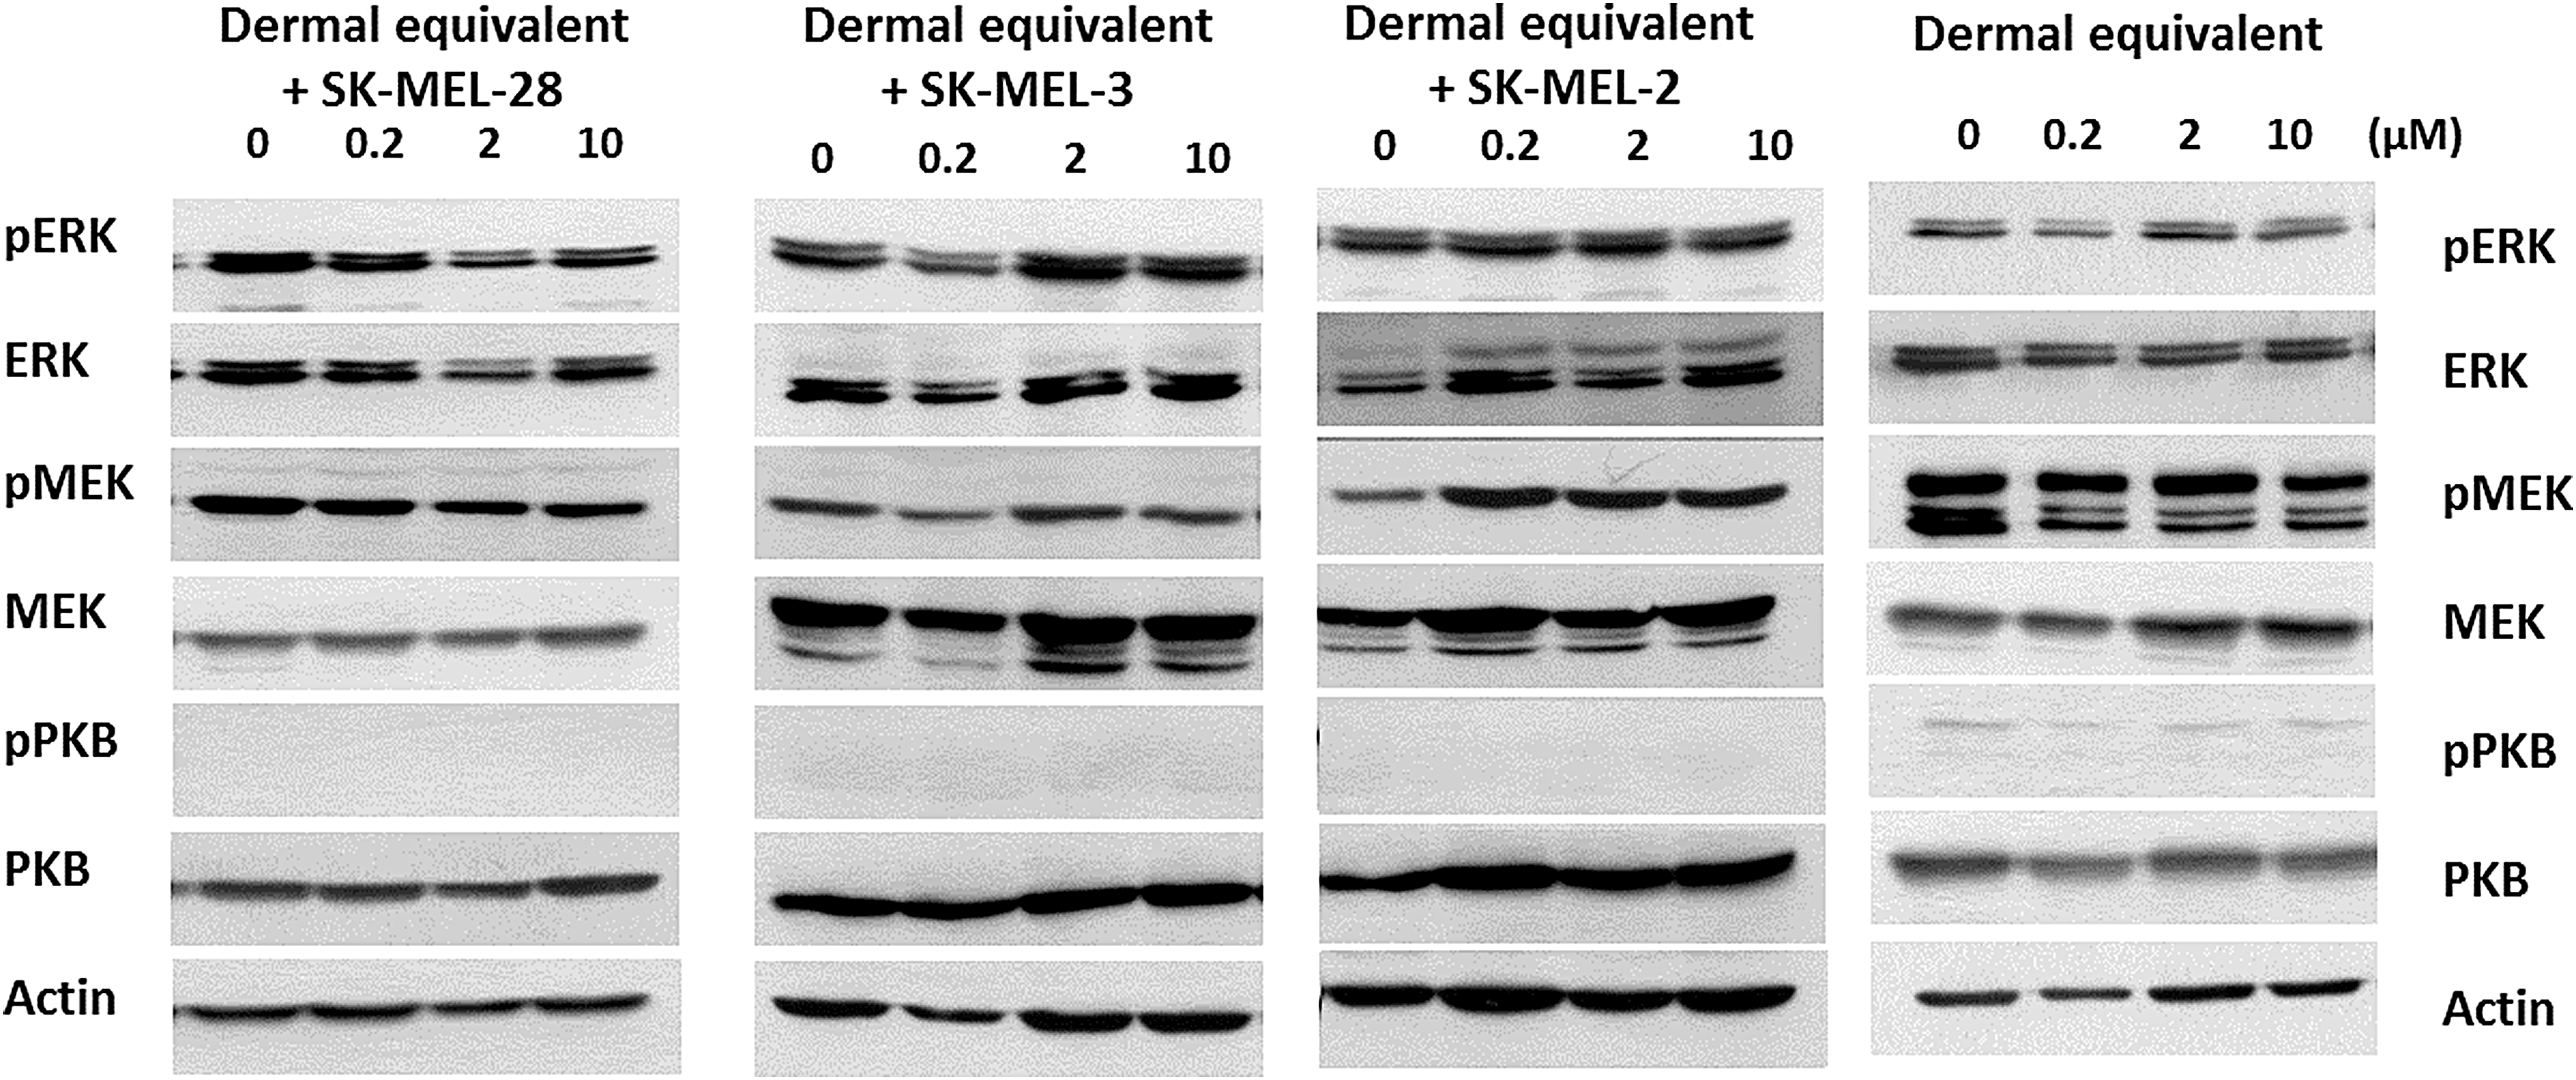
All the cell lines (MM and dermal fibroblasts) were analyzed for the MAPK and PKB pathways (Fig. 2). Consistent with proliferation data, phosphorylated MEK and ERK forms were inhibited by 50% starting at the 0.2 μM vemurafenib concentration and fully inhibited for concentrations higher than 0.5 μM in SK-MEL-28 and SK-MEL-3 cells. Phosphorylated PKB/Akt expression was also partially decreased in SK-MEL-28 cells, whereas the BRAFi treatment triggered a weak and transient increase of P-PKB in SK-MEL-3 cells. In BRAF wt cells, the BRAFi had no significant effect on signaling pathways.

Evaluation of MAP kinase and PKB pathway activation in 2D MM cells and fibroblasts treated with BRAFi. The cell lines (SK-MEL-28, SK-MEL-3, SK-MEL-2, and HDFn) were cultured in 2D, treated with vemurafenib for 48 h, and protein extracts were analyzed by Western blotting. Actin was used as a loading control.
BRAFi modulates soluble factor secretion by MM cells and fibroblasts
To better characterize BRAFi effect on 2D cells, the capacity of treated cells to secrete cytokines and growth factors was investigated. Among MM lines, only SK-MEL-28 cells transiently secreted low levels of IL-6 upon vemurafenib treatment (Fig. 3A), but fibroblasts maintained a basal IL-6 secretion which was increased during the treatment. Untreated SK-MEL-28 cells secreted high levels of IL-8 (400 pg/104 cells), but during the BRAFi treatment, IL-8 release decreased dramatically (Fig. 3B). The same IL-8 production inhibition was observed in treated SK-MEL-3 cells but to a lesser extent. SK-MEL-2 and HDFn cells weakly increased IL-8 release during the treatment. HGF and TGF-β were synthetized by all cell lines, but their secretions were increased in SK-MEL-28 cells upon BRAFi treatment (Fig. 3C, D). TNF-α and IL-1α were not secreted by cells (data not shown).

Soluble factor secretion measurement in 2D MM cells and fibroblasts treated with BRAFi. IL-6
Dermal equivalent for mimicking the microenvironment of cutaneous MM
The dermal equivalents were obtained by culturing HDFn in a collagen gel for 7 days. MM cells were added and cultured on the reconstructed tissue for 3 days (48 h treatment with BRAFi) (Figs. 4 and 5A). Cell organization was first characterized histologically. Fibroblasts embedded in the collagen gel were found inside the dermal equivalent for all models, flattened and aligned with collagen fibers (Supplementary Fig. S1; Supplementary Data are available online at www.liebertpub.com/tea). MM cells, expressing the melanoma marker MELAN-A, were found on the top of the reconstructed tissue (Supplementary Fig. S2). By increasing incubation time of MM cells on the dermis (11 days) and without BRAFi treatment, some melanoma cells started to invade the tissue (Supplementary Fig. S3). When treated with a high BRAFi concentration (10 μM), a large decrease in the number of melanoma cells was observed relative to the untreated condition for all 3D coculture models, including SK-MEL-2 cells (Fig. 4). This decrease in MM cell number was also observed starting at the low concentration of 0.2 μM of vemurafenib (data not shown).

Histological images of 3D coculture models upon BRAFi treatment. Dermal equivalents were obtained by seeding HDFn cells in a type I collagen gel. Fibroblasts were cultured in 3D for 7 days. Then, melanoma cells (SK-MEL-28 or SK-MEL-3 or SK-MEL-2) were added for 24 h. The coculture models were treated with 10 μM of BRAFi for 48 h and stained with Hematoxylin-eosin-saffron. The melanoma layer on dermal equivalent and the polycarbonate membrane are indicated. Scale bar = 100 μm ( × 200). 3D, three dimensional. Color images are available online.

Effect of BRAFi on MM cell and fibroblast proliferation in 3D dermal equivalent. Coculture models were obtained by seeding HDFn cells in a type I collagen gel. Fibroblasts were cultured in 3D for 7 days. Then, MM cells (SK-MEL-28 or SK-MEL-3 or SK-MEL-2) were added for 24 h, and the 3D cocultures
BRAFi effect on MM cell proliferation in 3D dermal equivalent
The overall cell proliferation (fibroblasts + MM cells, Fig. 5A) was assessed in the 3D coculture models treated with vemurafenib (Fig. 5B, C); no significant modification was observed regardless of the cell line used, and the cell viability (fibroblasts + MM) remained high (>90%, data not shown), without apoptosis induction (data not shown). The dermal equivalent controls (without melanoma cells) did not exhibit significant EdU labeling (Fig. 5D), whereas MM cells seeded on the top of the reconstructed tissue were clearly identified and labeled (data not shown). This method allows the discrimination between proliferating cells (MM) and nonproliferating fibroblasts. The EdU incorporation and labeling in proliferating cells revealed the significant effect of BRAFi on MM cells (Fig. 5D): proliferation of the three cell lines (SK-MEL-28, SK-MEL-3, and SK-MEL-2) cultured on dermal equivalents decreased significantly after treatment. Again, the significant BRAFi effect was detected starting at low concentration (0.2 μM) for sensitive cells; for the 3D SK-MEL-2 coculture model, the inhibitory effect of vemurafenib on MM cell proliferation became significant for 10 μM.
To clarify the impact of the dermal equivalent, we investigated the SK-MEL-2 proliferation in HDFn-conditioned media (from 2D or 3D culture). Briefly, fibroblasts cultured as a monolayer or within a 3D collagen gel were treated with BRAFi for 48 h, and the CM were added on SK-MEL-2 cells cultured in 2D configuration. Our data indicate no differential response when SK-MEL-2 cells were cultured with control medium or CM provided by 2D fibroblasts (Fig. 6A, B); DNA synthesis and metabolic activity were similar and BRAFi IC50 remained high (>100 μM). However, when cultured with CM from the dermal equivalent, proliferation and metabolic activity of MM cells significantly decreased, without BRAFi (−55% and −30%, respectively) or with 10 μM vemurafenib (−75% and −50%, respectively) compared to control medium (Fig. 6C, D). The new vemurafenib IC50 on SK-MEL-2 cells cultured with 3D CM was estimated at about 10 μM.
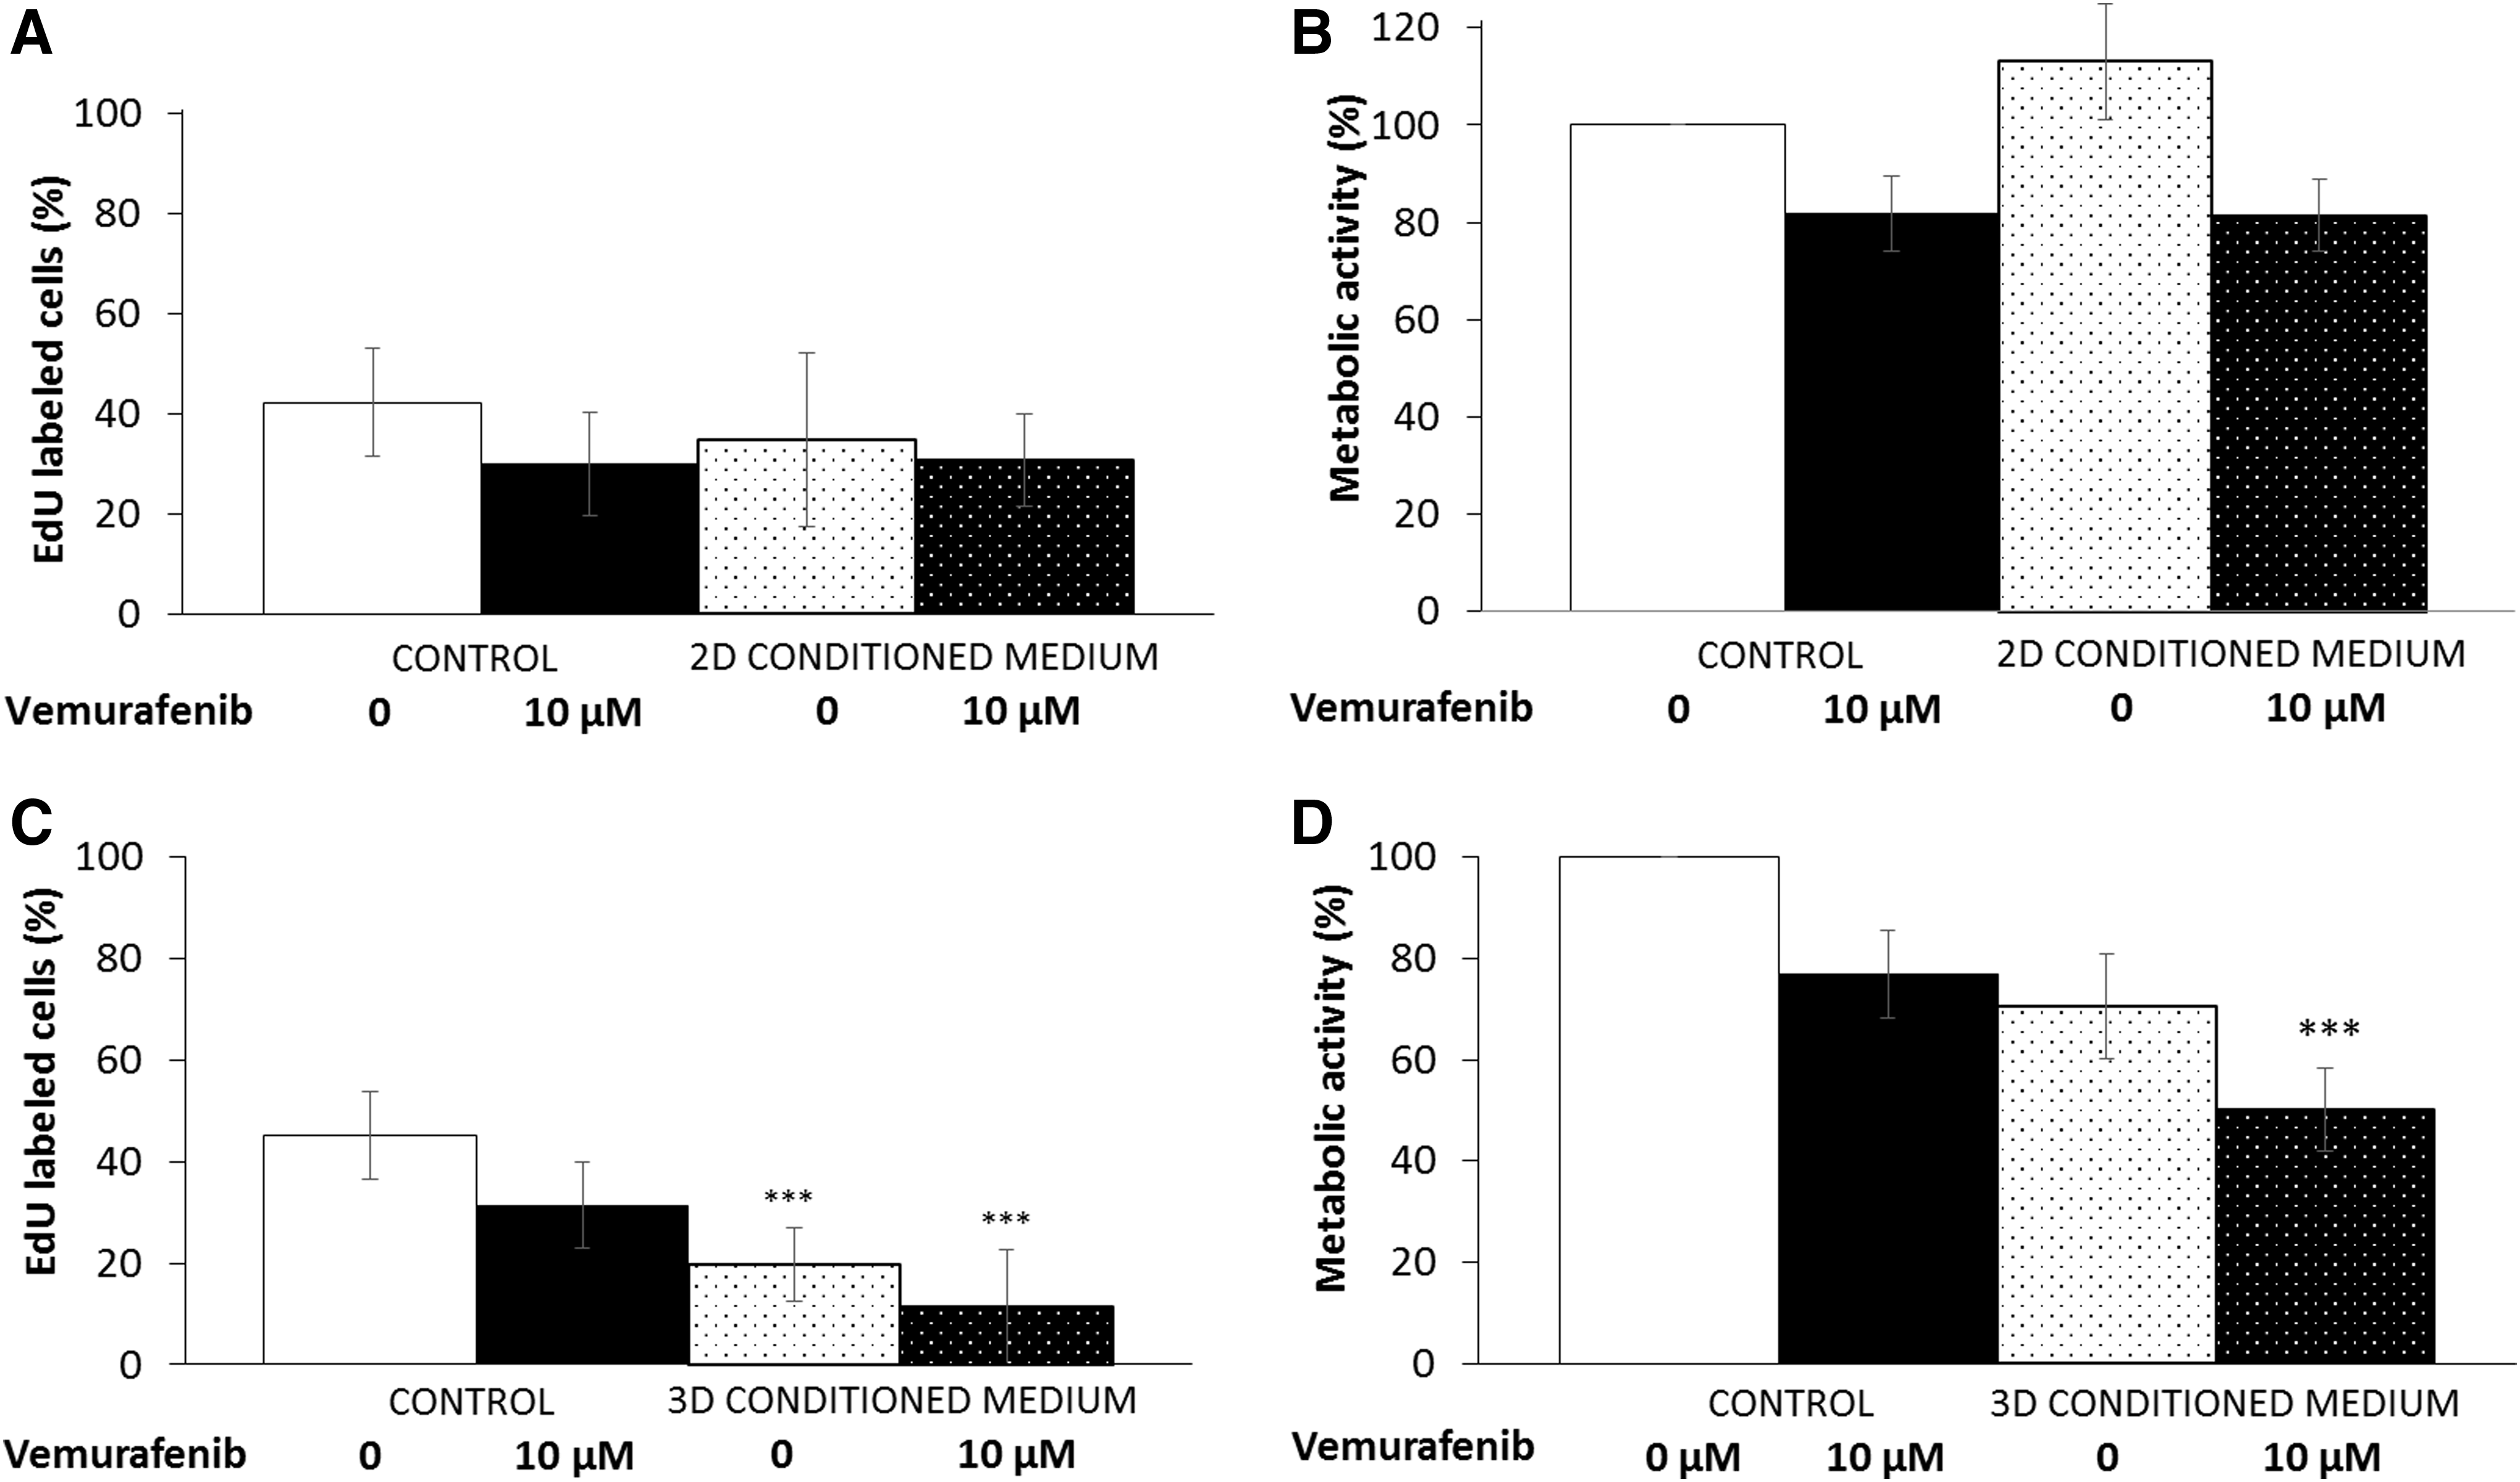
Effect of HDFn-conditioned media on 2D SK-MEL-2 sensitivity to BRAFi. Conditioned media provided from monolayer fibroblasts
No significant variation regarding the overall expression of phosphorylated proteins was detected when MM cells were cultured with the dermal equivalent and treated with vemurafenib (Fig. 7), likely reflecting the major cell population behavior, that is, the fibroblasts.
Evaluation of MAP kinase and PKB pathway activation in 3D cocultures treated with BRAFi. 3D dermal equivalents with MM cells were treated with vemurafenib for 48 h, and protein extracts were analyzed by Western blotting. Actin was used as a loading control.
3D dermal equivalent provides a microenvironment with soluble factors
The cytokine and HGF release in cell culture media was quantified in the 3D dermal equivalents (Fig. 8). 3D HDFn cells treated with BRAFi maintained a constant level of IL-6 (about 20 pg/105 cells), IL-8, and TGF-β (100 pg/105 cells) secretion, but increased the release of HGF (50 pg/105 cells). When the MM cells were cultured onto the reconstructed dermis, the overall IL-6 and TGF-β cytokines in the cell culture media remained detectable and constant with vemurafenib treatment. However, release of both IL-8 and HGF was less substantial in the 3D coculture models (fibroblasts + MM cells) compared to the dermal equivalent.

Soluble factor secretion in 3D coculture models treated with BRAFi. IL-6
Discussion
BRAF inhibitors such as vemurafenib are now widely used for the treatment of MM harboring a BRAF mutation. Treatment failures are linked to tumor resistance and side effects. We aimed to establish an in vitro model that is easy to use and capable of predicting MM cell sensitivity to targeted therapy. We cultured three well-known melanoma cell lines both as a classical monolayer model (2D) and on a dermal equivalent (3D coculture) which mimics the natural environment of cutaneous MM.
BRAFi efficiency on BRAFV600E MM cells cultured as a monolayer
Forty-eight hours of BRAF inhibitor treatment efficiently inhibited BRAF V600E melanoma cell proliferation and MAPK pathway activation as expected. 5 More precisely, the vemurafenib action was assessed by a significant decrease in cell metabolic activity (IC50 about 1 μM), DNA synthesis, and colony formation for both SK-MEL-28 and SK-MEL-3 cells. The SK-MEL-28 cell count was also found to decrease during the treatment, unlike the SK-MEL-3 cell count. Indeed, Tap et al. classified SK-MEL-3 as the most resistant cell line to vemurafenib (IC50 = 25.3 μM) among of 35 cell lines justifying the reason that this cell line was chosen as a BRAFi resistant line. Data 5 were obtained with a 7-day growth inhibition assay (cells cultured as a monolayer), and the effect of vemurafenib was evaluated by a cell counting method: using the same method, we similarly did not observe a significant SK-MEL-3 cell count variation during vemurafenib treatment (Fig. 1A, IC50 > 10 μM). To dismiss that this difference in SK-MEL-3 response could be due to the treatment duration, a 15-day clonogenicity assay was done and, in these experimental conditions, the SK-MEL-3 cell line was found to be sensitive to BRAFi treatment (IC50 < 0.5 μM). The very slow rate of proliferation of these MM cells over 48 h likely explains the lack of variation in cell count during the treatment (SK-MEL-3 doubling population = 96 h). As described previously, SK-MEL-3 cells were found to be sensitive to BRAFi in regards to DNA synthesis and metabolic activity but not cell count. These results underline the necessity to evaluate the sensitivity of cells to BRAFi using complementary methods. The MAPK signaling pathway analysis showed a total inhibition of phosphorylated MEK and ERK forms by BRAFi in SK-MEL-3 cells similar to the sensitive cell line SK-MEL-28. In fact, by comparing the gene expression profile before and after vemurafenib (BRAFi) exposure on 35 cell lines, Tap et al. 5 have identified different groups according to each cell line's molecular signature whether cells were sensitive or resistant. Most of the cell lines classified as sensitive had a similar molecular signature, and the authors observed that SK-MEL-3 had an expression profile similar to these sensitive cells. Furthermore, Schayowitz et al. 6 investigated SK-MEL-3 cell proliferation (MTT assay) and the level of expression of p-ERK in this cell line upon PLX-4720 treatment (a BRAFi structurally similar to vemurafenib): their results are consistent with those from our study (decrease in metabolic activity and P-ERK expression).
The SK-MEL-2 cells were used as BRAF wt control,5,7 and we found no inhibitory effect of BRAFi on the proliferation (IC50 = 134 μM) and the MAPK pathway when SK-MEL-2 cells were cultured as a monolayer, as expected. 6 As we used HDFns for establishing the dermal equivalent, we also evaluated the behavior of the 2D HDFn cells treated with vemurafenib: the BRAFi treatment altered fibroblast proliferation only for high concentrations (10 μM), and the MAPK pathway profile (p-ERK) was not significantly modified during the treatment. DNA fragmentation (TUNEL staining) was analyzed in all treated cells but we did not detect a positive signal, confirming that vemurafenib action is mainly cytostatic.8–10
Based on the multiple assays we have used to characterize the MM cell response to vemurafenib, we classified SK-MEL-28 and SK-MEL-3 as sensitive and SK-MEL-2 and HDFn as resistant to BRAFi when cultured as monolayers.
To better characterize the behavior of BRAFi-treated cells, we studied the release of soluble factors. In 2D culture, despite data found in the literature, we did not detect the secretion of pro-inflammatory factor IL-1α secretion by MM 11 or the release of TNF-α, a marker of dermal stress, by dermal fibroblasts. 12 Vemurafenib induced the secretion of a well-known pro-inflammatory mediator, IL-6, from HDFn cells as expected, 13 whereas melanoma cells secreted a lower level of IL-6. These data demonstrate the critical role of fibroblasts in the production of immunomodulatory cytokines. In contrast, untreated BRAF V600E MM cells secreted high levels of IL-8 as previously described, 13 but the secretion dramatically decreased upon vemurafenib as Hartman et al. 10 demonstrated in their study. The authors 10 observed that CXCL8 expression and IL-8 secretion were significantly downregulated by 10 μM vemurafenib treatment on primary melanoma cells. All these data are correlated with clinical analyses, where reduced levels of IL-8 were noticed in biopsies collected from patients with MM treated by vemurafenib. 14 The HGF and the cytokine TGF-β were mainly secreted by MM cells regardless of the treatment, and to a lower extent by HDFn. Upon BRAFi treatment, the fibroblast mediated release of HGF increased and BRAF mutated melanoma cells secreted TGF-β as previously described. 15 The paracrine stimulation mainly by TGF-β induces recruitment of fibroblasts to the tumor microenvironment and their activation. 16 All these data suggest that the secreted cytokines and growth factors could modulate the cell behavior in a coculture model. 4
The 3D coculture recapitulates the natural microenvironment of the cutaneous MMs
Human fibroblasts embedded in a type I collagen gel were found evenly distributed along the horizontal collagen fibers, very flattened and not proliferating (low DNA synthesis, Ki-67 negative cells [data not shown]). The thickness of this tissue engineered dermal equivalent was about 300 μm with a Young's modulus of about 50 kPa using a nanoindenter (data not shown). These values are similar to those obtained on an adult dermis17,18 and substantiate our 3D dermal equivalent model. MM cells cocultured on the dermis were successfully identified histologically and by using specific marker. Finally, when cultured for an extended time on the dermal equivalent, MM cells were able to invade more deeply the engineered tissue, supporting the robustness of the 3D coculture model for recapitulating in vitro cutaneous MMs.
3D fibroblasts secreted a basal level of IL-6 and TGF-β when treated with BRAFi, but also stimulated IL-8 and HGF release upon treatment, molecules known to influence melanoma cell sensitivity to targeted therapy. The microenvironment is capable of modulating melanoma cell growth 4 ; therefore, the dermis equivalent was then used to mimic the natural microenvironment of cutaneous MM. In the 3D model with MM cells, the overall IL-6 detection likely corresponds to the IL-6 release by fibroblasts (MM cells synthetized very low levels of IL-6 in our 2D conditions). These results prove that our model is interesting for studying the impact of fibroblasts' critical role in the production of immunomodulatory cytokines in MM cells. IL-8, HGF, and TGF-β released by cells (MM + fibroblasts) were less detected in the coculture model in comparison with the secretion by fibroblasts in the dermal equivalent. Two explanations may exist for these results: (i) the collagen scaffold may have captured some soluble factor release as a niche preventing detection in the media 19 ; and (ii) we know soluble factors are capable of interaction with fibroblasts in the dermal equivalent since, for example, TGF-β could induce activation of these cells. 15 The overall IL-8 detection was downregulated after BRAFi treatment on 3D models with sensitive MM cells (data consistent with clinical results). 14 HGF secretion slightly increased upon BRAFi treatment in the 3D coculture model. This release was presumably due to the presence of fibroblasts even though an autocrine secretion was observed in SK-MEL-28 (2D configuration).
The proliferative capacity of MM cells on the dermal equivalent was evaluated using the same methods previously used for 2D culture (cell counting, cell metabolic activity, and DNA synthesis). No significant modification was observed regarding the total cell number (MM cells + fibroblasts) and their metabolic activity when the 3D cocultures were treated with vemurafenib. However the percentage of proliferating melanoma cells (EdU labeled cells) was found to decrease significantly from low BRAFi concentration, including SK-MEL-2 cells. This result was confirmed with histological analysis: the melanoma cell number clearly decreased upon vemurafenib treatment (low and high concentrations). The sudden sensitivity of SK-MEL-2 cells to BRAFi only when cultured on the dermal equivalent led us to investigate the role of HDFn secretome in MM behavior. 2D and 3D fibroblast-conditioned media were used on SK-MEL-2 cells cultured as a monolayer, a configuration in which these BRAF wt cells are resistant to vemurafenib (IC50 > 100 μM). The secretome from dermal equivalents was clearly found to deeply influence the MM behavior: SK-MEL-2 cells significantly reduced their proliferation ability even without BRAFi. When the conditioned media were supplemented with vemurafenib, the SK-MEL-2 cells were clearly more sensitive to BRAFi (new IC50 = 10 μM). No effect of 2D fibroblast-conditioned media was observed, suggesting the high importance of 3D organization of fibroblasts and interactions with extracellular matrix (ECM) components on the secretome. We found that the integration of fibroblasts into 3D cultures revealed the sensitivity of MM cells to BRAFi. Our data are in accordance with previous work 20 in which authors observed that targeted drug efficacy (inhibitors of EGFR signaling) was strongly increased when fibroblasts were incorporated into 3D culture type I collagen matrix of lung cancer cells. A similar observation was reported by Boisvert-Adamo and Aplin 21 who described more susceptibility to BRAF inhibition when melanoma cells were cultured in a 3D collagen gel compared with 2D cell culture. Indeed, they observed a clear inability of 3D collagen to promote MM cell survival, whereas fibronectin favors cell death resistance. Interestingly, a MM subline with acquired resistance to BRAFi and coexpressing NRAS and BRAF mutations showed higher level of apoptosis when cultured on 3D collagen gel and treated with PLX7904 (a BRAFi). 22 Combining all these data, we think that heterotypic 3D cancer models incorporating stromal cells recapitulating paracrine signalization and ECM components are a key point for predicting drug efficiency.
The 3D MM model that we have established allows for the identification of potent sensitive MM cells to BRAFi. Despite the fact that some high drug concentrations used in this in vitro study are difficult to achieve in the clinical setting, we believe that the model we describe could be a powerful tool for predicting the sensitivity of melanoma cells derived from patients for targeted therapies.
Footnotes
Acknowledgments
The authors thank the Hauts-de-France Region and the European Regional Development Fund (ERDF) 2014/2020 for the funding of this work and Oise committee of “La Ligue contre le cancer” for the financial support of this project. The English text was edited by Dr. Kayla Belanger.
Disclosure Statement
No competing financial interests exist.
References
Supplementary Material
Please find the following supplemental material available below.
For Open Access articles published under a Creative Commons License, all supplemental material carries the same license as the article it is associated with.
For non-Open Access articles published, all supplemental material carries a non-exclusive license, and permission requests for re-use of supplemental material or any part of supplemental material shall be sent directly to the copyright owner as specified in the copyright notice associated with the article.