
Abstract
Fully differentiated HepaRG™ cells are the hepatic cell line of choice for in vitro study in toxicology and drug trials. They are derived from a hepatoblast-like progenitor (HepaRG-P) that differentiates into a coculture of hepatocyte-like and cholangiocyte-like cells. This process that requires 2 weeks of proliferation followed by 2 weeks of differentiation using dimethyl sulfoxide (DMSO) can be time consuming and costly. Identifying a method to accelerate HepaRG-Ps toward a mature lineage would save both time and money. The ability to do this in the absence of DMSO would remove the possibility of confounding toxicology results caused by DMSO induction of CYP pathways. It has been shown that tissue culture substrates play an important role in the development and maturity of a cell line, and this is particularly important for progenitor cells, which retain some form of plasticity.
Oxygen plasma treatment is used extensively to modify cell culture substrates. There is also evidence that patterned rather than planar surfaces have a positive effect on proliferation and differentiation. In this study, we compared the effect of standard tissue culture plastic (TCP), oxygen plasma coated (OPC), and nanopatterned substrates (NPS) on early differentiation and function of HepaRG-P cells.
Since NPS were OPC we initially compared the effect of TCP and OPC to enable comparison between all three culture surfaces using OPC as control to asses if patterning further enhanced early differentiation and functionality. The results show that HepaRG-P's grown on OPC substrate exhibited earlier differentiation, proliferation, and function compared with TCP. Culturing HepaRG-P's on OPC with the addition of NPS did not confer any additional advantage. In conclusion, OPC surface appeared to enhance hepatic differentiation and functionality and could replace traditional methods of differentiating HepaRG-P cells into fully differentiated and functional HepaRGs earlier than standard methods.
Impact statement
We show significantly earlier differentiation and function of HepaRG progenitor cells when grown in dimethyl sulfoxide-free medium on oxygen plasma substrates versus standard tissue culture plastic. Further investigation showed that nanopatterning of oxygen plasma substrates did not confer any additional advantage over smooth oxygen plasma, although one pattern (DSQ120) showed comparable early differentiation and function.
Introduction
Fully differentiated HepaRG™ cells have been recognized as a “surrogate” of primary human hepatocytes for use in pharmacological applications.1,2 They are an attractive and more physiologically relevant model for evaluating toxicity of compounds as they express phase I and II metabolism, and have superior cytochrome P450 (CYP) activity compared with other hepatic cell lines.1,2 The HepaRG progenitor (HepaRG-P) line represents a bi-potent culture that retains plasticity, and can be differentiated into a coculture of cholangiocyte-like and hepatocyte-like cells for a 28 day process of proliferation and differentiation (Fig. 1). By pushing cells, already committed to a specific lineage, they are more likely to develop and maintain a differentiated phenotype.3,4 During weeks 1 and 2, cells proliferate in dimethyl sulfoxide (DMSO) free media followed by DMSO+ media for a further 2 weeks to promote and maintain differentiation. However, although the effect of DMSO produces a stable differentiated coculture, it can induce CYP pathways that could mask specific drug-induced CYP activity or cause unintended induction or inhibition effects in toxicity assays. 5 Therefore, finding a method whereby cells can differentiate and maintain their mature phenotype without DMSO would be beneficial for toxicity studies.
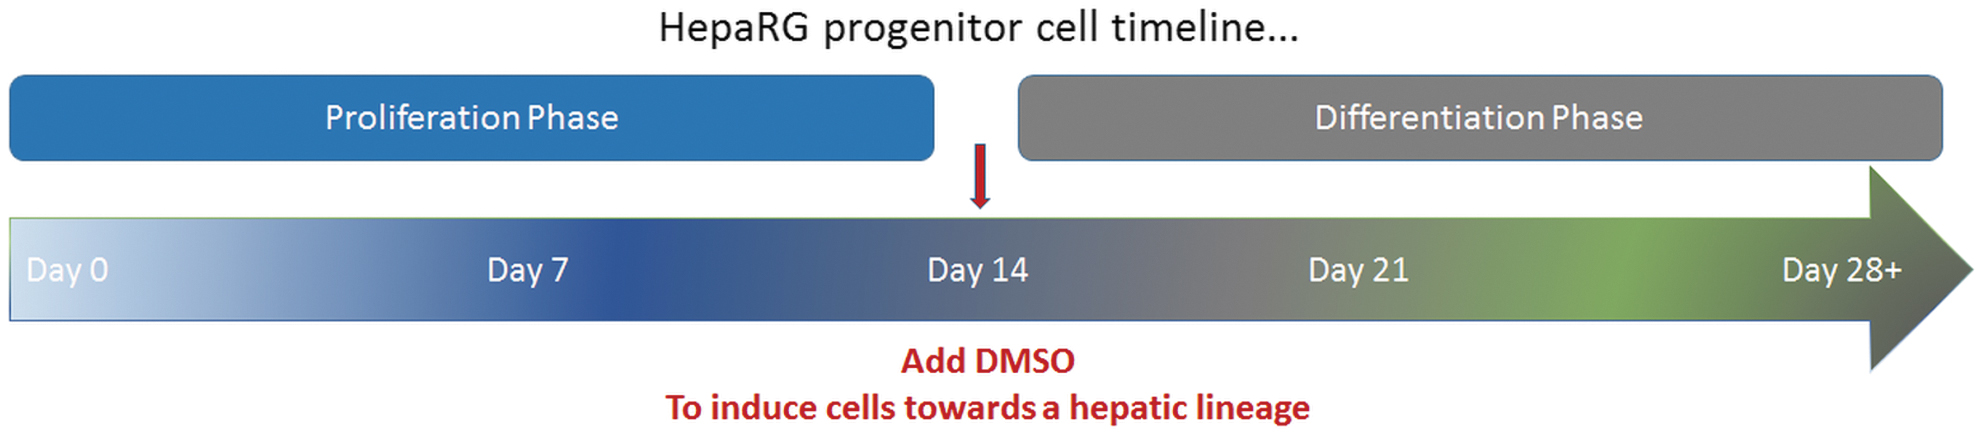
Timeline for proliferation and differentiation of HepaRG™-P on TCP. Showing distinct phases defined by day 14 change to medium supplemented with DMSO for induction and sustained commitment of hepatocytes. TCP, tissue culture plastic; DMSO, dimethyl sulfoxide. Color images are available online.
Cell culture substrates
Within this project it was our intention to specifically assess whether topology of a surface can be used to improve/promote growth and differentiation. Oxygen plasma has been used in the production of tissue culture plates since the 1970s. 6 Although we have found no studies where oxygen plasma coated (OPC) treatment has been reported to impact differentiation or function of hepatocytes, it has been shown that oxygen plasma treatment of surfaces increased cellular adhesion, spreading, and growth rate compared with untreated control.7,8 Therefore, the morphology of HepaRG-P's grown on OPC was compared with those grown on standard tissue culture plastic (TCP), with a view to use OPC as an internal control to assess the effect of nanopatterned substrates (NPS) on induction of differentiation.
NPS are increasingly being used in tissue engineering as they appear to promote differentiation of stem/progenitor cells.9,10 Finding an NPS that would advance the timing of differentiation of HepaRG-Ps without the need for DMSO would be potentially more cost-effective, and eliminate disadvantages associated with the use of DMSO in terms of metabolic activity.
The aims of this study were based on the following two hypotheses. First was that proliferation and differentiation of HepaRG-Ps would be comparable on both TCP and OPC substrates, such that OPC would be an internal control when assessing NPS. The second hypothesis was that HepaRG-P cells grown on NPS would proliferate faster, differentiate earlier, and outperform cells grown on either TCP or OPC.
Materials and Methods
Cell culture
HepaRG progenitors were cultured in medium consisting of William's E Medium + GlutaMAX™ (32551-020; Life Technologies, Paisley, United Kingdom) and Biopredic's proprietary growth medium supplement (ADD711077 Growth Medium Supplement; Biopredic Int'l, Rennes, France) without dimethylsulfoxide for the duration of experimentation. Before seeding the HepaRG-P, OPC and NPS plates were wetted with 100 μL of media at room temperature for 1 h. This ensured better adherence of cells to the surface substrate, and also confirmed that there was no leakage on the plate.
Surface treatment of tissue culture substrate
There are various surface treatments available to create an adhesive hydrophilic surface. The two main types of treatment are oxygen plasma and corona treatments. In this study, oxygen plasma treatment was chosen due to the controlled conditions and high reproducibility of this technique. For all experiments an oxygen plasma treatment of 40W for 30 s was used. To allow the investigation to focus on surface architectures that were not detrimental to cell attachment and/or differentiation HepaRG-P cells were cultured on treated surfaces for assessment of adhesion and morphology as compared with TCP by microscopy.
Nanopattern plates
NPS were produced at the University of Glasgow by electron beam lithography as detailed in Huethorst et al., 2020. 11 A patterned silicon chip was manufactured and a nickel shim was created based on this chip and used at high pressure to print the various nanopatterns onto a molten polymer. Once hardened this polymer was fixed within a plate framework and treated with oxygen plasma before use. In the first instance, single OPC wells were prepared by omitting nanopattern steps, applying only oxygen plasma treatment.
Subsequently, 21 different patterns consisting of both organized and disorganized arrays of pits were applied to OPC-treated surfaces. Spacing of pits on disorganized (DSQ) patterns had different degrees of disorder that allowed for a cursory assessment of nanotopographical sensitivity of the cells. 11 A gradient of 10–150 nm was used alongside ordered patterns and are indicated within the name of each well, that is, DSQ20, DSQ30, DSQ40, and so on (Fig. 2). With 21 permutations of pattern a set of criteria for evaluation of what is good versus what is a bad pattern was established. A good pattern was defined as showing adherent cells with clear edges, cells must reach confluency within 7–10 days and ideally show some commitment to a hepatocyte lineage by exhibiting binucleation and/or formation of bile ducts. Patterns where cells did not adhere, reach confluency, or retained jagged edges were disregarded. These criteria were assessed through daily microscopy from three independent researchers to decide upon a pattern or set of patterns for further investigation using the toolkit comprising microscopy, immunostaining, viability, total protein, and qRT-PCR of functional and phenotypical expression.
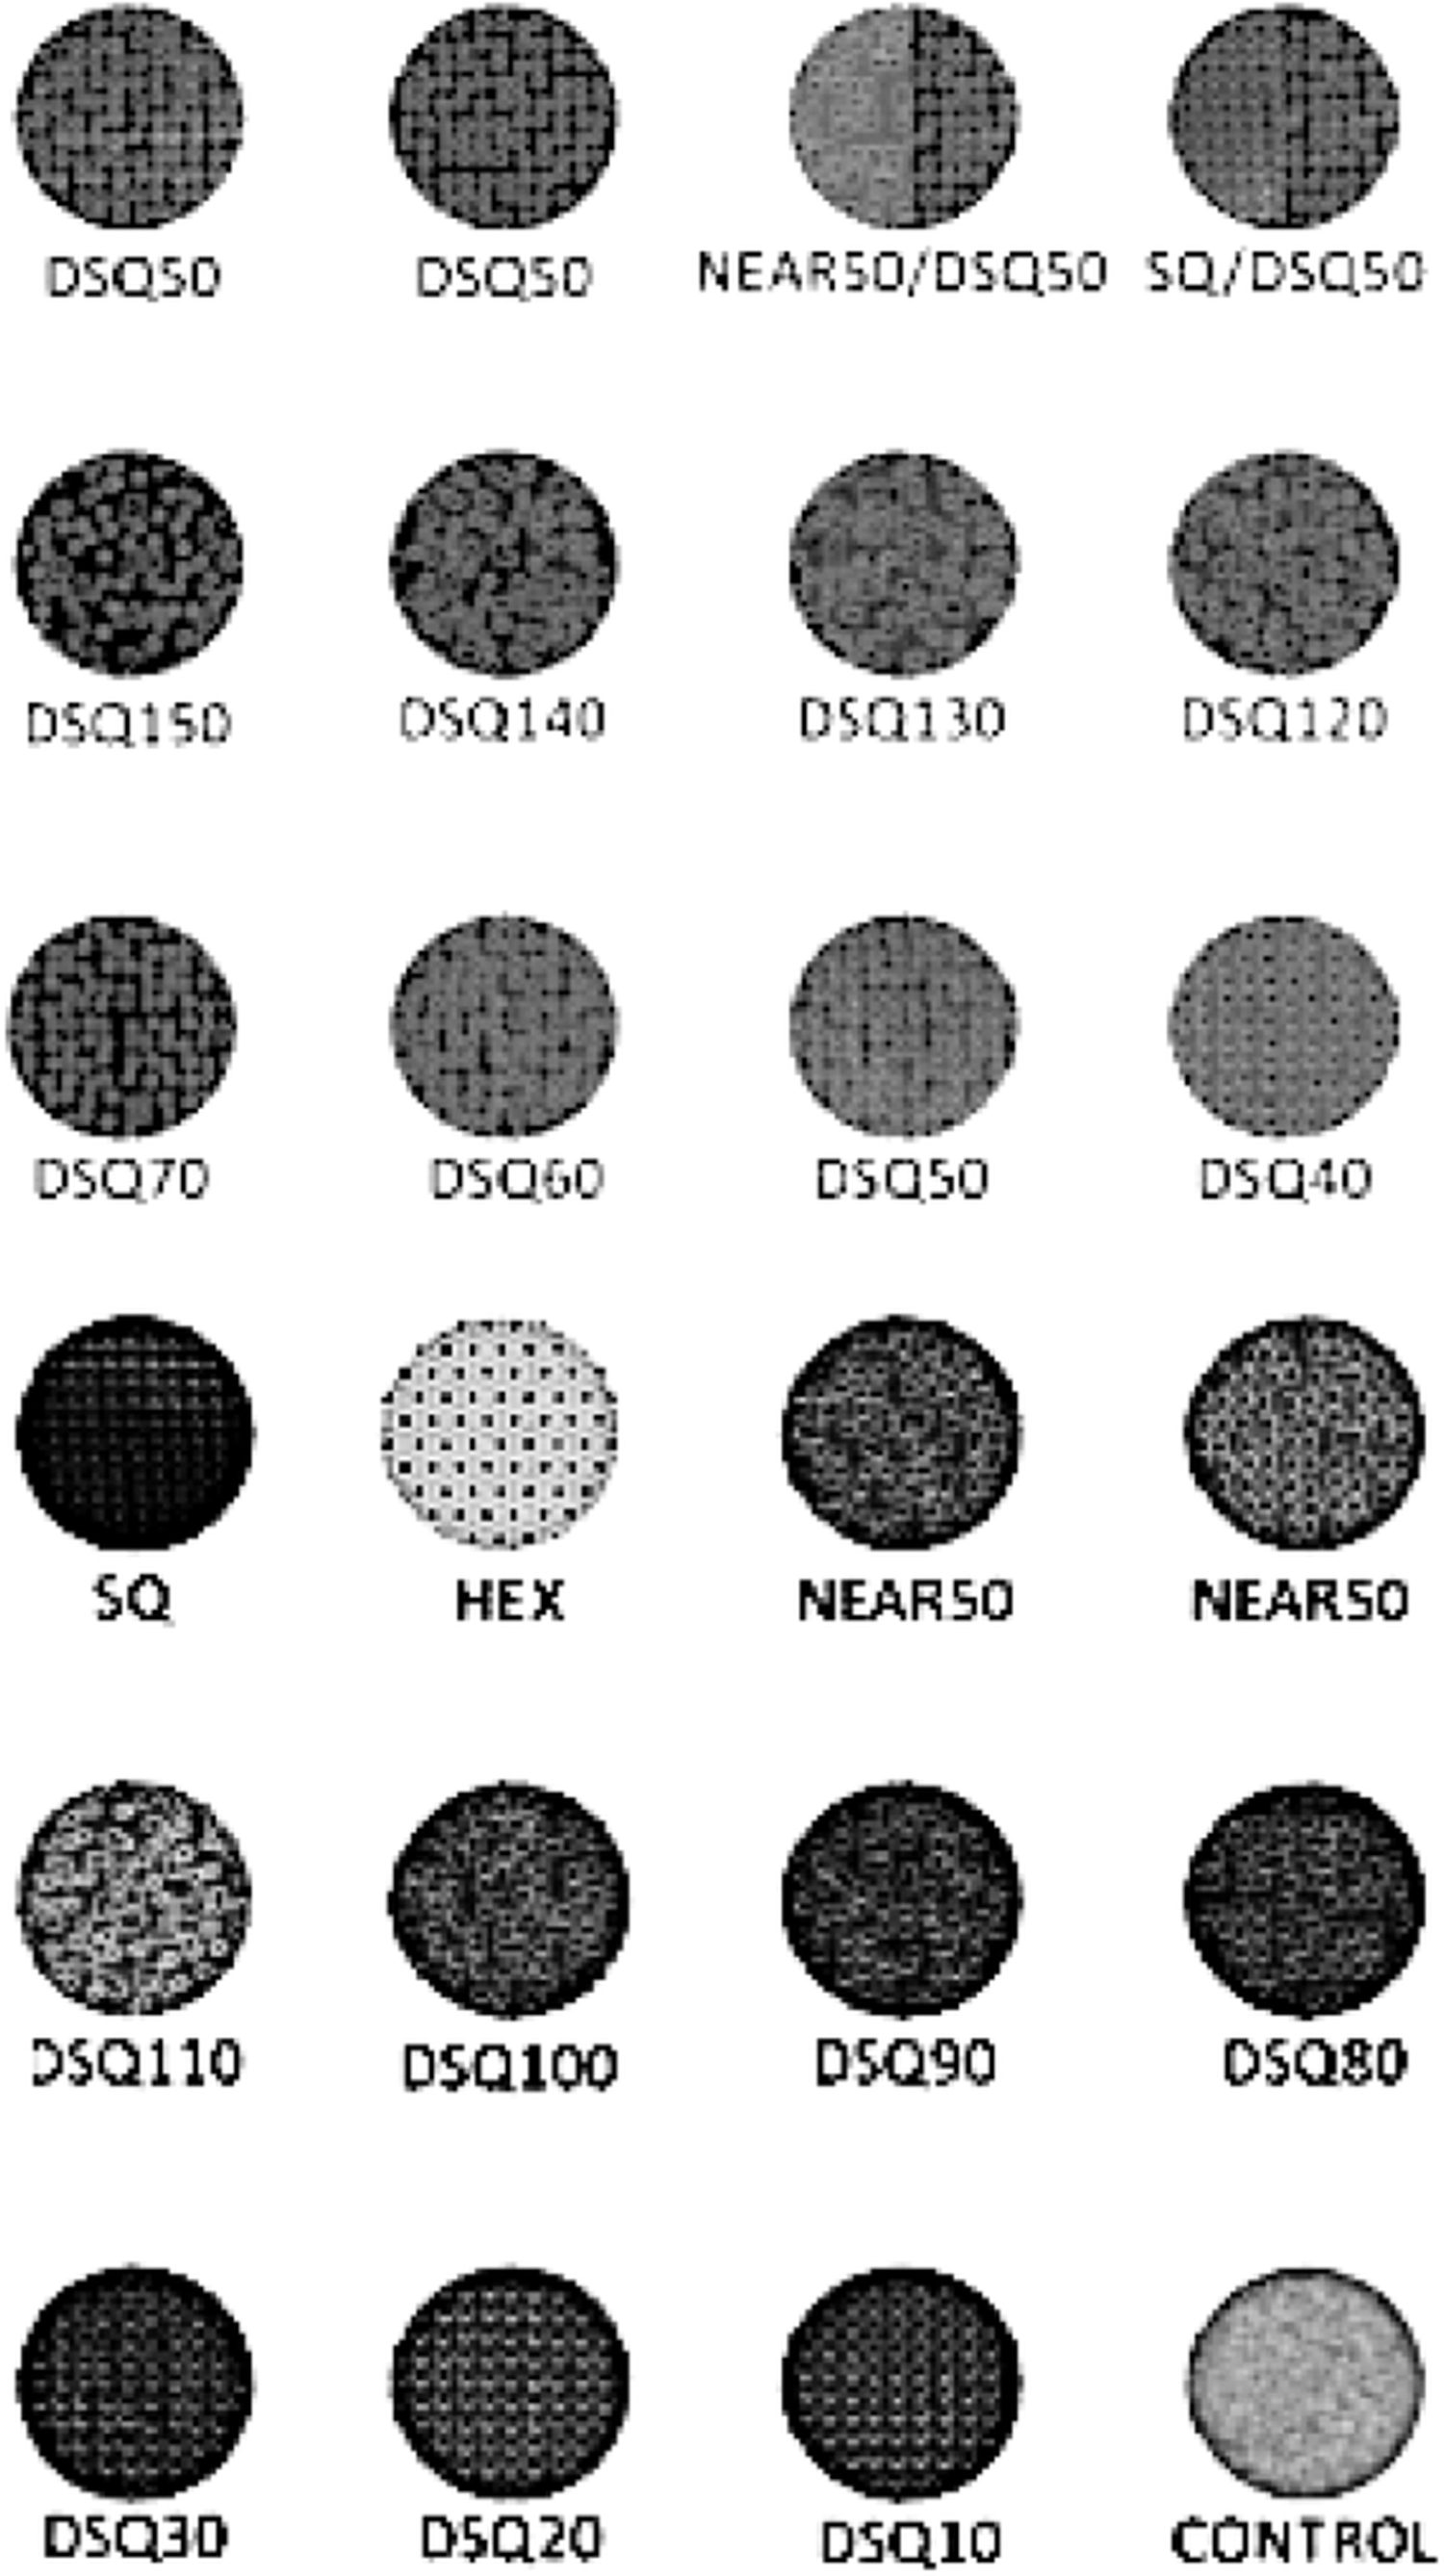
Illustration of nanopatterned slide. Slides were oxygen plasma coated before application of nanopatterns. Wells were based on a standard 96-well plate format and included an unpatterned control well, 21 different nanopatterns and duplicates of DSQ50 and Near50. The gradient from DSQ10 to DSQ150 allowed for assessment of nanotopographical sensitivity of the cells.
Microscopy
All phase and fluorescent imaging was performed with an EVOS Auto FL™ imaging platform (Thermo Scientific). Image magnification is specified on a figure by figure basis.
The EVOS Auto FL has the ability to set a “beacon,” a customized focal point, which can be saved as a routine so the microscope can return to the same spot to take consecutive pictures over time. The routine is saved and can be run automatically or manually. Two beacons were set per well, at random, to observe morphology and adhesion.
Immunocytochemistry
Cells were washed with Tris-Buffered Saline (TBS) (TBS; T6664; Sigma-Aldrich, Dorset, United Kingdom) for 2 min before fixation in 4% formaldehyde (28908; Thermo Scientific) at 4°C for 1 h. Cells were then washed with TBS and permeabilized with 0.1% Triton × 100 (85111; ThermoFisher) for 30 min. After a further TBS wash, samples were blocked with 5% goat serum (G6767; Sigma-Aldrich) for 1 hour. Primary antibody was then added and incubated at 4°C overnight (primary antibodies listed in Table 1) after which, cells were washed in TBS on a shaker for ∼20 min and then washed again before adding secondary antibody, Hoescht and phalloidin. Secondary antibody incubation was at 4°C for 4–24 h, depending on antibody, and three further wash steps were performed after incubation and before microscopy.
Primary and Secondary Antibodies Used in Immunocytochemistry
Secondary staining
Secondary detecting antibody goat-anti-rabbit Alexa Fluor 488 (11034; Life Technologies, 1:1000 dilution) was combined with Hoescht 33342 (HS1492; Life Technologies, 10 μg/mL) for immunostaining of Z-O1, Sox9 and HNF4α.
Viability and metabolic proficiency assays
PrestoBlue™ 10% (v/v) (A-13262; Life Technologies) was added to phosphate buffered solution with calcium chloride and magnesium chloride (PBS +)(D8662; Sigma Aldrich, 500 mL) in a 1:10 solution. Cells were washed with PBS+ before addition of 100 μL PrestoBlue suspension. After incubation for 30 min at room temperature, the fluorescent signal was read on a GloMax-Multi™+ Microplate Multimode Reader (Promega, Southampton, United Kingdom) using a white walled and bottomed 96-well plate.
Post-PrestoBlue measurement, the supernatant was discarded, and cells rinsed with PBS+ before addition of Promega Cell Titer Glo™ ATP lysis buffer to determine total cellular ATP levels using the CellTiter-Glo Luminescent Cell Viability Assay (G7570; Promega), as per vendor's instructions. In brief, incubation with substrate at room temperature for 20 min was followed by adding ATP detection solution and bioluminescent signals were detected on a GloMax-Multi+ Microplate Multimode Reader (Promega) using white walled and bottomed plates. PrestoBlue and ATP assays were always carried out on the same culture so data would be directly comparable.
Pierce BCA total protein analysis
Pierce™ BCA protein assay kit (ThermoFisher.com catalogue number 23225, 500 mL) was used to measure total protein of HepaRG-P day 7 cells grown on TCP, OPC, and DSQ120 cell culture substrates. Albumin standards, using bovine serum albumin, were made according to manufacturer's specifications. Cells were washed once with PBS+ before addition of lysis buffer (100 μL per well) and put onto a cell shaker for 30 min.
A 25 μL aliquot from each well was then transferred to a clear 96-well plate and 200 μL of working reagent was added for incubation at 37°C for 30 min. This reaction measures proteins by colorimetric detection of copper using bicinchoninic acid (BCA). Known as the “biuret reaction,” amino acids form a blue complex when they react with cupric ions. BCA is then added to develop the color further so it can be read at 562 nm. Absorbance was measured on Promega GloMax multiwell plate reader.
Molecular analysis
RNA extraction
In brief, RNA extraction was undertaken using Life Technologies RNAqueous™ kit and RNA purity/quantity was measured using Thermo Fisher NanoDrop and Agilent chip technology. Every sample was assessed on NanoDrop and a selection of samples at random were assessed on the Agilent chip.
cDNA synthesis and qRT-PCR analysis
cDNA was prepared using PrimerDesign nanoScript to RT kit and qRT-PCR was performed using PrimerDesign-validated primers and master mix on a Roche light cycler 96 system. For data normalization 12 candidate genes were analysed to identify stably expressed reference genes (RGs). Results were assessed using Biogazelle geNorm software, which uses raw Ct values taken from the Light Cycler 96 to rank RGs in order of stability: assigning an M value to represent stable expression and V values to suggest how many RGs should be used to create a geometric mean that gives the best stability across all experimental conditions. GraphPad Prism software was used for statistical analysis. A one-way ANOVA and Tukey test were used to assess statistical significance between genes of interest (GOI).
RNA samples were stored in −80°C and cDNA samples were stored at −20°C until processed.
Reference genes
RG analysis was repeated independently three times using HepaRG-P cells synchronized at a specific passage. Thawed cells were plated separately to create three independent technical replicates. As this experiment was carried out with three biological replicates, the total independent technical replicates were 9.
Based on current literature,12,13 12 RGs were assessed for use in normalizing GOI for experiments using HepaRG-P grown on different substrates. All samples were run against 12 RGs; UBC, YWHA, SDHA GAPDH EIF4A1, B2M, TOP1, RPL13A, ATP5B, CYC1, 18s, and ACTB (Table 2).
Tested Reference Genes with Names and Functions
Statistical analysis
Data evaluation and graphical illustration were performed with GraphPad Prism™ 5.0 and 7.0 (GraphPad Software, Inc., San Diego, CA). Three technical replicates were assessed for each experimental condition across three separate experiments, unless stated otherwise, and results are presented as mean ± SD. Appropriate statistical analysis was performed for each experiment, including one-way ANOVA, t-test, multiple ANOVA, and post hoc Tukey test, each detailed in individual chapters. Results were considered significant at p < 0.05.
Results
Morphological criteria
Initial evaluation of HepaRG-P cell cultures on different surfaces showed that adherence and morphology on OPC and DSQ120 were comparable or improved as compared with TCP. Other NPS arrays were discounted from further study having shown no advantage over TCP or OPC.
Repeated observation of HepaRG-P cells grown on OPC showed the emergence of cuboidal, hepatocyte-like cells (Fig. 3) that were confluent on ∼days 6 and 7. Cells grown on TCP were not confluent at day 6, retained fibroblastic morphology, and did not show any cuboidal hepatocyte-like cells.
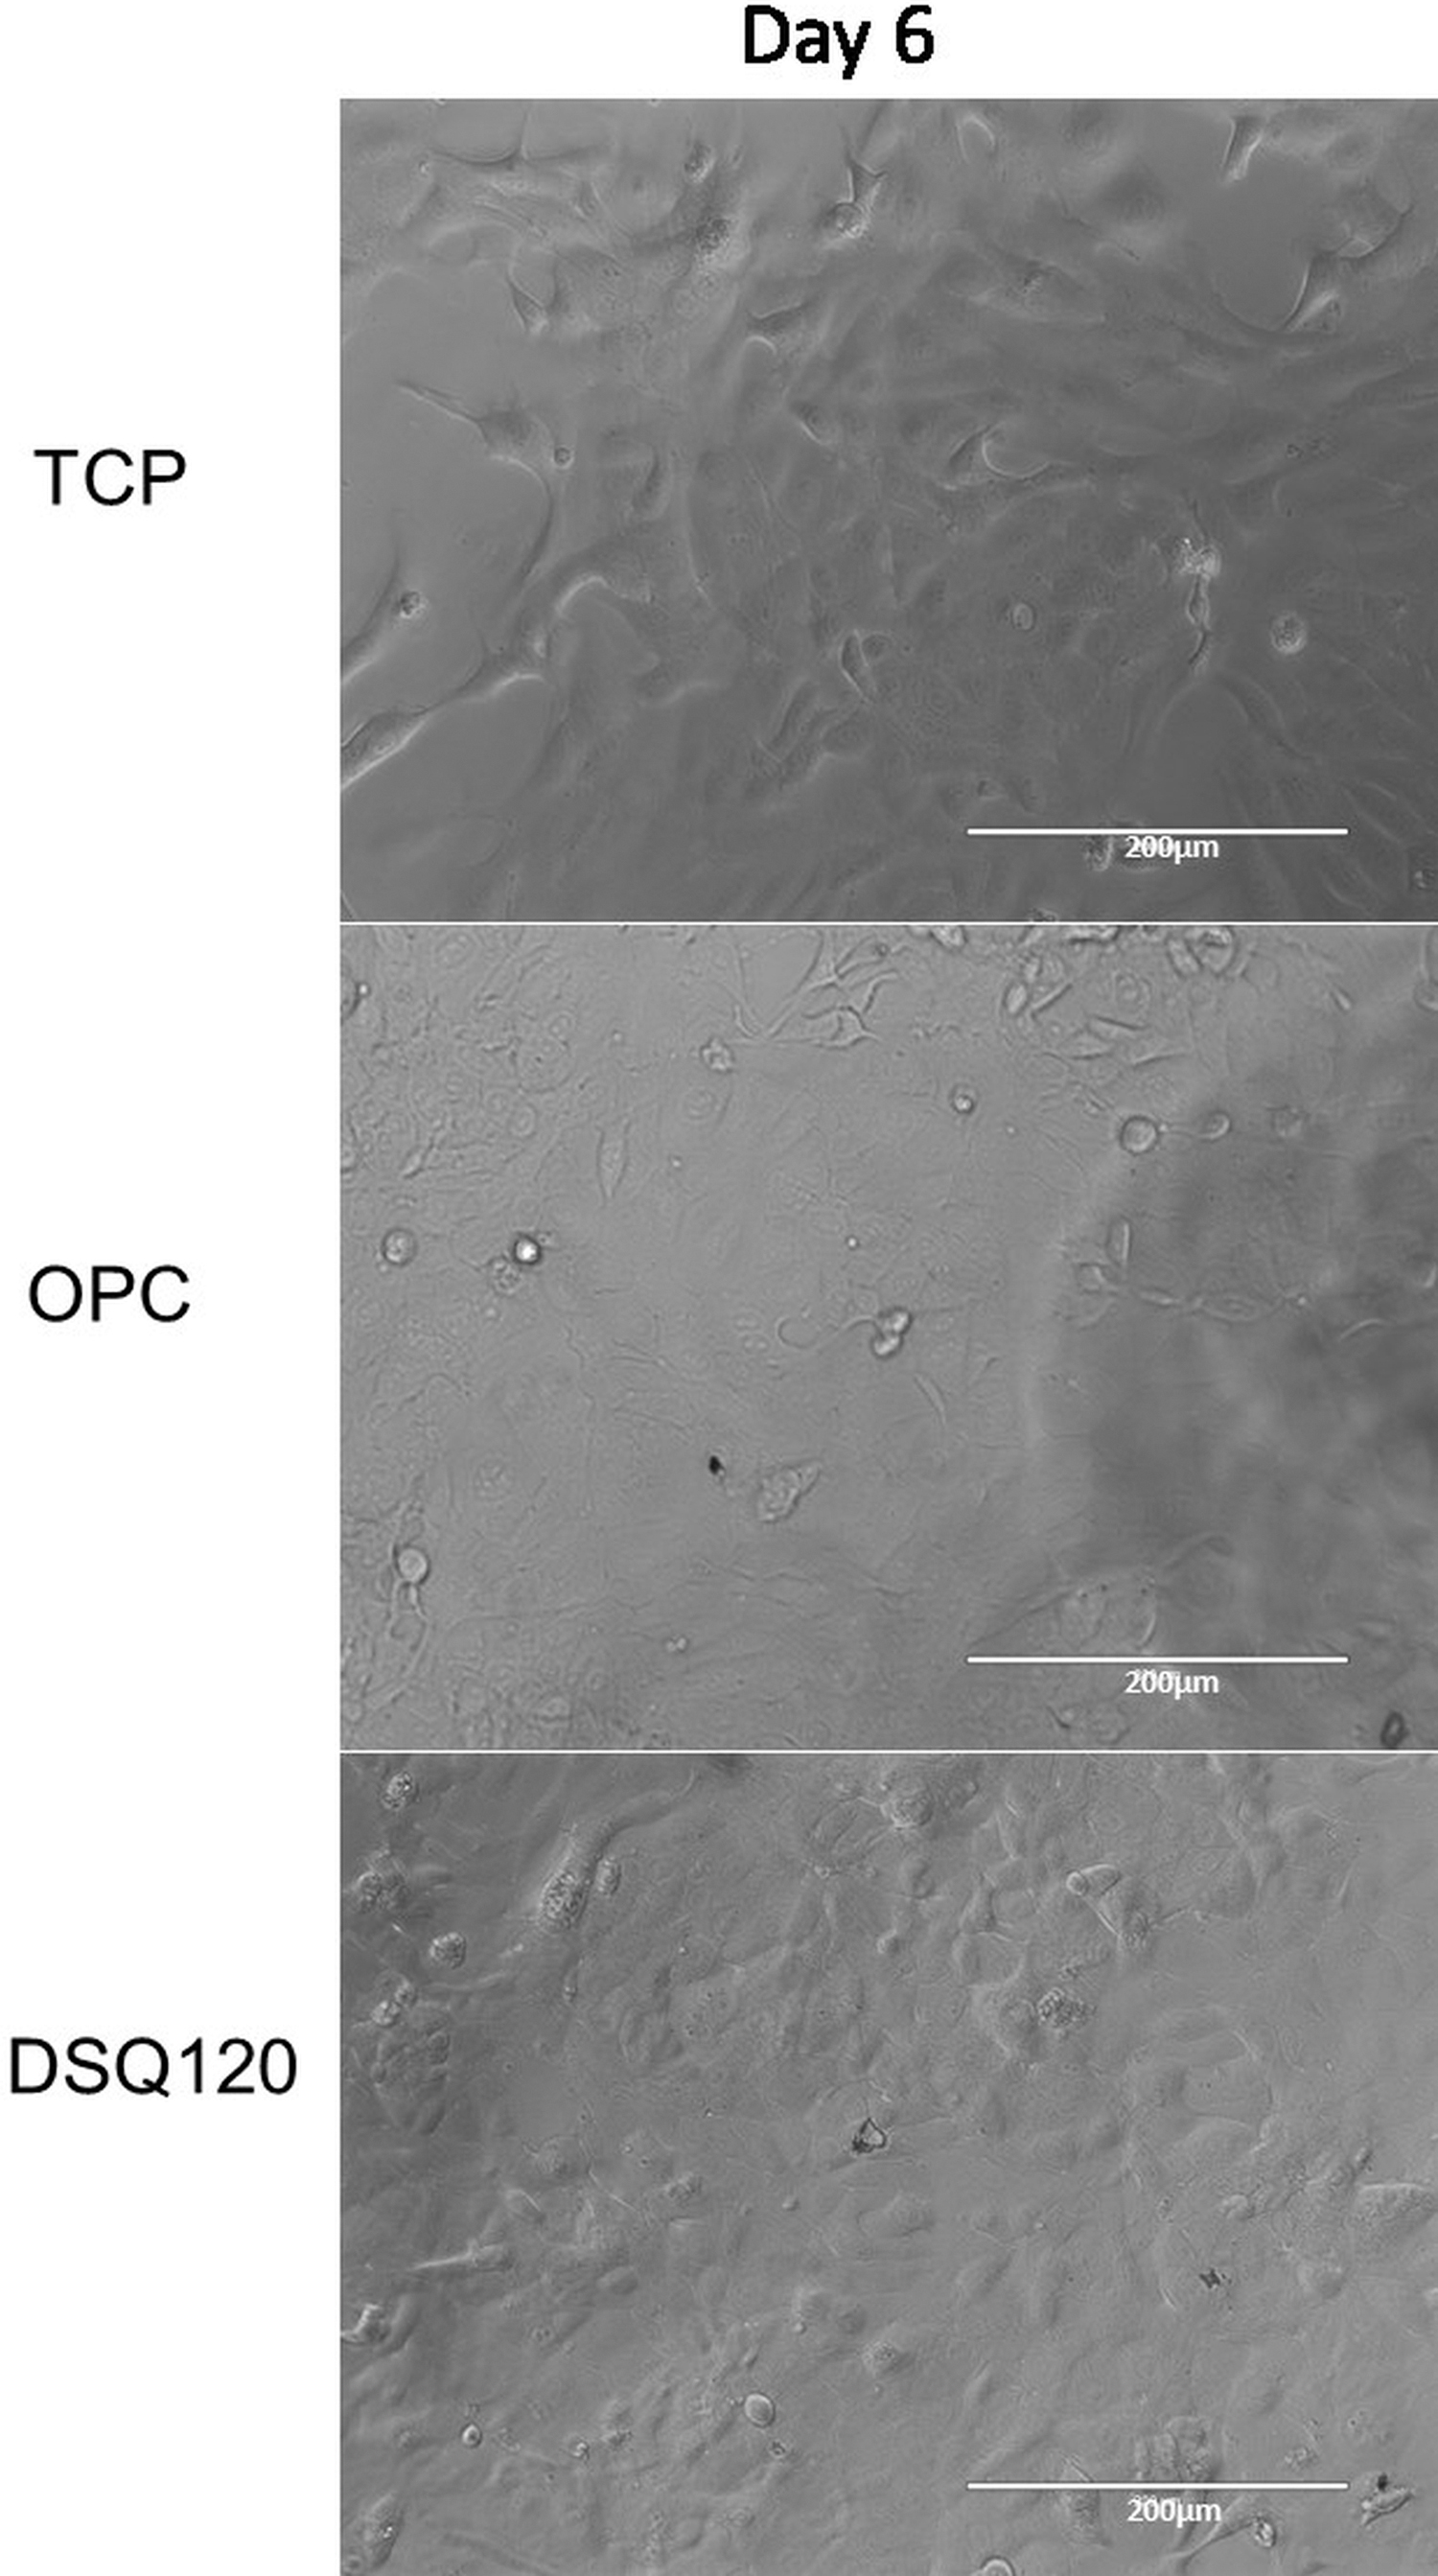
Morphological assessment of HepaRG-P cells cultured on TCP, OPC, and DSQ120 at day 6. Phase contrast microscopy showing HepaRG-P cells at day 6 of culture. Confluency was lower on TCP (96 w Corning) than OPC (Oxygen plasma coated control) and DSQ120 (nanopatterned substrate). On OPC cells were smaller compared with those on TCP and on NSP cells with cuboidal morphology indicative of hepatocytes can be seen. Images acquired using an EVOS Auto Fl™ ( × 20, scale bar measures 200 μm). OPC, oxygen plasma coated.
According to our criteria, we found only one pattern, DSQ120, which met our objectives and was used for the remainder of the study. This pattern showed early adhesion, confluency, and evidence of binucleation at day 6 before any other pattern tested (Supplementary Fig. S1) Results are based on a comparison of all three substrates.
Phenotype
Gene of interest results are presented as fold changes in gene expression relative to untreated control calculated with the ΔΔCq method.
Zonula occludens 1 as a marker of polarity
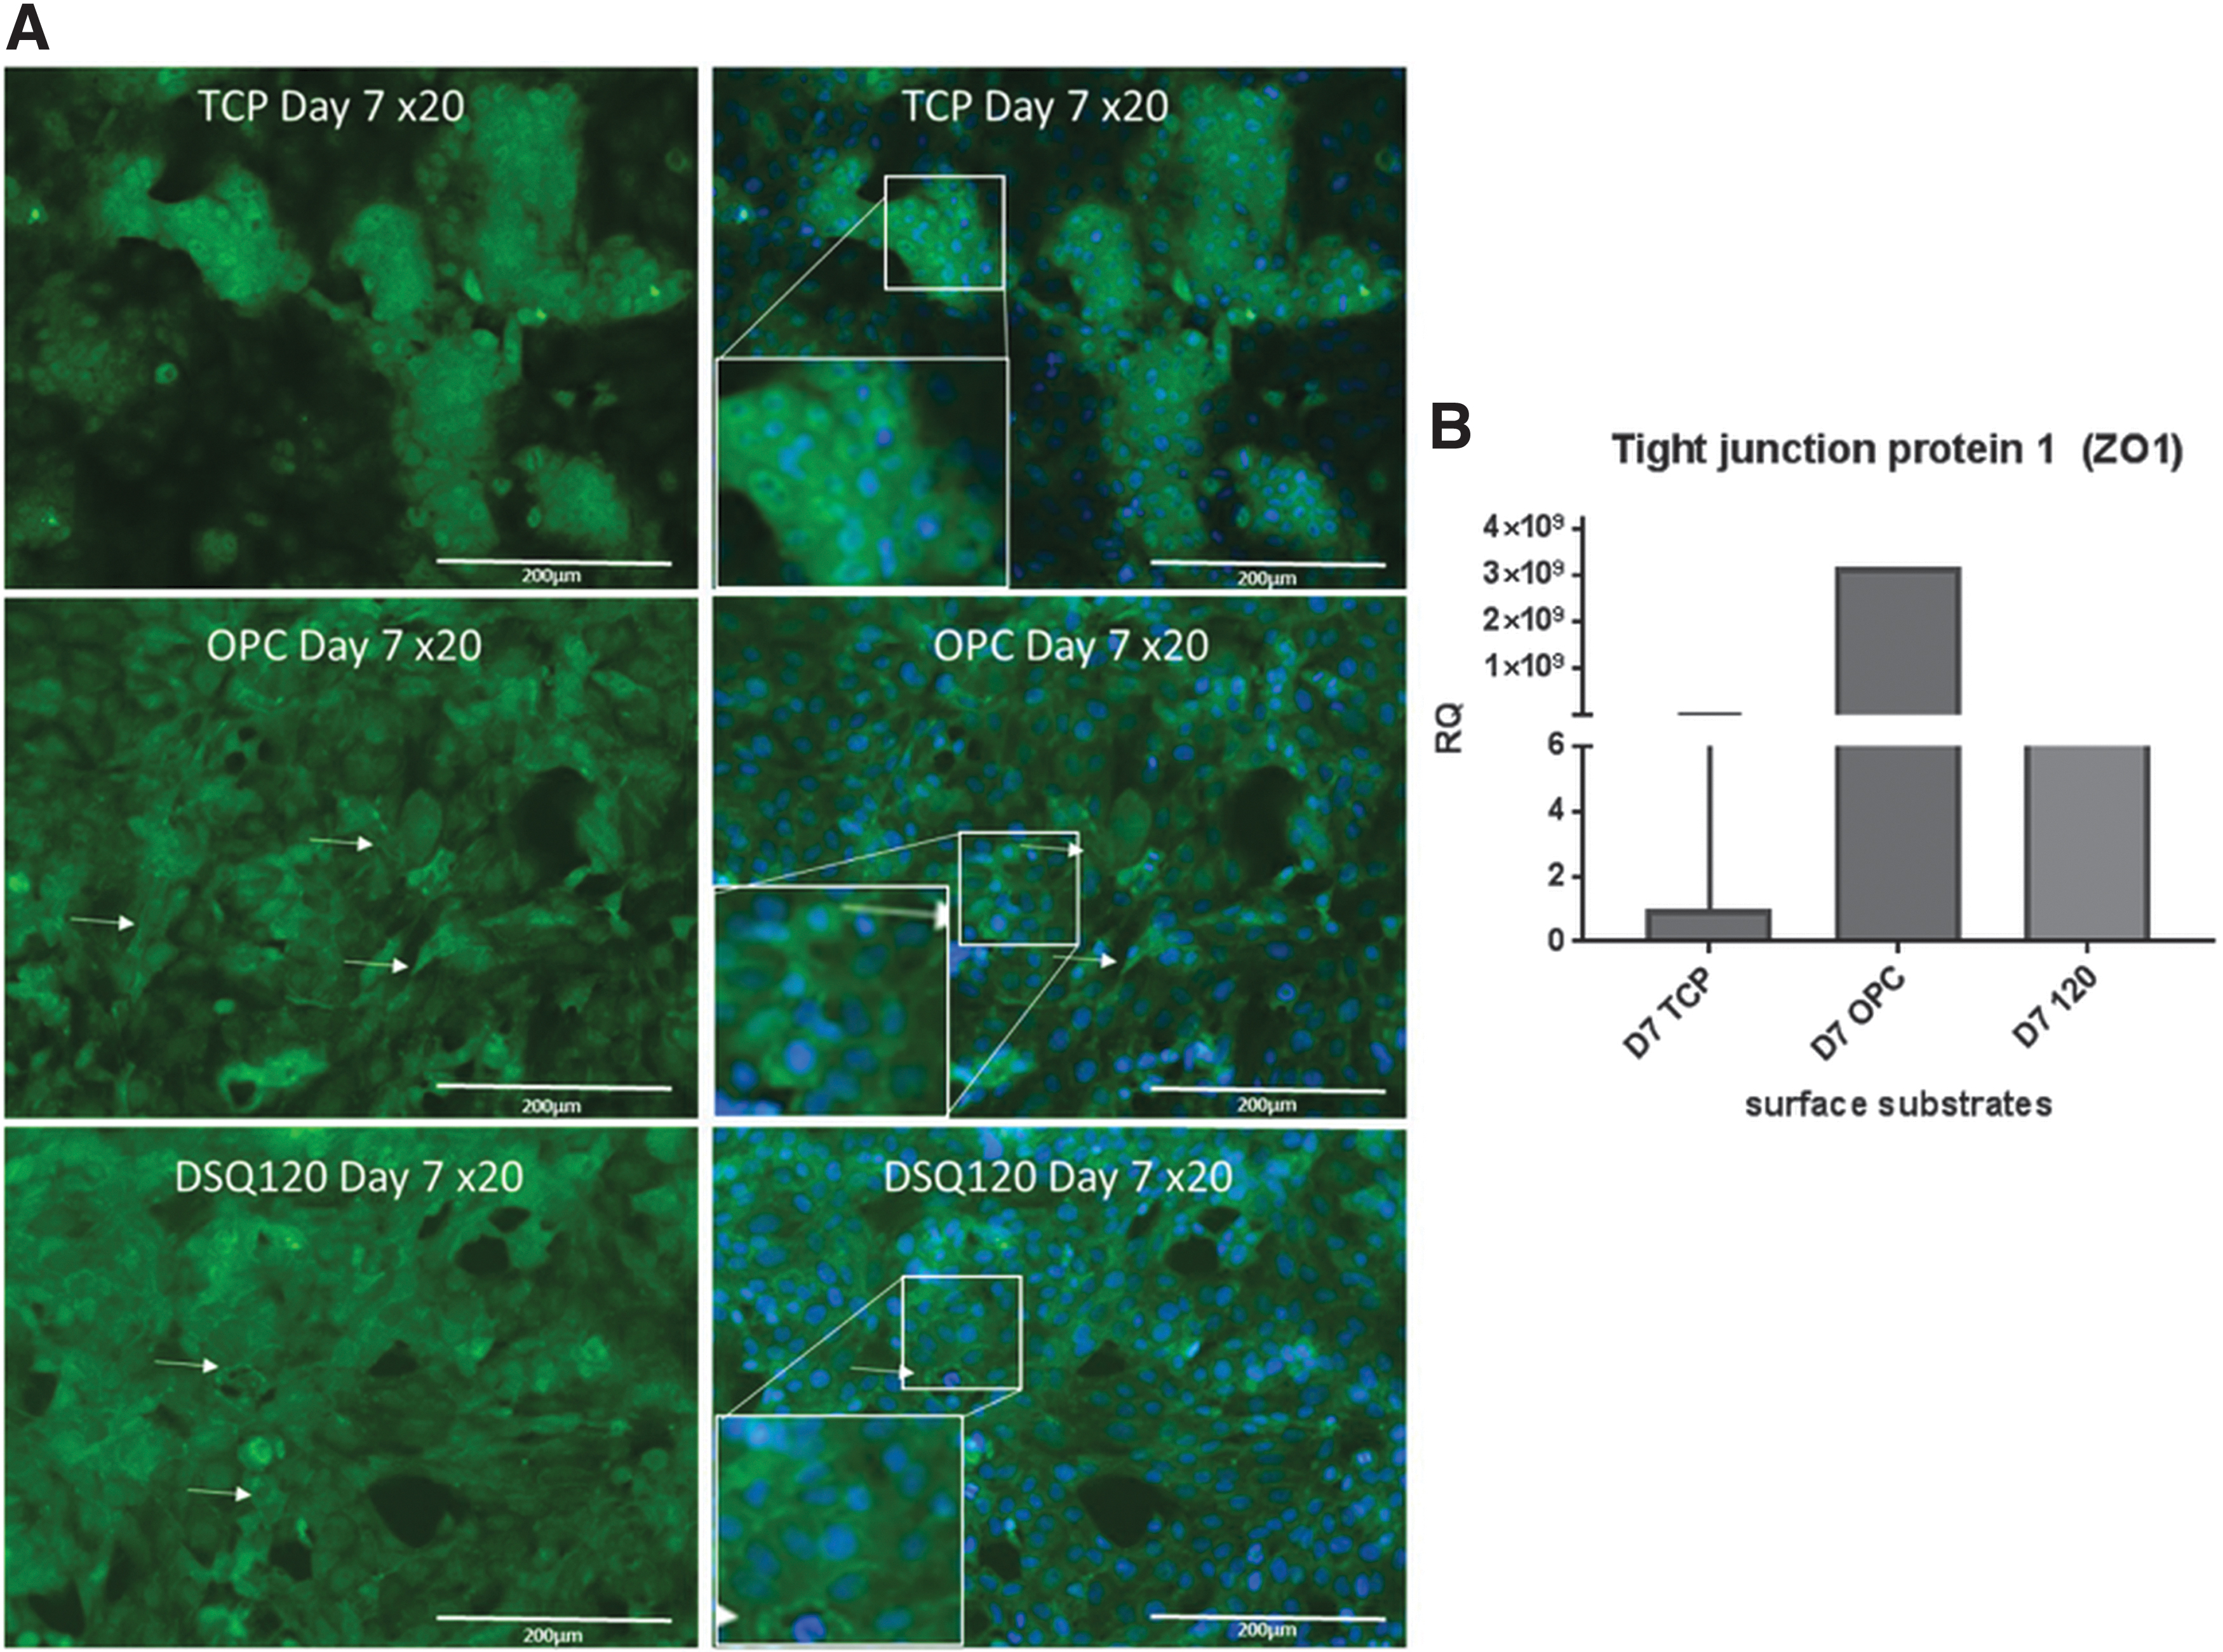
One of the basic indications of hepatocyte maturity is polarization of the cell. Zonula occludens-1 (ZO-1) is a membrane-bound protein that stabilizes tight junctions by interacting with the F-actin portion of the cytoskeleton; therefore, the presence of ZO-1 localized within the membrane at cell–cell junctions is indicative of polarity.
Distinct membrane-bound positive staining for ZO-1 was seen for cells cultured on OPC and DSQ120 at day 7 (Fig. 4).
Staining and qRT-PCR for ZO-1 a marker of cellular polarity.
Staining was confirmed by qRT-PCR for expression of TJP1 a gene encoding for ZO-1. A 3 × 10⁹-fold increase can be seen on OPC and 30,000-fold increase on DSQ120 at day 7 compared with TCP (Fig. 4).
SOX9/HNF4α expression
Although expressed in other tissues HNF4α and SOX9 are markers of hepatocyte and early cholangiocyte differentiation, respectively. Expression of these genes was, therefore, used to assess maturation and differentiation of HepaRG-P cells into separate hepatocytes and cholangiocyte populations. Cells with early transient expression of SOX 9 are cholangiocyte-like cells. Later expression of HNF4α identifies maturing hepatocytes. 14
When cultured on OPC substrate, expression of SOX9 was bright and well defined by day 6, which became diffuse by day 14, reaching a maximum by day 28.
TCP showed organized expression of SOX9 at day 6, which was diffuse at day 14 and reappeared at 28.
On DSQ120, SOX9 expression initially followed that seen on OPC at day 2–14, but returned to day 6 levels by day 28.
HNF4α was not seen at day 2 on any substrate. By day 6, little to none was observed TCP and DSQ120 and localized staining was seen on OPC. On all substrates localized staining was apparent on days 14 and 28 (Fig. 5).
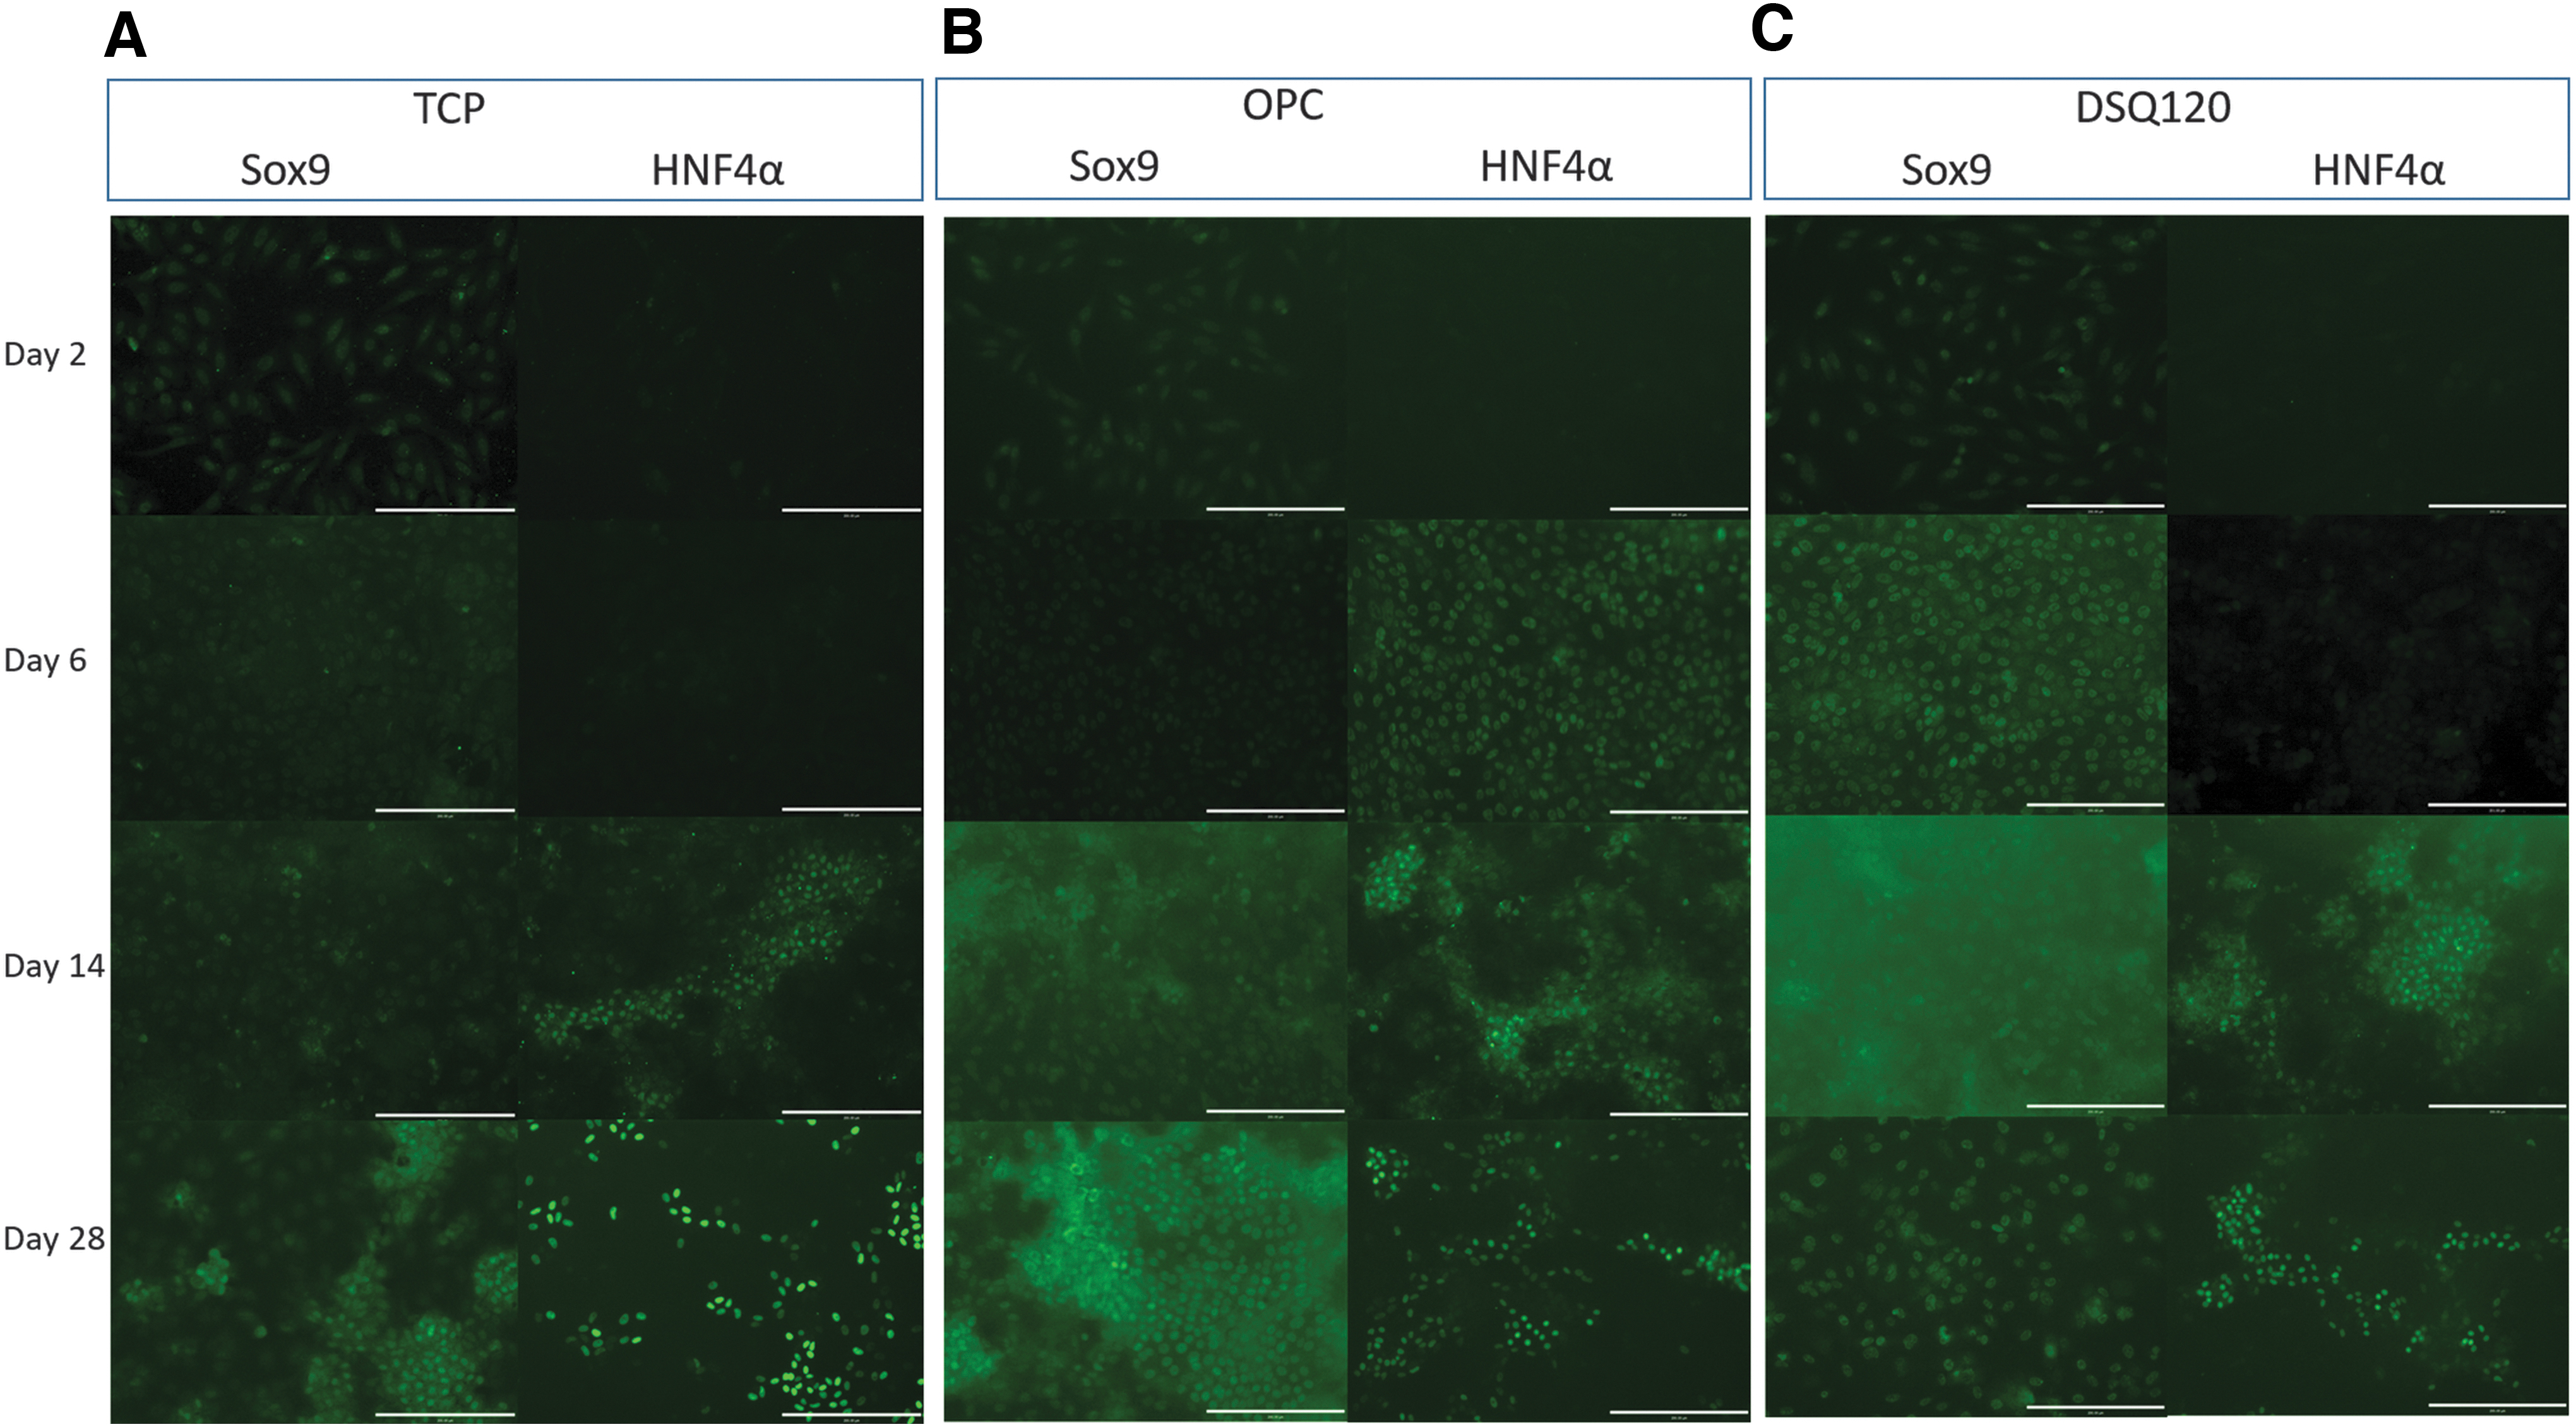
Phenotypic staining for progenitor protein SOX9 and mature hepatocyte marker HNF4α. All surfaces showed reciprocal staining of SOX9 and HNF4α throughout a 28-day culture period. Sox9:cytoplasmic Sox9 staining (green) was only seen at day 2 on DSQ 120
qRT-PCR analysis of SOX9 showed no expression at any time under any condition. This analysis was repeated three times with three to four technical replicates each time. HNF4α was present in all conditions on day 7 although there was an 80-fold increase on OPC and a 60-fold increase on DSQ120 compared with TCP control (Fig. 6).
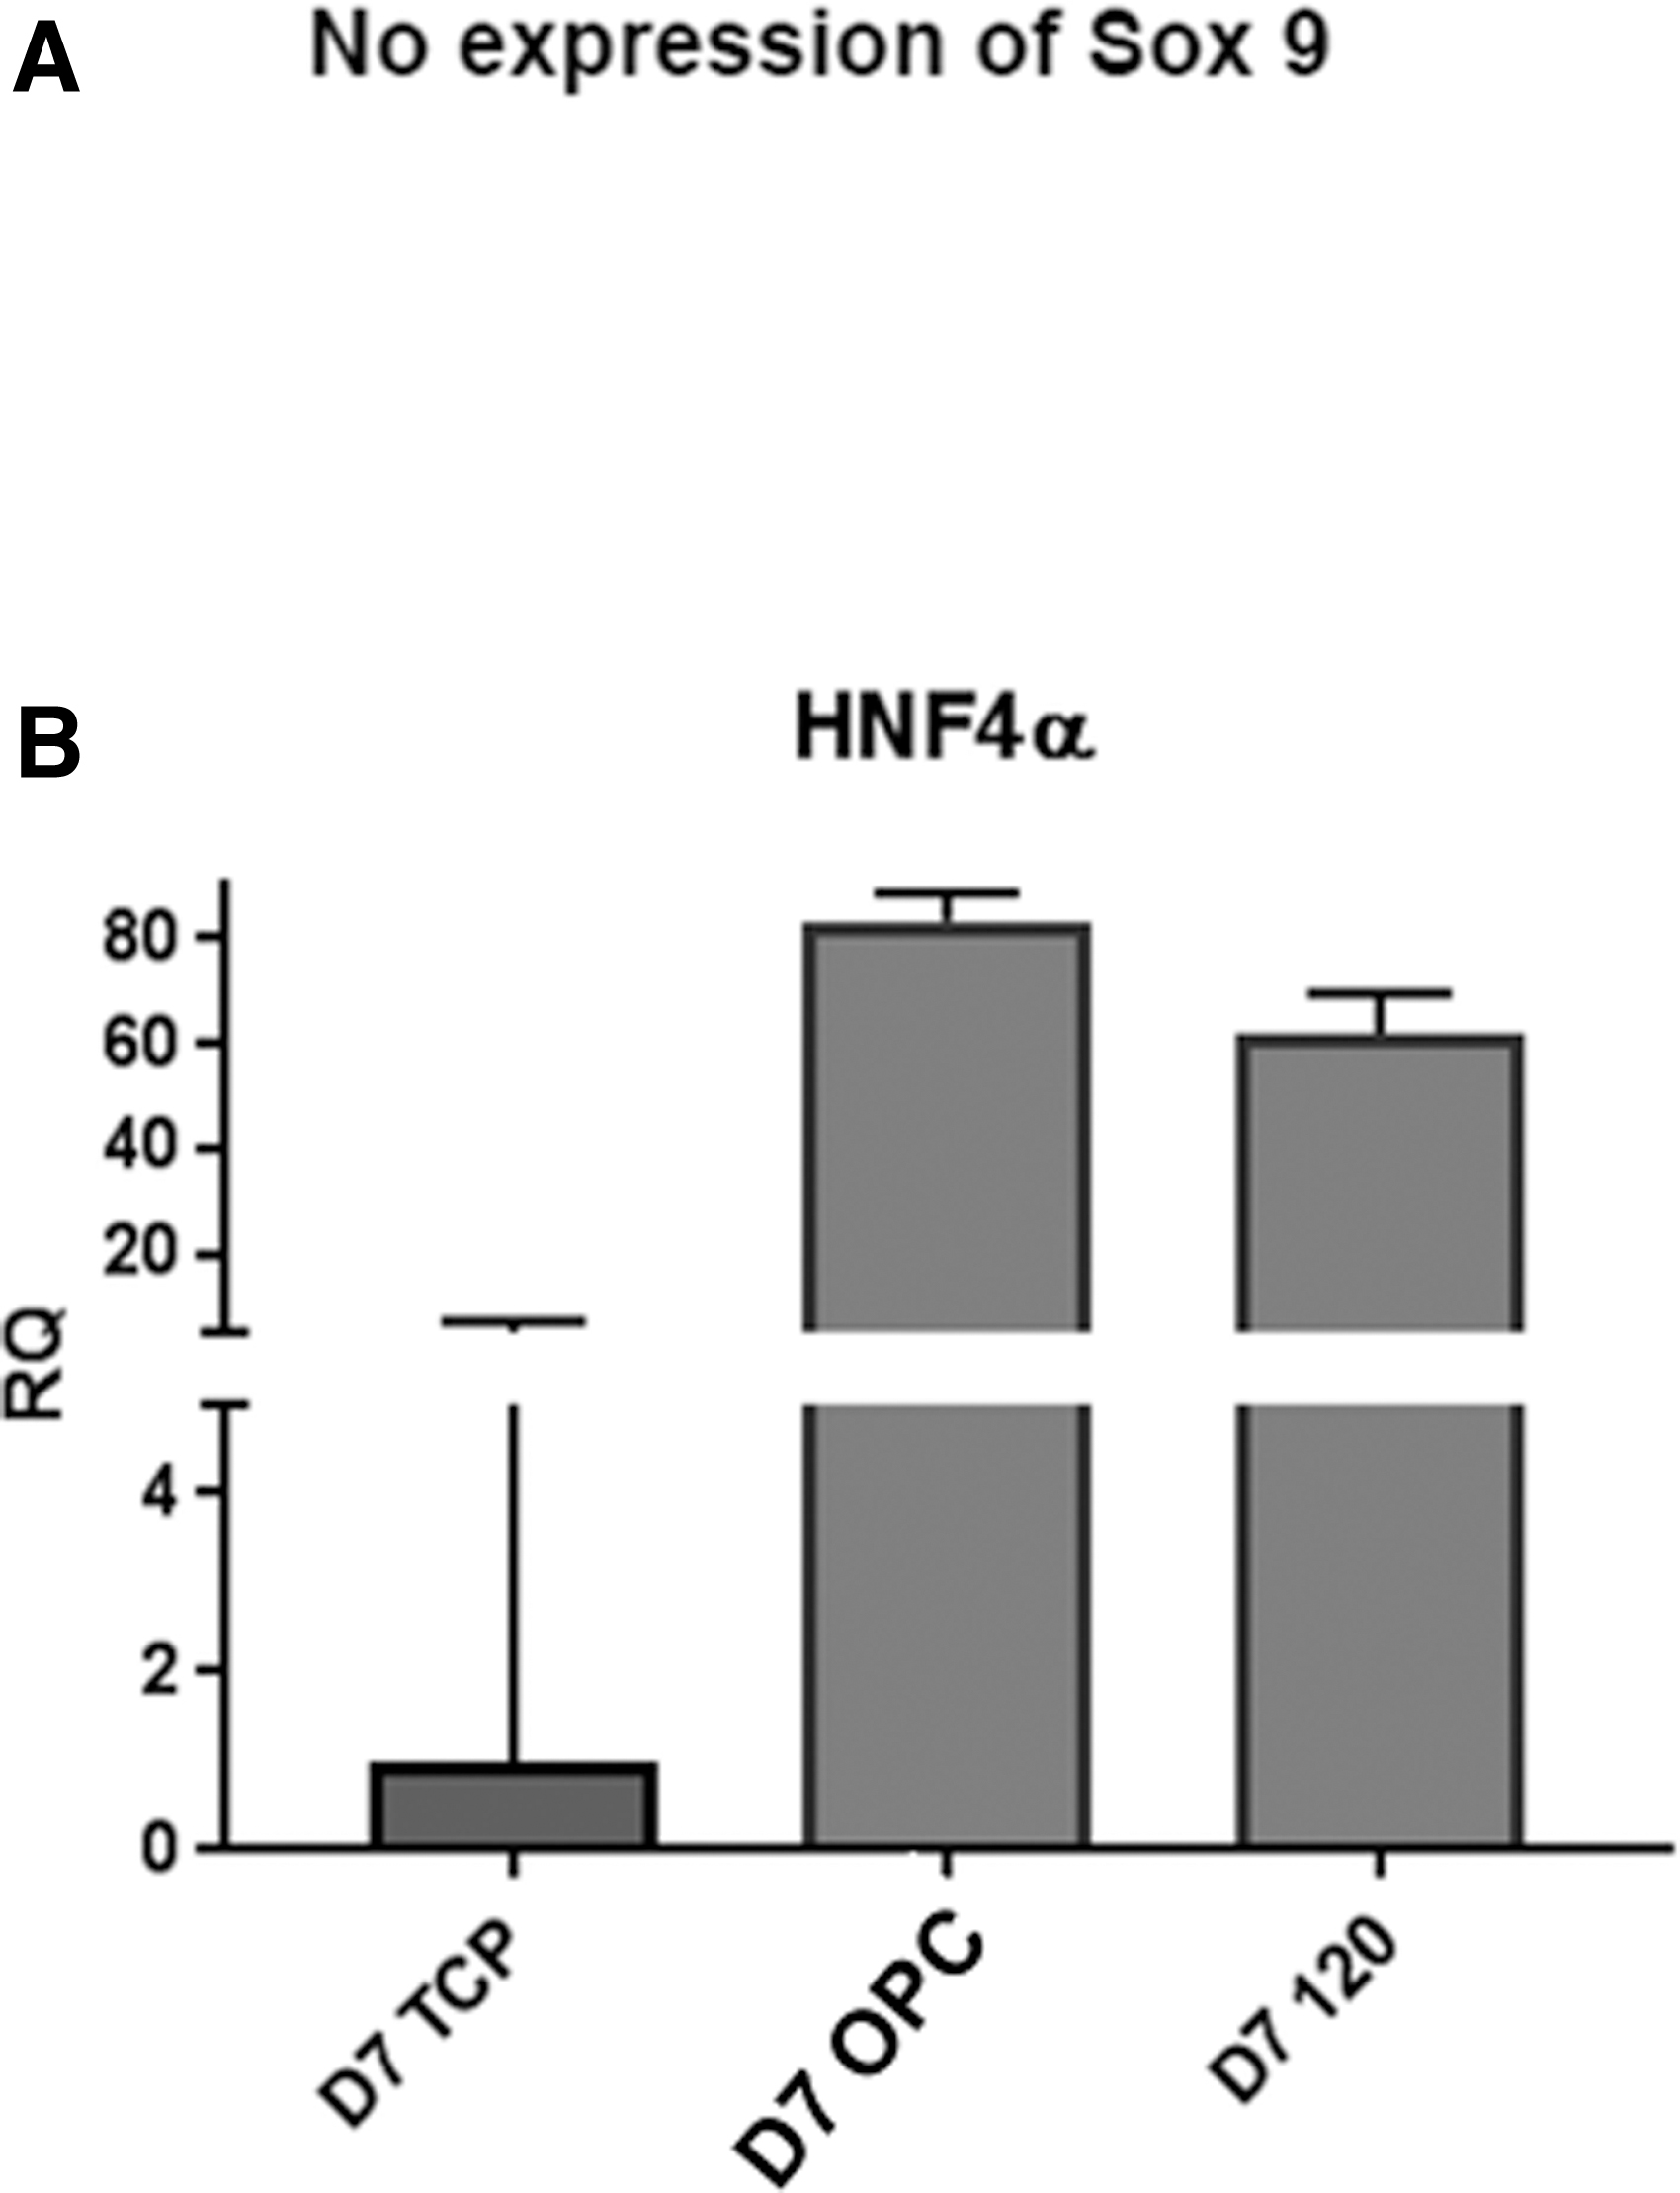
qRT-PCR data for Sox9 and HNF4α day 7.
Function
Viability assays
Total ATP and PrestoBlue was measured at day 7. Total ATP data show a significant difference between TCP and OPC (p < 0.0008) and TCP and DSQ120 (p < 0.007). However, no statistical difference was seen between any condition at day 7 in the PrestoBlue assay (Fig. 7). Total protein was also measured at day 7 showing significantly higher protein levels for TCP compared with DSQ120 (p = 0.25) and OPC (Fig. 7). This suggests that there was a greater number of cells on TCP, although OPC and DSQ120 had higher ATP levels.
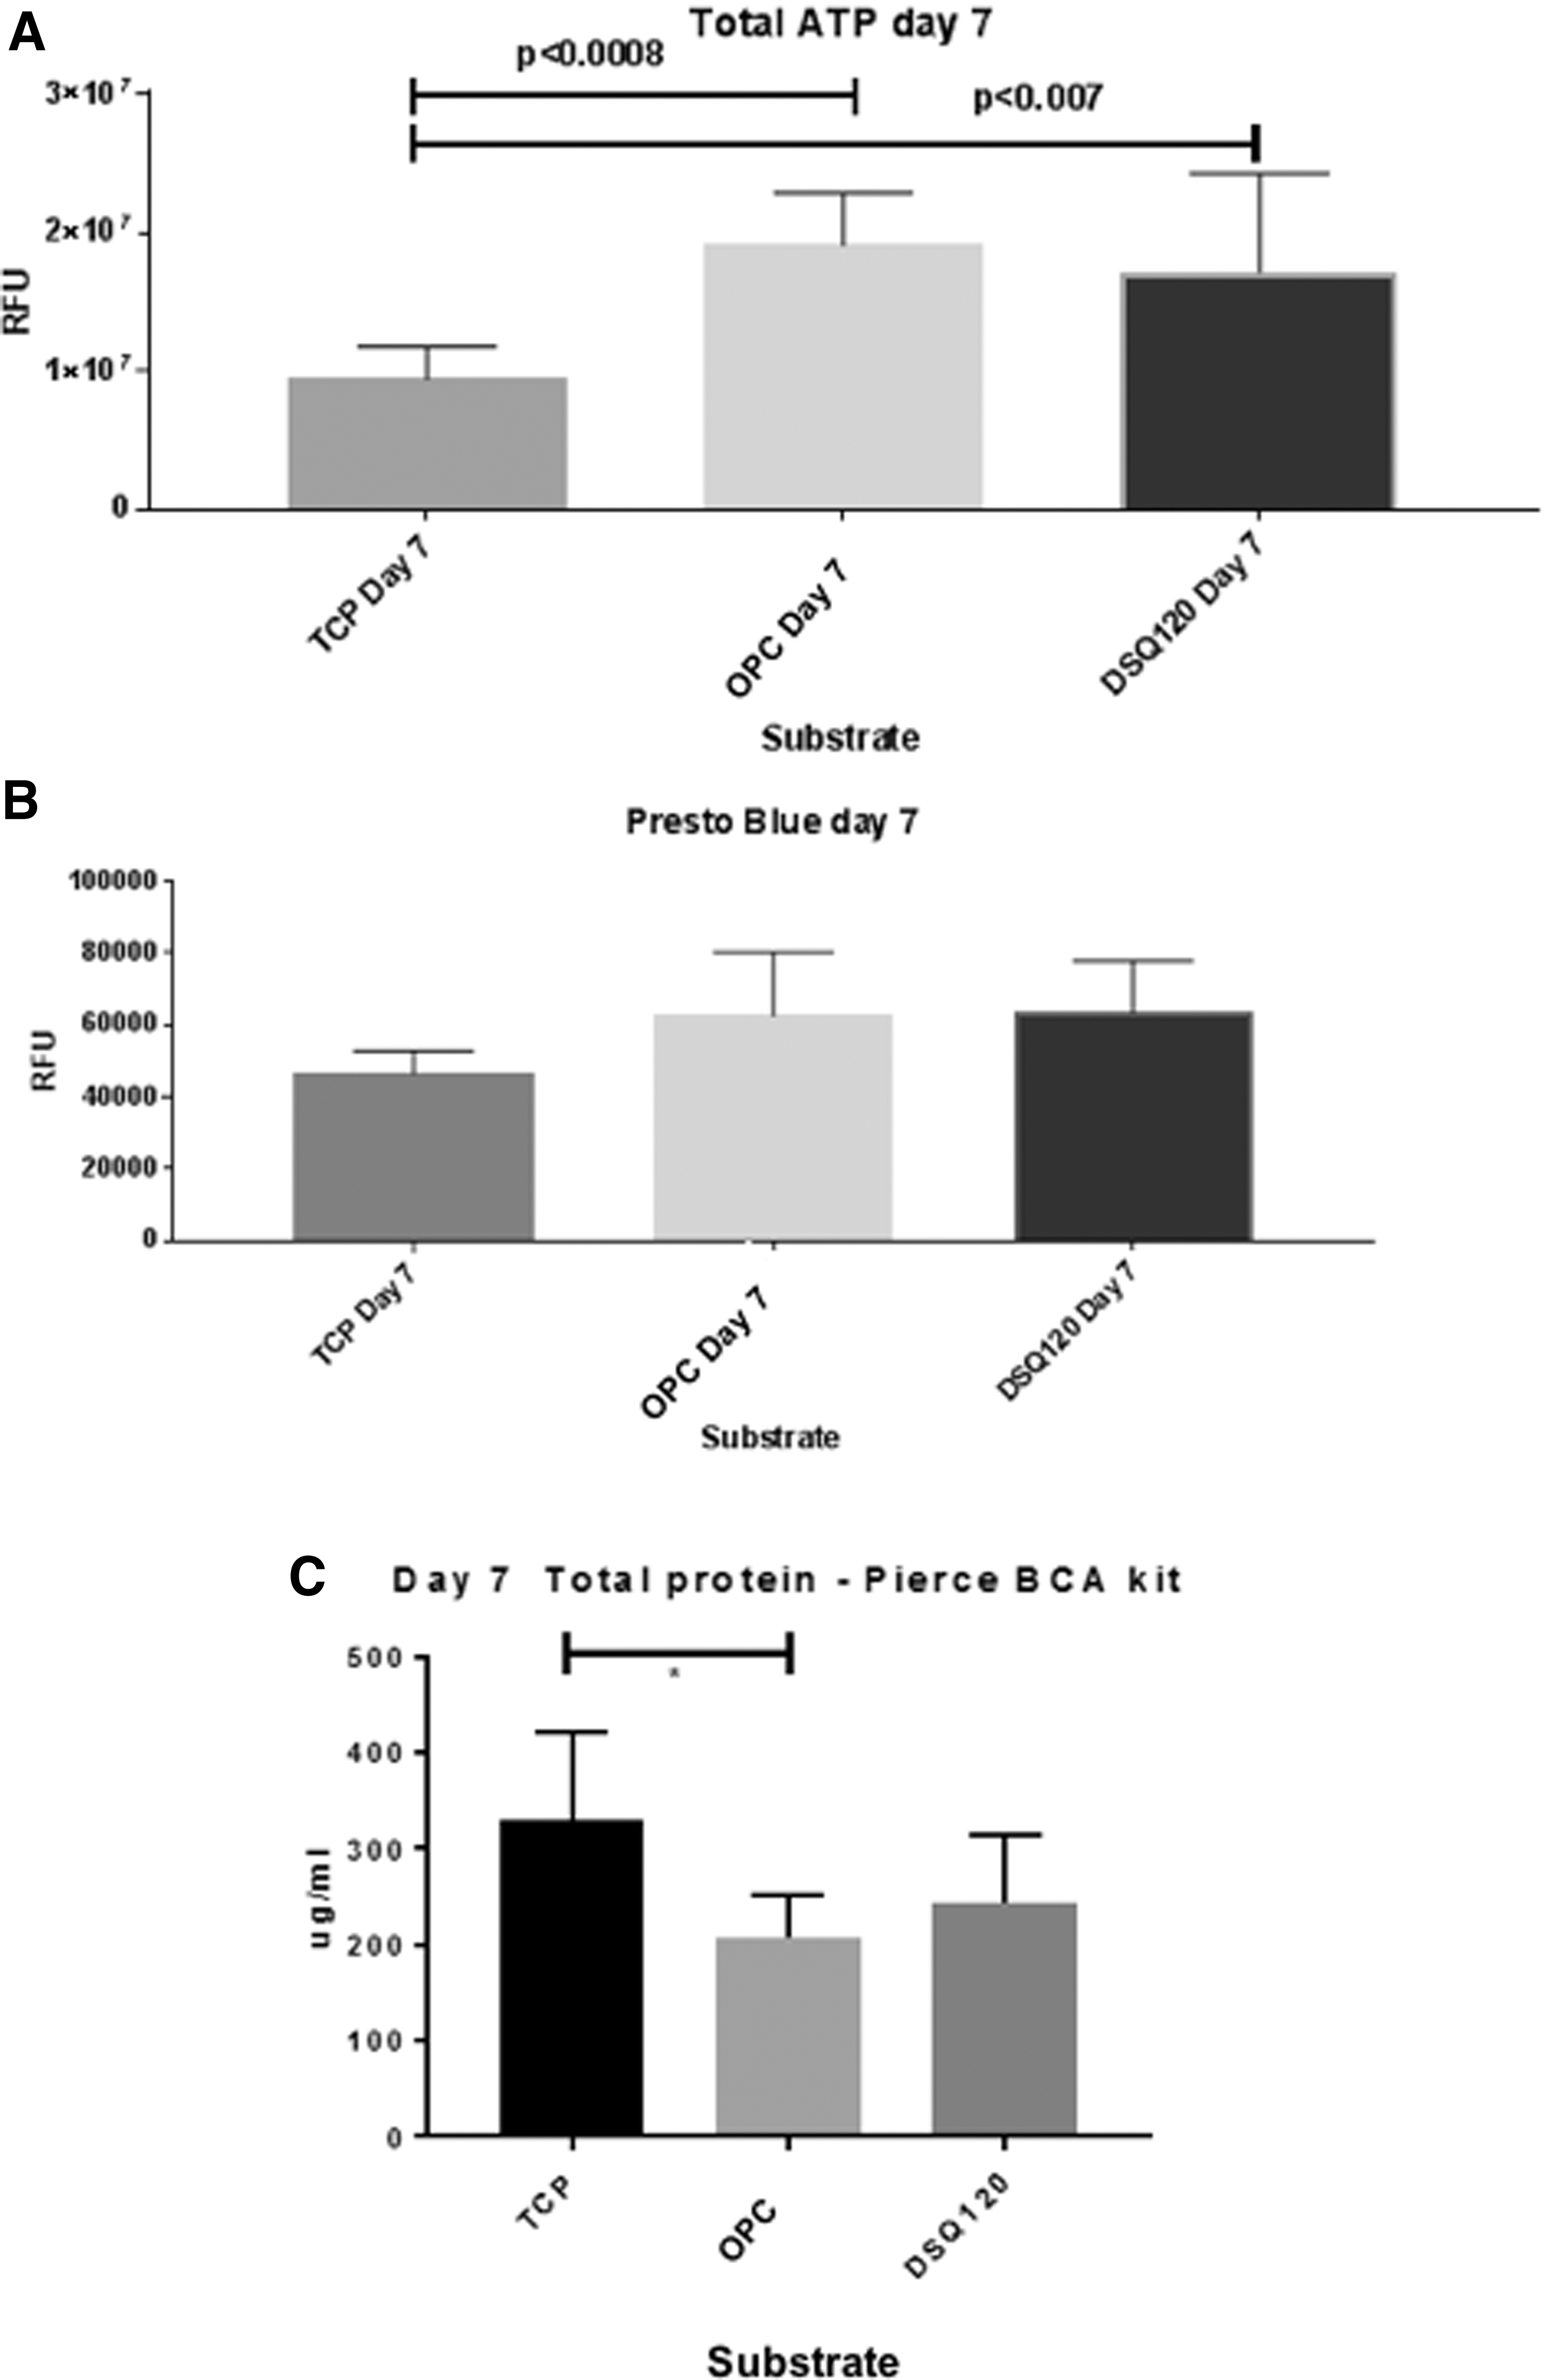
Measuring total ATP in HepaRG-P cells at day 7 across cell culture substrates.
Transferrin
Transferrin, required for transport of iron into hepatocytes, is a marker of a functional hepatocyte. 15 At day 7, localized transferrin expression was more abundant on cells grown on OPC than in cells cultured on DSQ120. On TCP, cells show some diffuse and unlocalized transferrin staining suggesting the protein was present, but not yet functional (Fig. 8)
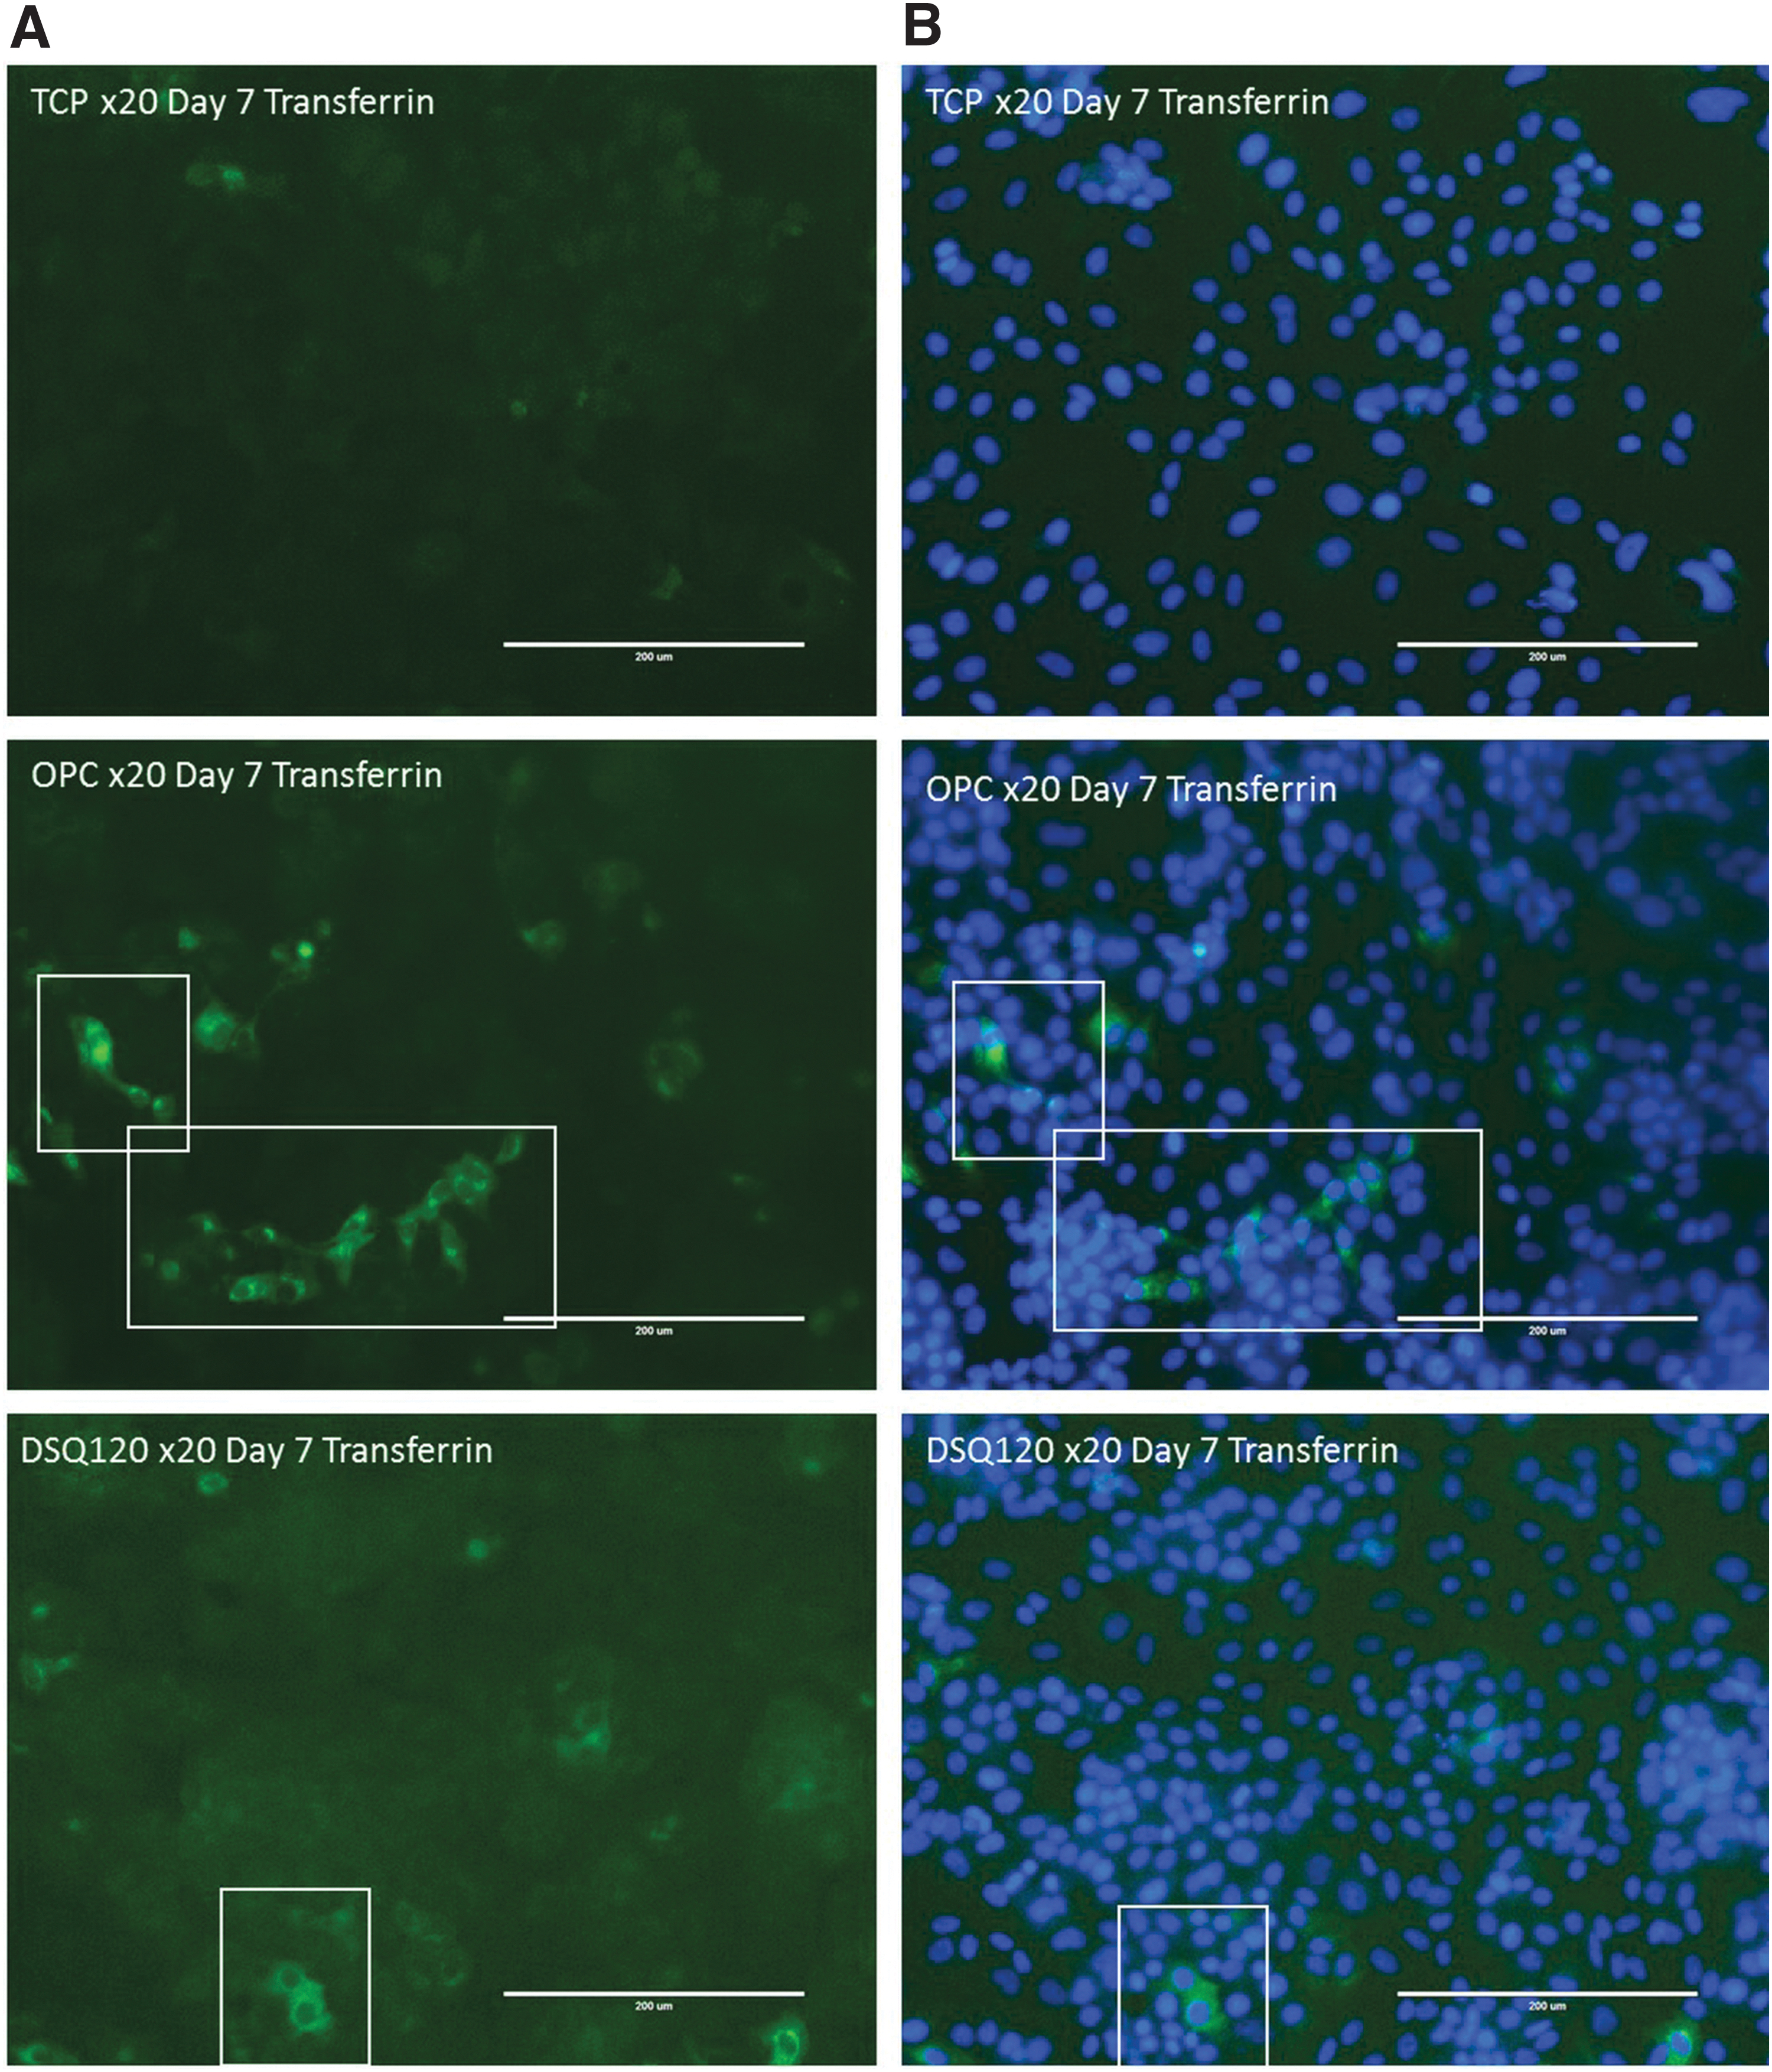
Transferrin antibody staining.
CYP3A4 activity
Mature cytochrome P450 enzymes also show functionality of hepatocytes. On day 7 CYP3A4, one of the major CYP enzymes in the metabolism of xenobiotics was detected on OPC and DSQ120 using both qRT-PCR and immunostaining. At day 7 there was an 80-fold increase on OPC and a 60-fold increase on DSQ120 compared with control. OPC and DSQ120 showed an abundance of CYP3A4, at this stage, not normally seen without the addition of DMSO (Fig. 9).
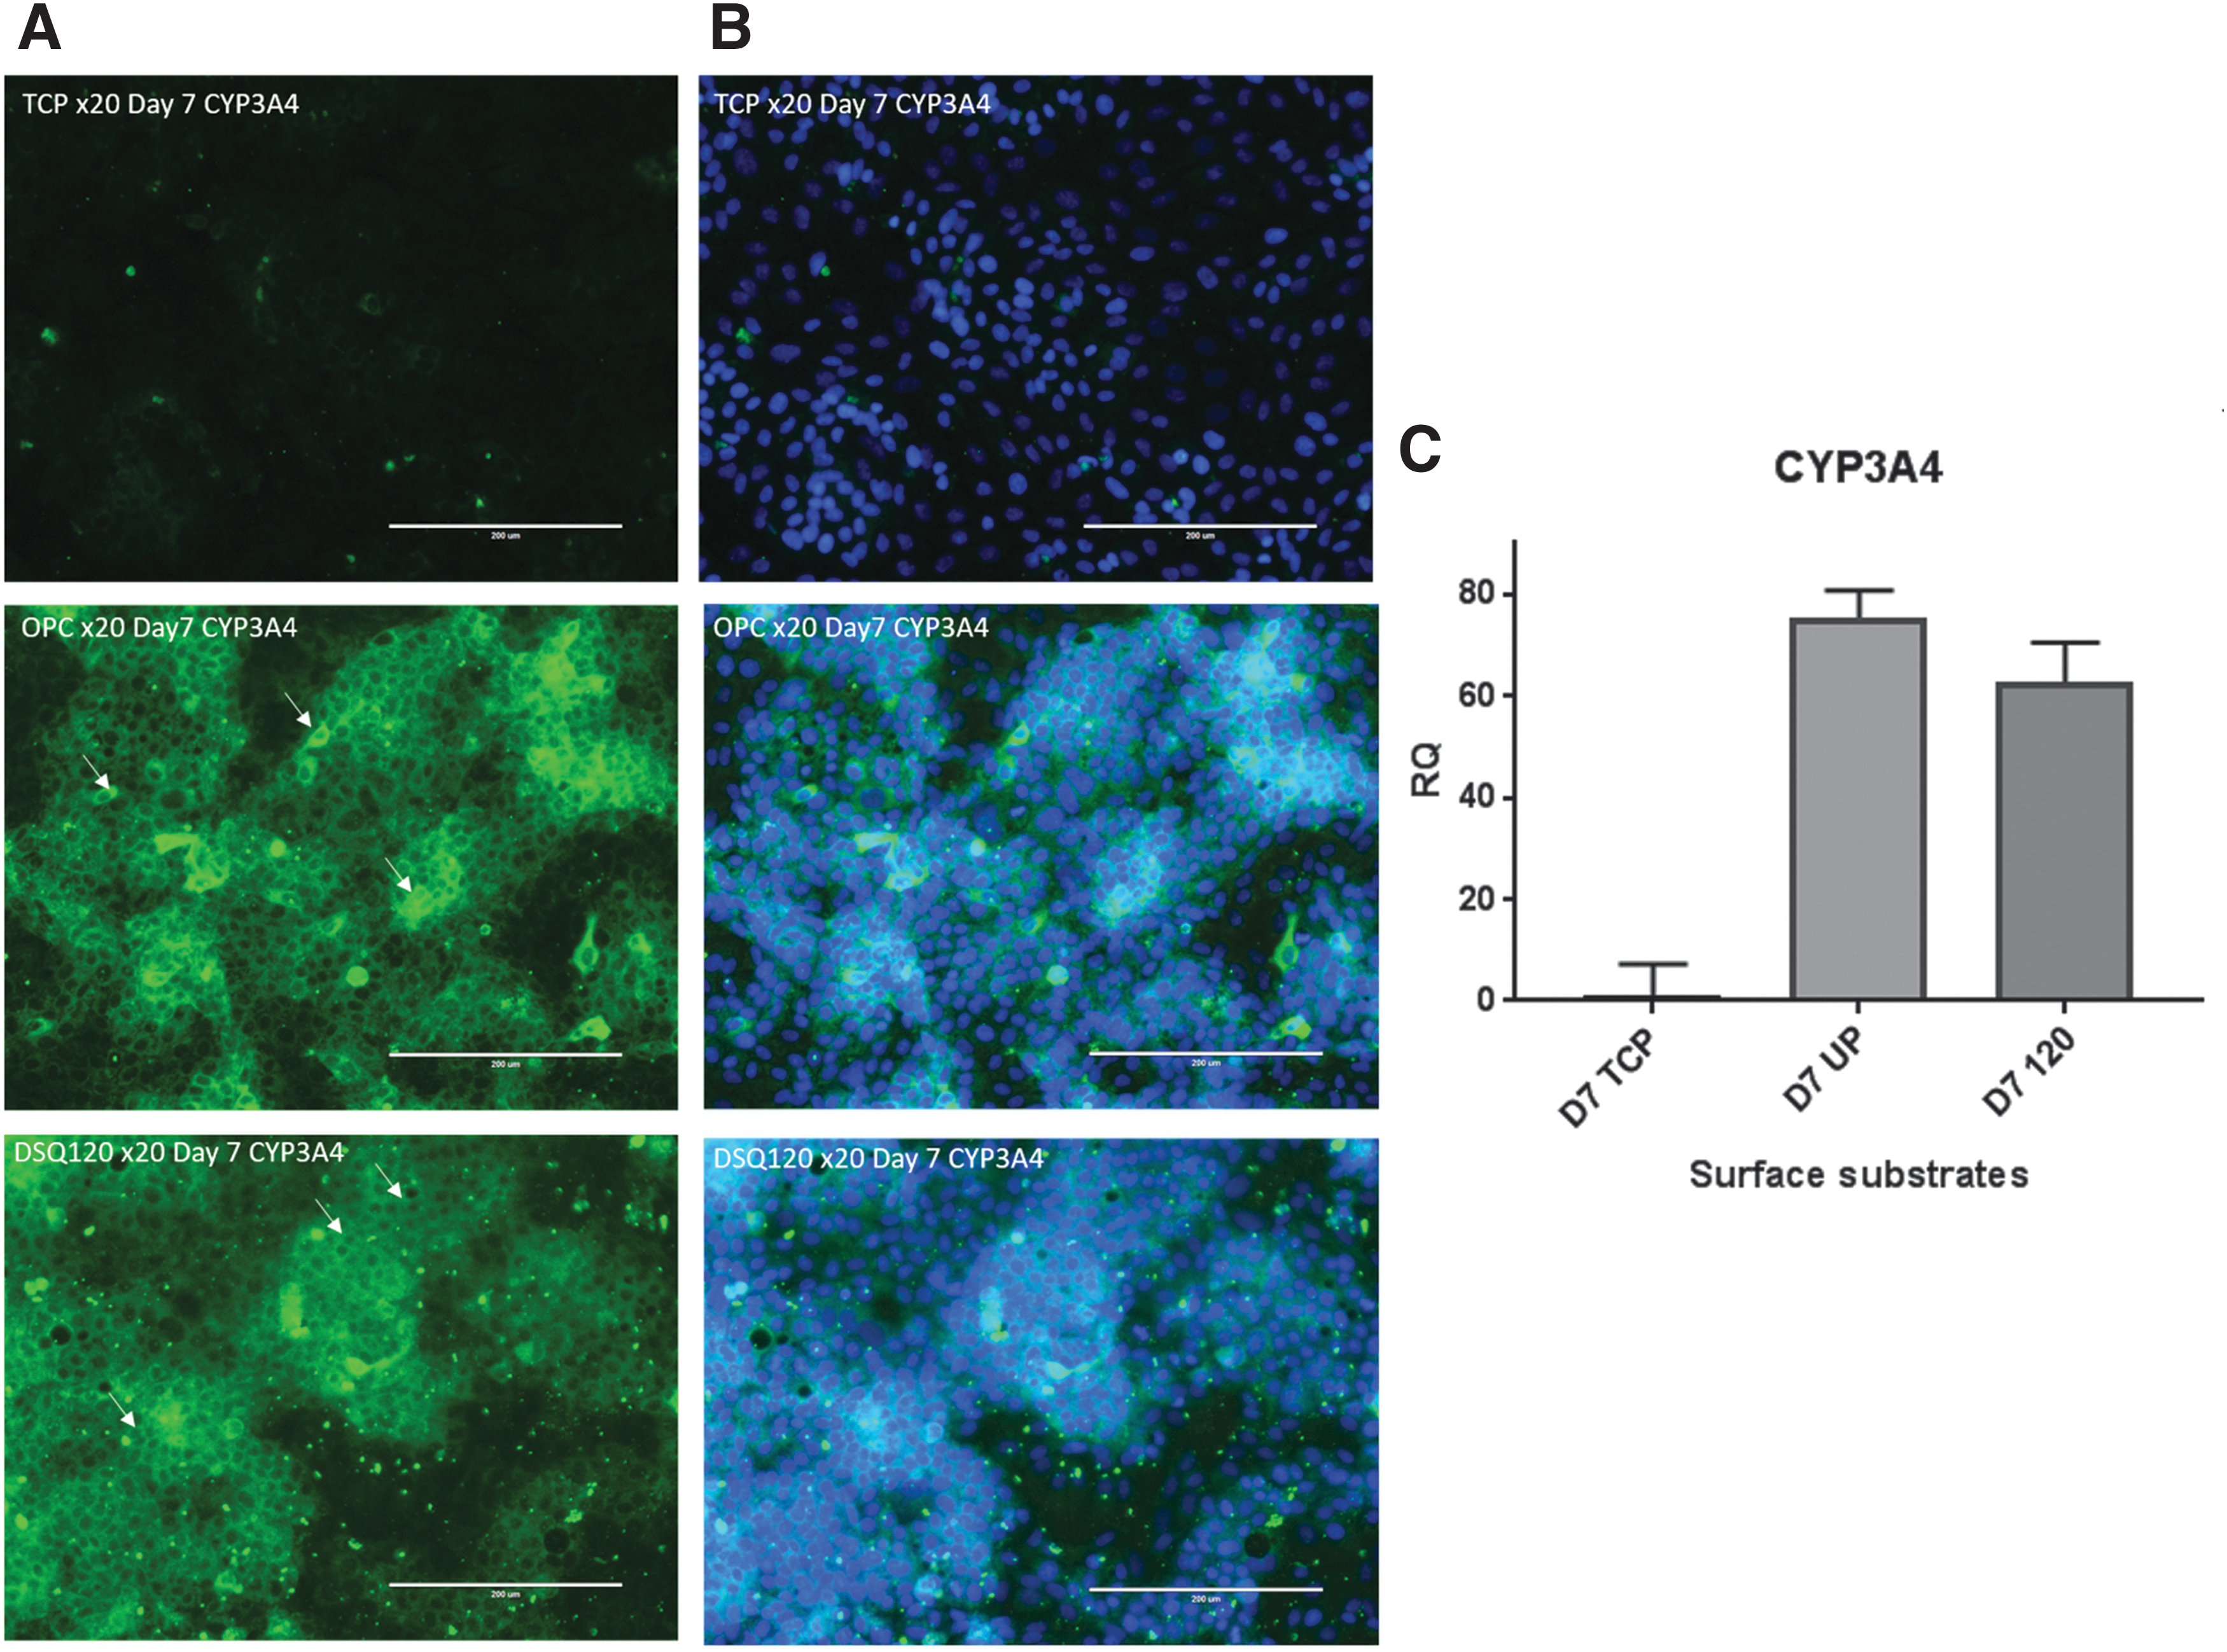
Expression of CYP3A4 using immunocytostaining and qRT-PCR to assess function of cultured HepaRG-P
Selection of RGs
Following MIQE guidelines criteria and using geNorm software we identified a set of stably expressed RGs appropriate for validation of gene of interest results for each gene across all experimental conditions (Table 3).
Reference Genes for Nanopattern Project Ranked from Most to Least Stable
Traditionally SD of Ct values has been used to assess stability. GeNorm software calculates gene expression stability (M value) using average pairwise variation (V value) for a gene comparing it with other tested RGs across all experimental conditions. 16 Low M values suggests high stability of expression.
Within this study, mean SD was 0.3 with a range from 0 to 0.5 in individual samples, showing mRNA low transcriptional variations (Supplementary Fig. S2). However, M values showed low stability (M > 1) when individual samples were assessed across all experimental conditions (Table 3). CYC1 was the only gene with an M value ranking <1, SDHA and 18S M values ranked between 1 and 1.2, and UBC, EIF4A1, GAPDH, and ATP5B ranked between 1.2 and 2.5. V values that evaluate the optimum number of RGs needed for normalization of data indicated variability between sequential normalization factors was relatively high (geNorm V > 0.15) suggesting at least 7–8 RGs were recommended to normalize GOI (Supplementary Fig. S2). Genes with an M value >1 are not stable enough for use as RG. Within this study, CYC1 was the only gene with an M value ranking <1, SDHA and 18S M values ranked between 1 and 1.2, and UBC, EIF4A1, GAPDH and ATP5B ranked between 1.2 and 2.5. This confirms the need for a set of RGs, geNorm software suggested a set of 7–8 for analysis of GOI data.
The geometric mean of the top three genes (CYC1, SDHA, and 18s) were, therefore, used as per the minimum requirement specified in the (MIQE) guidelines. 17
Discussion
This study examined proliferation, differentiation, and function of HepaRG-Ps grown on various surface chemistries and patterns in DMSO-free medium. We hypothesized that HepaRG-Ps cultured on OPC substrate in DMSO-free media would not show a difference in respect of differentiation and function from those grown on TCP. However, addition of a nanopattern to an OPC surface might promote growth and differentiation of HepaRG-Ps in DMSO-free media, as NPS have been shown to increase proliferation and differentiation without the use of exogenous chemical signals in other models.9,18
Oxygen plasma treatment
Oxygen plasma treatment is used to enhance cellular adhesion to substrates as it increases surface polar groups that improve hydrophilicity 7 ; however, it was unknown if OPC would affect differentiation or function of cells. Oxygen plasma treatment is measured as wattage over time. A study by Wan et al. 7 showed oxygen plasma treatment of 50W for 2–5 min increased adherence to poly(lactide-co-glycolide) (PLGA) films; however, extending treatment time increased surface roughness, reducing the number of polar groups on the surface of the PLGA, compromising adherence. 7
Although we anticipated improved adhesion using OPC, it was interesting to find that using low oxygen plasma treatment of 40W for 30 s alone had an effect on differentiation and function. Normally within an early HepaRG-P culture, cholangiocyte-like cells appear elongated and thin with a single nucleus, whereas developing hepatocytes emerging later in culture appear more cuboidal, are binucleate, and have a more granular appearance. HepaRG-Ps grown on OPC showed increased proliferation and some differentiation around day 7 indicated by a high level of confluency and appearance of cuboidal cells, not seen in those grown on standard TCP. In view of these observations, we investigated various markers of differentiation and function and compared OPC directly with TCP.
Polarity
Membrane polarity, the hallmark of an established hepatocyte culture, is maintained by the function of tight junctions that regulate passage of ions and molecules through the cell from apical to basal surfaces. Cellular distribution of ZO-1 part of the membrane-bound complex regulating tight junctions is indicative of polarity.
Figure 5 shows the presence of ZO-1 in both OPC and TCP cultured cells. However, the location of this protein within the cell determines whether it is a marker of polarity. In TCP, although ZO-1 is clearly present, it remains mostly cytoplasmic and not membrane bound. This is typical of a protein undergoing translation as it migrates to its point of function, whereas on OPC ZO-1 can be seen clearly within the membrane where it is functional. qRT-PCR supports this observation, showing a 3 × 10⁹-fold increase of TJP1 (the gene encoding for ZO-1) on OPC than TCP when results are presented as fold changes in gene expression relative to untreated control (Fig. 4).
SOX9/HNF4α reciprocal expression
SOX9 is an ubiquitous protein found in a variety of cell types and is known by several names (CMD1, SRA1, CMPD1, SRXX2, SRXY10, and SRYBOX9) 19 ; it is reported as an early marker of the cholangiocyte lineage.20,21 HNF4α is a member of a nuclear receptor family of transcription factors found in digestive tissue such as gut22,23 and liver. 24 As the HepaRG-P cell line only differentiates into cholangiocytes and hepatocytes expression of SOX9 and HNF4α can be used to identify early-stage cholangiocyte and differentiated hepatocytes, respectively. Sox9 was seen early in both OPC and TCP cultures, was lower by day 14 on TCP, and reappeared at day 28 on TCP.
Although SOX9 is known to be a marker of an early cholangiocyte lineage, it is possible that this gene has many other functions. It is believed that many genes have a degree of pleiotropy, or the ability to multitask, 25 and it is possible that although SOX9 is a marker of early phenotype, it may have other functions at a later stage of cellular development especially since it is so well conserved across a variety of tissues.
HNF4α is responsible for downstream regulation of many metabolic processes such as bile acid synthesis, lipid and glucose metabolism, and the uptake of iron mediated by transferrin.24,26 In vivo loss of function studies using knockout mice showed loss of HNF4α resulted in mortality. 24 Furthermore, acute disruption of this protein results in hepatosteatosis and impacts apoptosis, cell cycle, and growth factors downstream. 24 Expression of HNF4α was, therefore, used as a marker of hepatocyte phenotype and function in assessing differentiation of HepaRG-P's on different treated surfaces.
To establish reciprocal expression one would expect to see clear indication of SOX9 early in the culture (week 1–2) and no, or diffuse expression in later weeks. Whereas HNF4α should not be present early in the culture or should not be well established until the cells following the hepatocyte lineage become committed. At this stage it would be expected that HNF4α would become localized and clear.
For both surface treatments, SOX 9 was present and localized in cytoplasm with a sharp and clear appearance on day 6. Around day 14 staining for SOX9 became more diffuse on OPC and DSQ120 and showed lower expression on TCP as cholangiocytes matured. qRT-PCR data suggest that there is no SOX9 expression at any time point on any condition (Fig. 6). As qRT-PCR data quantify total mRNA of specific genes, in this case SOX9, we could consider that the mRNA had already been translated into the protein detected by immunocytochemistry. As we show SOX9 staining clearly in all samples, this would indicate that further research is required to validate SOX9 within qRT-PCR experiments. Primers were validated by Primer Design, though, to add credence to this analysis, we would need to validate them using a cell line or tissue known to express high levels of SOX9.
HNFα expression was seen on both surfaces (OPC and TCP) by day 14 and was maintained at day 28, and qRT-PCR analysis showed an 80-fold increase at day 7 of HNF4α in cells cultured on OPC versus TCP and around a 60-fold increase in cells culture on DSQ120 versus TCP.
Viability: total ATP and metabolic function
Within this study two biochemical assays PrestoBlue and total ATP were used to assess viability and metabolic function of the cells.
The Pierce BCA total protein kit was also used to quantify total protein which would correlate cell number between conditions, this also allowed for a direct comparison of metabolic proficiency assuming there was not a statistical difference.
On day 7 there was a significant increase in total ATP on OPC compared with TCP suggesting increased viability/metabolic activity of the cells. However, there was no statistical difference on day 7 measurement of metabolic proficiency (Fig. 7). This is especially significant as the total protein assay showed a significant difference in the level of protein on day 7 in TCP compared with OPC. This suggests that there may be fewer cells on OPC, but they are more metabolically active especially in production of ATP (Fig. 7).
Function: transferrin and CYP activity
Transferrin synthesized in the liver is important in maintenance of iron homeostasis. Therefore, a functional hepatocyte should show presence of transferrin.
Immunocytostaining showed diffuse staining in isolated cells cultured on TCP, whereas clear localized transferrin staining was seen within clusters of cells on OPC.
More than 50 different isoforms of cytochrome P450 enzymes have been identified in the liver. Of these, CYP3A4 is responsible for the metabolism of most xenobiotics. To produce a high level of CYP3A activity in HepaRG cultures usually requires induction with DMSO. 27 As such, HepaRG-P cells staining positive for CYP3A4 within a system where DMSO is not used, would be indicative of a functional cell, capable of metabolic enzymatic activity, not usually seen in noninduced cultures.
Immunocytostaining and qRT-PCR for CYP3A4 on day 7 showed high expression and activity in OPC compared with TCP (Fig. 9). Little to no staining was seen on TCP at day 7, whereas highly localized staining was seen on OPC at the same time point. qRT-PCR data also showed an almost 80-fold increase of CYP3A4 activity in OPC at day 7 relative to untreated control.
The hypothesis that there would be no difference between cells cultured on OPC and TCP was disproven. Cells cultured on OPC showed earlier proliferation, differentiation, and function as compared with culture on TCP. OPC could, therefore, not be used to control for the effect of surface treatment for investigation of NPS versus TCP, since NPS were also OPC treated. We, therefore, directly compared culture of HepaRG-P in the absence of DMSO on OPC and NPS.
Nanopatterned substrates
The roughness of surfaces has been shown to have varying effects on cell culture enhancing cell cultures under certain conditions while inhibiting adhesion in others.7,9 Although analysis of phenotype and function showed an unexpected progression of differentiation and maturation of cells grown on OPC, we continued to test our second hypothesis attempting to find an NPS that would further enhance adhesion, proliferation, and possibly accelerate differentiation in the absence of DMSO compared with OPC.
Mesenchymal stem cells (MSCs) grown on nanopatterned topography exhibited expression of bone-relevant markers without the use of additional chemicals or nutrients in the cell media. 9 The conclusion from this study suggested that surface patterning could direct stem/progenitor-like cells into specific lineages without the need of supplements to stimulate differentiation. Schernthaner (2012) 28 also showed evidence that the orientation of patterned surfaces resulted in morphological changes and directional cell alignment along wall-like structures. In other studies, cell migration has been directed by altering the likelihood of cell adhesion by modifying the form of a nanopattern. 29
We tested growth and differentiation of HepaRG-P cells on 21 different nanopatterned topographies to determine if lineage-specific commitment could be directed by the pattern alone. Daily microscopy for adherence and morphology showed that by d7 cells grown on DSQ120 in DMSO-free media showed increased confluency and hepatic morphology compared with any other pattern. All surfaces were OPC before nanopatterning. It might, therefore, have been expected that all patterned surfaces would be at least as good as OPC without patterning. However, interestingly, only DSQ120 appeared to affect differentiation of HepaRG-Ps, whereas other patterns had a detrimental effect to the cells. It is possible that pattern distribution/topography and cell type are codependent in affecting differentiation on surface architecture. For example, differentiation of MSCs in the absence of chemical direction occured only on DSQ50.
Morphology and polarity
Particular interest was paid to the first week of culture when we had seen mature hepatocytes emerging in DMSO-free media on OPC. Using NPS we saw increased confluency and cuboidal hepatocyte-like cells on one particular pattern, DSQ120 compared with other patterns and to TCP (Fig. 3). Cells cultured on DSQ120 showed localized membrane staining for ZO-1 as was seen using OPC, rather than diffuse staining seen on TCP. Suggesting DSQ120 induced early polarization of membranes comparable with that seen on OPC.
SOX9/HNF4α reciprocal expression
Immunostaining showed HepaRG-Ps cultured on OPC and TCP showed reciprocal expression of SOX9 and HNF4α whereby SOX9 appeared up to day 6 and HNF4α emerged around day 14. When cultured on DSQ120 showed clear but diffuse expression of HNF4α at the earlier time of day 6 compared with day 14 when cultured using OPC or TCP (Fig. 5). This suggests that cells cultured on DSQ120 mature faster than those grown on other substrates. However, the fold change in expression of qRT-PCR data was significantly higher for cells cultured on OPC than either DSQ120 when compared with TCP control (Fig. 6). The apparent difference seen between staining and qRT-PCR data may be due to the difference in gene expression versus the emergence of the functional protein.
Function: transferrin and CYP3A4 activity
Staining for transferrin and CYP3A4 on DSQ120 showed no difference to OPC, but still outperformed TCP. Similarly, qRT-PCR showed no difference between OPC and NPS, although both outperformed TCP. Again, pattern does not seem to play a role in function when compared with oxygen plasma alone, but oxygen plasma significantly outperforms TCP (Fig. 9).
Viability: total ATP and metabolic function
Total ATP and PrestoBlue assays, of cells cultured on DSQ120, revealed a similar trend to that seen for HepaRG-P's cultured on OPC. ATP was significantly higher on DSQ120 than TCP, but not different from OPC. PrestoBlue data still showed no statistical difference between any condition, but both DSQ120 and OPC showed higher viability than TCP. This suggests that pattern does not play a role in viability, but oxygen plasma significantly increases viability and metabolic competence of cells in culture.
Conclusion
In this study, we have shown that the crucial factor that improved early differentiation and function of the HepaRG-P cells in the absence of DMSO was oxygen plasma treatment compared with traditional culture methods. DSQ120 nanopatterning of plates promoted differentiation and function comparable with unpatterned OPC plates and was, therefore, better than TCP. The other nanopatterned substrates studied were inferior in terms of inducing a functional phenotype. It is, therefore, likely that the beneficial effect seen using the nanopattern substrate was primarily due to oxygen treatment. It is possible that the DSQ120 substrate could upregulate specific metabolic enzymes or pathways not investigated in our model compared with OPC and further research could be done to investigate how long cells would remain differentiated in the absence of DMSO and what effect the polymer may have had on the cell culture.
Oxygen plasma treatment of surfaces is relatively inexpensive and could substantially reduce the time and costs of differentiating progenitor cells on traditional culture systems, producing early differentiation and functionality of HepaRG-P cells and removing the requirement for chemical induction that may have downstream effects.
Footnotes
Authors' Contribution
Katie Morgan was in charge of writing of the article, data curation, formal analysis, investigation, methodology, and project administration; Anna Bryans did contribution to the article, data curation, formal analysis, investigation, and methodology; Filip Brzeszczynski also did editing of the article, data curation, formal analysis, investigation, and methodology; Kay Samuel did editing of the article, formal analysis, and methodology; Philipp Treskes and Steve Morley did editing of the article, methodology, and funding acquisition; Joanna Brzeszczynska did editing of the article, methodology, data curation, supervision, and formal analysis; Peter Hayes did funding acquisition and supervision; Nikolaj Gadegaard was responsible for conceptualization, funding acquisition, editing of the article, methodology, formal analysis, project administration, and supervision; Leonard J. Nelson was in charge of conceptualization, funding acquisition, methodology, formal analysis, project administration, and supervision; John Plevris did funding acquisition, editing of the article, formal analysis, and supervision.
Disclosure Statement
All authors declare no conflict of interest.
Funding Information
The Hepatology Laboratory was supported by the BBSRC (BB/L023687/1) during the period of this research.
References
Supplementary Material
Please find the following supplemental material available below.
For Open Access articles published under a Creative Commons License, all supplemental material carries the same license as the article it is associated with.
For non-Open Access articles published, all supplemental material carries a non-exclusive license, and permission requests for re-use of supplemental material or any part of supplemental material shall be sent directly to the copyright owner as specified in the copyright notice associated with the article.