




Abstract
Gap closure is a dynamic process in wound healing, in which a wound contracts and a provisional matrix is laid down, to restore structural integrity to injured tissues. The efficiency of wound closure has been found to depend on the shape of a wound, and this shape dependence has been echoed in various in vitro studies. While wound shape itself appears to contribute to this effect, it remains unclear whether the alignment of the surrounding extracellular matrix (ECM) may also contribute. In this study, we investigate the role both wound curvature and ECM alignment have on gap closure in a 3D culture model of fibrous tissue. Using microfabricated flexible micropillars positioned in rectangular and octagonal arrangements, seeded 3T3 fibroblasts embedded in a collagen matrix formed microtissues with different ECM alignments. Wounding these microtissues with a microsurgical knife resulted in wounds with different shapes and curvatures that closed at different rates. Observing different regions around the wounds, we noted local wound curvature did not impact the rate of production of provisional fibronectin matrix assembled by the fibroblasts. Instead, the rate of provisional matrix assembly was lowest emerging from regions of high fibronectin alignment and highest in the areas of low matrix alignment. Our data suggest that the underlying ECM structure affects the shape of the wound as well as the ability of fibroblasts to build provisional matrix, an important step in the process of tissue closure and restoration of tissue architecture. The study highlights an important interplay between ECM alignment, wound shape, and tissue healing that has not been previously recognized and may inform approaches to engineer tissues.
Impact statement
Current models of tissue growth have identified a role for curvature in driving provisional matrix assembly. However, most tissue repair occurs in fibrous tissues with different levels of extracellular matrix (ECM) alignment. Here, we show how this underlying ECM alignment may affect the ability of fibroblasts to build new provisional matrix, with implications for in vivo wound healing and providing insight for engineering of new tissues.
Introduction
The assembly of provisional matrix is a critical step in wound closure and the formation of tissue de novo. During the repair of full-thickness wounds, fibroblasts first migrate into the wound area and deposit extracellular matrix (ECM) proteins such as fibronectin. These proteins serve as a template for other cell types, including endothelial cells and immune cells to migrate on.1–4 Later, epithelial cells use this provisional matrix or granulation tissue as a substrate to migrate over and cover the wound bed to complete closure.5–7
While it has been reported that insufficient or delayed formation of granulation tissue can lead to impaired gap closure and delayed reepithelialization,7,8 the factors that drive the rate of granulation tissue formation remain elusive. Understanding how to modulate this rate of tissue assembly is not only important in the context of wound healing but also in the biomanufacturing of engineered tissues.
In clinical settings, wound closure rates correlate with the shape of a wound, an observation that has been echoed in several studies of reepithelization.9–11 For example, in epithelial monolayers, prepatterned gaps with concave shapes close faster compared to those with convex shapes.12,13 The increased rate of closure in regions of high curvature stems from the emergence of contractile actomyosin rings spanning multiple epithelial cells that pull the wound margins closer.14–16
Curvature has also been suggested to control new matrix formation by fibroblasts, which lack these multicellular contractile rings, in models of tissue growth into pores.17–19 More recently, it has been shown that minimization of surface tension developed by cell contractility drives the kinetics of curvature-mediated tissue growth. 20 A similar mechanism has been proposed to explain wound closure in collagenous microtissues, wherein minimization of surface stresses emerging from contractile cells that are adherent to fibronectin matrix at the surface of the microtissue drive the flow of cells and fibronectin in the gap. 21
While curvature of the wound edge has been associated with wound closure rates, wound shape and healing rate are also dependent on the local organization of the underlying ECM. For example, in surgical settings, incisions made across the natural orientation of collagen fibers in the dermis results in wide open gaps that heal poorly, whereas by cutting along the direction of natural ECM alignment, incisions gape less, leading to faster healing and less scarring.10,22 Although the mechanism underlying this clinical practice is not well understood, there is a clear evidence that ECM alignment guides migratory and contractile processes of fibroblasts that are crucial for wound closure.23–26 However, how this ECM alignment and curvature affect the assembly of new tissue, such as granulation tissue or the generation of new tissue, remains to be explored.
To study how curvature and ECM alignment may influence tissue closure by fibroblasts, we use a previously established model of 3D stromal gap closure, wherein fibroblasts in engineered collagen-based microtissues 27 are injured and then assemble a provisional fibronectin template to close the gap. Here, we use an approach to change the shape of the microtissues, to either rectangular or octagonal, to affect the alignment of the ECM,28,29 and show that ECM alignment may locally act as a negative regulator of provisional matrix assembly and thus modulating the rate of new tissue formation.
Materials and Methods
Cell preparation and culture
NIH 3T3 cells (ATCC) were maintained in high glucose DMEM (Corning) containing 10% Bovine Serum and 1% Penicillin Streptomycin solution (Gibco). Cells were used between passages 5 and 15.
Microtissue seeding
Rectangular and octagonal microtissues were prepared as previously described.28,30 In brief, polydimethylsiloxane microfabricated tissue gauges (μTUGs) were prepared by molding from SU-8 masters.28,30 μTUG devices were UV sterilized, then treated with 0.02% Pluronic F127 (Sigma) for 15 min to prevent cell and extracellular attachments. 3T3 cells were dissociated from cell culture plates, suspended in a 2 mg/mL Collagen I, Rat Tail (Corning) hydrogel solution at a concentration of 1 million/mL, and maintained on ice to prevent polymerization. Cell suspensions were centrifuged at −9°C into devices, and excess was removed before polymerization at 37°C for 10 min. Microtissues were maintained in high-glucose DMEM containing 10% bovine serum and 1% penicillin streptomycin solution.
To visualize collagen matrix of microtissues, 5% (w/w) Alexa Fluor 555 conjugated Collagen I (Thermo Fisher) was added to the cell suspension before device seeding. To visualize fibronectin matrix within microtissues, 8 μg/mL of Alexa Fluor 488 (Thermo Fisher) conjugated human fibronectin (isolated from human plasma) was added to media during the first 24 h of tissue formation.
Twenty-four hours after devices were seeded, a diamond dissecting knife (type MDL, Electron Microscopy Systems, #72029) mounted on a XYZ micromanipulator (SLC-2040, SmarAct GmbH) was used to create full-thickness incisions in the centers of the microtissues by making cuts layer-by-layer at increasing depths using a microscope for visual feedback. Incisions were oriented from top to bottom. The ranges for incision length were 14–30% for rectangles and 17–34% for octagons as a percent of the total length of the tissue along the incision orientation.
Time-lapse microscopy and closure rate measurements
For wide-field time-lapse imaging, phase contrast and fluorescent images were captured every 30 min for over 16–20 h. Tissues were exposed every 30 min to a 33–50 ms exposure for brightfield, and a 150–300 ms exposure in the fluorescent channels. They were recorded with a Photometrics Evolve 16-bit electron-multiplying CCD camera (Photometrics) and an A-Plan 10 × objective mounted on a Nikon Ti Eclipse (Nikon Instruments, Inc.) microscope maintained at 37°C at 5% CO2.
Phase contrast images were used to measure gap area every 2 h over the indicated time, and closure rates were calculated using the slope from a Least Squares Regression Line that was fitted through the data for each individual tissue. The data were truncated if closure completed before the indicated time, or if the tissue ruptured or tore. Ellipsoidal shapes were fitted to the wound boundaries in ImageJ. The major and minor axes of these ellipses were used to parametrize the wounds' shapes, and the ellipses were also used for calculations of the wounds' curvature and eccentricity.
Confocal microscopy
To visualize ECM, microtissues with Alexa 555-tagged collagen and Alexa 488 fibronectin were imaged on a Leica SP8 confocal microscope with a Leica 40 × water objective and Leica LAS X imaging software. For fiber analysis, z stacks of microtissues with Alexa 488-tagged fibronectin were imaged on a Yokogawa CSU-21-Zeiss Axiovert 200M inverted spinning-disk microscope with a Zeiss 40 × water objective and Evolve EMCCD camera (Photometrics). ImageJ and the Pairwise Stitching plugin 31 were used to stitch images together and then maximum projections were used for analysis.
Fiber analysis
Analysis of fibronectin fibers was performed using an established MATLAB code 28 based on the FibrilTool method 32 to measure fiber orientation and anisotropy. In brief, first, a Gaussian blur function was applied to images to reduce pixelation effects, then for every pixel in selected region, the local pixel intensity gradient was used to determine a perpendicular normalized vector and then this was used to calculate the local nematic tensor for each pixel.
The region was then subdivided into 5 pixel × 5 pixel squares and the average nematic tensor for each subregion was calculated. The largest eigenvector corresponding to the largest eigenvalue (λ1) of this average describes the alignment direction, and the difference of the two eigenvalues (q = λ1 – λ2) defined the anisotropy of each region. These were then averaged for each 30 × 30 μm2 regions tangent to the top and side edge of the bulk tissue adjacent to the wound edge.
Computational model
Computational modeling was performed using FEniCS,33,34 an open source finite element analysis computing platform. The microtissue was approximated as a random fiber network, where fibers represent ECM fibers. The random fiber network finite element mesh was initialized with the Gmsh mesh generator. 35 Each domain contained ∼1100–1400 fibers of length 100 μm with initial fiber angle sampled from a uniform distribution.
In the rectangular geometry, a 10 μm by 300 μm rectangular wound was initialized in the center of the domain. In the octagonal geometry, a 10 μm by 150 μm rectangular wound was initialized in the center of the domain. In both domains, the micropillar attachment sites were simulated as Dirichlet boundary conditions. The microtissue fibers were approximated as a homogeneously contracting Neo-Hookean material where homogeneous volumetric contraction was applied up to a dimensionless shrinkage of 0.6 following the standard multiplicative decomposition model for biological tissue growth (and shrinkage). 36
Geometry set up and subsequent simulation analysis and plotting were performed with Python, 37 Numpy, 38 and Matplotlib. 39 Further details of the model are included in the Supplementary Data under Description of Fiber Model. For postprocessing, anisotropy was computed directly from the deformed geometry of the finite element mesh 32 using 50 μm square ROIs adjacent to the wound edge. To account for the effect of different random fiber distributions, one hundred simulations were performed and analyzed for each geometry.
Statistical analyses
Two-tailed Student's t-tests were used for all statistical analyses. For statistical comparisons within the same tissue, a paired t-test was used, while between different tissues, an unpaired t-test was used. Significant values are indicated as *p ≤ 0.05, **p ≤ 0.01, ***p ≤ 0.001.
Results
Closure of elliptical gaps in fibrous microtissues
To investigate fibrous tissue closure in highly aligned matrices, we generated microtissues composed of NIH 3T3 fibroblasts in a collagen type I matrix formed around flexible polydimethylsiloxane (PDMS) pillars that were spaced in a rectangular pattern with a 4 to 1 aspect ratio 28 (Fig. 1a). After the tissue was compacted around the pillars (18–24 h after seeding), an incision was cut in the center of the tissue using a microdissection knife. Upon injury, the incision opened to form an elliptical shaped gap (Fig. 1b, left). Over the next 20 h, this gap spontaneously closed in a linear manner (Fig. 1b, c) with a constant rate of change in gap area of -627 ± 34 μm2/h (mean ± SEM) (Fig. 1c and Supplementary Video S1) and had a slight increase in eccentricity between the start and 10 h into healing from 0.958 ± 0.003 to 0.968 ± 0.003 (mean ± SEM, p = 3.0 × 10⁻⁴, Fig. 1d).

Closure of elliptical gaps in fibrous microtissues.
To investigate how the elongated shape of the tissue and elliptical gap affect the dynamics of tissue closure, we measured the change in length of the major and minor axes of the gap over time and calculated their rates of change. We found that closure rate of the major axis was 9.3 ± 0.7 μm/h (mean ± SEM), 3.4 × faster than the closure rate of the minor axis (2.7 ± 0.1 μm/h, mean ± SEM, p = 1.1 × 10⁻¹², Fig. 1e, f). These data suggest that tissues' geometric boundary conditions dictate the gap closure process, with significantly faster closure rates along the major axis.
Assembly of fibronectin template occurs primarily along the major axis and is not correlated with the curvature of the wound edge
As previously described in Selman Sakar et al,27 gap closure in this model system is driven by two mechanisms: contractility-dependent compaction and the building of new provisional fibronectin matrix that fills the gap (Fig. 2a). To visualize these two processes, fluorescently labeled collagen and fibronectin were added during tissue formation and imaged hourly throughout the healing process. At high magnification (40 × ), fluorescently labeled collagen and fibronectin were seen in the bulk tissue. Fibronectin populated with cells was also observed within the gap, showing the provisional matrix assembled by cells during closure (Fig. 2b, top).

Assembly of fibronectin template occurs primarily along the major axis and is not correlated with the curvature of the wound edge.
Since the field of view was limited at high magnification, we explored whether the provisional matrix could be visualized at lower magnification (10 × ) to enable quantification of compaction and provisional matrix assembly using images that show the tissue in a larger field of view. At this magnification, the fluorescent signal from fibronectin and collagen in the bulk tissue overlapped, but the faint fibronectin signal from the provisional matrix was not detectable (Fig. 2b, bottom). Due to this limitation, we used brightfield images as a proxy for total closure instead, and subtracted these images from the fluorescent images showing the bulk tissue.
At this magnification, the area of new provisional matrix deposition was identified as new material visible by phase but not detectable in the fluorescent imaging (Fig. 2c). Thus, the boundaries for these regions could be calculated (Fig. 2c, yellow dotted line bounding the fluorescently tagged collagen; green region showing area of new provisional matrix). Using this method, we tracked compaction of the original tissue boundary and new provisional matrix over time (Fig. 2d, e). Given the differences in major and minor axis closure rates previously observed, we also compared the rates of compaction and new matrix assembly specifically in these regions (Fig. 2f).
The total axis closure rate was significantly different between the major and minor axes, 19.1 ± 1.0 μm/h and 4.1 ± 0.2 μm/h, respectively (mean ± SEM, p = 1.2 × 10⁻⁷). We note these rates are higher than in Figure 1f, we believe that this may be a result of the addition of the tagged fibronectin during the formation process. Separating the contributions from compaction and fibronectin matrix growth, we observed that while compaction between both axes was not significantly different (Major: 4.2 ± 0.9 μm/h, Minor: 2.6 ± 0.2 μm/h, mean ± SEM, p = 0.074), fibronectin matrix growth was higher in the major axis compared to the minor axis (Major: 14.9 ± 0.9 μm/h, Minor: 1.6 ± 0.2 μm/h, mean ± SEM, p = 2.5 × 10⁻⁷).
These data suggest that the difference seen in total closure was due to regional differences in provisional matrix, rather than compaction of the tissue. Therefore, moving forward, we focused on understanding the drivers for differential growth of the fibronectin matrix in our model system.
As studies have highlighted the role of curvature on the rate of provisional matrix growth,17–20 we investigated if curvature could be used to explain the rates found in this model. Since the point of maximum curvature occurs where the major axis crosses the wound edge, we analyzed the curvature and the provisional matrix growth over time in this region, heretofore referred to as “Top” (Fig. 2g).
Over the course of closure, curvature increased at a rate of 0.29 μm−1h−1 (from Least Squares Regression Line: y = 0.029x + 0.05, R2 = 0.98), while the rate of provisional matrix growth from the point of maximum curvature remained constant. Given this weak correlation between curvature and provisional fibronectin matrix growth, we set out to investigate other parameters that may explain the axial difference in assembly of the provisional fibronectin matrix in this model of tissue closure.
Local fibronectin alignment at gap edge correlates with the assembly of fibronectin provisional matrix
Given that fibroblast–fibronectin interactions are critical for closure in this model system, 27 we tested whether ECM alignment is correlated with the deposition of provisional matrix in the gap area. Using a MATLAB code developed based on the FibrilTool algorithm,28,32 we measured fiber orientation and anisotropy (degree of alignment), in the Top region and the region where the minor axis crosses the wound edge (heretofore referred to as the “Side” of the wound). Due to artifacts from excess tissue material from the incision (Fig. 3a, white arrowhead), only the top edge and one side of the gap were analyzed. For both regions, 0° is defined as the tangent line to the wound edge for the angle of orientation measurements.

Local fibronectin alignment at gap edge correlates with the assembly of fibronectin provisional matrix.
Fibronectin fibers were oriented parallel to the wound edge in the side regions, whereas fibronectin fibers in the top regions were oriented perpendicular to the wound edge (Fig. 3b). The anisotropy of the fibrous matrix was significantly (p = 0.036) lower in the top regions (0.19 ± 0.02, mean ± SEM) compared to the side regions (0.26 ± 0.05, mean ± SEM, Fig. 3c). Together, these data demonstrate that fibronectin fibers are more aligned at the side edge of the wound compared to the top edge.
To understand how fiber alignment and orientation are fundamentally linked to the tissue shape, we built a computational model of ECM fibers using the Finite Element Method 36 (Supplementary Figs. S1 and S2). In the stress-free reference configuration, we initialize randomly oriented ECM fibers. Then, we applied homogeneous contraction to simulate how cells enact mechanical forces onto ECM and observed how ECM fiber alignment emerged in the deformed configuration due to the interaction between tissue contraction, tissue geometry, and boundary conditions.
A similar fiber analysis as described above for the microtissues was performed for 100 simulations of the model. Confirming our experimental findings, the simulations showed an increased fiber anisotropy at the side of the gap compared to the top (Anisotropy: Top: 0.46 ± 0.01, Side: 0.55 ± 0.01, mean ± SEM, p = 3.3 × 10⁻⁷, Fig. 3e, f). Not only do these findings validate the computational model but they also suggest that contractility is sufficient to model ECM alignment in our system.
To determine the relationship between fiber anisotropy and provisional matrix growth, we plotted provisional matrix length at 10 h as a proxy for provisional matrix growth (derived from experimental data, Fig. 2d) and local tissue anisotropy (from computational model) as a function of angle around the gap (Fig. 3g). Interestingly, regions with lower fiber anisotropy showed more provisional matrix growth compared to regions with high-fiber anisotropy, therefore, suggesting that provisional matrix assembly in the gap is inversely correlated to how aligned the ECM of the adjacent tissue is.
Octagonal tissues with reduced matrix alignment exhibit greater and more uniform fibronectin growth around the gap
To elaborate further the hypothesis that ECM anisotropy affects provisional matrix assembly, we investigated wound closure in octagonal microtissues which have an isotropic fiber alignment 28 (Fig. 4a). Upon incision, the gap opened up in a more circular shape compared to the highly elliptical shape in the rectangular tissues (Fig. 4b), and closed spontaneously (Fig. 4c and Supplementary Video S2). As with the rectangular tissues, we measured the closure rates of the gap axes over time (Fig. 4d). Having established a wound closure model in isotropic microtissues, we investigated the contribution of compaction and provisional matrix assembly along the horizontal and vertical axes.
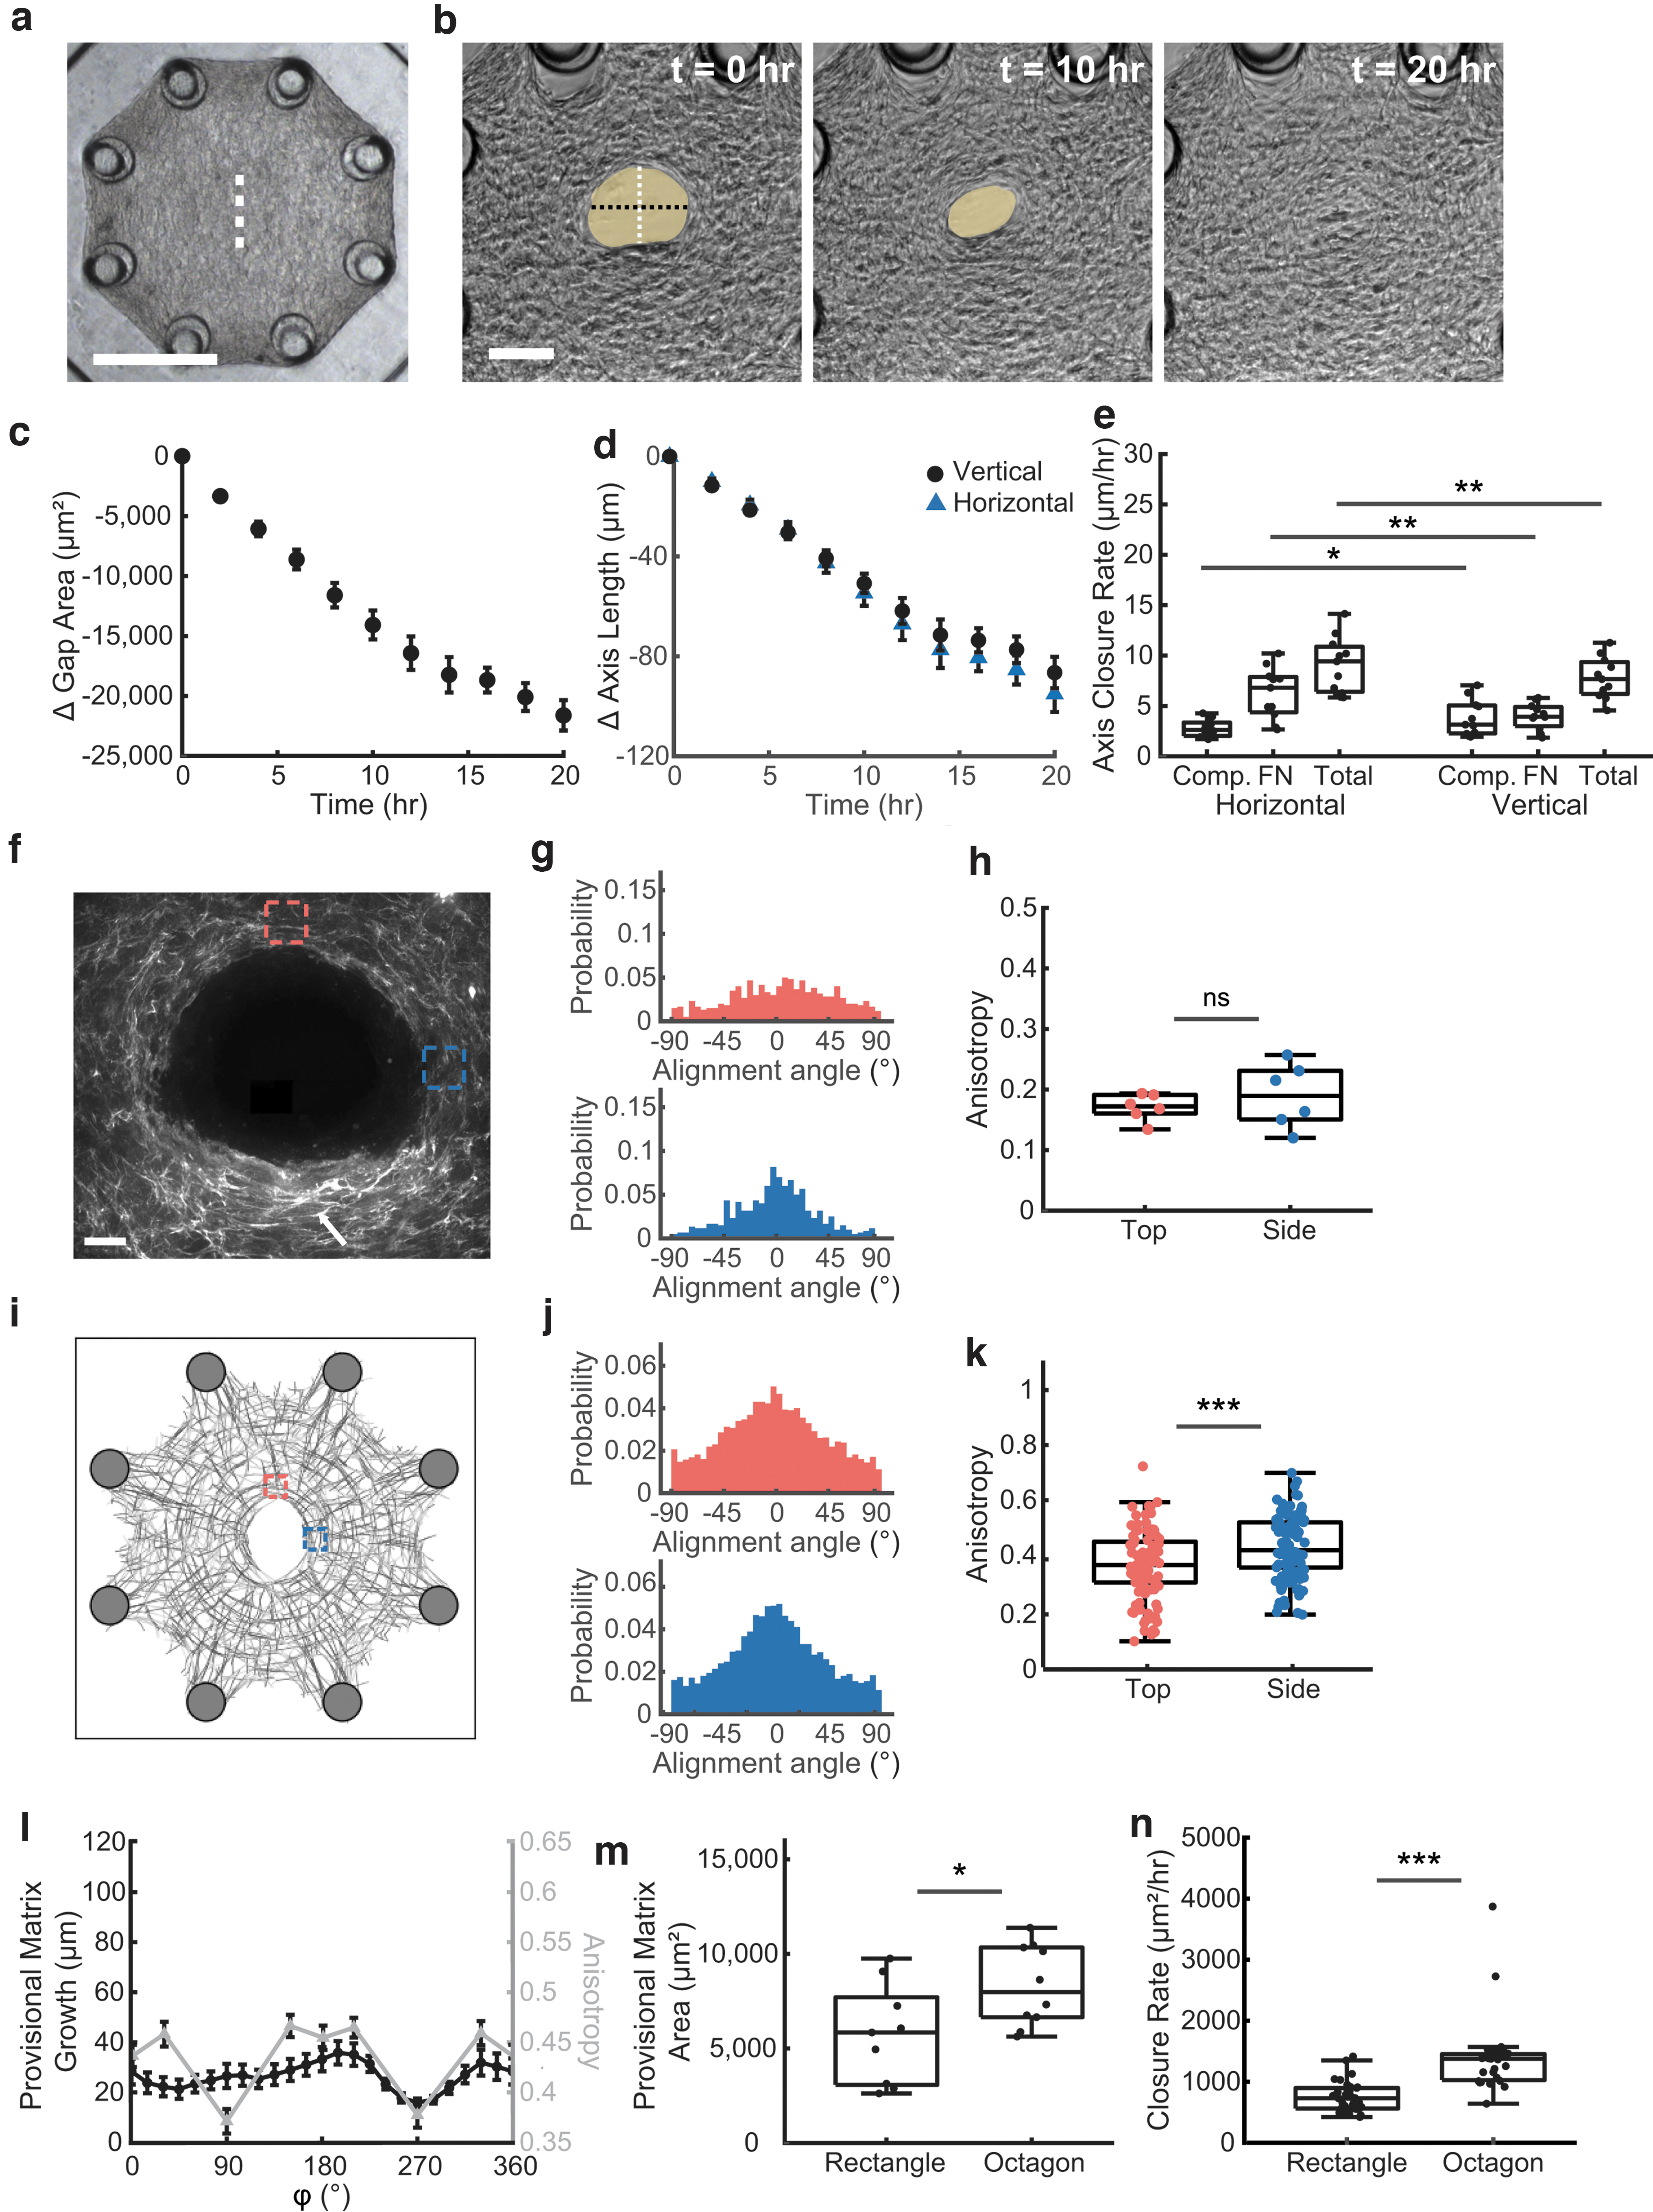
Octagonal tissues with reduced matrix alignment exhibit greater and more uniform fibronectin growth around the gap.
In contrast to the rectangular microtissues, the horizontal axis closed slightly faster than the vertical axis, 9.1 ± 0.9 and 7.8 ± 0.6 μm/h, respectively (mean ± SEM, p = 4.9 × 10⁻³, Fig. 3e). Both compaction and provisional fibronectin matrix growth were significantly different between both axes, but overall, the differences were much subtler than in the rectangular tissues (Compaction: Horizontal: 2.8 ± 0.3 μm/h, Vertical: 3.8 ± 0.6 μm/h, mean ± SEM, p = 0.042, Fibronectin: Horizontal: 6.3 ± 0.8 μm/h, Vertical: 4.0 ± 0.4 μm/h, mean ± SEM, p = 2.3 × 10⁻³). These differences are caused by the cutting direction, because our method of cutting resulted in accumulation of tissue at the end of the incision compared to the edges and the linear nature of the incision and how it opens both introduced anisotropy into the system.
As anticipated, the orientation of the fibronectin fibers and anisotropy was not as different when comparing the top and side edges of wounds (Fig. 4f–h). Although initially oriented isotropically, 28 fibronectin fibers tend to align parallel to the wound edge after injury (Fig. 4g) with similar anisotropy values for top (0.17 ± 0.01, mean ± SEM) and side regions (0.19 ± 0.02, mean ± SEM, p = 0.27, Fig. 4h).
The rearrangement of fibers at the wound edge was also captured by the computational model (Fig. 4i) with the top and sides having similar fiber orientations both parallel to the wound edge (Fig. 4j). In contrast to the experimental model, the computational model predicted a slightly different fiber anisotropy between the top and side regions, 0.37 ± 0.01 and 0.42 ± 0.01, respectively (mean ± SEM, p = 5.0 × 10⁻⁵, Fig. 4k). However, these anisotropies were both lower than the Side region of the rectangular tissues (Top of octagon to side of rectangle: p = 1.6 × 10⁻²⁰, Side of octagon to side of rectangle: p = 5.3 × 10⁻¹¹).
To investigate if local ECM anisotropy was also inversely correlated with provisional matrix assembly in octagonal microtissues, provisional matrix length for tissues 10 h into healing was plotted vs position around the wound along with fibronectin anisotropy from the model (Fig. 4l). Unlike rectangular tissues where the length of the provisional template spiked adjacent to regions with low anisotropy, the length of the provisional matrix in octagonal microtissues was more uniform around the gap, with only a drop at 270° corresponding to the bottom of the incision where excess ECM from the incision was present.
Given that the assembly of a fibronectin template occurred uniformly around the gap in octagonal tissues and predominately along the long axis in rectangular tissues, we hypothesized that gap closure depends on the overall tissue geometry. Indeed, in a side-by-side comparison, wounds in octagonal tissues showed higher total area of provisional matrix at 10 h into the healing, 8330 ± 710 μm2 versus 5730 ± 926 μm2 (mean ± SEM, p = 0.029, Fig. 4m). To compare closure rates, we used the closure rate for the first 10 h, since after this time point closure slowed down in octagon tissues (Fig. 4c). Octagons (1400 ± 120 μm2/h) had almost double the closure rate of rectangles (750 ± 49 μm2/h, mean ± SEM, p = 1.5 × 10⁻⁷, Fig. 4n).
While confounding factors such as mechanical constraints and surface tension could be contributing, these data suggest that the lower alignment found in the octagonal tissues is associated with more provisional matrix assembly and overall faster healing rates compared to the rectangular tissues, where highly aligned edges may have impaired the assembly of new provisional matrix.
Discussion
Clinical observations and early studies in rabbit models have shown that wound shape is a critical determinant for closure.9–11,22 To understand how wound shape affects the cellular and mechanical mechanisms underlying tissue repair, bioengineered in vitro models have been developed wherein gaps with different shapes are patterned in epithelial monolayers using stamping techniques12,13 or cut with laser light. 40 Recently, 3D scaffolds were used to study tissue growth under tension 20 and fabricated microcontainers with different shapes have been used to study gap closure in 3D. 41
While these methods directly control gap geometry, our model system controls wound shape by changing the overall tissue geometry. Thus, similar to cuts in patients, the shape of the gap in our model system depends on the prestress of the tissue matrix, which enables studies of the effects of tissue properties surrounding the wound on gap closure in vitro.
Another unique feature of this biomimetic in vitro wound healing model is that closure is strongly dependent on the assembly of a provisional fibronectin template. 27 Assembly of provisional fibronectin matrices has also been described in pore filling models.17,18 In pores with different geometries, fibroblasts first assemble provisional matrix to make gaps circular before proceeding to fill the gap uniformly. This observation has led to the idea that minimizing surface tension, and as such minimizing curvature, drives the growth of fibronectin matrices in pores with different geometries.17,20,42
While minimizing surface tension has also been suggested to drive gap closure in fibrous microtissues, 21 our study shows that during healing, the eccentricity of the gaps and fibronectin tissue growth in rectangular microtissues remains relatively constant whereas curvature increases. Thus, our data suggest that other factors, such as ECM alignment, may add an additional layer of regulation to provisional matrix assembly and gap closure.
While this study reveals a correlation between ECM alignment and provisional matrix growth in gap closure, the impaired provisional matrix growth along the highly aligned edges of rectangular microtissues could be explained by multiple causes. ECM fibers can provide topological cues to direct cell migration along the aligned fibers,25,26,43–45 therefore hindering cells from moving into the gap. Conversely, cells can migrate randomly in less aligned ECMs, as observed in the top region of gaps in rectangular microtissues and in octagonal microtissues, which may facilitate movement into the gap.
Alternatively, matrix alignment is inherently linked to augmented tissue stress that is transmitted through the ECM.46–48 These stresses have been shown to alter the conformation and state of individual fibronectin fibers. 49 While stretch is required for fibrillogenesis, highly stretched fibronectin shows reduced colocalization to other ECM molecules such as collagen type I, 50 which may hamper assembly and ingrowth of a provisional matrix. Given the intricate relationships between ECM alignment, contractility, and tissue stress, parsing out the contribution of each factor separately will be a challenging task. Nevertheless, such mechanistic studies are needed to understand how increased ECM alignment affects the assembly of a provisional matrix in wounds.
Computational models are powerful tools to parse out the effect of multiple factors on wound closure. In this study, we used a mechanical fiber model to gain insight in how contractility of the ECM affects ECM alignment after injury. The model predicted the opening of the wound as well as the fiber rearrangement at the wound margin. Interestingly, the model also predicted slightly different anisotropy values for side versus top regions in both rectangular and octagonal tissues, a finding that was not confirmed experimentally in the case of the octagonal tissues. This was predicted in the model because an anisotropic wound was initialized.
We note that in our computational model, the gaping of the wound does differ from the experimental findings. This is due to limitations in the model which does not consider crosslinking, breaking, and reforming of ECM fibers. Therefore, unlike the experimental model system, the computational model does not account for stress relaxation caused by tissue remodeling and viscoelastic properties of the collagen gel. We anticipate that this simplification is the major source of inconsistency between the computational model and experiments. However, there were some differences in overall healing and the contribution of compaction and provisional matrix assembly between the two axes of octagonal tissues.
Given the overall symmetry of octagonal microtissues, such differences, although modest, were unexpected. We speculate that asymmetry in the closure may be associated with the mode of injury. In our experiments, an incision from top to bottom was made with a microdissection knife, and in this process, ruptured tissue accumulated at the bottom side of the tissue may have affected the closure process.
Conclusion
Using a bioengineered model system, we present here a novel in vitro approach to investigate the role of ECM alignment on wound shape and provisional matrix assembly. Our study suggests that ECM alignment can limit the assembly of a provisional template. Harnessing this principle of tissue growth may one day suggest treatments to disrupt local ECM alignment in situ as a mechanism to improve healing of highly aligned tissues such as tendons and ligaments, or inform new strategies to direct ECM assembly in tissue engineering applications.
Footnotes
Acknowledgments
We thank Prof. Michael Smith and Dr. Tommaso Ristori for their input and technical expertise. We thank Amy Zhong and Lori Luo for helping with device fabrication. We also thank Megan Griebel and Connie Chan for contributions that did not end up in the final work.
Disclosure Statement
The authors declare no competing financial interests.
Funding Information
S.L.D. acknowledges funding from the National Science Foundation Graduate Research Fellowship.
(1122374). This work was supported by NIBIB (R21 EB028491) and NSF Grants CMMI-1463011 at JHU and CMMI-1462710 at BU.

References
Supplementary Material
Please find the following supplemental material available below.
For Open Access articles published under a Creative Commons License, all supplemental material carries the same license as the article it is associated with.
For non-Open Access articles published, all supplemental material carries a non-exclusive license, and permission requests for re-use of supplemental material or any part of supplemental material shall be sent directly to the copyright owner as specified in the copyright notice associated with the article.
