




Abstract
Cellular microenvironments provide stimuli, including paracrine and autocrine growth factors and physicochemical cues, which support efficient in vivo cell production unmatched by current in vitro biomanufacturing platforms. While three-dimensional (3D) culture systems aim to recapitulate niche architecture and function of the target tissue/organ, they are limited in accessing spatiotemporal information to evaluate and optimize in situ cell/tissue process development. Herein, a mathematical modeling framework is parameterized by single-cell phenotypic imaging and multiplexed biochemical assays to simulate the nonuniform tissue distribution of nutrients/metabolites and growth factors in cell niche environments. This model is applied to a bone marrow mimicry 3D perfusion bioreactor containing dense stromal and hematopoietic tissue with limited red blood cell (RBC) egress. The model characterized an imbalance between endogenous cytokine production and nutrient starvation within the microenvironmental niches and recommended increased cell inoculum density and enhanced medium exchange, guiding the development of a miniaturized prototype bioreactor. The second-generation prototype improved the distribution of nutrients and growth factors and supported a 50-fold increase in RBC production efficiency. This image-informed bioprocess modeling framework leverages spatiotemporal niche information to enhance biochemical factor utilization and improve cell manufacturing in 3D systems.
Impact statement
Three-dimensional (3D) culture systems are becoming increasingly important because they recapitulate the architecture and, consequently, physiological function of the target tissue/organ. Design and optimization of these 3D biomanufacturing platforms require evaluation of in situ spatiotemporal information. We have developed an integrated experimental–computational framework that captures the spatiotemporal distribution of cells, nutrients, and cytokines within a marrow biomimicry perfusion bioreactor. The model simulated biochemical factor utilization and guided the design of an improved second-generation bioreactor that achieved 50-fold increase in RBC production with improved cost efficiency. Such a modeling framework provides an essential platform for the optimization of 3D biomanufacturing systems.
Introduction
Cell biomanufacturing of complex tissues/organs faces several challenges that limit clinical translation, including those of patterning into functional human tissue and high associated costs. 1 Current two-dimensional (2D) cell culture systems are inefficient, achieving low cell densities (100–1000-fold less than physiological), requiring high cytokine concentrations (10–1000-fold higher than physiological), and supporting limited cell–cell interactions. 2 While three-dimensional (3D) culture platforms have improved on many of the limitations of 2D systems through the use of biomimetic scaffolds, they still require optimization of the dynamic provision/removal of cytokines, nutrients, and metabolites.3–5 In contrast, cell proliferation in vivo is an efficient multiscale spatiotemporal process supported locally by niche-generated growth factors and regionally by transport of oxygen, nutrients, endocrine factors, and metabolites.6,7 An in vitro recapitulation of supportive in vivo niche microenvironments would require strategies to monitor tissue formation in situ and optimize these otherwise inaccessible 3D culture systems. Mathematical model-based monitoring8,9 and optimization10–12 of cell biomanufacturing platforms can investigate how culture parameters influence the final cellular product, including scaffold material and porosity, inoculated cell type and distribution, and medium composition and perfusion.13–18 However, these models have not yet leveraged quantitative single-cell 3D microscopy, an essential technique in capturing the formation of supportive niche microenvironments in vivo,19–23 to enhance 3D cell biomanufacturing.
The process of blood production, hematopoiesis, has been harnessed for use in cell therapy biomanufacturing strategies to generate hematopoietic stem and progenitor cells (HSPCs), chimeric antigen receptor T cells, natural killer cells, platelets, and red blood cells (RBCs).24,25 However, current methods for blood cell biomanufacturing utilize liquid suspension cultures that do not replicate the physiological and efficient microenvironment of hematopoiesis within the bone marrow (BM).26–28 Specifically, the process of hematopoietic tissue patterning in the BM is organized by niches, small locales where HSPCs are maintained and differentiate in close proximity with other neighboring hematopoietic and stromal cell types,29,30 which release paracrine growth factors locally.31–33 Niches are positioned at unique distances from vasculature, where nutrients and growth factors are delivered and metabolites and mature blood cells exit.34,35 These local (100s μm) and regional (1000s μm) positions, components, and structure of BM niches are not replicated in current 2D culture platforms.21,36 The efficiency of in vivo RBC production (1013 RBCs/mL·day), one of the major outputs of the BM, remains unmatched by current 2D and 3D culture platforms (103 and 105 RBCs/mL·day, respectively). These systems are hindered from being clinically translated due to the excessive cost of cytokine-enriched medium and the high number of RBCs needed for a manufactured unit of blood (2 × 10¹²).
Herein, we address such limitations by developing a computational modeling framework to visualize the in situ formation and function of cell-cytokine microenvironments to inform the design and operating requirements for the intensification of 3D biomanufacturing processes for enhanced cell production (Fig. 1). To demonstrate the utility of the model, we applied it on a previously developed 3D hollow fiber bioreactor (BR1) that produces RBCs from umbilical cord blood mononuclear cells (CBMNCs) by mimicking several aspects of the BM.37,38 Specifically, BR1 comprises a collagen-coated and CBMNC-inoculated polyurethane sponge surrounding four ceramic hollow fibers which allow for a continuous egress of mature blood components. This BR1 was perfused with serum-free medium and 10–100-fold lower concentrations of growth factors than traditional culture systems. Over 4 weeks of culture, BR1 attained tissue-like cell densities (≥2 × 10⁹ cells/mL) that comprised 21 hematopoietic and stromal cells, which endogenously secreted 16 growth factors. 37 In this work, we aim to further characterize and leverage this supportive hematopoietic environment for high-efficiency cell biomanufacturing through the creation of a bioreactor design model, which predicts bioreactor nutrient and growth factor distribution. While traditional Kroghian models of biochemical factor distributions do not account for the microenvironmental niche growth and support within the BR1, 11 our spatiotemporal model identifies the balance between retaining required endogenously produced growth factors and removal of harmful metabolites and/or cellular harvest. In doing so, we highlight critical design and operational bottlenecks of 3D bioreactor systems (BR1) and develop an optimized prototype (BR2), a miniaturized 3D bioreactor with improved distribution of biochemical factors that achieves greater than 50-fold increase in RBC production efficiency.
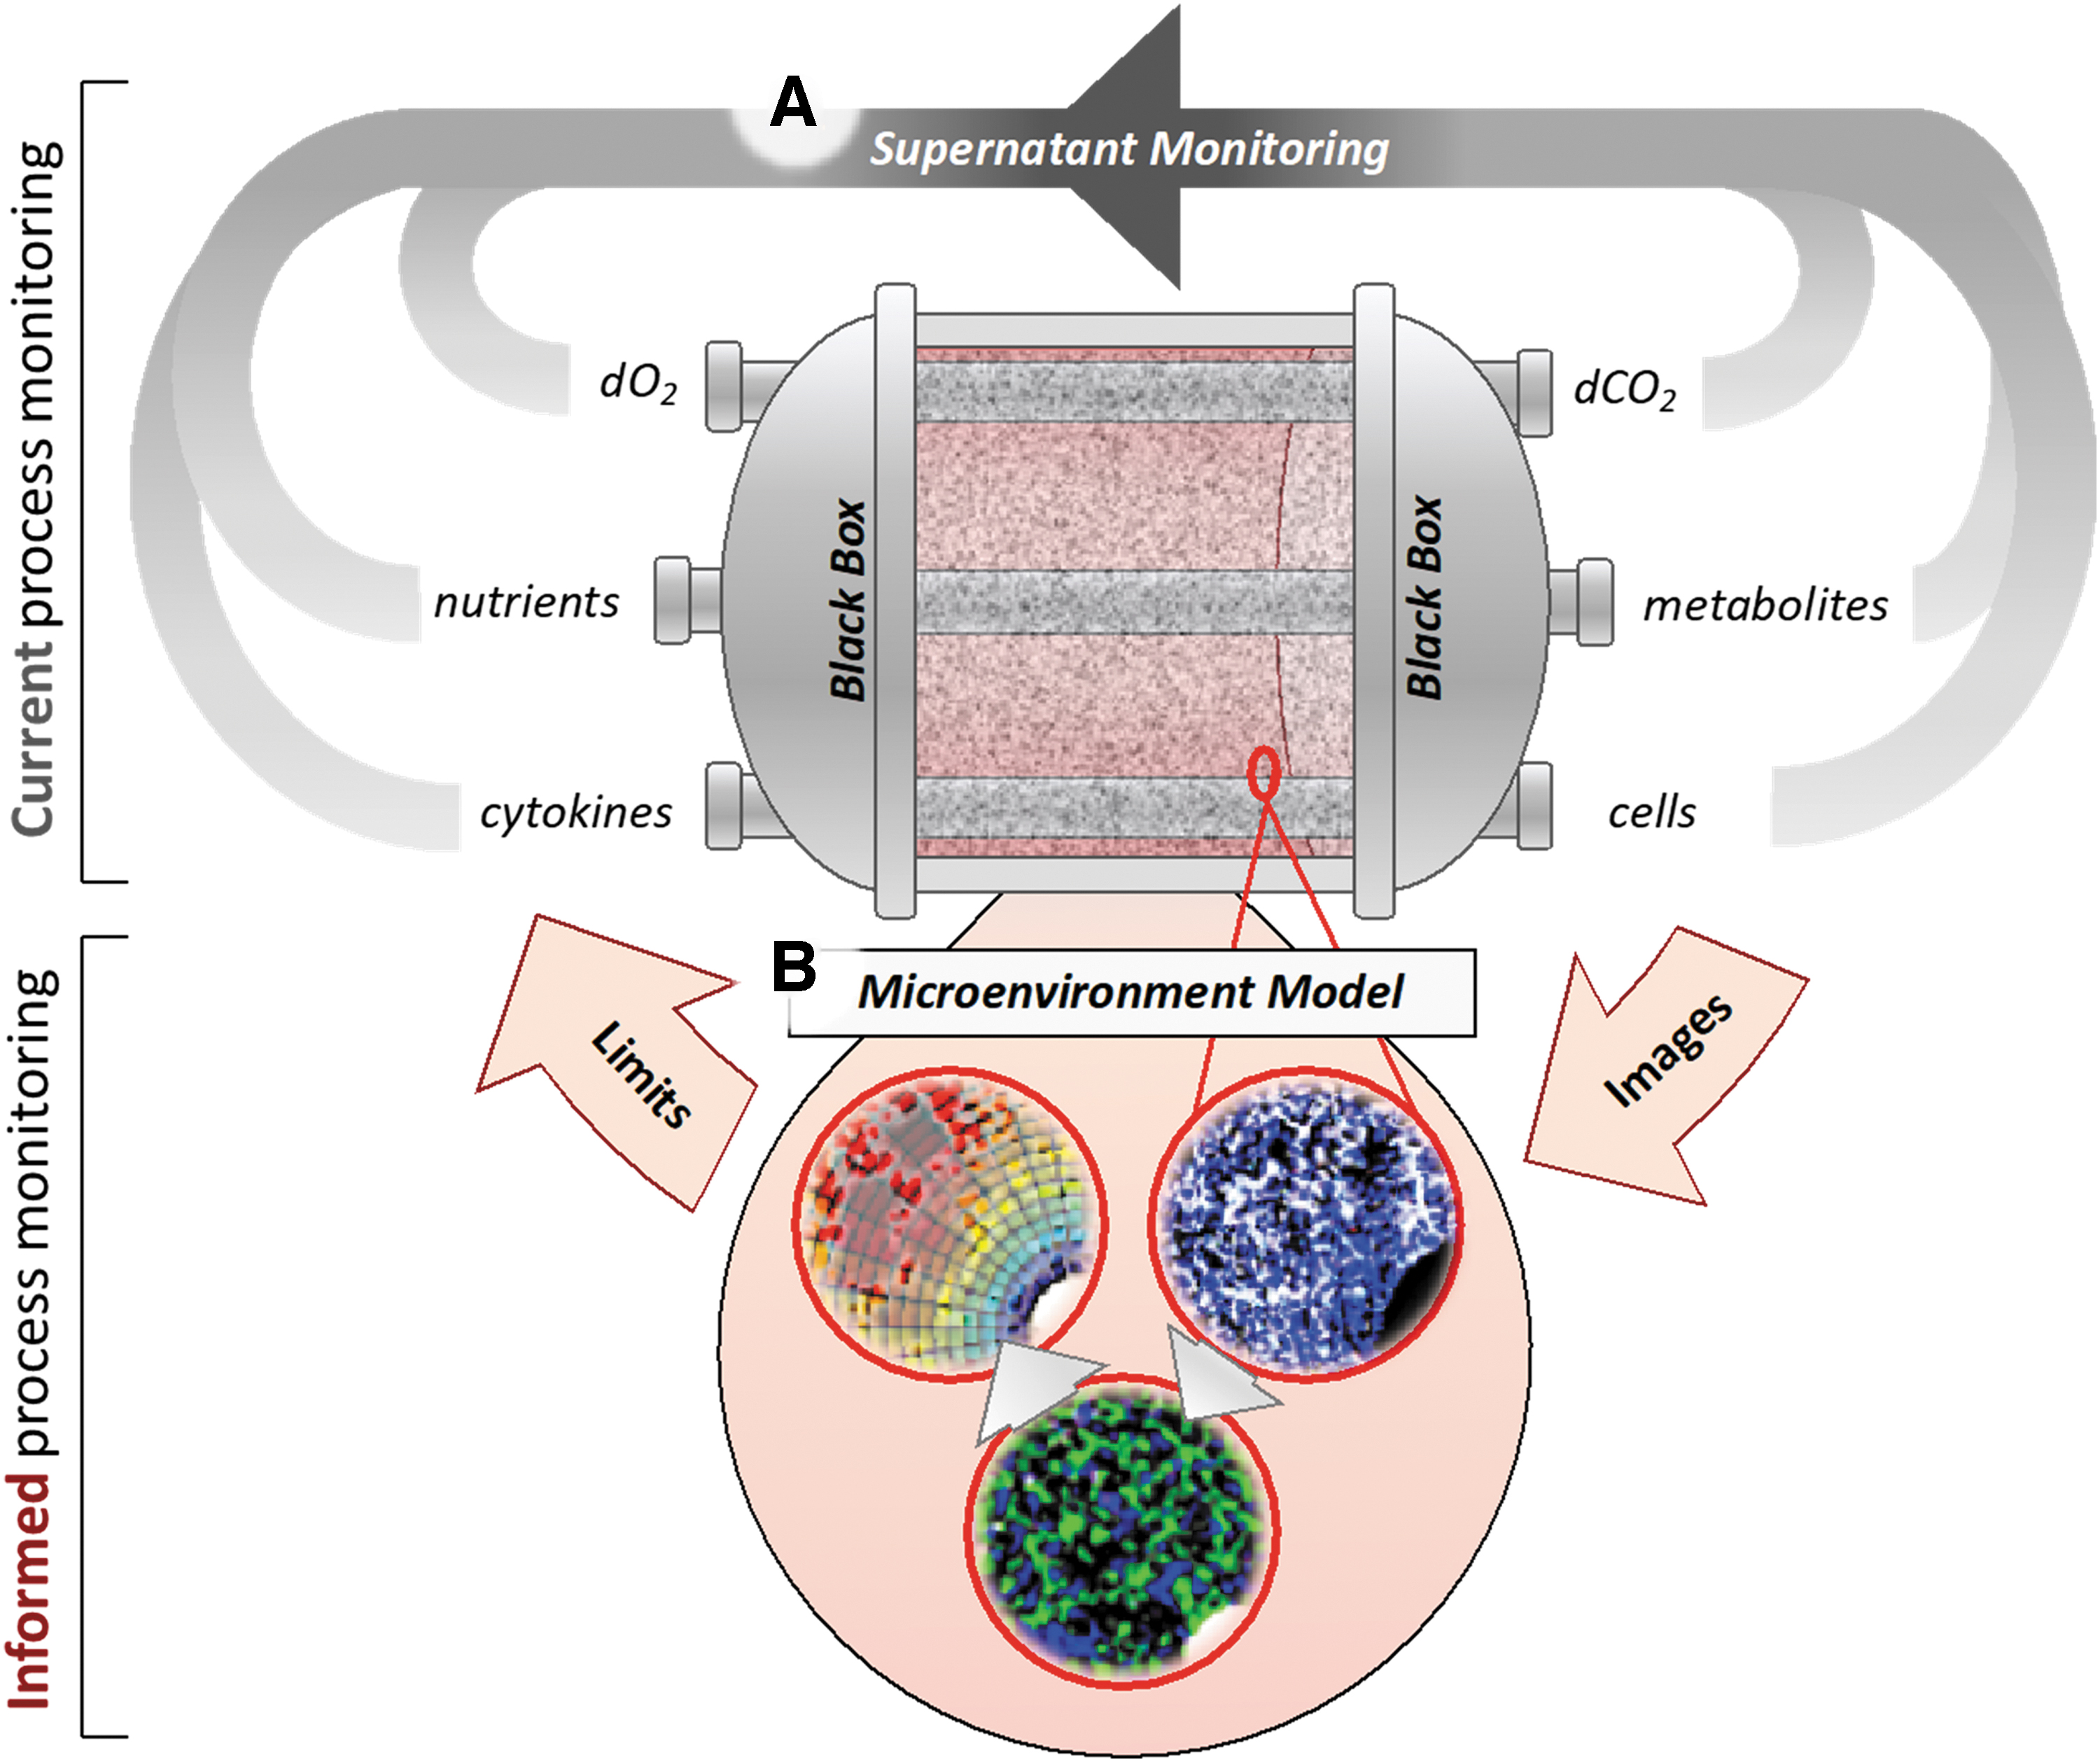
Microenvironment modeling toward informed 3D bioprocess design. 3D perfusion bioreactors are frequently treated as a black box, where optimization is performed around continuously collected supernatant monitoring
Materials and Methods
Institutional Review Board approval
CBMNCs were collected from donors in accordance with the Declaration of Helsinki (London-Harrow National Research Ethics Service, United Kingdom; Reference No. 05/Q0405/20).
Bioreactor fabrication and culture
BR1 platforms were fabricated, collagen-coated, sterilized, inoculated with 2 × 10⁷ CBMNCs/mL (low density BR1; for donors 1–4 [N = 4]) and 5 × 10⁸ CBMNCs/mL (high density BR1; for donor 4 [N = 1]), and cultured for 0, 14, or 28 days as previously described. 37 Growth factor concentrations were measured within BR1 hollow fiber lumens at day 0 (D0), D2, D4, D8, D12, D16, D20, D24, and D28 to capture early inflammatory cytokine release during culture adaptation (D0–D8), and then late remodeling of the functional ex vivo marrow microenvironment (D8–D28). Sections of BR1 were analyzed by confocal microscopy for 21 cell types and ATP assay at D0, D14, and D28 to estimate average cell distributions throughout BR1 scaffolds as previously described.37,39 Specifically, confocal microscopy images were analyzed for cell-to-fiber distributions and for cell-to-cell associations for all 21 cell types in bioreactor sections, while ATP assays were applied to estimate average total cell content between BR1 inlet, center, and outlet.
Miniaturized BR2 shells, spacers, top caps, and end cap-to-barb adapters were machined from polyfluoroalkoxy rods (ThePlasticShop, Coventry, United Kingdom). BR2 platforms were fabricated without a ceramic hollow fiber, but with a hollow lumen by inserting a glass Pasteur pipette (VWR, Lutterworth, United Kingdom) into BR2 shells before pouring a 0.5 mL solution of 5% polyurethane (Noveon, Brussels, Belgium) dissolved in 1,4-dioxane (Sigma-Aldrich, Dorset, United Kingdom) into the shell around the inserted glass pipette. The shell, pipette, and solution were then frozen and 1,4-dioxane was selectively sublimated by thermally induced phase separation. The resultant BR2s were brought to room temperature and, with pressure, the glass pipette was removed to reveal a hollow lumen; the BR2s were then perfused and manually mixed with a sequence of solutions for collagen coating, sterilization, and medium conditioning as previously described. 37
While BR1 was inoculated with 2 × 10⁷ and/or 5 × 10⁸ CBMNCs/mL from donors 1–4, the five BR2 platforms were inoculated with 108 CBMNCs/mL from donor 5 (N = 1). This intermediate inoculate density requires an achievable number of MNCs from one CB donation (2.5 × 10⁸ CBMNCs in five BR2s), and is roughly equivalent to BM normocellularity (1010 BM MNCs per kilogram body weight). 40 The five BR2s were operated in parallel and perfused at 480 mL/day from one 60 mL reservoir of medium using a microchannel pump (Kinesis, Cambridge, United Kingdom), oxygen permeable tubing, polycarbonate adaptors, and a reservoir bottle (VWR). Every 2 days, 30 mL of medium was removed, and an additional 30 mL of fresh medium was added. At D0, D7, D14, D21, and D28, one BR2 was sacrificed and removed from the shared 60 mL reservoir for analysis. BR2 medium consisted of StemSpan Serum-Free Essential Media (StemCell Technologies, Grenoble, France) supplemented with 1% penicillin–streptomycin (ATCC, Gaithersburg, MD), 10 mg/L insulin (Sigma-Aldrich), 200 mg/L cholesterol (Sigma-Aldrich), 200 mg/L transferrin (R&D Systems, Abingdon, United Kingdom), and 10 ng/mL stem cell factor (SCF; R&D Systems). From D8, 0.1 IU/mL erythropoietin (EPO; R&D Systems) was supplemented to half-medium exchanges, and only on D20, 1.0 IU/mL EPO was supplemented in the half-medium exchange. Altogether, the BR2 system of five bioreactors consumed 450 mL of media volume, equating to 217.5 mL per 28-day bioreactor culture. In contrast, BR1 consumed 815 mL of media volume per bioreactor over 28 days of culture.
Cells which egressed through BR2 hollow channels were collected within half-medium exchanges every 2 days, stained by trypan blue and methylene blue (StemCell Technologies), and counted on a hemocytometer. Spent medium was frozen every 2 days and later analyzed for growth factor content by LEGENDPlex Multiplex Bead Assay according to manufacturer's instructions (BioLegend, London, United Kingdom). Sacrificed BR2s were sectioned and analyzed by confocal microscopy and scanning electron microscopy on D0, D7, D14, D21, and D28 for markers specified in Table 1 using previously described protocols. 37 These time points were selected to overlap with the previous BR1 experiments and also provide more time points for a more detailed characterization.
List of Confocal Microscopy Reagents (Laser Wavelength, Primary/Secondary Antibodies and Counterstains with Applied Concentrations)
DAPI was applied at a 1:200 dilution.
Primary antibodies are provided alongside clone numbers (if monoclonal) or product number (if polyclonal) in parenthesis. All primary antibodies were purchased from Abcam (Cambridge, MA). All secondary antibodies as well as DAPI counterstain were purchased from Life Technologies.
C-KIT, tyrosine-protein kinase KIT; DAPI, 4′,6-diamidino-2-phenylindole; EPO, erythropoietin; IgG, immunoglobulin G; IL-6, interleukin-6; OPN, osteopontin; SCF, stem cell factor; SDF, stromal-derived factor; VCAM, vascular cell adhesion molecule.
Flow cytometry analysis
Flow cytometry was performed on CBMNCs on D0 before inoculation and on egressed cells collected from perfused medium at D7, D14, D21, and D28, as previously described. 37 Aliquots of 2–10 × 105 viable fresh cells were first stained with Calcein AM (Life Technologies) and Hoescht 33342 (Sigma-Aldrich) and then stained with antibodies CD36-APC (clone CB38), CD71-PECy5 (clone M-A712), and CD235a-PE (clone GA-R2; Becton Dickinson, Oxford, United Kingdom). Samples were prepared identically alongside isotype controls IgM-APC (clone G20–127), IgG2a-PECy5 (clone G155–178), and IgG2b-PE (clone 27–35), acquired on a LSR Fortessa (Becton Dickenson), compensated against single-stain bead controls (Becton Dickenson), and then gated against debris (using side scatter and forward scatter channels) and on viable cells (Calcein AM positive). Gates were set for enucleated and nucleated cells (Hoescht 33342), and bivariate isotype gates were set for 99% negative/negative events using FlowJo version 10 (TreeStar, Ashland, OR). Egressed RBC purity was defined as the CD235a+CD71–CD36–Hoescht– fraction of viable cells.
Quantitative image analysis
The first-generation bioreactor (BR1) was hand-sectioned into slices of ∼9 mm diameter and 0.5 mm thickness, then fixed and stained on D0, D14, and D28 using nine positive antibody panels, nine isotype antibody panels, and one unstained section using a protocol previously described.37,39 The second-generation bioreactor (BR2) was similarly snap-frozen in liquid nitrogen on D0, D7, D14, D21, and D28, sectioned into slices of ∼3.5 mm diameter and 0.5 mm thickness, then fixed and stained to comprise four positive antibody panels, four isotype antibody panels, and one unstained section as specified in Table 1. The cross-sections were completely imaged for each antibody panel, typically consisting of 9 or 12 merged images using a 10 × objective lens (Carl Zeiss, Jena, Germany) on a Leica SP5 inverted confocal microscope (Leica, Milton Keynes, United Kingdom). Images were then analyzed for fluorescent stain distribution using ImageJ 1.49i Software (U.S. National Institute of Health, Bethesda, MD) and MATLAB (The MathWorks, Natick, MA), as described previously.37,39 Each stained nucleus was considered as an individual cell, and all antibody stains within one cell distance of each stained nucleus was considered to be expressed by that cell (Supplementary Table S1).
Cell positions were simulated in idealized circular geometries from average spatiotemporal imaging data of BR1 or BR2 platforms using R-Project (R Foundation for Statistical Computing, Vienna, Austria), as previously described. 37 For a 5 mL low-density BR1 containing ∼108 cells, the simulation required 1 month to generate a 5.4 gigabyte (GB) matrix of cell positions and types on a high-performance computer (2 × 2.6 gigahertz [GHz] Intel Xeon processors with 96 GB of random access memory [RAM]) using R-Project (R Foundation). The BR1 and BR2 simulations were divided into inlet, center, and outlet cylindrical cross sections encircling a hollow fiber (2000 μm radius × 100 μm thickness) and assessed for growth factor distributions to reduce simulation time from 5 weeks to less than 5 min on a typical desktop computer (3.4 GHz Intel Core processor with 8 GB of RAM). Simulated cross-sections of averaged BR1 and BR2 imaging data were then implemented for the modeling of growth factor distribution.
Niche-based reaction-diffusion model
3D tissue engineering systems transport fresh medium from culture supernatant into the cell-laden interstitial scaffold space for consumption. Conversely, cell-secreted factors are transported from the interstitial scaffold space into the supernatant for removal. In hollow fiber bioreactor culture, these transport mechanisms are perpendicular to convective medium perfusion and as such are frequently modeled as diffusive processes.11,12,41,42 We have confirmed that our bioreactors operate at pseudosteady state,
37
so the concentration of biomolecules throughout the length of the bioreactor is equal to measured concentrations and convective transport limitations are negligible.11,12 In such systems where the supernatant is supplied through cylindrical lumens, akin to vascularized tissue, their reaction-diffusion process can be approximated in cylindrical coordinates as:
Where Ca, Da, and Ra represent the concentration, diffusivity, and reaction of species a. Equation (1)'s derivation is provided in the Supplementary Derivation. Equation (1) requires several boundary conditions for an explicit solution, including inoculum growth factor concentrations, no-flux boundaries, and continuity equations, which are provided in the Supplementary Derivation. Within BR1 and BR2, we assume there is no convection within the bioreactor scaffold and diffusion is driven by concentration gradients in three cylindrical dimensions
To simulate the distribution of dissolved oxygen (dO2): diffusion rate, Da, is estimated as 2300 μm2/s,
40
lumen concentration is a consistent 2.06 × 10⁻¹⁹ mol/um3 (20% dO2), and the reaction term Ra represents oxygen uptake by cells via Michaelis–Menten kinetics:
In Equation (2), ka corresponds to 0th order oxygen uptake rate while kM corresponds to the Michaelis–Menten constant and
To simulate protein growth factor distributions: diffusivities are estimated via Young's correlation:
Where ka,
Growth Factor Model Parameters (Biochemistry, Cellular Release, and Cellular Consumption) Derived from Literature
G-CSF, granulocyte colony-stimulating factor.
The model output for BR2 did not rely on BR1's results. The model incorporated experimental results only from BR2 to simulate BR2 biomolecule spatial distributions. These experimental results included imaged cell locations and measured growth factor concentrations. Cell proliferation and migration were not simulated. Rather, the reaction-diffusion model updated imaged cell numbers, types, and positions at the midpoint of each imaging timestep. For example, since BR2 was imaged at D0, D7, D14, D21, and D28, the simulation's cell locations are updated at D3.5, D10.5, D17.5, and D24.5 in the model.
To understand the stability of the reaction-diffusion model to external perturbations, we performed a global sensitivity analysis using the Global Sensitivity Analysis Toolbox (GSAT) for MATLAB developed by Cannavó.
46
While the model incorporates five parameters to simulate growth factor distributions (Da,
Statistical analysis
Data are presented as the mean ± standard error for the N = 4 independent biological replicates (cord blood donors) in the low-density BR1 experiments. The high density BR1 and the BR2 experiments consisted of only one independent biological replicate, respectively.
Experiments
Cells proliferate against a hypoxia gradient and near cytokine-secreting stromal cells
BR1 platforms were cultured across 28 days for two CBMNC inoculation densities: low (2 × 10⁷/mL) and high (5 × 10⁸/mL). Our model identified the most extreme oxygen gradients near the low density BR1 outlets at D28, where the highest cell densities were distributed (eight-fold higher; Fig. 2A
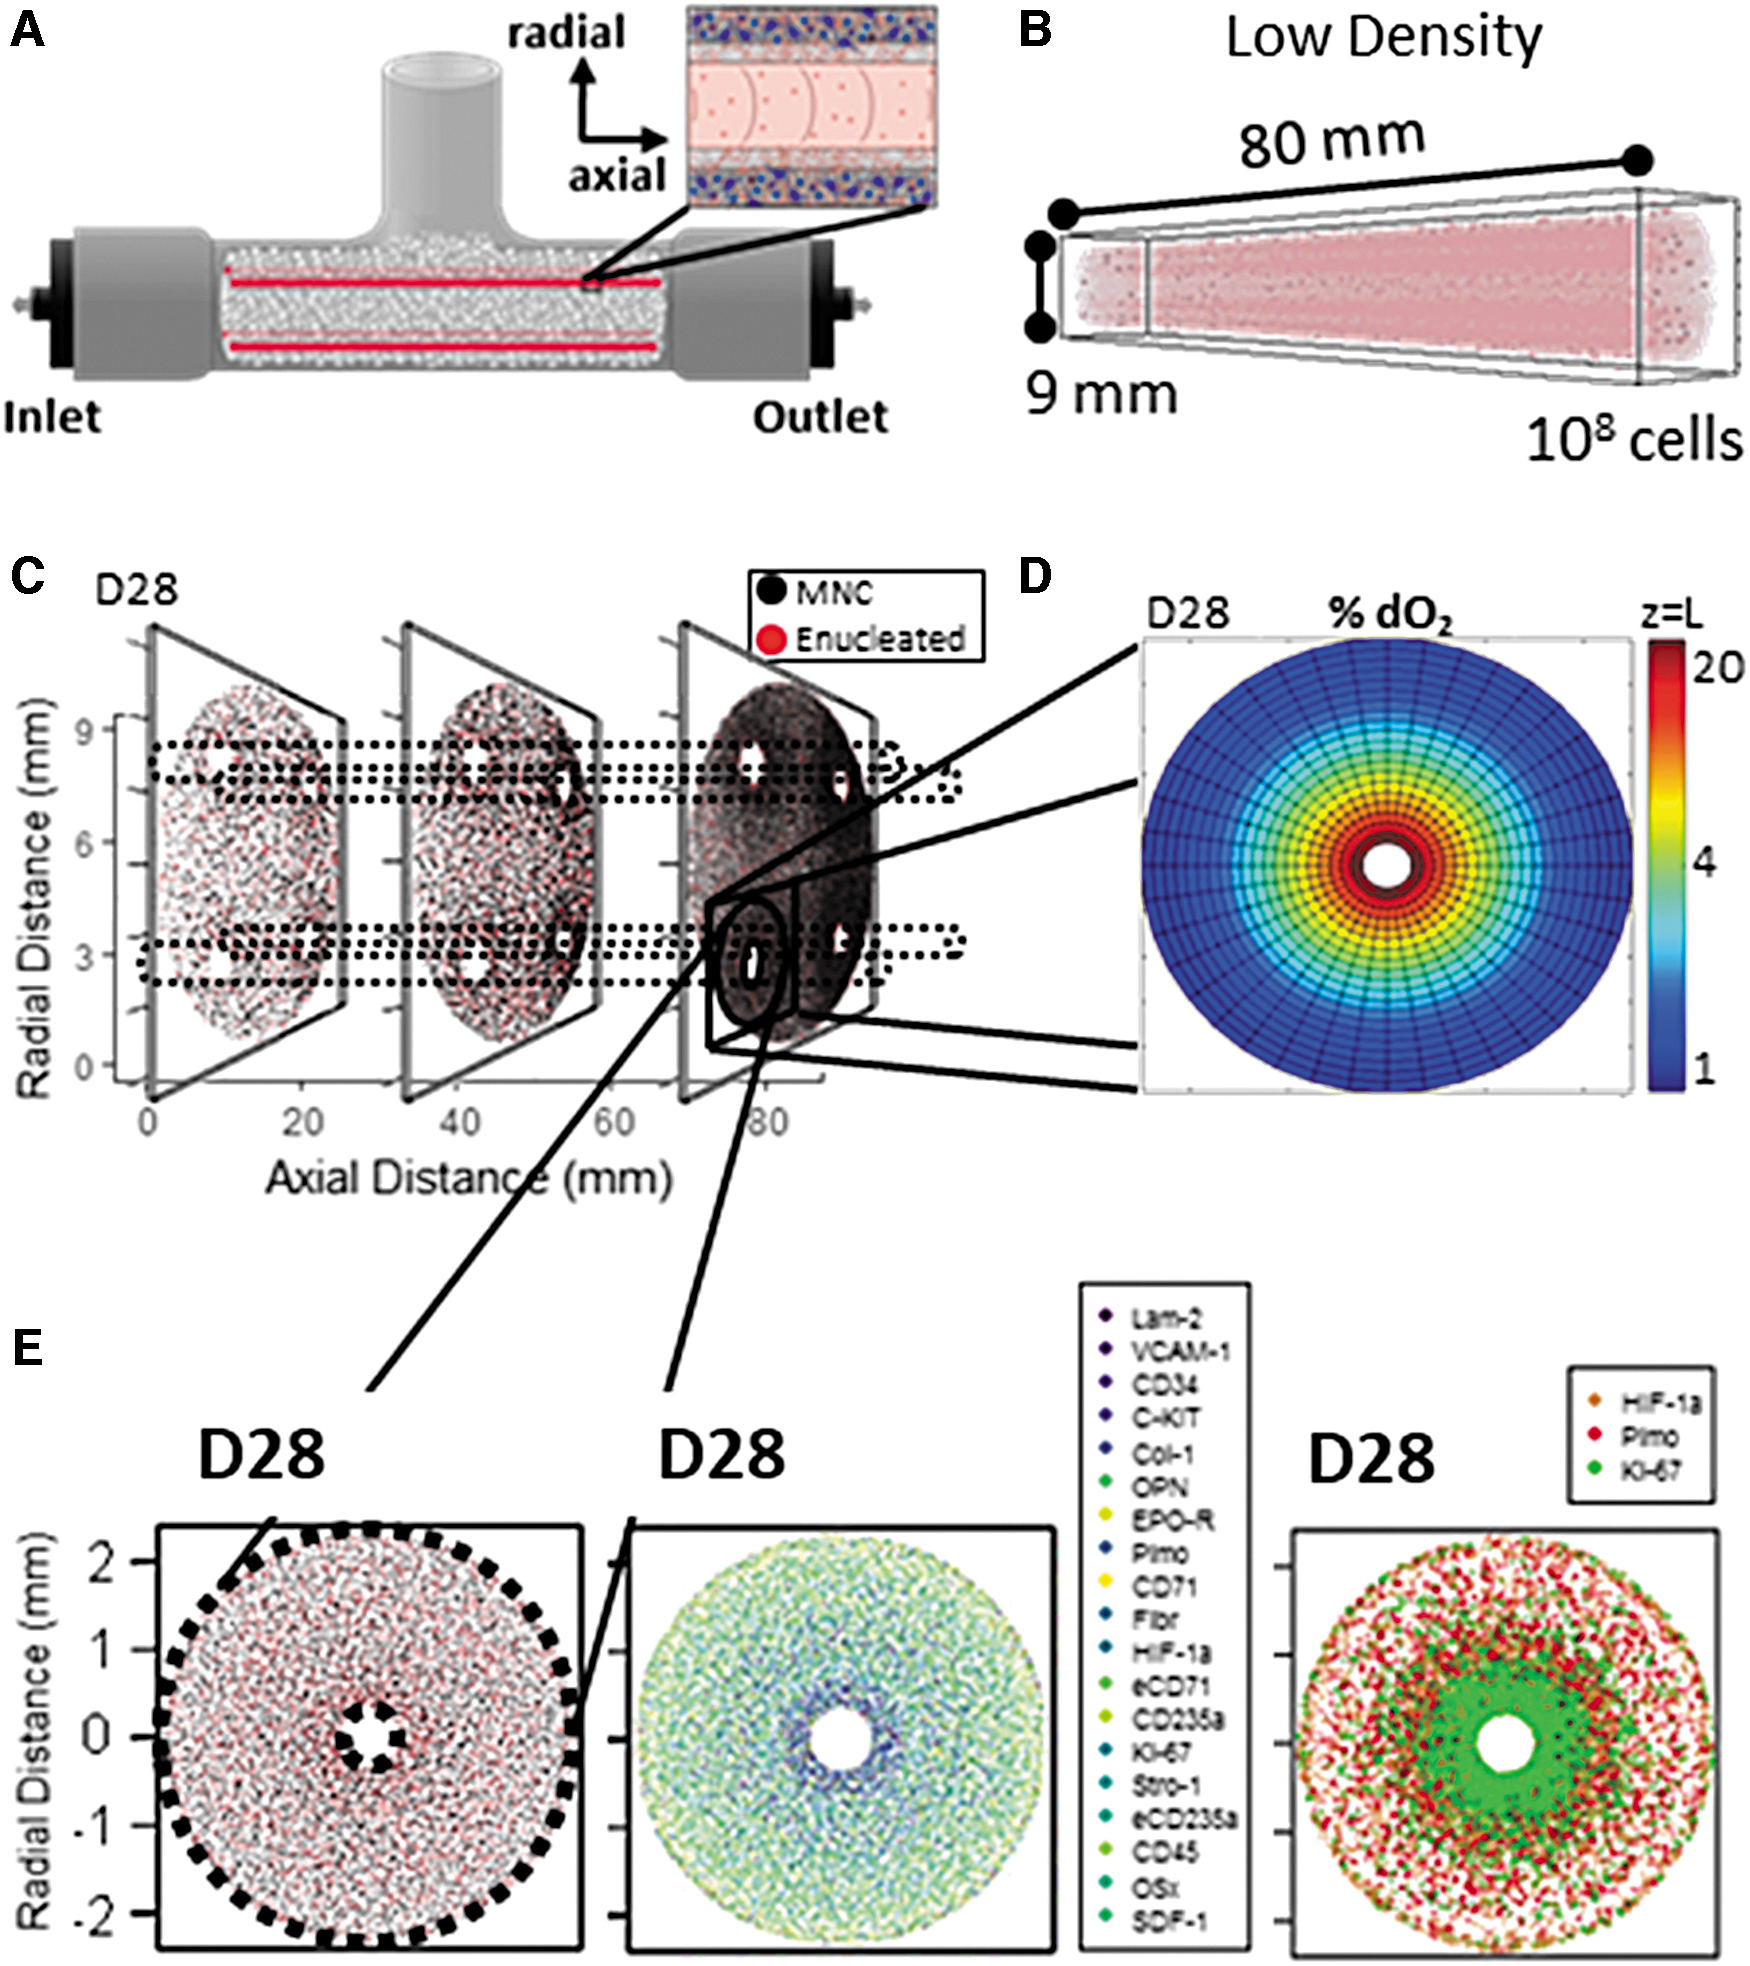
Model of cell and oxygen distribution during low-density BR1 culture.
SCF and EPO were supplemented at near-physiological concentrations, at least 10-fold less than current culture systems.
2
The distribution of supplemented SCF and EPO, as well as granulocyte colony-stimulating factor (G-CSF) as a representative example of an endogenously secreted stroma-derived factor,48–51
was compared throughout culture (Supplementary Fig. S2) and between low- and high-density BR1 platforms at D28 (Fig. 3). SCF was supplemented to support early culture proliferation (D0–D12) and EPO to promote late differentiation (D12–D28). The nondepleted spatiotemporal distributions of SCF and EPO within these respective time periods indicate their excessive supplementation (Fig. 3C

Low- versus high-density BR1 cell and growth factor profiles. SCF, EPO, and G-CSF growth factor profiles measured in the BR1 lumen throughout low-density
Model-based bioreactor design to enhance nutrient, cytokine, and cell transport
A miniaturized bioreactor (BR2) was designed to address model-informed shortcomings of BR1 cultures to improve RBC production (Fig. 4). In BR1, increasing inoculum cell density from 2 × 10⁷ to 5 × 10⁸ CBMNCs/mL correspondingly increased terminal cell density from 2.2 × 10⁷ to 2.5 × 10⁹ cells/mL. However, the volumetric capacity of BR1 (5 mL) required a high number of inoculated source cells (2.5 billion CBMNC) to achieve high cell densities with more efficient RBC harvest. Thus, BR2 was designed with a volumetric capacity of 0.5 mL to consistently support higher density cultures with a lower starting cell inoculum. Furthermore, the 100-fold higher terminal cell densities within BR1 only translated into a 6-fold increase in RBCs harvested. Dense cell aggregation on abluminal hollow fiber surfaces appeared to hamper RBC egress in high-density BR1 and preliminary BR2 cultures (Supplementary Fig. S3). BR2 platforms were therefore designed with a hollow channel containing larger pores rather than a hollow fiber. Finally, BR1 platforms were simplified from a feed-and-recycle-and-bleed three-bottle-reservoir system to a one-bottle-recycle system to alleviate sterility issues (Supplementary Fig. S4).

BR1 niche modeling informs BR2 prototype design. Biochemical factor utilization and/or production is rigorously modeled in BR1 (left) using continuously collected process outcomes such as harvested cells and supernatant factors (top left and top right, on-line) as well as invasive histology providing single-cell types and positions (bottom right and bottom left, off-line). The niche model identified BR1 design shortcomings, which led to an intelligent BR2 design (right), which included fabrication variables such as geometry and filtration (right top) as well as culture variables such as inoculum density and perfused medium composition (right bottom). Bioreactor image scale bars are 1 cm. Bottom left “Histology” scale bar is 100 μm. Top right “Size” scale bar is 500 μm, “Filtration” scale bar is 100 μm. Bottom right “Density” scale bar is 100 μm. “Model,” “Histology,” and “Density” are captured at D28 of BR1 or BR2 culture. Color images are available online.
The culture operation of this BR2 prototype was informed by modeling BR1's biochemical factor distributions. BR1's large diameter generated regions of hypoxia and low cell density outside a dense inner core of proliferating cells surrounding perfused hollow fibers. Therefore, we designed BR2 to have 1.2 mm of cross-sectional scaffold space from hollow channel abluminal surface to bioreactor shell. The low density BR1's excessive supplementation of SCF and EPO cytokines was evident due to medium concentrations, which followed a fed-batch half-life decay without significant cellular consumption. In contrast, the high-density BR1 indicated an early cellular consumption of SCF between days 2 (10 ng/mL) and 8 (0.5 ng/mL). These data led to a conservative five-fold reduction of SCF (10 ng/mL) and EPO (0.1 IU/mL) concentrations within the BR2 platform. An EPO spike (1.0 IU/mL) was added at D20 to boost late RBC production. Together, these design changes aimed to support long-term BR2 culture at increased cell densities and increased RBC harvests despite reduced and physiological-level supplementation of SCF and EPO. To validate the improvements of these model-based design changes for nutrient and cytokine utilization and for efficient RBC production, we designed BR2 analyses and analysis timepoints which overlap with BR1's analyses. We also expanded BR2 analyses to include new cell markers, supernatant growth factors, and more assay timepoints to provide a more detailed characterization of BR2 performance. In comparison with BR1, our model-based design changes supported long-term BR2 culture at increased cell densities and increased RBC harvests despite reduced and physiological-level supplementation of SCF and EPO.
Total sensitivity indices, ST, for simulated distributions of SCF, EPO, IL-6, and SDF-1 at days 3, 7, 14, 21, and 28 indicated that the distribution of growth factors were greatly impacted by diffusion and cell secretion parameters, but rarely impacted by cell uptake parameters. Growth factors supplemented in perfused medium or widely secreted by many distributed cells were strongly sensitive to their diffusivity parameter (
Model-based bioreactor efficiently utilizes medium factors for enhanced cell manufacturing
BR2 platforms maintained oxygen levels above 5% dO2 throughout culture, unlike BR1 platforms where dO2 reached anoxic levels, showcasing their improved design to support a five-fold higher CBMNC inoculum. This higher oxygen content correlated with more Ki-67 expression early in the culture, lower HIF-1α expression, and a more frequent cell-niche cluster formation (Fig. 5C). Consistent with BR1, BR2 cells accumulated near perfusion inlets and outlets (Supplementary Fig. 5) corresponding to BR2's lowest oxygen concentrations. Supplemented growth factors remained in excess throughout BR2 culture. EPO, a late stage RBC differentiation factor,52–55 was supplemented into 2-day half medium exchanges from D8 at 0.1 IU/mL and as a 1.0 IU/mL “spike” at D20 (vs. a constant 3–10 IU/mL in current culture platforms). While no mature erythroid cells (CD235a+ or EPO-R+ MNCs) were inoculated into BR2 at D0, a few CD235a+ MNCs were generated by D7 (2% of MNCs). After addition of EPO, CD235a+ nucleated cells were distributed distal to the hollow fibers at D14; after the EPO spike, no CD235a+ cells were observed at D20 and D28 (Fig. 5D). This scarce and peripheral distribution of CD235a+ cells may be attributed to an efficient harvest of red cells through BR2 channels. Similarly, the early-acting cytokine SCF56–59 appeared to be supplied in excess. Although supplemented at only 10 ng/mL in media for all 2-day exchanges (vs. 100 ng/mL in traditional hematopoietic cultures), negligible SCF was produced, consumed, or decayed across radial cross sections (<0.2 ng/mL) despite the C-KIT+ MNCs and SCF+ MNCs identified throughout the bioreactor (Fig. 5E).
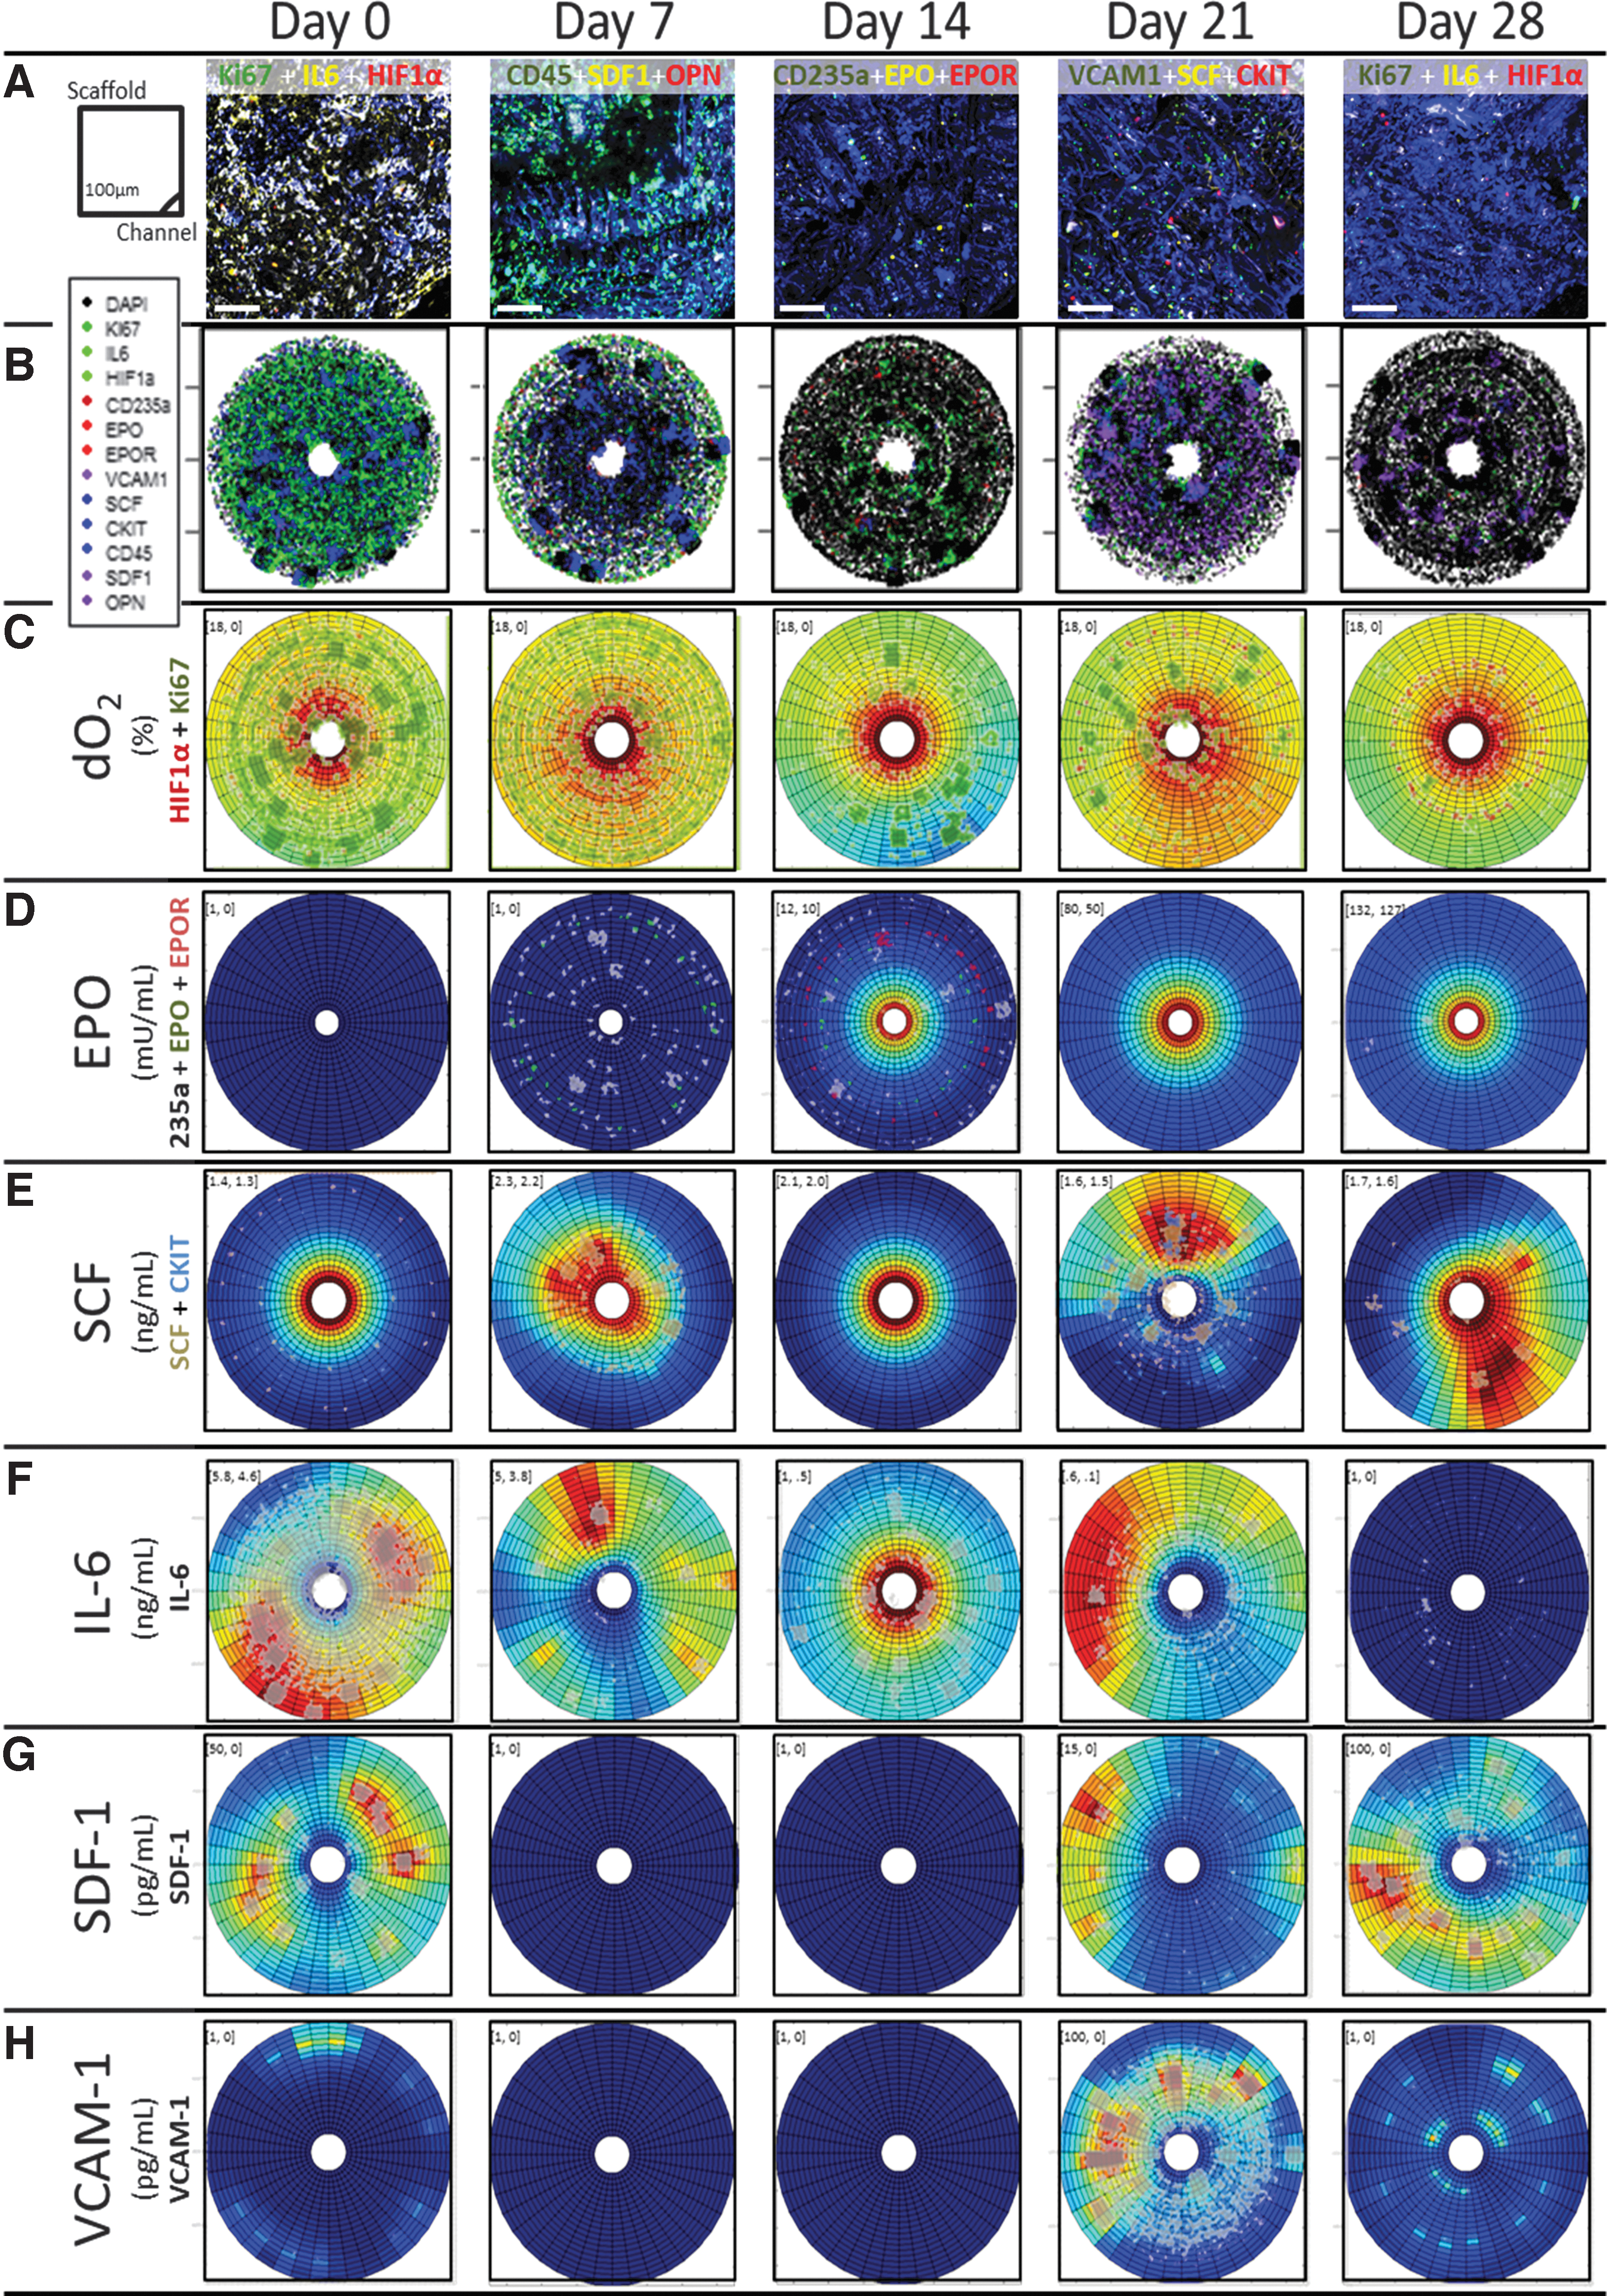
Capturing cell and biochemical factor distributions throughout BR2 culture.
Endogenously produced growth factors were found at five-fold higher concentrations within secreting cell clusters than within perfused medium. Specifically, inflammatory cytokine IL-660–65 was secreted by 42% of CBMNCs directly after inoculation; at week 1, the concentration in the lumen was >1 ng/mL. This high initial IL-6 secretion waned by D7 to <6% of cells, consistent with a decline in supernatant IL-6 to undetectable concentrations in the third week (<10 pg/mL; Fig. 5F). In contrast, SDF-1 and vascular cell adhesion molecule-1 (VCAM-1), normally secreted by stromal cells to recruit hematopoietic cells in vivo,66–73 were predominately expressed by cells toward the end of culture (MNCs were 45% SDF-1+ in D28 BR1 and 40% VCAM-1+ in D21 BR2; Fig. 5G, H). Osteopontin (OPN), normally secreted by mature osteoblasts to promote hematopoietic quiescence,74–77 was detected late in culture within the low- (3.5 ± 0.8 ng/mL) and high-density (11.4 ng/mL) BR1 and (0.3 ng/mL; all D26) BR2 lumens, despite <8% of MNCs expressing OPN during any week of culture. Cytokine-secreting cell niches were maintained over 28 days and may have contributed to BR2's dense cellular growth within clustered microenvironments.
The hollow fiber-free BR2 allowed for an efficient egress of RBCs. Egressed cells had an average viability near 80%; average enucleation was 50%. Egress viability dropped near 60% on D6 before immediately recovering above 80%, consistent with an early lag phase as cells adapted to culture conditions. The proportion of enucleated egressed cells increased before and after the first EPO supplementation at D8 and again shortly after the D20 EPO spike (Fig. 6A). The BR2 prototypes could support a harvest of 11.73 × 10⁶ total cells per scaffold milliliter, which represented 11.7% of inoculum cell density (Fig. 6B). In comparison, BR1 platforms generated 0.27 × 10⁶ or 6.80 × 10⁶ total cells harvested per scaffold milliliter for low- or high-density conditions, respectively; both representing 1.35% of inoculum cell density. While 14.9% (low density) and 39.2% (high density) of the egressed cells were CD235a+CD71– in BR1 by the end of culture, 56% of the cells that egressed from BR2 expressed this mature erythroid phenotype. BR2 egress contained 80% Hoechst negative enucleated cells before the D20 EPO spike and 92% enucleated cells from D24 to D28. This Hoechst negative fraction was enriched for CD235a+CD71– RBC phenotypes, which increased during culture from 0% (inoculum) to 40% (D7–D21) and 63% (D28; Fig. 6C and Supplementary Fig. S6

Cellular egress from BR2. Cells were harvested every 2 days from perfused medium in the circuit of five parallel bioreactors and counted for total, viable, and nucleated cell number. One bioreactor was sacrificed weekly (vertical black lines) and EPO was supplemented at 0.1 IU/mL from D8 except for a D20 EPO spike at 1.0 IU/mL (vertical red lines). (Top) The enucleated proportion (red) and viable proportion (green) of egressed cells as a percent. (Middle) Cumulative total (black), viable (green), nucleated (blue), and enucleated (red) cell egress per bioreactor. (Bottom) Egressed RBC number (black, left axis) and purity (red, right axis) were evaluated by hemocytometer counts aforementioned and flow cytometry at D0, D7, D14, D21, and D28. RBC purity was defined as the percent of viable cells which were CD235a+CD71–Hoechst–. RBC, red blood cell. Color images are available online.
Discussion
This study harnesses single-cell imaging data for spatiotemporal cytokine-niche modeling and the application of these data for the design of a new bioreactor. Recent approaches have utilized nonspecific or single-tissue imaging for model-based process development, such as microcomputed tomography imaging for bone formation or viable cell imaging for tissue infiltration.15,79,80 Other studies have developed quantitative imaging toolkits to understand tissue organization and cellular distribution both in vivo21,23,81 and in vitro,82–85 or have developed idealized models to observe 3D bioreactor factor distribution as either a homogenous system, 86 or by making significant assumptions regarding cell distribution.15,87,88 Few studies have applied quantitative tissue-scale cell type and location data to capture local cell mechanics and the distribution of biochemical factors to accurately represent the cellular microenvironment.36,89 This model-based design framework could be further developed into a cell culture control system,8,9 correlating noninvasive culture measurements to predicted distributions and densities of different cell types that could thereby control culture operation in real-time and enhance the in vitro formation of supportive niches.
Current mathematical models of 3D cell culture systems optimize cell production by maximizing cytokine supplementation and minimizing transport limitations.11,12 Herein, we demonstrate that a further experimental characterization in the form of (1) imaged cell positions and (2) assayed growth factor profiles is key to the design of an efficient RBC manufacturing device. These data, fed into the niche microenvironment model described herein, dictated that high cell densities instead of high EPO and SCF supplementation would provide more efficient erythropoiesis, and endogenously produced growth factors may be utilized to promote cell viability and proliferation with reduced exogenous cytokine supplementation. We observed that ceramic hollow fibers, which require weeks to fabricate, do not improve RBC separation during egress, and more efficient RBC harvest can be achieved with the creation of hollow channels alone. Altogether, this information led to the development of BR2, a miniaturized 3D perfused culture platform which could support high cell densities and enhanced RBC egress in a cost-effective manner. The spatiotemporal microenvironment model can also be applied to investigate bioreactor scale-up. The current model simulates the distribution of biomolecule factors away from one hollow fiber, and simulation results here can apply to larger bioreactors with an equal number of hollow fibers per cross sectional area, as performed for BR1 in Figure 2. Otherwise, the simulated abluminal distance r must be changed in Equation (1). Greater bioreactor lengths can be captured by increasing z in Equation (1), but longer bioreactors may not maintain the pseudosteady state assumption, so that the boundary condition
The 0.5 mL BR2 harvested 1.9 × 10⁶ CD235a+CD71– red cells and reached a total MNC number of 3.5 × 10⁷. The 5 mL low-density BR1 harvested 2 × 10⁵ red cells and reached a total MNC number of 108. The 5 mL high-density BR1 harvested 1.3 × 10⁷ and reached a total MNC number of 1010. Since the BR1s were 10-fold larger in volume, required 5-fold more expensive culture medium and 2-fold and 50-fold higher CBMNC inoculate, the BR2 represents an increase in egressed RBC cost-efficacy of 46-fold and 17-fold compared with low- and high-density BR1. Of the egressed CD235a+CD71– red cells from BR2, 96% were enucleated. The addition of a D20 EPO spike increased RBC generation and egress toward the end of culture. However, large numbers of nonadhered cells egressed from BR2 on D2 of culture, suggesting that a slower initial perfusion rate may allow for these cells to remain within the scaffolds; whereas cell and biochemical factor dynamics appeared consistent for N = 4 independent biological replicates in BR1 and for the five BR2 internal replicates and thousands of individual cells analyzed per staining panel. However, the robustness of our model-based BR2 design must be further validated across independent biological replicates, which may express altered cell composition and cytokine release profiles.
Liquid suspension cultures have produced clinically transfusable reticulocytes from cord blood hematopoietic stem cells and reached high expansion rates of 109 reticulocytes generated per stem cell.2,90,91 Nonetheless, liquid suspension cultures do not recapitulate the marrow microenvironment, achieve low cell densities, and would require 10,000 L of expensive media to achieve one transfusable unit of red cells.2,37 In contrast, 3D scaffold cultures mimic the BM in vitro and achieve higher densities of stem or progenitor cells requiring lower amounts of culture media, thus resulting in greater cost-efficiency.92–94 The inherent mass transport limitations of 3D culture systems can be overcome through the use of perfusion bioreactors that could enable even higher efficiency red cell production.38,95,96 While model-based designs of 3D bioreactors provide useful information for operation optimization, they fail to consider the biomimetic microenvironment and do not capture the heterogeneous development of multicellular niches that endogenously secrete growth factors supportive of tissue growth. In our previous work (BR1), an increase to cost efficiency of 80-fold, 30-fold, and 10-fold compared with current liquid suspension, 3D scaffold, and perfusion bioreactor systems, 37 respectively, was achieved. Herein, we demonstrate that spatiotemporal microenvironment modeling resulted in the design of more efficient perfusion bioreactors; specifically, the BR2 design improved on BR1's best RBC production cost-efficiency by at least 17-fold through enhanced medium utilization.
The simulation of spatiotemporal biochemical factor distributions was difficult to validate for those cytokines, which were expressed by many imaged cells, yet, not detected within perfused medium (SDF-1, VCAM-1) or cytokines expressed by few cells, yet, measured at high abluminal concentrations (OPN). The slow rate of secretion of SDF-1 and VCAM-1, in addition to the short half-life and rapid uptake was consistent with the characteristics of locally acting cytokines; they were undetectable within BR lumens (< 60 pg/mL) despite higher niche concentrations (100 pg/mL). Biochemical factor concentrations were sampled from the 60 mL recycled media reservoir and were representative of hollow channel lumen concentrations, as bioreactors were connected in parallel and perfusion rates were high enough to represent pseudosteady state dynamics (
Our BR2 model assessment sought to decouple assumptions regarding which cells secrete which cytokines by immunostaining permeabilized cells for cytokine production in addition to the surface expression of cytokine receptors. Interestingly, EPO+EPO-R– nucleated cells were observed at D7 and D14 and, although unaccounted for in our model, these cells may represent recently discovered EPO-secreting osteoblast or endothelial cells where release kinetics have not been studied.97,98 Our model assumes that cytokines colocate with cells only during the secretion process, 36 and disregards the possibility that cytokines produced further away may adhere to the extracellular matrix of a nonsecreting niche. A more accurate approach would be to colocate relevant transcription factors within cell nuclei with relevant locally secreted cytokines, and would require higher image magnification or different techniques than we could achieve here. The model only considers imaged cell positions captured every 1–2 weeks, which do not represent the spatiotemporal dynamics of cells in 3D tissue culture. Future model developments would benefit from continuous algorithms, which estimate proliferation, migration, and apoptosis99,100 to describe cell positions more accurately throughout culture and not only at imaging timepoints. In addition, many MNCs were not identified by using additional markers at D14 and D28, which necessitates further confocal characterization to define the next-generation marrow-mimetic BR for RBC biomanufacturing.
Conclusion
Current 2D cell biomanufacturing platforms remain prohibitively expensive and unable to reach the cell production efficiencies found in vivo. While 3D cell culture systems demonstrate increased production efficiencies through the recapitulation of physiological tissue architecture and subsequent formation of microenvironmental niches, the 3D culture design parameters which enhance or control this formation of supportive niches remain unexplored. Herein, we have developed a mathematical toolkit, which harnesses quantitative imaging data and noninvasive supernatant measurements. This mathematical toolkit inputs cell positions as well as nutrient and growth factor concentrations to create an in situ tissue representation of individual cell or niche exposure to secreted or supplemented growth factors, nutrients, and metabolites. We applied this toolkit toward a previous hollow fiber bioreactor for CBMNC-derived RBC production, which identified several bioreactor inefficiencies and led to the design of a second-generation miniaturized bioreactor. In a prototype study, this BR2 produced 11-fold more enucleated RBCs with higher purity per input cell population while using 5-fold lower concentrations of SCF and EPO (only) and generated a supportive growth factor-secreting stromal component. Our niche modeling tool could deliver intelligent 3D biomanufacturing through the spatiotemporal quantification of microenvironmental factors.
Footnotes
Authors' Contributions
M.C.A.: conceptualization, methodology, software, formal analysis, investigation, writing—original draft, writing—review and editing, and visualization. N.O.: software and investigation. K.B.: software and investigation. J.G.: software and investigation. Q.Z.: software and investigation. N.P.: conceptualization, resources, supervision, project administration, funding administration, and writing—review and editing. A.M.: conceptualization, resources, supervision, project administration, funding administration, and writing—review and editing.
Acknowledgments
The authors acknowledge Josè C.F. Morais, Asma Tahlawi, Risto Martin, and Susana Brito Dos Santos for help with experimental assistance and useful discussions, Robert Gediking for machining mini-BR shells, as well as Steve Rothery, David Gaboriau, and Andreas Bruckbauer from the Imperial College London Facility for Imaging by Light Microscopy.
Disclosure Statement
No competing financial interests exist.
Funding Information
This work was supported by ERC-BioBlood (Grant No. 340719), the Richard Thomas Leukaemia Fund, the Northwick Park Hospital Leukaemia Research Fund, and an Imperial College Chemical Engineering Scholarship to MCA.

References
Supplementary Material
Please find the following supplemental material available below.
For Open Access articles published under a Creative Commons License, all supplemental material carries the same license as the article it is associated with.
For non-Open Access articles published, all supplemental material carries a non-exclusive license, and permission requests for re-use of supplemental material or any part of supplemental material shall be sent directly to the copyright owner as specified in the copyright notice associated with the article.
