




Abstract
Tissue engineering strategies show great potential for repairing osteochondral defects in osteoarthritic joints; however, these approaches often rely on passaging cells multiple times to obtain enough cells to produce functional tissue. Unfortunately, monolayer expansion culture causes chondrocyte dedifferentiation, which is accompanied by a phenotypical and morphological shift in chondrocyte properties that leads to a reduction in the quality of de novo cartilage produced. Thus, the objective of this study was to evaluate transcriptional variations during in vitro expansion culture and determine how differences in cell phenotype from monolayer expansion alter development of functional engineered cartilage. We used an unbiased approach to explore genome-wide transcriptional differences in chondrocyte phenotype at passage 1 (P1), P3, and P5, and then seeded cells into hydrogel scaffolds at P3 and P5 to assess cells' abilities to produce cartilaginous extracellular matrix in three dimensional (3D). We identified distinct phenotypic differences, specifically for genes related to extracellular organization and cartilage development. Both P3 and P5 chondrocytes were able to produce chondrogenic tissue in 3D, with P3 cells producing matrix with greater compressive properties and P5 cells secreting matrix with higher glycosaminoglycan/DNA and collagen/DNA ratios. Furthermore, we identified 24 genes that were differentially expressed with passaging and enriched in human osteoarthritis (OA) genome-wide association studies, thereby prioritizing them as functionally relevant targets to improve protocols that recapitulate functional healthy cartilage with cells from adult donors. Specifically, we identified novel genes, such as TMEM190 and RAB11FIP4, which were enriched with human hip OA and may play a role in chondrocyte dedifferentiation. This work lays the foundation for several pathways and genes that could be modulated to enhance the efficacy for chondrocyte culture for tissue regeneration, which could have transformative impacts for cell-based cartilage repair strategies.
Impact statement
Biological repair strategies that rely on expansion culture of allogenic chondrocytes result in significant changes in cell behavior, which impact tissue production. Findings from this study show how expansion culture causes chondrocytes from juvenile bovines, which are younger and healthier than human cell sources used in biological procedures such as matrix-induced autologous chondrocyte implantation, to behave like cells from osteoarthritic cartilage. Furthermore, we prioritized several pathways and genes that could be modulated to improve the success of chondrocyte culture for tissue regeneration. These findings have important implications for the development of effective cell-based replacements for cartilage defects.
Introduction
Osteoarthritis (OA) is the most prevalent joint disease, affecting over 530 million people globally. 1 In OA, articular cartilage in diarthrodial joints deteriorates, leading to joint stiffness and pain. The underlying cause of OA is a complex interplay of biomechanical, biochemical, and cellular factors among joint tissues, with age, obesity, sex, injury, and genetics among potential triggers and risk factors for the disease.2,3
Tissue engineering strategies show great potential for repairing osteochondral defects, with the aim of restoring joint function, reducing pain, and prolonging the need for total joint arthroplasty. 4 Matrix-induced autologous chondrocyte implantation (MACI) is a promising therapy that involves extracting autologous chondrocytes from a nonload bearing region of the knee and subsequently expanding cells in vitro to obtain enough cells for seeding onto a collagen scaffold. The scaffold is then placed into a cartilage defect to produce de novo tissue.5,6 Expansion culture leads to chondrocyte dedifferentiation, characterized by a shift in cell behavior from producing predominately type II collagen and aggrecan to producing type I collagen and versican, respectively. Chondrocytes lose their rounded shape and acquire a flattened, fibroblastic morphology. 7 Furthermore, passaging affects the ability of chondrocytes to redifferentiate and reduces the quality of cartilage matrix produced, where dedifferentiated chondrocytes produce fibrocartilage, rather than the hyaline tissue of healthy, native cartilage.8–10
Similarities have been identified between OA chondrocytes and in vitro dedifferentiated chondrocytes. 11 For example, types I and III collagen, which are common in fibrous tissues, are markers for chondrocyte dedifferentiation and have greater deposition in OA tissue.11–13 In addition, chondrocytes in adult cartilage are typically in a quiescent state; however, chondrocytes in OA cartilage have been shown to cluster, suggesting that the cells have reacquired the ability to proliferate.14,15 The ability to proliferate is a shared property between chondrocytes in OA cartilage, dedifferentiated chondrocytes in monolayer expansion, and chondroprogenitor cells. 16 Finally, the process of monolayer dedifferentiation is augmented by catabolic factors, including interleukin (IL)-1β, IL-6, and tumor necrosis factor-alpha (TNF-α), which also play a role in OA physiopathology.11,17
Proinflammatory cytokines alter chondrocyte gene expression during in vivo OA development and in vitro cell dedifferentiation. In addition to affecting chondrogenic phenotype, in vitro exposure to IL-1β and TNF-α increases cell spreading, expression of F-actin, and stress fiber formation.18–20 These cytoskeletal changes also occur with chondrocyte dedifferentiation,10,21 and our recent work showed priming chondrocytes with growth factors (transformation growth factor beta-1 [TGF-β1], basic fibroblast growth factor, and platelet-derived growth factor-ββ) during monolayer expansion culture overrode these cytoskeletal/mechanobiological pathways at lower passages. 22 Based on these similarities, we hypothesized that cell signaling pathways between dedifferentiated chondrocytes from monolayer expansion culture overlap with behavior from chondrocytes, from OA cartilage.
Thus, the objective of this study was to evaluate transcriptional variations during in vitro expansion culture and determine how differences in cell phenotype from monolayer expansion alter the development of functional engineered cartilage. in addition, this study aimed to identify transcriptional markers for chondrocyte dedifferentiation based on their role in human OA. To do so, we investigated differences in gene expression at passage 1, 3, and 5 (P1, P3, and P5, respectively) and cells were encapsulated into agarose constructs following P3 and P5 to examine the capability of cells to redifferentiate and produce chondrogenic matrix.
We identified genes with functional roles in OA, which may play a role in chondrocyte dedifferentiation. This was achieved through unbiased computational prioritization of genes exhibiting differential expression with passaging and enriched in OA human genome-wide association studies (GWAS). Findings from this study provide valuable insights into how cellular phenotype influences cartilaginous tissue production and identifies potential markers for chondrocyte dedifferentiation, which may have important implications for developing effective de novo cartilage.
Materials and Methods
Articular cartilage was harvested from two juvenile bovine knee joints, from two separate animals (3–6 weeks old; Green Village Packing Co, Green Village, NJ, USA). Tissue was combined and digested overnight with 0.15% type IV collagenase (LS004189; Worthington) in Dulbecco's modified Eagle's medium (DMEM; 12-100-046; Gibco) containing 5% fetal bovine serum (FBS; 35-015-CV; Corning), 1% 1M 2-(bis(2-hydroxyethyl)amino)ethane sulfonic acid buffer (B9879; Sigma-Aldrich), 1% 1M 2-[(2-hydroxy-1,1-bis(hydroxymethyl)ethyl)amino]ethanesulfonic acid, N-[tris(hydroxymethyl)methyl]-2-aminoethanesulfonic acid buffer (1.10695; Millipore Sigma), 1% 4-(2-hydroxyethyl)piperazine-1-ethanesulfonic acid, N-(2-hydroxyethyl)piperazine-N-(2-ethanesulfonic acid) (83264; Sigma-Aldrich), 1% antibiotic-antimycotic (15240-062; Gibco), 5% Minimum Essential Amino Acids (11140050; Gibco), and 4.7% sodium bicarbonate (S5761; Sigma-Aldrich). Digested cells were filtered through a 70 μm filter and counted. Chondrocytes were cultured in DMEM containing 10% (v/v) FBS, 1% antibiotic-antimycotic, and 3.7% sodium bicarbonate to confluence in a standard 37°C/5% carbon dioxide (CO2)-humidified incubator (plating density = 13.3 × 10³ cells/cm2). Media were changed three times/week and cells were cultured through P5.
Total RNA was isolated using TRIzol reagent (15596026; Invitrogen), Qiagen RNeasy mini kit (74134; Qiagen), and Qiagen DNase1 kit (79254; Qiagen) at P1, P3, and P5, according to the manufacturer's instructions (n = 3 wells/group). RNA quantity was assessed using a Nanodrop Spectrophotometer and RNA quality was assessed using a Bioanalyzer (RNA integrity Number >9.7). Library preparation, RNA sequencing, and data processing were done at UCSF Functional Genomics. Fifty-bp single-end reads were sequenced using an Illumina HiSeq 4000 and sequencing provided 547 million total reads.
Quality control of raw RNA-seq data was assessed using FastQC, reads containing adaptors and low-quality reads were removed, and reads were aligned to the Ensembl Cow ARS-UCD1.2.95 genome (STAR_2.4.2a). Differential expressed analysis was performed to determine changes in gene expression with passage number using the DEseq normalization method and count data for analysis (DESeq2 package in R). 23 Adjusted p-values were calculated using Benjamini–Hochberg false discovery fate (FDR) method and genes with FDR <0.01 were considered significant, as commonly used in the literature.24–26
To identify biological processes and cellular components impacted during expansion culture, gene ontology (GO) enrichment analysis was performed using DAVID Bioinformatics Database (https://david.ncifcrf.gov/). Significant differentially expressed genes (DEGs) were examined to determine which genes were upregulated and downregulated between P1, P3, and P5. The top 10 most significant terms were identified. The number of DEGs belonging to that GO term was divided by the total number of downregulated or upregulated DEGs for that passage combination, multiplied by 100 (reported as a percent).
Gene-set enrichment analysis was performed between RNA-seq results and datasets for knee OA, hip OA, knee and/or hip OA (combined; hip-knee), and OA at any site identified using the UK Biobank and arcOGEN GWAS.27,28 First human homologs were identified for all bovine genes by converting all bovine Ensembl gene IDs to human Ensembl IDs (R package babelgene). Next, MAGMA (version 1.07b), a tool for gene-set analysis of GWAS data, was used to generate gene-based scores from GWAS results (https://ctg.cncr.nl/software/). 29 Gene-based scores were calculated using the most significant variant located within a ±50 kb range of the gene region (total noncoding region = 100 kb). 29 Adjustments were made for potential confounders, such as gene size, gene density, and linkage disequilibrium between variants, using an adaptive permutation procedure before calculating p-values, as gene-based empirical p-values may differ from GWAS-reported p-values.
To determine whether human homologs of bovine DEGs were associated with human OA, a one-sided test was performed using MAGMA's gene set enrichment to determine whether gene-based scores in a specific gene set were greater than all gene-based scores, as described. 30 The significance of gene-based scores within a gene set was examined, and the Bonferroni method was used to control for family-wise error rate.
Following P3 and P5, cells were encapsulated in 2% (w/v) Type VII low-gelling temperature agarose (A0701; Sigma-Aldrich) at a concentration of 38.7 ± 6.1 × 10⁶ cells/mL. A sterile biopsy punch was used to core cylindrical constructs with a diameter of 4 mm and a thickness of 2.44 ± 0.04 mm. Constructs were cultured in serum-free, high-glucose DMEM media (12-100-046; Gibco) with 0.1 μM dexamethasone (C980Q13; Sigma-Aldrich), 40 mg/mL L-proline (P5607; Sigma-Aldrich), 50 mg/mL L-ascorbic acid (A4544; Sigma-Aldrich), 100 mg/mL sodium pyruvate solution (S8636; Sigma-Aldrich), 1 × Insulin, Transferrin, and Selenium+ pre-mix (CB-40352; Corning), 1% antibiotic-antimycotic (15240-062; Gibco), and 3.7% sodium bicarbonate (S5761; Sigma-Aldrich) (1 mL/construct).
Constructs were cultured in static culture under free swelling conditions at 37°C, 5% CO2 in a humidified incubator for 35 days, with medium flow only occurring when media were changed (3 × weekly). Media were supplemented with 10 ng/mL TGF-β3 for the first 14 days, as previous studies have shown that transient TGF-β3 supplementation (2 weeks) results in better matrix production in three-dimensional (3D) culture than continuous TGF-β3 supplementaiton.31,32
The production of engineered tissue was assessed by evaluating mechanical and biochemical properties of constructs on day 35. Young's modulus was determined from a stress-relaxation test in unconfined compression (loading rate = 0.05%/s, 10% strain, and 30-min hold). After mechanical testing, sample wet weight (ww) was measured, and samples were lyophilized overnight to determine dry weight (dw). Water content was calculated as the difference between ww and dw normalized by the ww [i.e., (ww–dw)/ww]. The swelling ratio (SR) was calculated by normalizing the day 35 ww by the average day 1 ww for each group. DNA content was determined using the PicoGreen dsDNA Assay kit (Invitrogen), and results were used to calculate the number of cells per construct. Glycosaminoglycan (GAG) and collagen content were determined using the 1,9-dimethylmethylene blue assay 33 and hydroxyproline assay (OHP), respectively.
For the OHP assay, the ratio of hydroxyproline to collagen was assumed to be 7.64. 34 GAG and collagen contents were normalized by DNA and ww. A two-way analysis of variance, with factors of days in culture and passage number, was used to examine differences in DNA/construct (n = 6–8 constructs/group). A Tukey's multiple comparisons post hoc was performed whenever statistical significance was achieved. Differences in biochemical and mechanical properties of constructs created with cells from P3 and P5 were compared using a two-tailed unpaired Student's t-test (n = 8 constructs/group). Unless otherwise specified, for all statistical analyses, a p-value ≤0.05 was considered statistically significant.
Results
Unbiased RNA sequencing showed that samples were clustered by passage using the first two principal components (PCs; Fig. 1A). P1 cells were clustered furthest from P3 and P5 along PC1, suggesting a convergence with higher passage number. In addition, P3 was grouped closer to P5, indicating that differences between passages may decrease after P1. Along PC2, there was less variance for P1 cells than P3 or P5 cells.
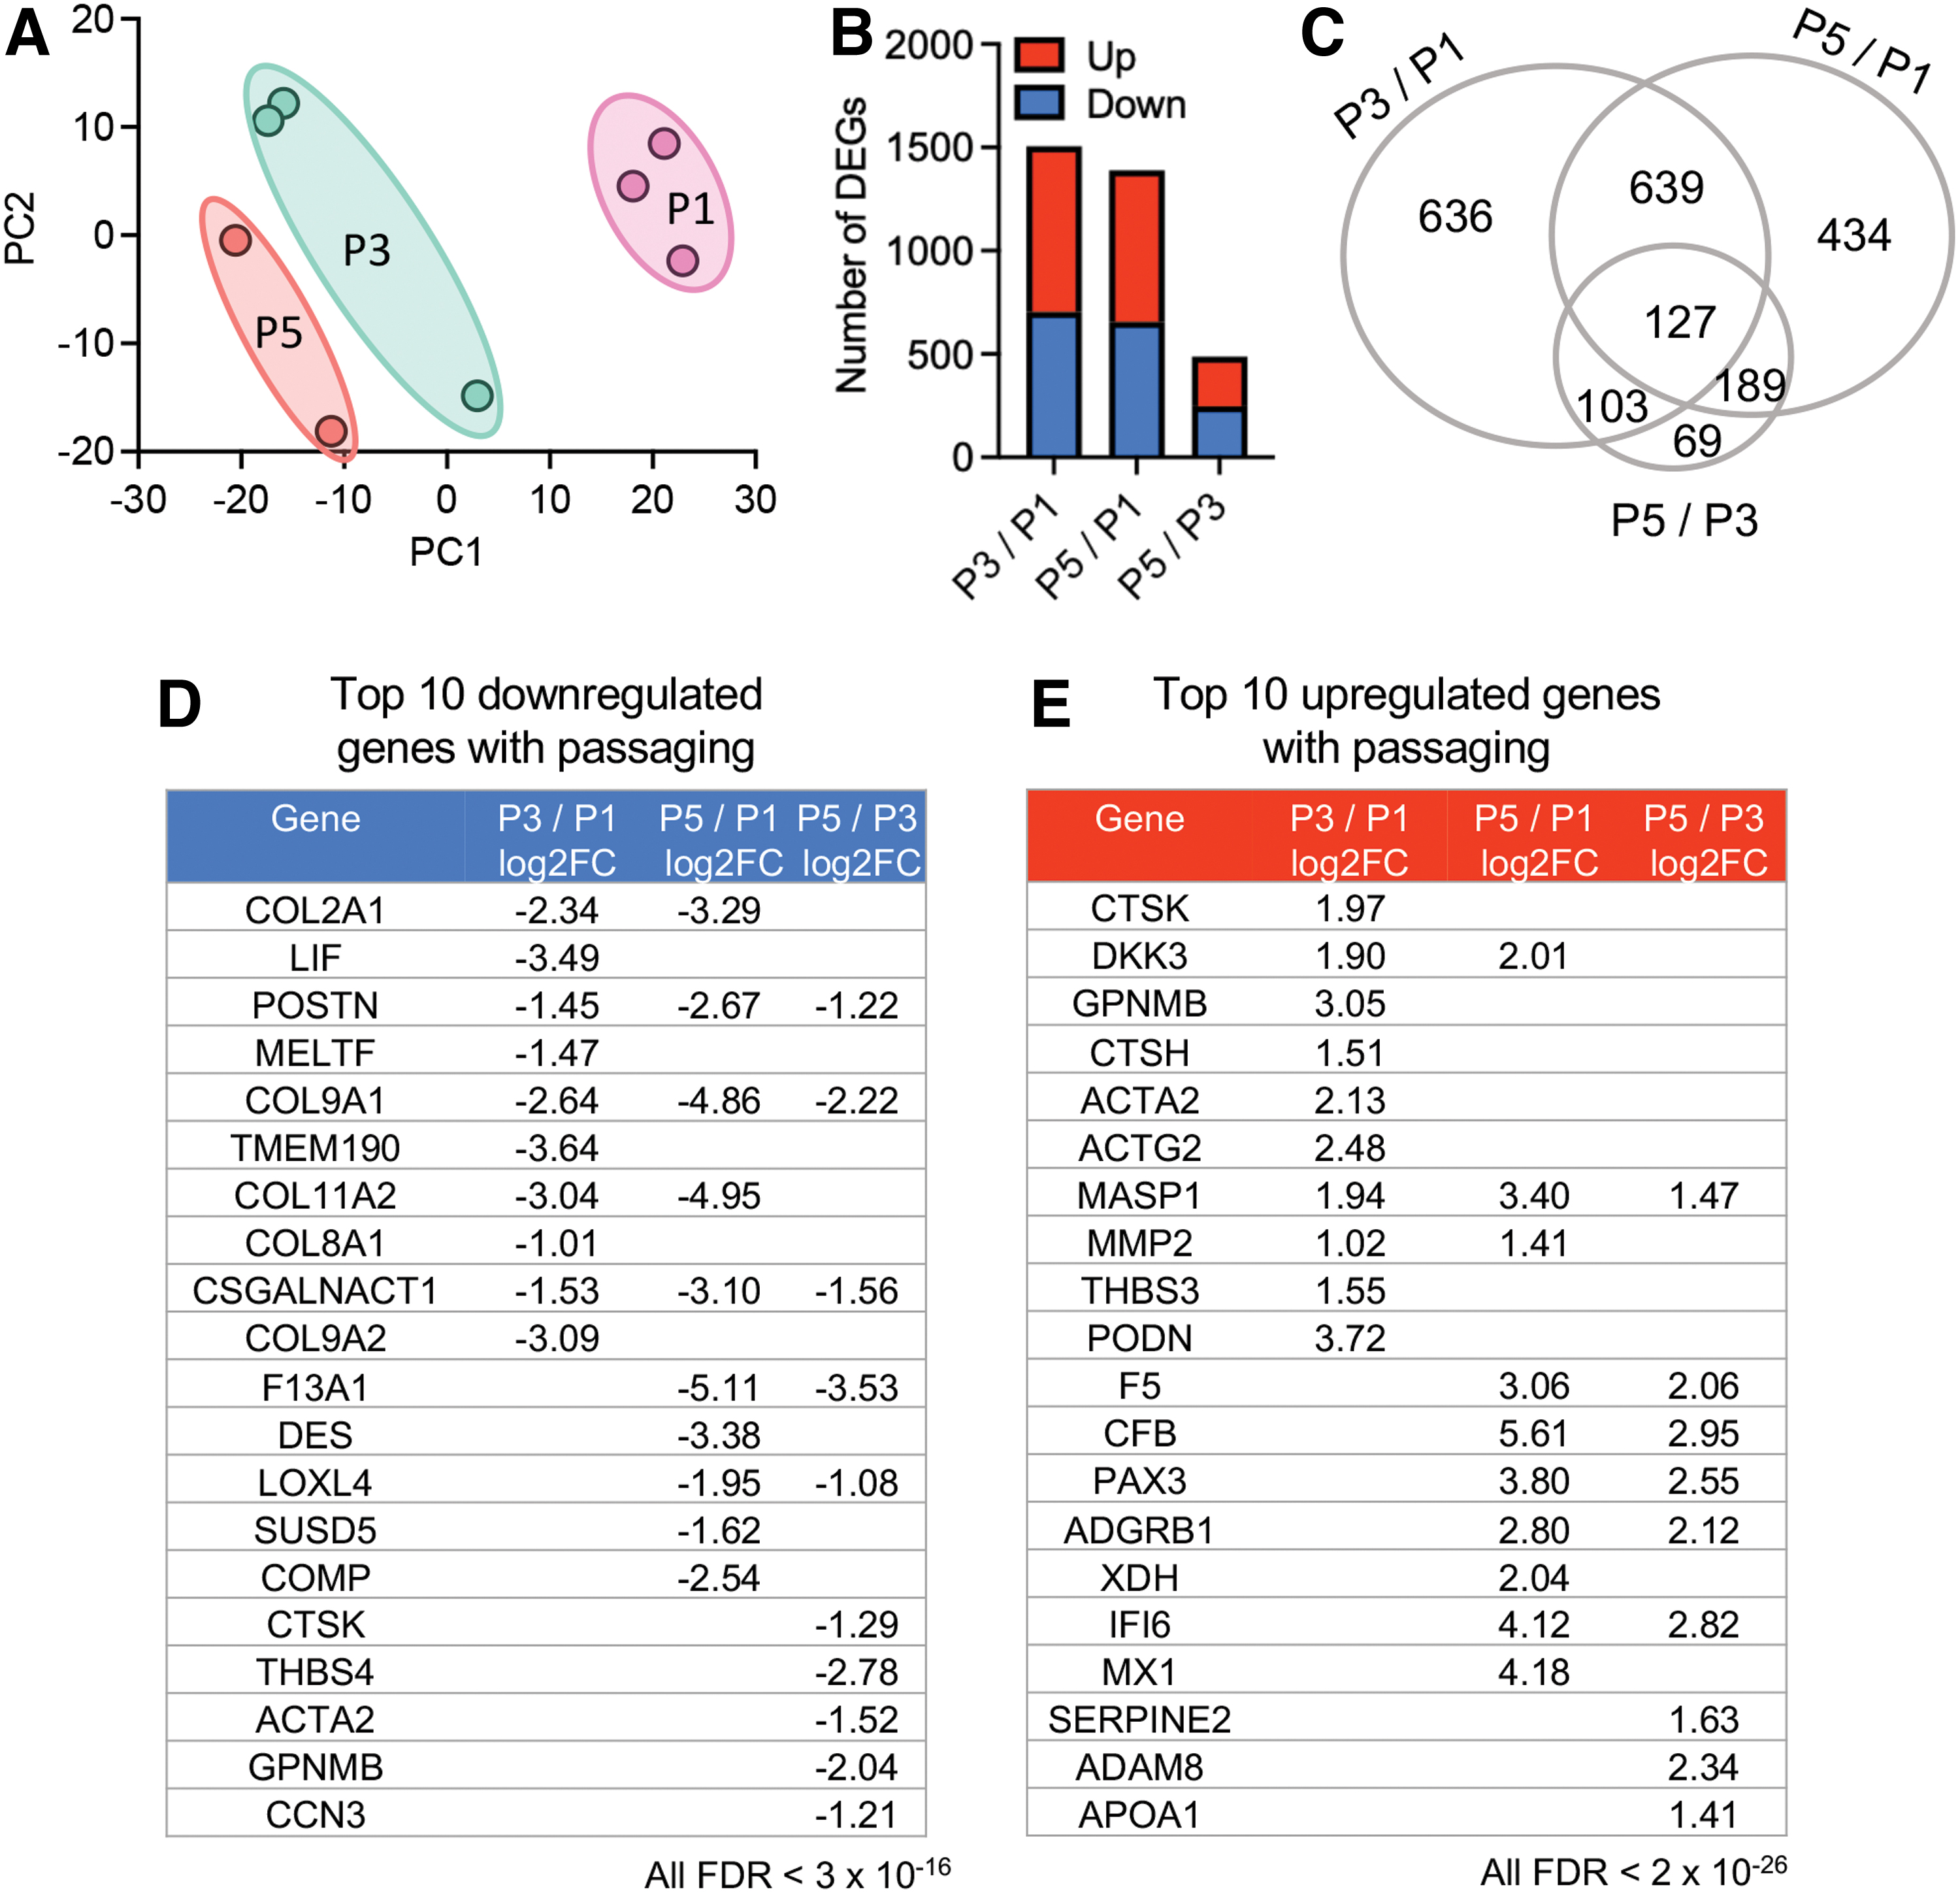
Unbiased RNA sequencing results for chondrocytes for passages 1, 3, and 5 (P1, P3, and P5, respectively).
Changes in gene expression were evaluated based on passage number and a similar number of significant DEGs (FDR <0.01) were identified between when comparing P1 cells to P3 (P3/P1; 1505 DEGs) or P5 (P5/P1; 1389 DEGs; Fig. 1B). Four hundred eighty-eight DEGs were identified as significantly different when comparing P3 and P5 cells (P5/P3), which was ∼70% fewer than comparisons between P1 cells and the latter two passages. One hundred twenty-seven DEGs were common between all three passages (Fig. 1C). The detailed results of DEGs based on passage are available in Supplementary Table S1.
Three DEGs (POSTN, COL9A1, and CSGALNACT1) were identified as being among the most significantly downregulated genes between each passage comparison, suggesting gene expression of these genes progressively decreased with passaging (Fig. 1D). Six genes associated with cartilage development were identified as being significantly downregulated with passaging: COMP, CTSK, CCN3, CSGALNACT1, COL2A1, and COL11A1. MASP1 was among the most significant DEGs upregulated at each passage comparison and had the most significant expression of all genes at P3 (Fig. 1E). Approximately 40% of the top 10 most significant genes upregulated during passaging are linked to immune response, including ADAM8, MASP1, MX1, APOA1, CTSH, CTSK, CFB, and IFI6 (Fig. 1E). Finally, CTSK, GPNMP, and ACTA2 were identified among the most significantly upregulated DEGs between P3/P1, and the most downregulated DEGs between P5/P3, meaning they had the greatest expression at P3.
GO analysis assessed biological processes and cellular components associated with DEGs (Fig. 2). DEGs downregulated with passaging were enriched for extracellular organization and skeletal system development for all passage combinations (Fig. 2A). In addition, DEGs downregulated between P5/P1 and P5/P3 were associated with connective tissue development (Fig. 2A, blue line). Biological processes upregulated in P5/P1 and P5/P3 were mainly associated with cell migration (Fig. 2B). DEGs upregulated between P3/P1 and downregulated between P5/P3 were associated with cell adhesion (Fig. 2A, B).
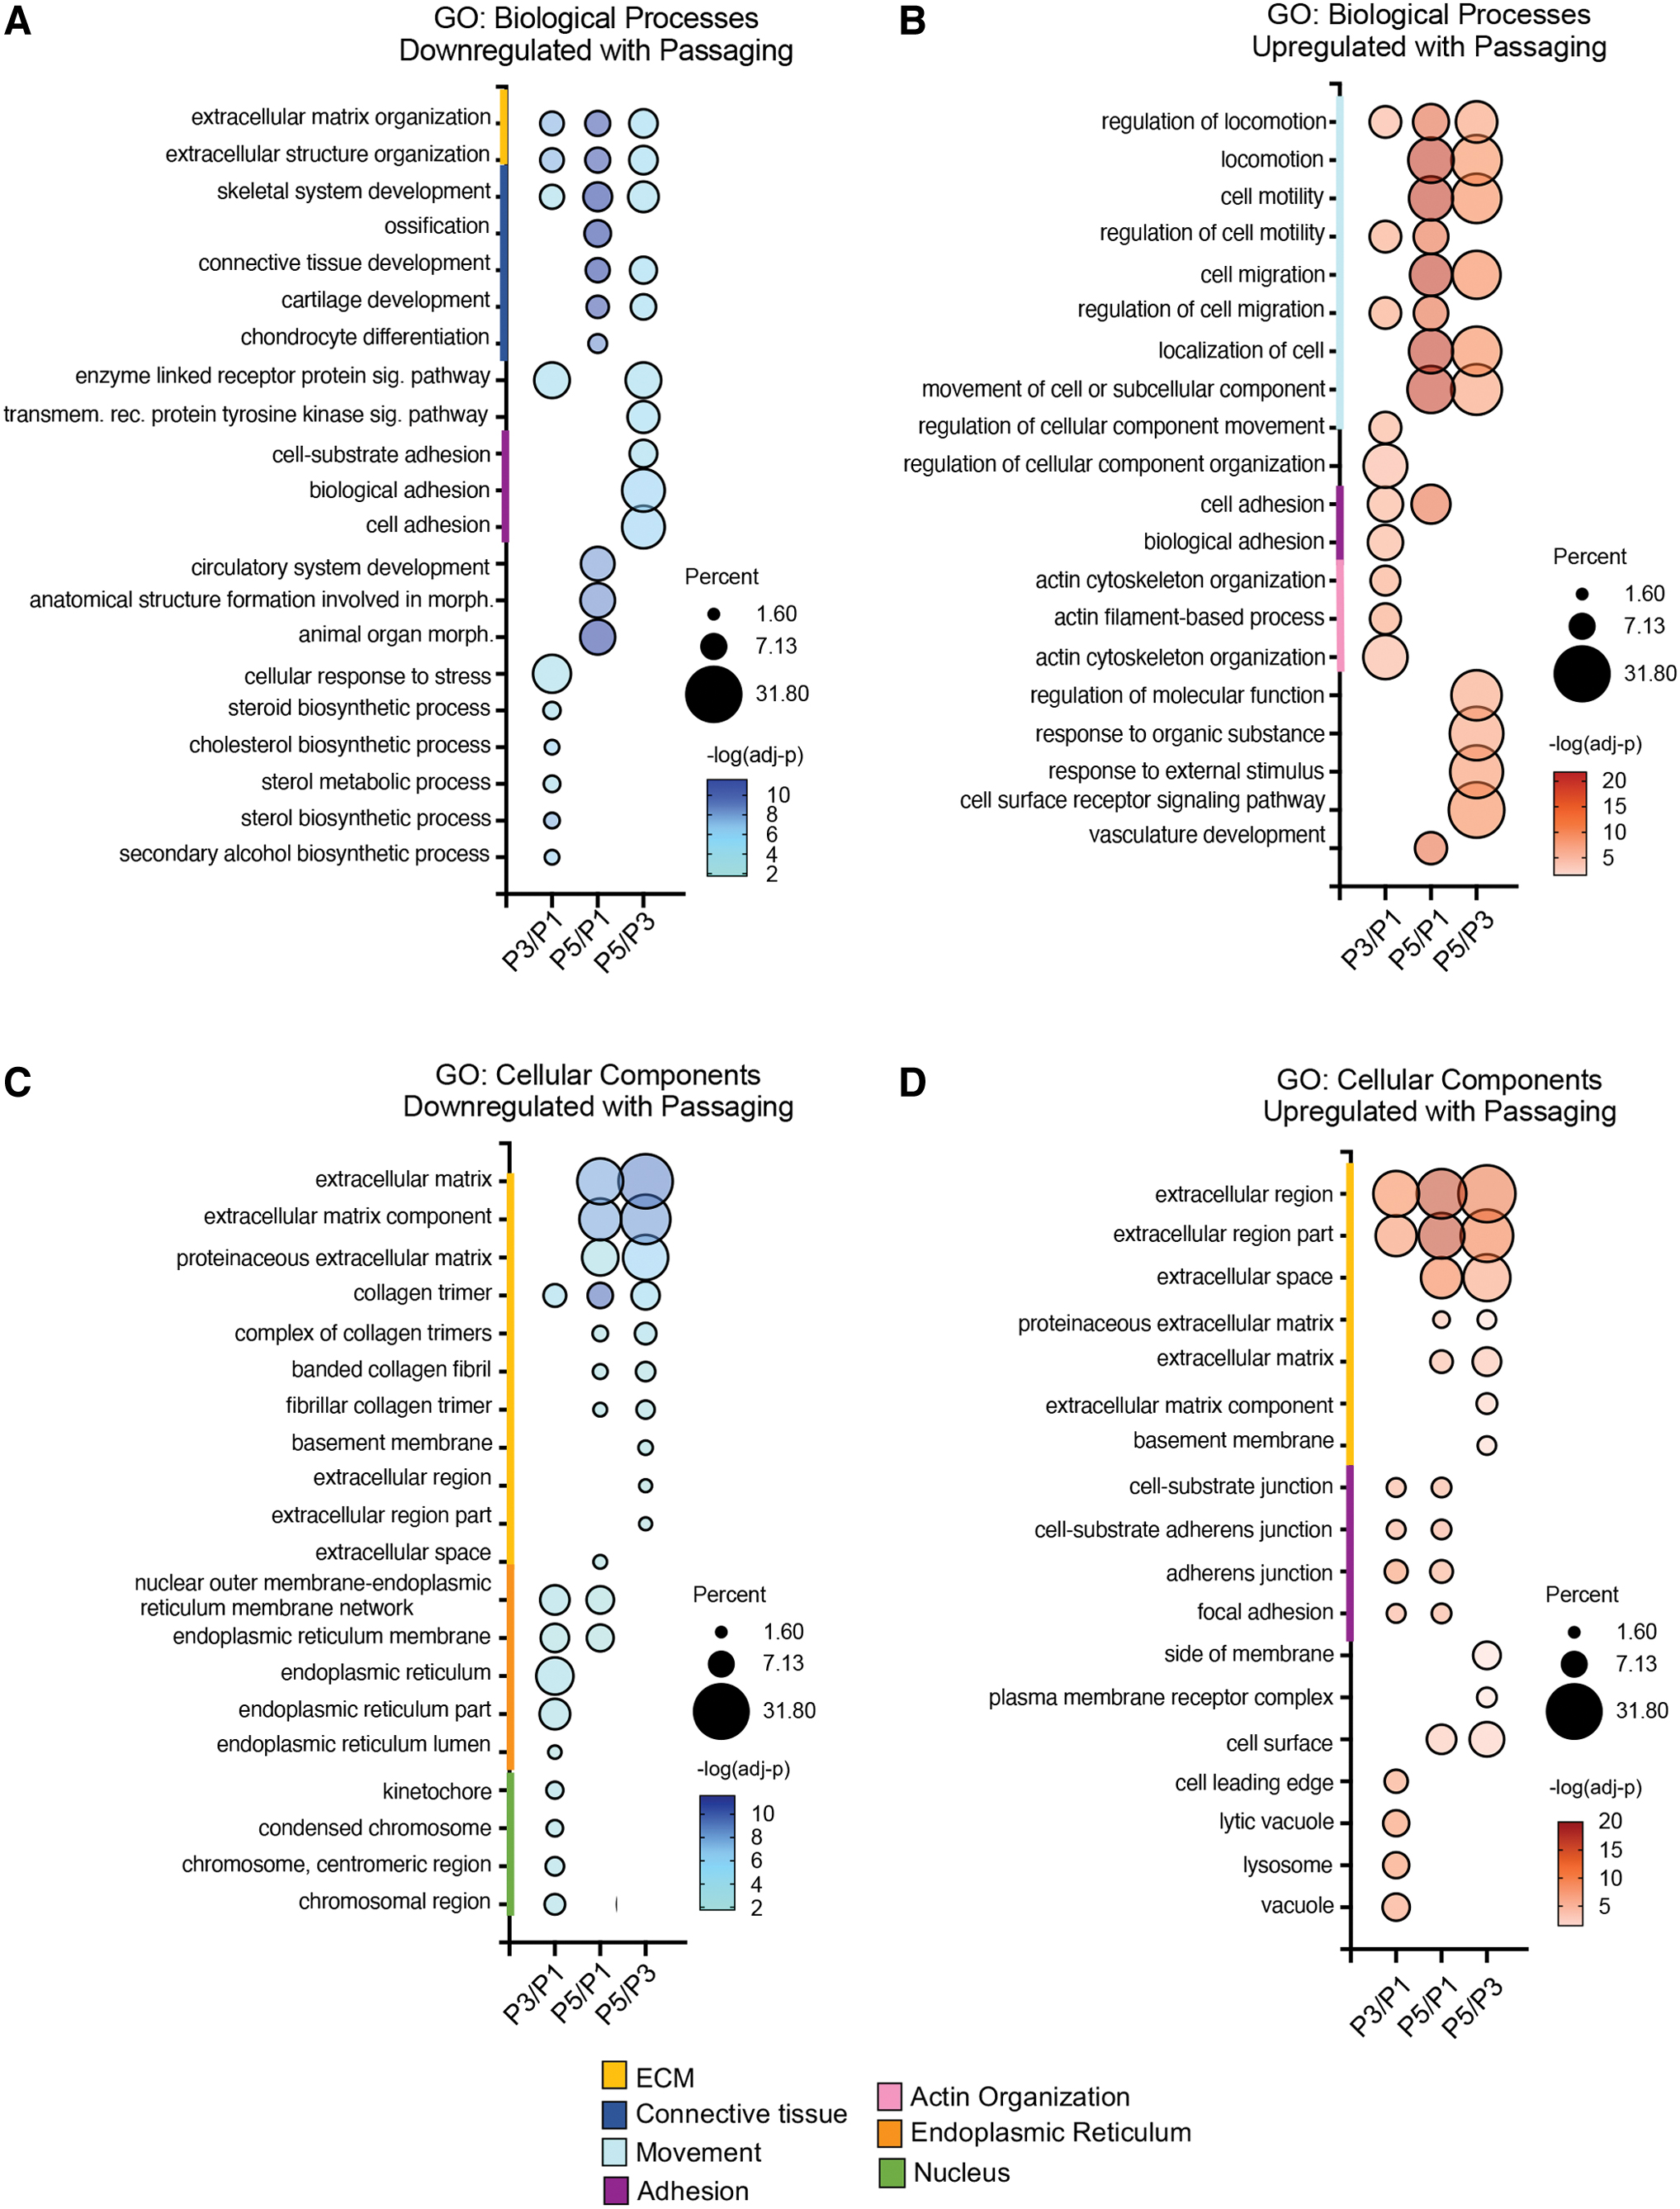
GO enrichment analysis of DEGs based on passage number. Dot plots show top 10 most significant biological processes and cellular components downregulated
When comparing cellular components associated with DEGs, DEGs downregulated between P3/P1 were enriched for nucleus and endoplasmic reticulum, and with the biological process, cholesterol biosynthesis (Fig. 2C, green and orange lines). Interestingly, proteinaceous extracellular matrix was among the most significant cellular components for downregulated and upregulated DEGs between P5/P1 and P5/P3. Focal adhesions and cell substrate junctions were enriched at P3 and P5 compared to P1 (Fig. 2D, purple line).
To gain insights into how transcriptional variations during monolayer expansion led to variations in tissue production, we examined how differential expression of genes related to extracellular matrix organization changed with passaging. Ninety-eight DEGs were identified as being significant in at least one passage combination (Fig. 3). Next, we compared DEGs related to cartilage development that showed significant differences with passage. We identified 93 genes that were significantly different between at least one combination of passages (Fig. 4). For both analyses, the greatest differences in gene expression were noted between P1 and P5. Since cells were cast for 3D culture at P3 and P5, we also separately examined significantly different gene expression between only these passages, which noted 38 genes associated with extracellular matrix organization and 32 genes associated with cartilage development (Supplementary Fig. S1).
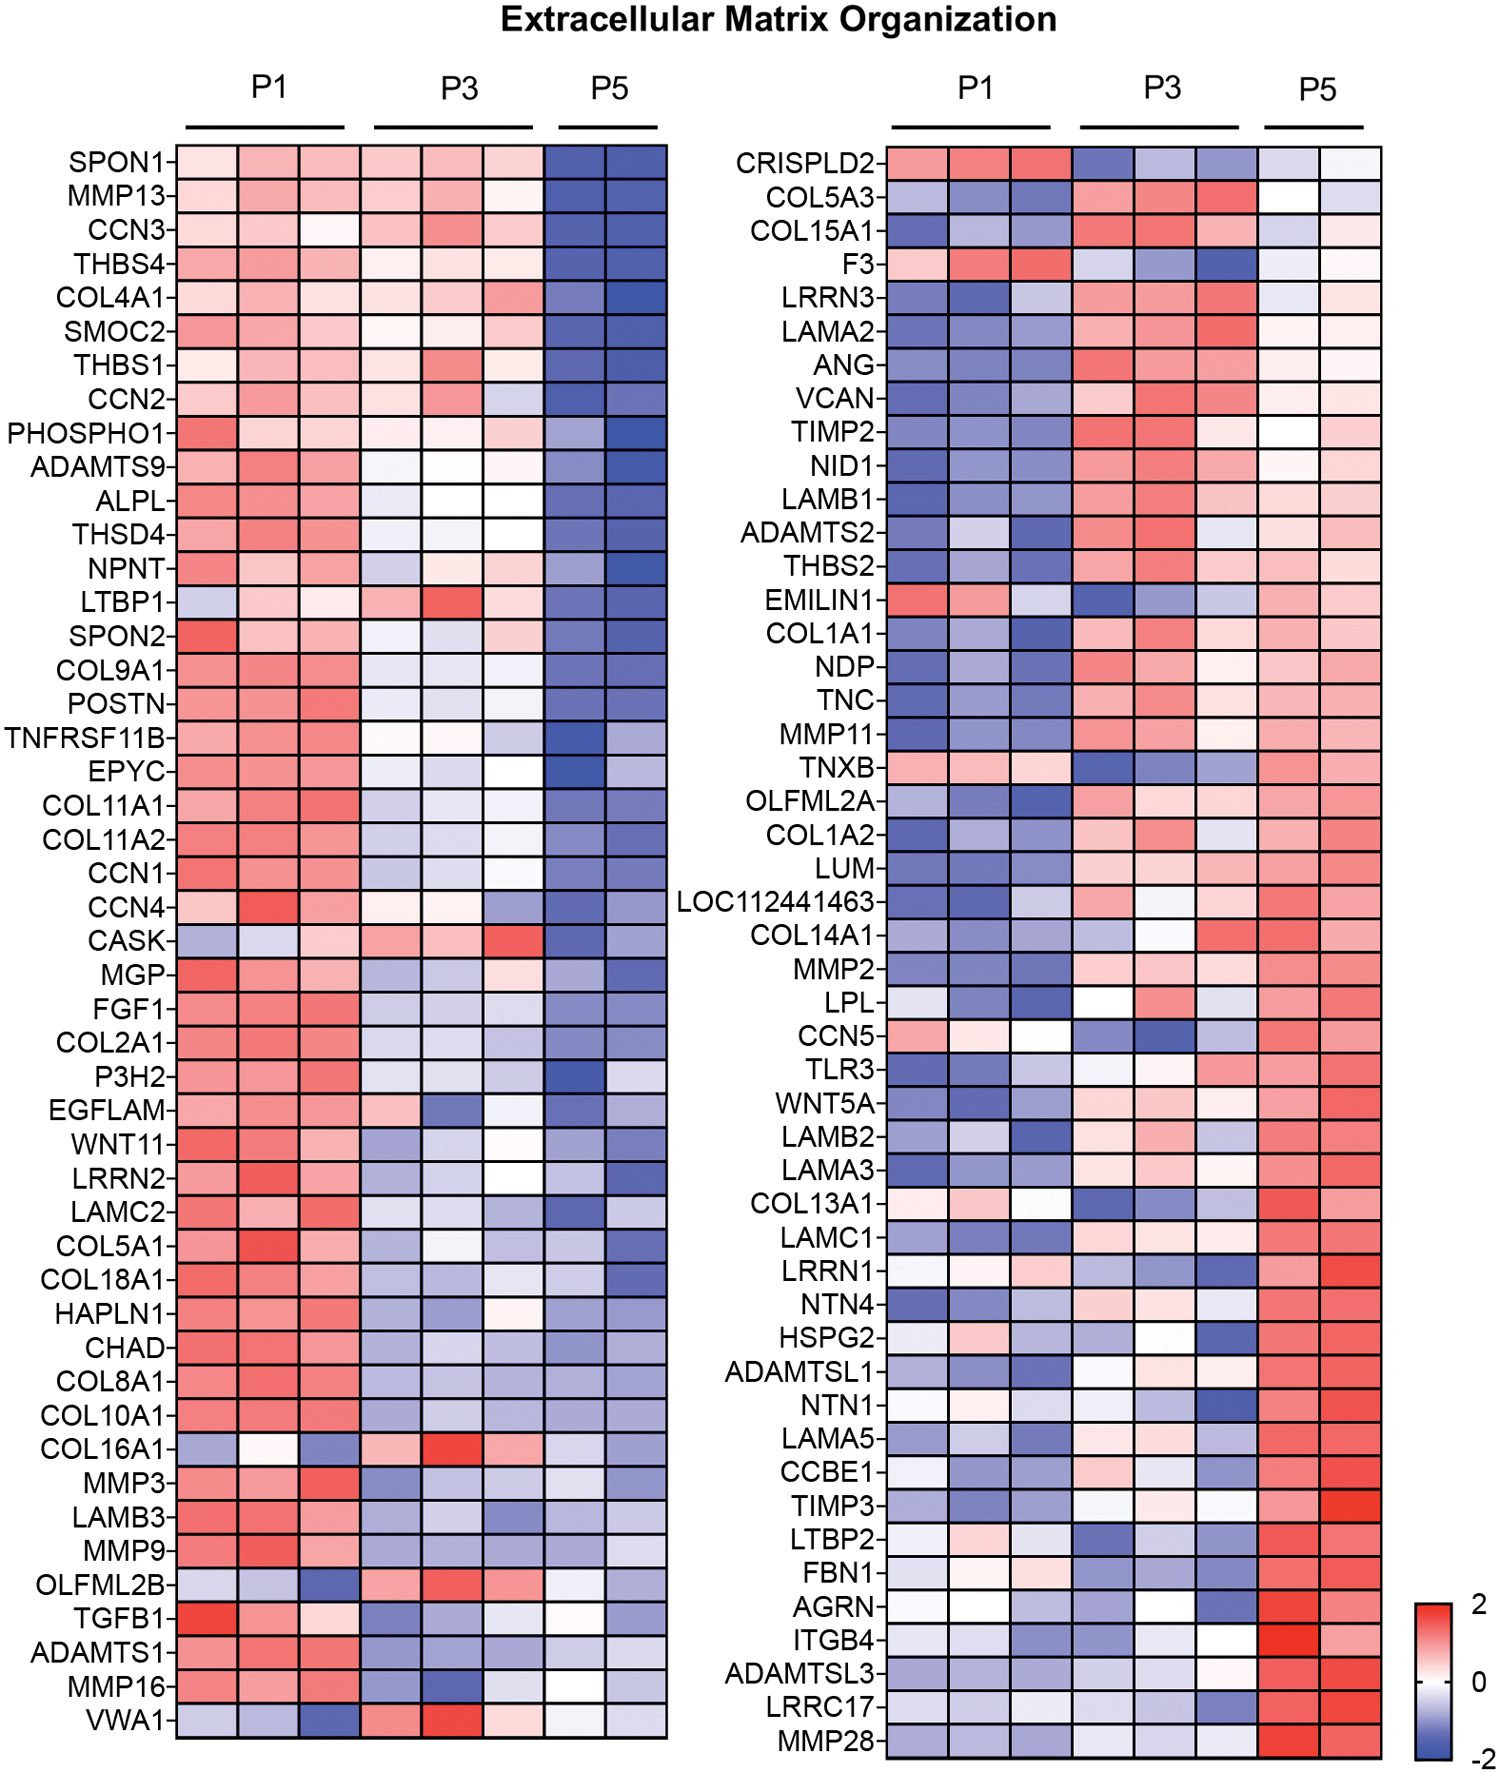
Upregulated (red) and downregulated (blue) DEGs related to the gene ontology term “extracellular matrix organization” based on passage number. Heat map illustrating DEGs significant in at least one passage combination. Heat maps show the z-scores of gene expression patterns for each DEG compared to all samples in that row, rows represent DEGs and columns represent samples. Color images are available online.
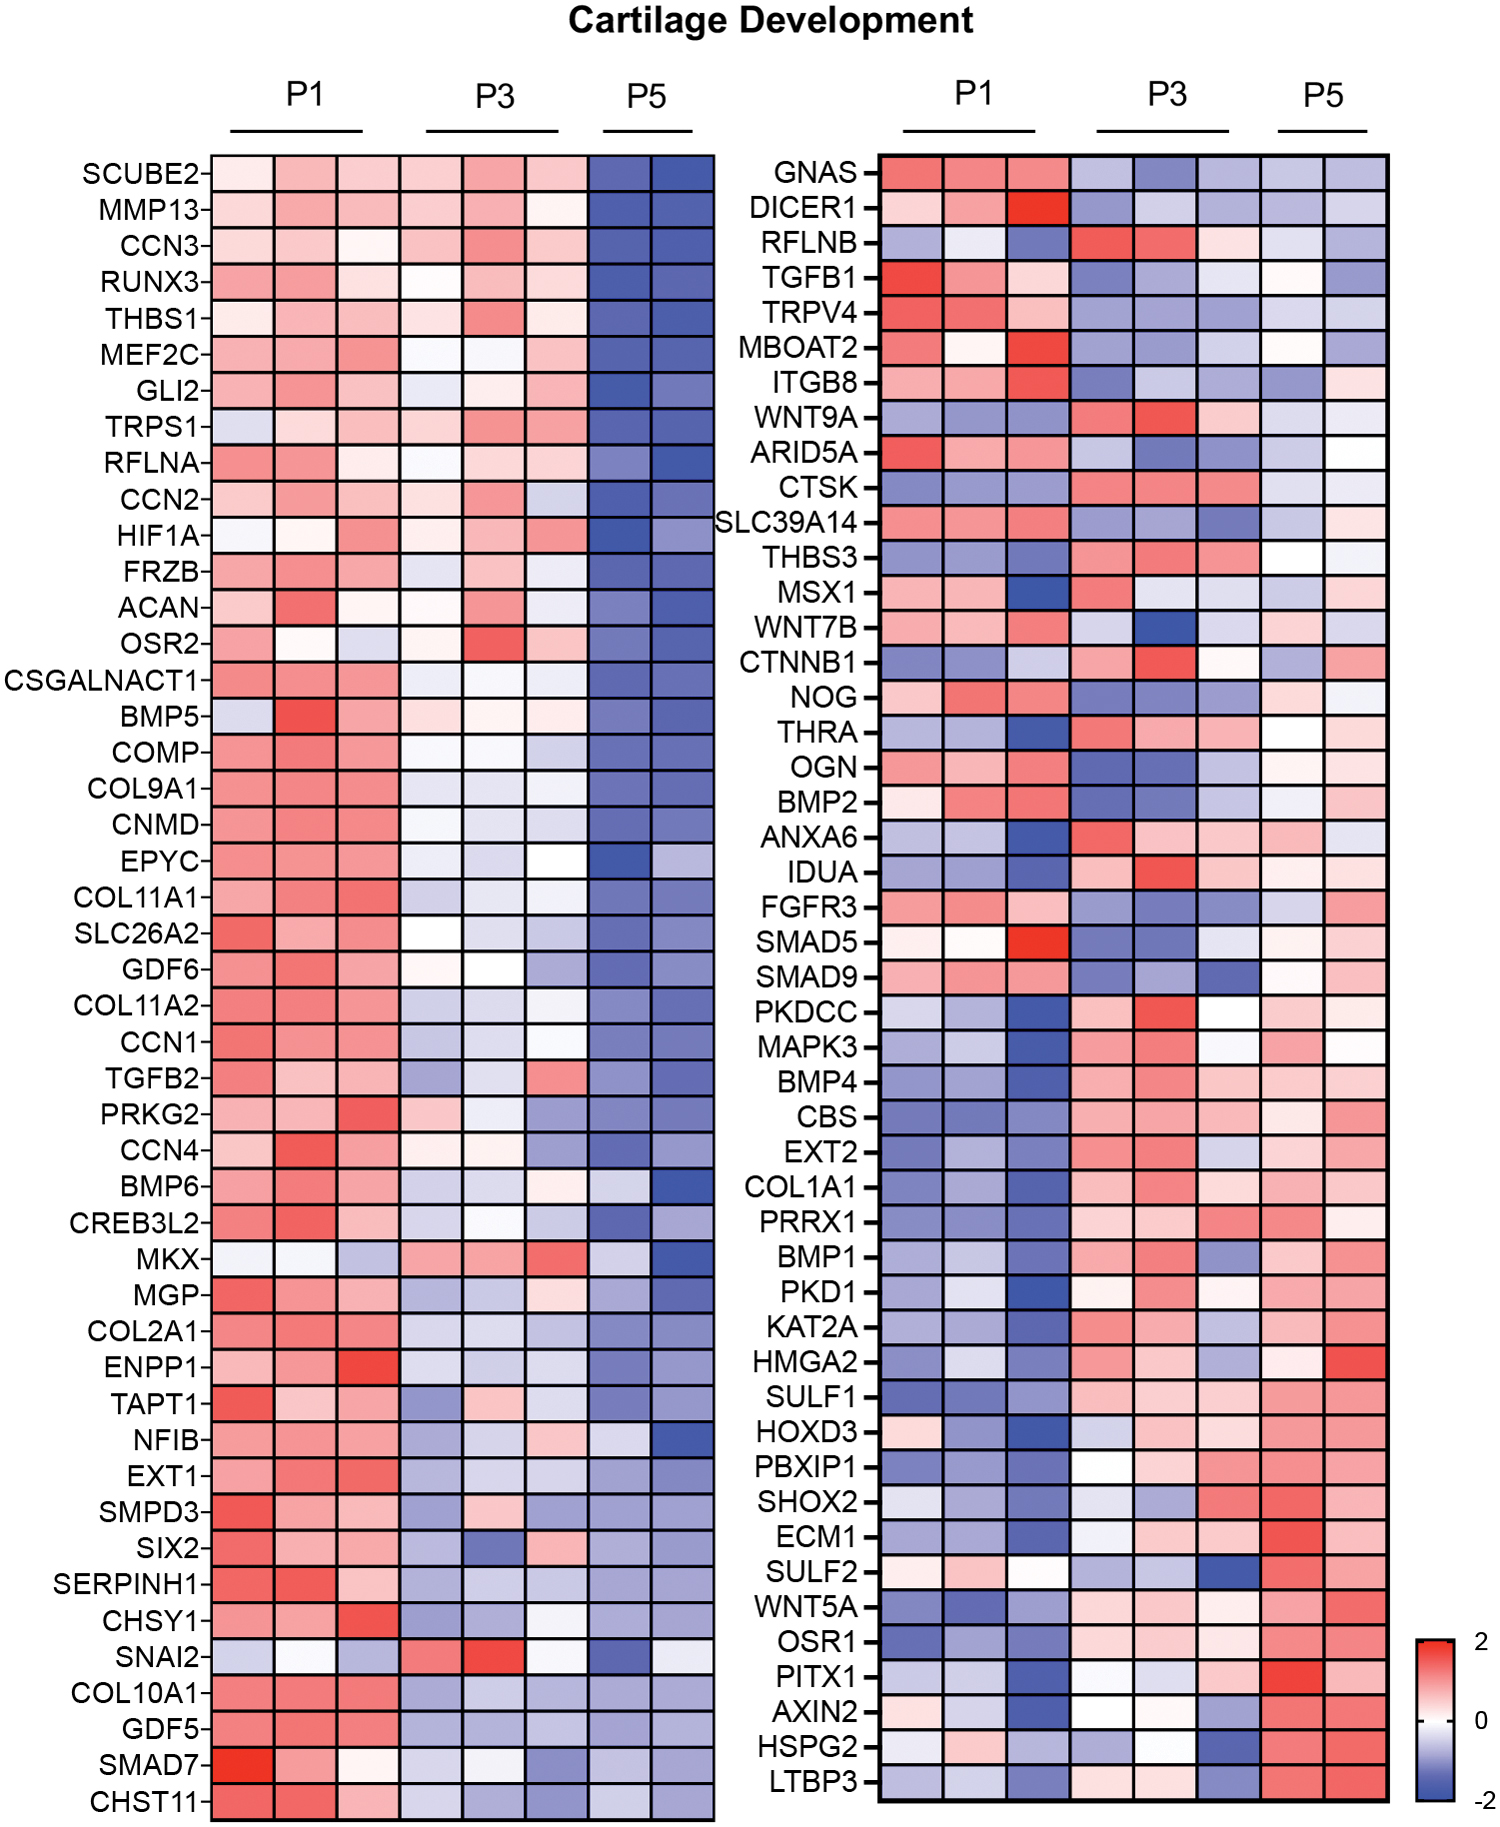
Heat maps illustrating upregulated (red) and downregulated (blue) DEGs related to the gene ontology term for “cartilage development” in at least one passage combination. Heat maps show the z-scores of gene expression for each DEG compared to all samples in that row, rows represent DEGs and columns represent individual samples. Color images are available online.
Human homologs were identified for genes differentially expressed during monolayer expansion culture of bovine chondrocytes for all passage combinations. Using MAGMA gene set enrichment analysis, all sets of DEGs were enriched for human hip and hip-knee OA (Table 1; Fig. 5).
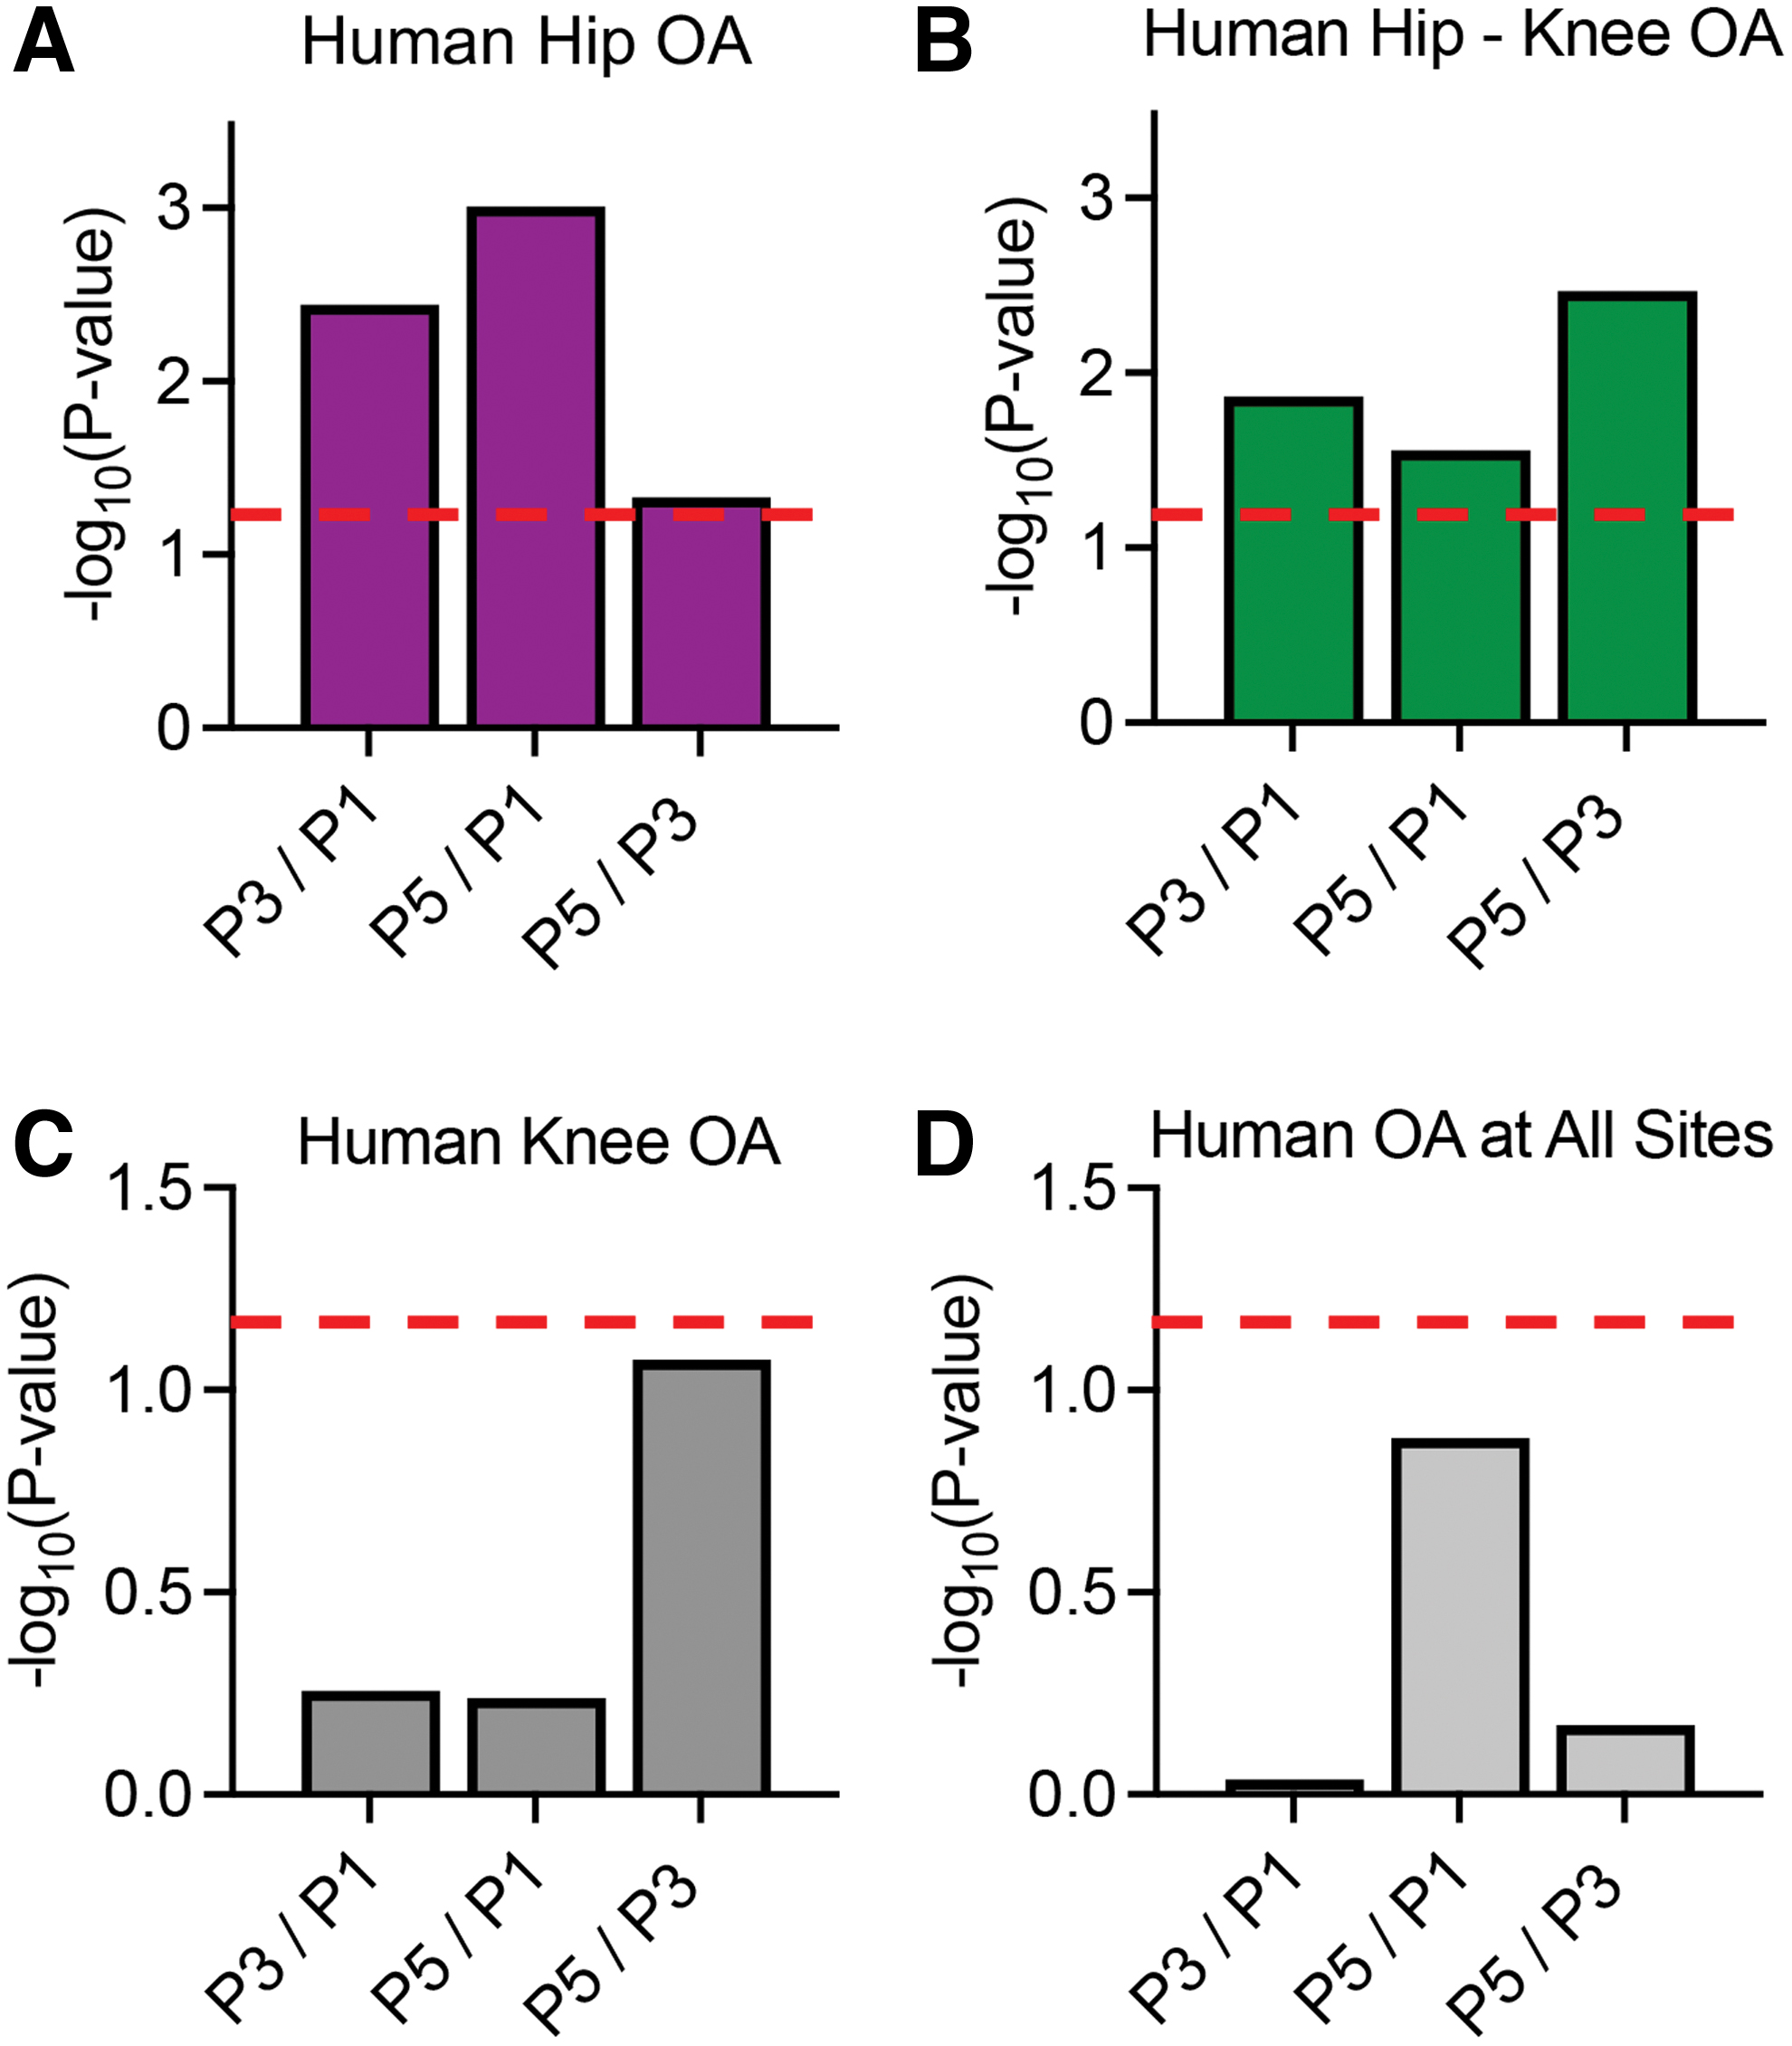
Gene set enrichment analysis was performed using DEGs from bovine RNA-seq data along with data from UK Biobank and arcOGEN GWAS. The bovine DEGs (FDR <0.01) were enriched for human
MAGMA UK Biobank Genome-Wide Association Study Enrichment Results for Human Hip Osteoarthritis and Hip-Knee Osteoarthritis Based on Bovine Gene Expression Data Sets
DEGs, differentially expressed genes; OA, osteoarthritis; sig, significant.
However, none of the data sets were significantly enriched for knee or OA at any site (Fig. 5C, D). Within the significantly enriched gene sets, the highest number of human homologs from the P3/P1 dataset was significantly associated with hip (13) and hip-knee OA (11; Table 1). All human homologs of bovine DEGs analyzed and the MAGMA results for hip and knee-hip OA can be found in Supplementary Tables S2 and S3, respectively. Bovine genes associated with human hip and hip-knee OA were visualized with volcano plots for all passage combinations (Fig. 6A–C). COL11A1, FGFR3, NISCH, TWF2, PPM1M, MFHAS1, and LMX1B were common to both OA datasets (Fig. 6A–C, black text).
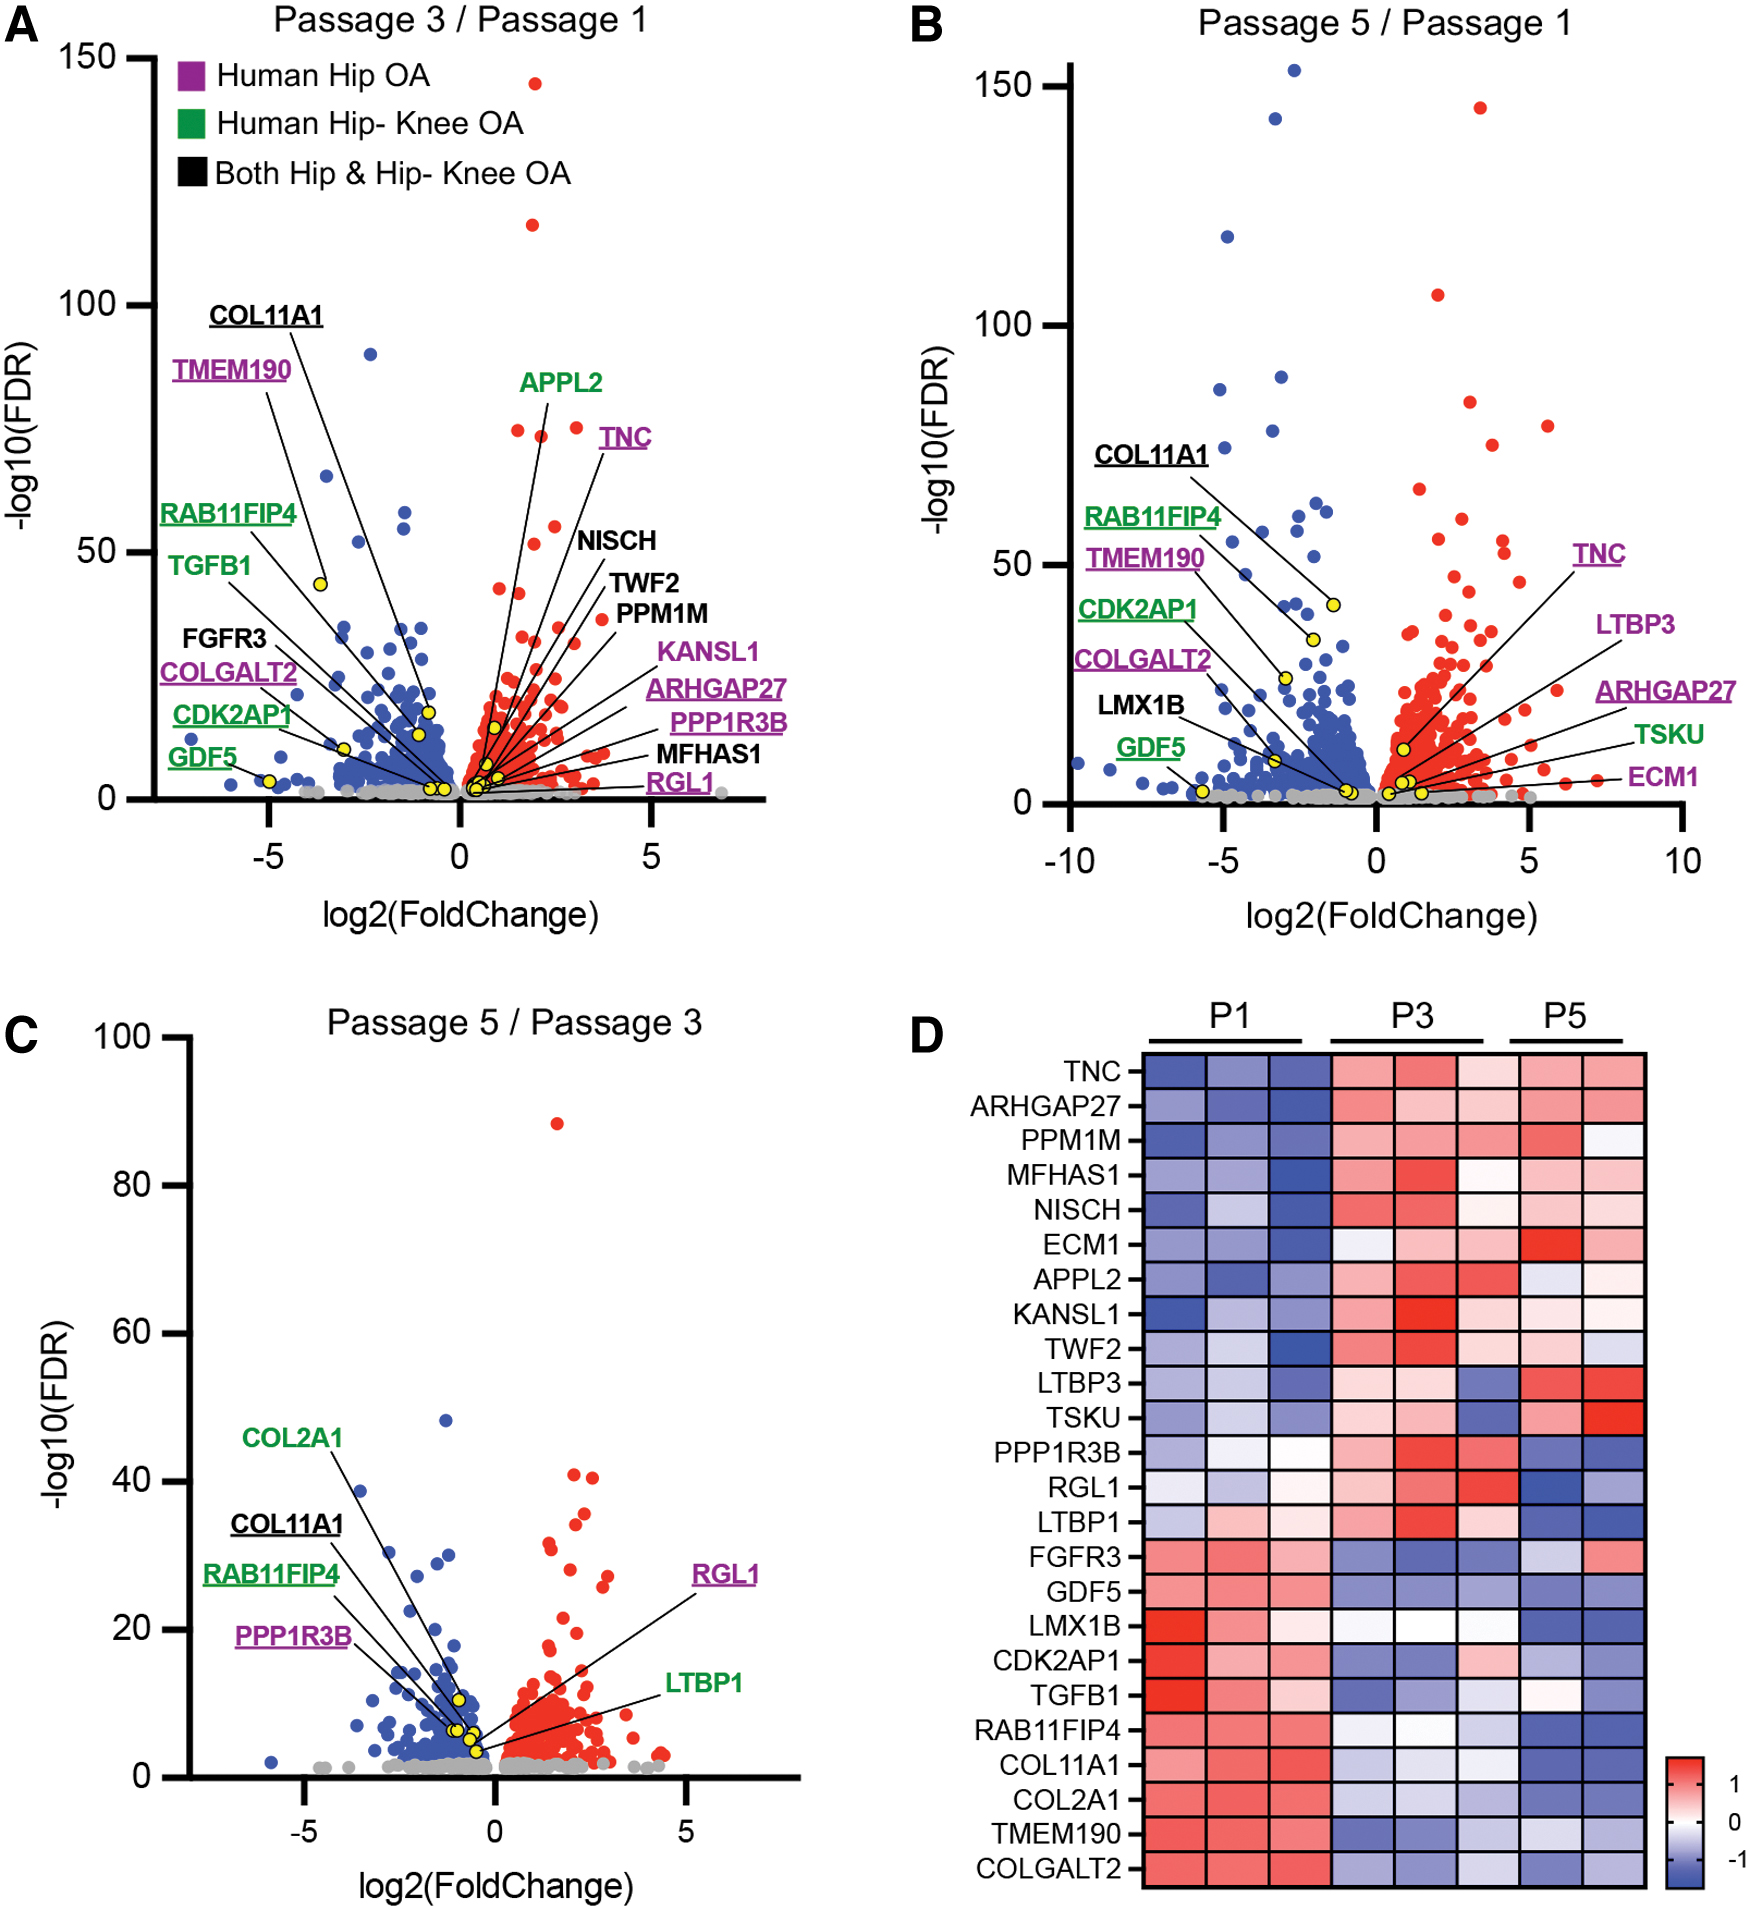
Significant human OA-associated genes from bovine dataset. Volcano plots show bovine homolog of significant upregulated (red) and downregulated (blue) OA-associated DEGs in
A few DEGs were identified in multiple passage combinations, including COL11A1, TMEM190, RAB11FIP4, COLGALT2, CDKAP1, GDF5, TNC, ARHGAP27, PPP1RB, and RGL1. In addition, all six bovine DEGs linked to human OA between P5/P3 were downregulated with passaging (Fig. 6C). Heat map analysis showed clear clustering between P1 compared to P3 and P5 for all DEGs (Fig. 6D). COL11A1 and RAB11FIP4 exhibited a distinct decrease in gene expression with passaging. Out of the 24 DEGs identified to be associated with human OA, 10 genes are involved in the cell surface receptor signaling pathway (APPL2, COL2A1, ECM1, FGFR3, GDF5, LTBP1, LTBP3, PPM1M, TGFB1, and TSKU), and these genes were also upregulated in P5 cells when compared to P3 cells (Fig. 2B).
Despite efforts to maintain consistent seeding density between groups, P3 constructs had a lower initial seeding density compared to P5 constructs (day 1 DNA: P3 = 8.14 ± 1.36 μg; P5 = 10.11 ± 0.73 μg; t-test p = 0.03; Fig. 7A). P3 constructs showed a consistent increase in DNA content through day 14 and plateaued after TGF-β3 supplementation ended. In contrast, DNA content of P5 constructs continued to increase through day 35. On day 35, there was no difference in construct water content (p = 0.056; Fig. 7B).
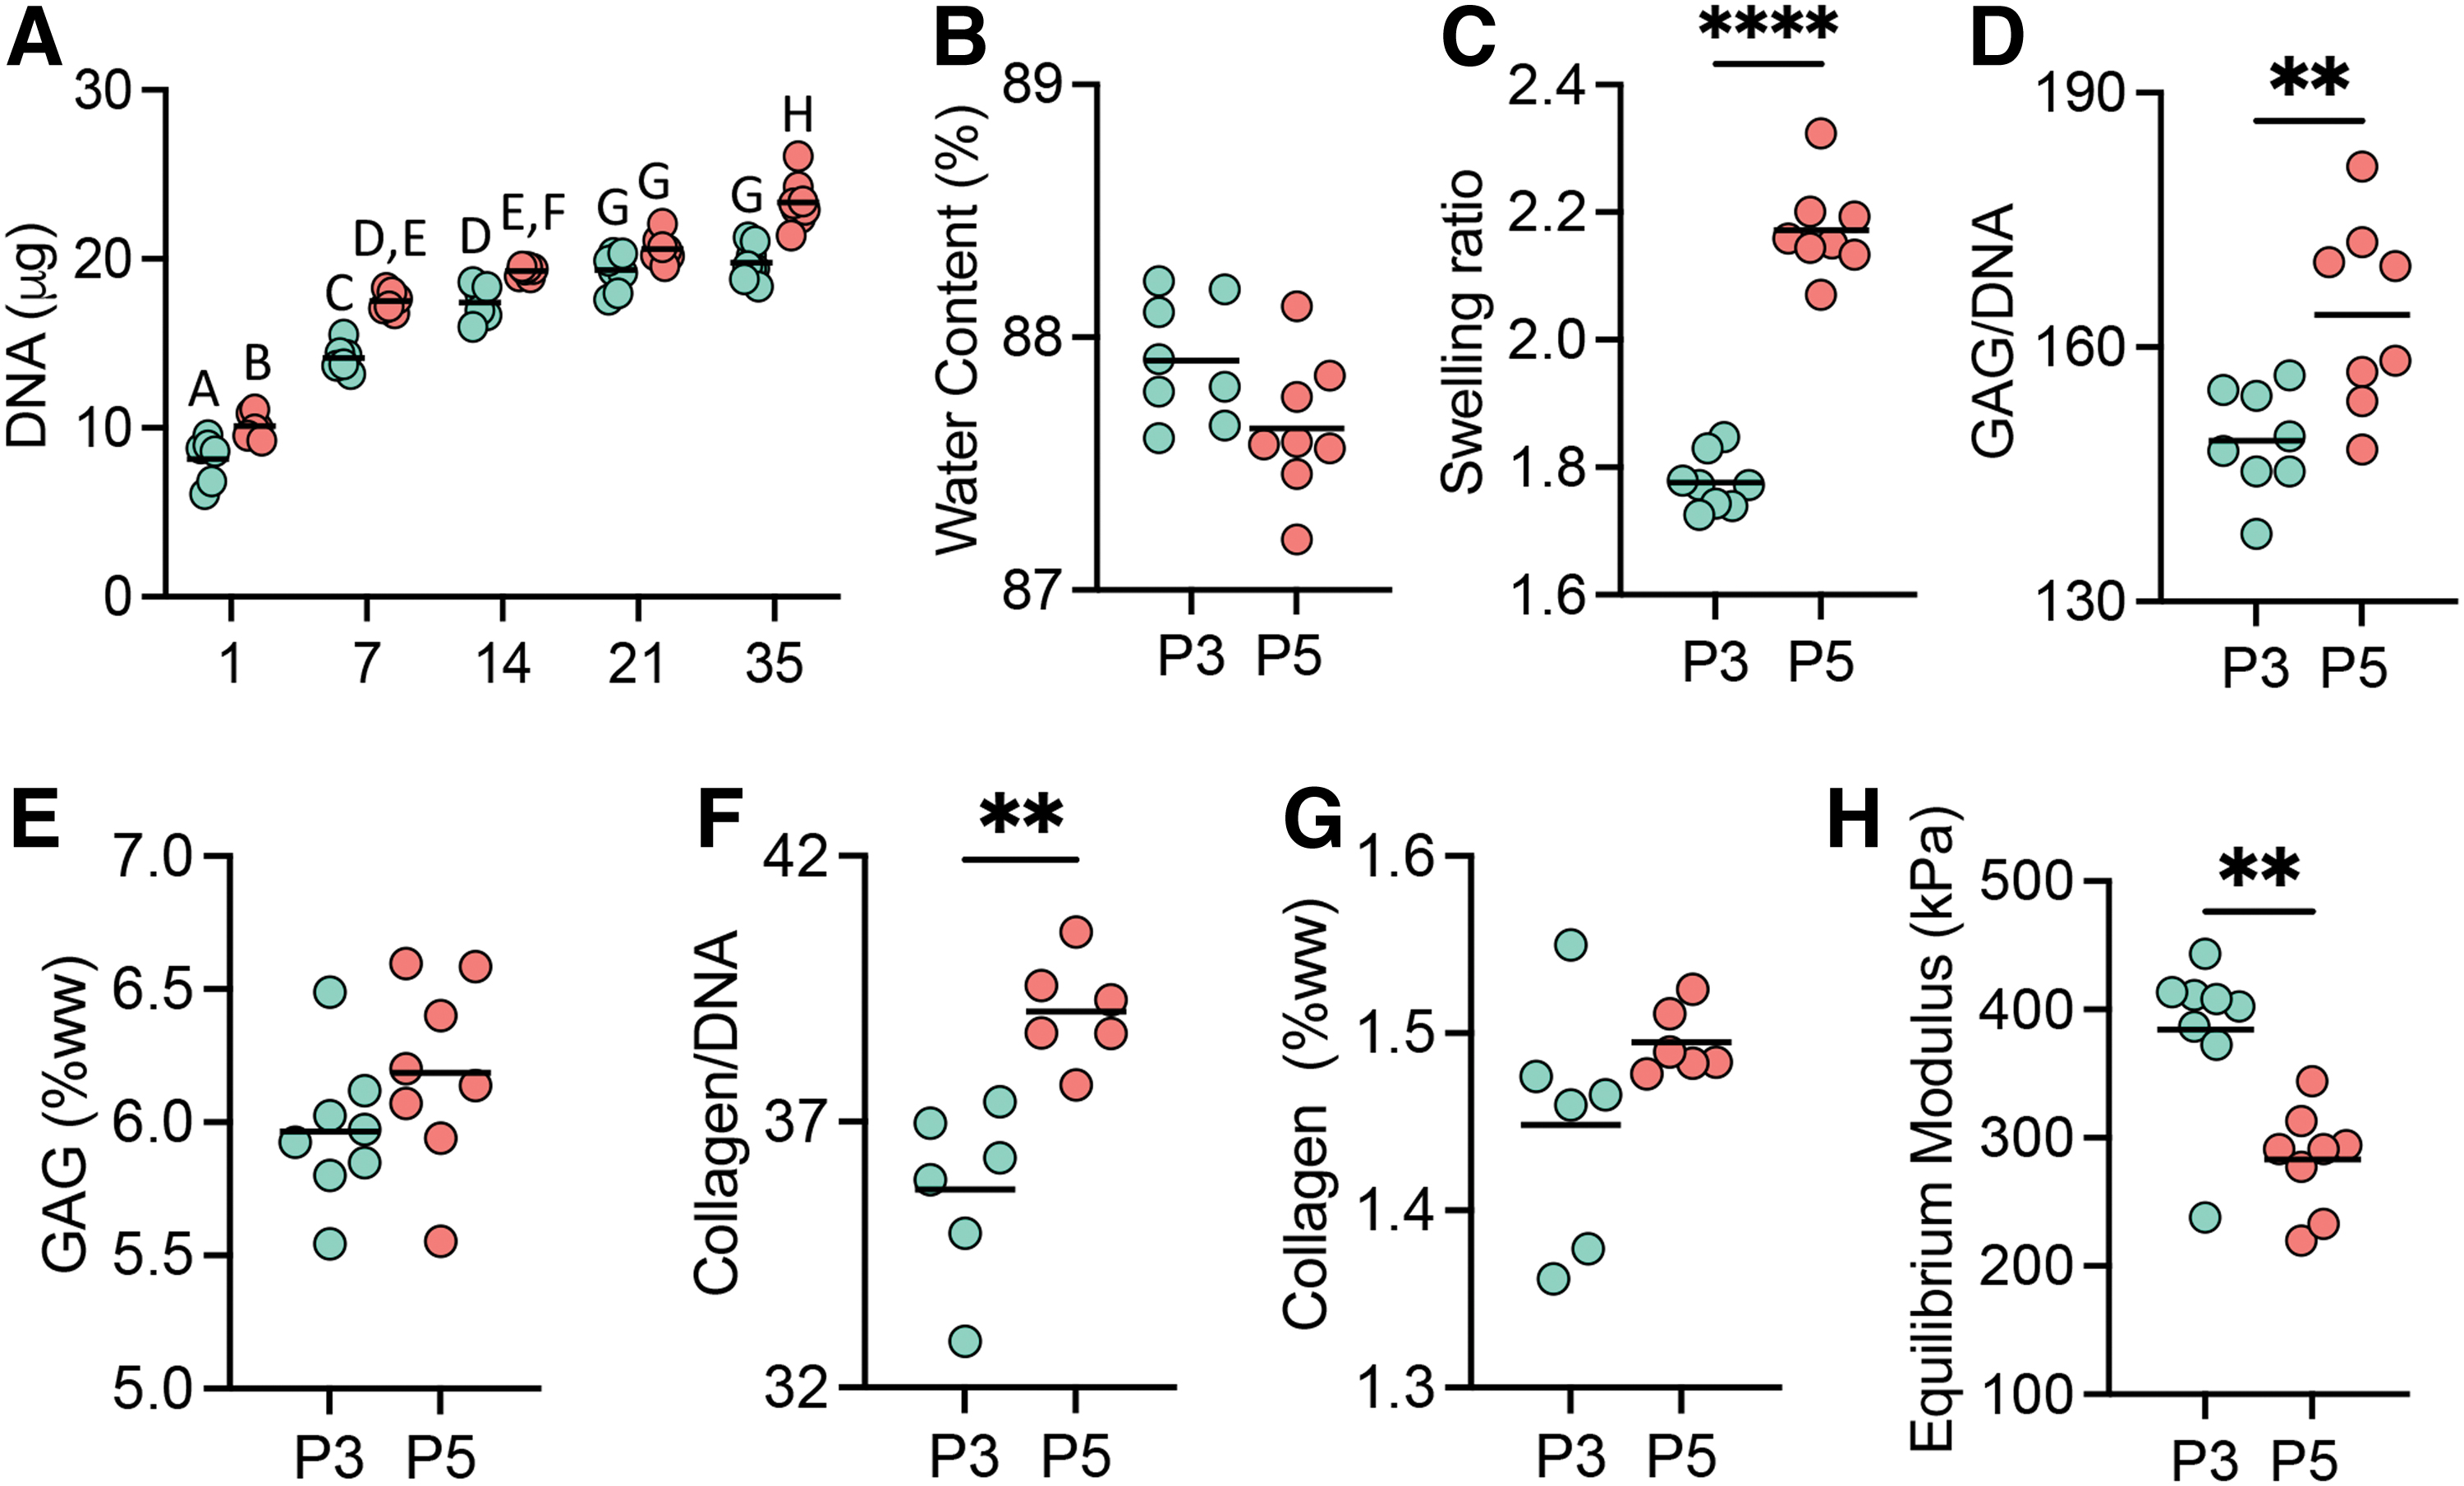
Engineered tissue production of P3 (teal) and P5 (orange) constructs after 35 days of 3D culture.
However, the SR of P5 constructs was 22% greater than P3 constructs (p < 0.0001; Fig. 7C), which we hypothesize to be due to greater dw for P5 constructs compared to P3 constructs (P3 = 6.0 ± 0.2 mg; P5 = 7.6 ± 0.3 mg). Greater GAG accumulation was observed in P5 constructs when normalized to DNA content (p = 0.0056; Fig. 7D), but GAG content normalized to ww was not significantly different (p = 0.18; Fig. 7E). In agreement with GAG production, P5 constructs had greater collagen content when normalized to DNA content (p = 0.0016), but not ww (p = 0.14; Figs. 7F, G). The equilibrium modulus was 18.6 ± 5.5 kPa on day 1. On day 35, the equilibrium modulus of P3 constructs was 384.5 ± 62.7 kPa, which was 26% greater than P5 constructs (283.0 ± 40.4 kPa p = 0.0018; Fig. 7H).
Discussion
Previous studies examined differences in gene expression during monolayer expansion; however, how changes in gene expression relate to differences in 3D tissue production are not well understood. Thus, we employed an unbiased approach to explore genome-wide transcriptional differences in chondrocyte phenotype at P1, P3, and P5. Subsequently, we embedded cells in agarose at P3 and P5 to assess cells' abilities to produce extracellular matrix.
Our analysis revealed distinct phenotypical differences, specifically for genes related to extracellular matrix organization and cartilage development. Both P3 and P5 chondrocytes demonstrated the ability to produce chondrogenic tissue in 3D culture. Notably, P3 cells produced matrix with greater compressive mechanical properties, and P5 cells secreted matrix with higher GAG/DNA and collagen/DNA ratios. Furthermore, we identified 24 genes that were differentially expressed with passaging and enriched in human GWAS OA studies, which may prioritize them for additional functional studies to improve protocols to recapitulate healthy functional cartilage with cells from adult donors for clinical procedures such as MACI.
Our findings revealed a significant increase in cell substrate adhesion and greater F-actin stress fiber formation between P1 and later passages, which are known markers of chondrocyte dedifferentiation during in vitro expansion culture.10,21,22,35 Specifically, GO analysis findings showed an upregulation of cell-substrate junction pathways in P3 and P5 cells compared to P1, which is consistent with dedifferentiated chondrocytes having greater adhesion to plastic. Pathways for actin cytoskeletal organization were significantly upregulated by P3 (e.g., Fig. 2B for P3), with no difference in actin formation between P3 and P5 cells. These results suggest that mechanosensitive cytoskeletal remodeling may have taken place by P3 as the cells respond to the stiff, two-dimensional (2D) culture environment.
RNAseq results from 2D expansion culture provide some insight into molecular variations, which may contribute to differences in construct behavior. Our findings revealed significant differences in the gene expression of collagens and proteoglycans, cartilage's primary structural components, between chondrocytes at P3 and P5. Consistent with previous literature, we observed greater expression of COL2A1, the well-known marker for hyaline cartilage, at P3 than P5.8,36 Interestingly, no significant difference was observed in gene expression of COL1A, a distinctive marker for fibrocartilage that has previously been shown to increase in expression with passaging in human chondrocytes. 36 Gene expression of COL9A1, which stabilizes cartilage matrix by connecting collagen fibrils, such as COL2A1, to other noncollagenic matrix components, such as cartilage oligomeric matrix protein,37,38 was among the most significantly downregulated genes for each passage combination.
In addition, we identified significant differences in the expression of genes regulating the collagen metabolic processes, including MMP2, MMP13, MMP28, and TNXB. Expression of MMP13 is of particular interest as it has a predominant role in OA, degrading both collagen and aggrecan. 39 Conflicting results have been found regarding MMP13 expression during expansion culture.11,40 However, our findings show greater expression of MMP13 at P3, which corresponded to the production of tissue with lower collagen/DNA content ratio when compared to P5 constructs. While these findings are interesting, future RNAseq studies on the constructs are needed to fully understand the relationship between the gene expression during 2D culture and the 3D tissue production.
Further analysis of differences in gene expression between P3 and P5, the passages at which cells were cast for 3D culture, revealed no significant difference in gene expression of aggrecan (ACAN) or versican (VCAN), which are markers of differentiated and dedifferentiated chondrocytes, respectively. However, we found an upregulation of proteoglycans, agrin (AGRN) and heparin sulfate proteoglycan 2 (HSPG2), with greater expression at P5 compared to P3. AGRN is expressed in healthy cartilage and downregulated with OA, 41 while HSPG2 is essential for cartilage development and plays an important role in collagen fibril and GAG organization. 42 P5 cells, which had greater expression of AGRN and HSPG2, produced greater GAG/DNA than P3 cells, but further investigation is needed to determine whether these genes played a role in the increased GAG accumulation in 3D culture.
In this study, chondrocytes passaged both to P3 and P5 demonstrated the ability to produce engineered tissue containing collagen and GAG in 3D culture. Prior studies showed a correlation between compressive stiffness and GAG content, which both tend to increase with culture time. In this study, no difference was observed between constructs seeded with primed or unprimed cells when GAG was normalized by ww; however, unexpected results were observed related to differences in cell activity with GAG production and its relationship to compressive stiffness. Specifically, P5 constructs exhibited greater GAG accumulation per cell, but this did not result in greater compressive mechanical properties when compared to P3 constructs.
An explanation for these inconsistencies may lie in the quality and type of proteoglycans produced, which may have contributed to notable differences in construct SR. Future work is needed to conduct more specific protein expression analysis. Second, prior research has yielded inconsistent findings regarding whether chondrocytes become irreversibly dedifferentiated during monolayer expansion, limiting the ability of chondrocytes at higher passages to produce de novo tissues.
These variations in chondrocyte redifferentiation capabilities may be attributed to species variations. For example, human chondrocytes at higher passages (beyond P4) have exhibited a limited ability to generate de novo tissue.43–47 Conflicting results also exist for chondrocytes sourced from juvenile animals, where some studies showed that chondrocytes were able to redifferentiate to produce cartilaginous tissue at higher passages,48–50 while others have not. Our results support that bovine chondrocytes could produce engineered tissue at passage 5, even exhibiting greater GAG/DNA and collagen/DNA than constructs at P3. Future work is imperative to further understand the chondrogenic quality of the tissue and determine if these discrepancies observed between chondrocyte ability to produce engineered tissue at higher passages are species or age specific.
By analyzing both differences in gene expression during expansion culture and bulk differences in tissue production, we identified key genes that could potentially be modulated to improve success of chondrocyte culture for tissue regeneration. Our findings showed that secreted cell adhesion protein, periostin (POSTN), was among the most significantly downregulated gene at each passage combination, suggesting the expression of POSTN decreases with chondrocyte dedifferentiation. POSTN has been identified as an antiadhesion molecule, counteracting the adhesion functions of fibronectin and type I collagen, 51 and is thought to promote cell proliferation and migration. 52
Our previous work showed that POSTN was upregulated in cells primed with growth factors during expansion cultured compared to cells cultured in serum-only media, and that primed cells exhibited reduced cell adhesion and greater cell proliferation. 22 To our knowledge, POSTN has not been previously linked to chondrocyte dedifferentiation and may play an important role in cell adhesion or proliferation during expansion culture.
Another notable gene identified that should be further investigated for its role in chondrocyte dedifferentiation and tissue regeneration is TMEM190, which was among the top 10 most significant downregulated genes at P3 compared to P1 and was shown to be associated with human hip-knee OA. Previously, TMEM190 was identified as one of the most significantly downregulated genes between adult primary human nucleus pulposus cells cultured on soft substrate (∼0.5 kPa) and cells cultured on stiffer polystyrene (∼1 GPa). 53 Many similarities exist between nucleus pulposus cells and chondrocytes, including a shift toward a fibroblast-like morphology when cultured on stiff tissue culture plastic and maintenance of gene expression profiles when cultured on soft substrates. 54
Findings from our study showed that TMEM190 expression increased with passaging, which was associated with increased adhesion, cell spreading, F-actin stress fiber development, and human hip OA. TMEM190 was also identified in single-cell sequencing of cells from patients undergoing knee arthroplasty. 55 Taken together, these results suggest TMEM190 may be associated with cellular response to matrix stiffness and play an important role in chondrocyte dedifferentiation or OA.
While analysis of the most upregulated or downregulated genes, or of well-known genes in chondrocyte differentiation or OA is informative, our “bovine to human” enrichment analysis additionally prioritized genes with both established and understudied functions in chondrocytes. For example, collagen type XI alpha1 chain (COL11A1) and RAB11 family interacting protein 4 (RAB11FIP4) are enriched with passaging and associated with hip-knee OA. COL11A1 is associated with cartilage-specific extracellular matrix, and several GWAS studies have linked single nucleotide polymorphisms in COL11A1 to OA.56,57 RAB11FIP4 is a member of the Rab11 family interacting proteins and plays a crucial role in many physiological functions, including proliferation, differentiation, and immunity.58,59
Furthermore, alterations in RAB11FIP4 expression in chondrocytes were previously found in a study examining genome-wide DNA methylation profiles between human primary chondrocytes expanded in 2D monolayer culture and then cultured in 3D, compared to their respective autologous, macroscopically unaffected cartilage. Bomer et al. found transcriptionally active hypermethylation of a RAB11FIP4-annotated differentially methylated region in cartilage grown from expanded primary human chondrocytes compared to the control cartilage. 60 Specifically, a negative correlation between DNA methylation and RAB11FIP4 expression was observed. Consistently, our analysis identified decreased RAB11FIP4 expression with culture, suggesting that it may be a transcriptional marker for chondrocyte dedifferentiation and should be further investigated to better understand its functional roles in chondrocytes and in OA.
There are some limitations to this work. First, there are many factors that may alter cell behavior during cell isolation and expansion, which were not assessed here, including medium osmolarity, plating density, and medium pH. To focus on assessing the impact of passaging chondrocytes, these variables were kept fixed throughout this study, and it was assumed that the cells from young healthy bovines had normal chondrocyte morphology. However, a recent study by Styczynska-Soczka et al. showed that chondrocytes from healthy “normal” cartilage may have abnormal morphology. 61 Second, while there were large differences observed through gene expression, future work is needed to assess how these differences relate to differences in specific protein production, and whether observed differences are consistent through a larger donor population. While portions of data shown in this study replicate previous observations,32,62 the entire study and all subexperiments were not repeated in its entirety.
Thus, translation of the findings from this study will require multiple study repeats to understand whether these findings translate to population-based observations for human chondrocytes from donors of varying age, body mass index, disease state, and so on. Moreover, bovine chondrocyte gene expression showed closer connection to human hip OA, even though the cells were obtained from knee joints. It is possible that human hip and knee OA pathogenesis differ in their contribution from genetic factors and mechanical injury. That is, knee OA GWAS may be more related to mechanical injury, while hip OA may be a better reflection of genetic factors. Finally, this study only examined total GAG and collagen protein expression levels in 3D culture. Therefore, future research is needed to more specifically evaluate the quality and types of proteins produced, as the constructs likely contain proteins characteristic of hyaline cartilage, such as type I collagen.
In summary, this study investigated differences in gene expression of chondrocytes from juvenile bovines during expansion culture and engineered cartilage production of these cells in 3D scaffolds. Findings from this study suggest that many known genes associated with chondrocyte dedifferentiation and OA development were enriched during passaging; however, chondrocytes were still able to produce de novo engineered cartilaginous tissue. Furthermore, we prioritized genes that are differentially expressed with passaging, such as TMEM190 and RAB11FIP4, which are enriched with hip-related OA and may play an important role in chondrocyte dedifferentiation. Therefore, this work established the groundwork for investigating several pathways and genes that could be manipulated during expansion culture to enhance engineered cartilage tissue production.
Footnotes
Acknowledgments
We would like to thank Amanda Glazer, PhD, for her help with statistical analysis and limitations.
Authors' Contributions
E.D.L. contributions include study design and ideation, data collection, data analysis, data interpretation, and writing. S.K. contributions include conceptualization, data analysis, and interpretation. A.A.J. contributed to study design and clinical translation. T.A. contributed to study design, data analysis, data interpretation, and writing. G.D.O. contributed to study design and ideation, data analysis, data interpretation, and writing. All authors contributed to editing the article.
Author Disclosure Statement
There are no competing interests to disclose.
Funding Information
This work was supported by the National Institutes of Health National Institute of Arthritis and Musculoskeletal and Skin Diseases (NIH NIAMS R21 AR072248, G.D.O.). Additional funding was provided by the National Science Foundation Graduate Research Fellowship Program (EDL) and we thank UCSF Functional Genomics Core for their assistance with RNA sequencing.

References
Supplementary Material
Please find the following supplemental material available below.
For Open Access articles published under a Creative Commons License, all supplemental material carries the same license as the article it is associated with.
For non-Open Access articles published, all supplemental material carries a non-exclusive license, and permission requests for re-use of supplemental material or any part of supplemental material shall be sent directly to the copyright owner as specified in the copyright notice associated with the article.
