




Abstract
A mino acids are the essential building blocks for collagen and proteoglycan, which are the main constituents for cartilage extracellular matrix (ECM). Synthesis of ECM proteins requires the uptake of various essential/nonessential amino acids. Analyzing amino acid metabolism during chondrogenesis can help to relate tissue quality to amino acid metabolism under different conditions. In our study, we studied amino acid uptake/secretion using human mesenchymal stem cell (hMSC)-based aggregate chondrogenesis in a serum-free induction medium with a defined chemical formulation. The initial glucose level and medium-change frequency were varied. Our results showed that essential amino acid uptake increased with time during hMSCs chondrogenesis for all initial glucose levels and medium-change frequencies. Essential amino acid uptake rates were initial glucose-level independent. The DNA-normalized glycosaminoglycans and hydroxyproline content of chondrogenic aggregates correlated with cumulative uptake of leucine, valine, and tryptophan regardless of initial glucose levels and medium-change frequencies. Collectively, our results show that amino acid uptake rates during in vitro chondrogenesis were insufficient to produce a tissue with an ECM content similar to that of human neonatal cartilage or adult cartilage. Furthermore, this deficiency was likely related to the downregulation of some key amino acid transporters in the cells. Such deficiency could be partially improved by increasing the amino acid availability in the chondrogenic medium by changing culture conditions.
Impact Statement
Human mesenchymal stem cells (hMSCs) are a promising cell source for cartilage tissue engineering (TE). However, the state-of-the-art cartilage TE still falls short of clinical expectations as the engineered tissue differs from native hyaline cartilage, especially in extracellular matrix (ECM) content and composition. Amino acids are the building blocks for proteins and are critical for cartilage ECM synthesis. Despite their importance, to our knowledge, no studies investigated amino acid uptake during hMSCs chondrogenesis. This study reports amino acid uptake during in vitro chondrogenesis using hMSCs aggregate system.
Introduction
Human mesenchymal stem cells (hMSCs) are a promising cell source for cartilage tissue engineering (TE).1–3 Diseases such as osteoarthritis could be treated if the therapeutic potential of hMSCs is exploited to regenerate patient-specific cartilage tissue.4–6 However, the state-of-the-art cartilage TE still falls short of clinical expectations as the engineered tissue differs from native hyaline cartilage, especially in extracellular matrix (ECM) content and composition. 7 Substandard ECM of TE cartilage, both in quality and quantity, leads to inferior mechanical properties and failure.
In native articular cartilage, ECM is responsible for its load-bearing function. Glycosaminoglycan (GAG) and collagen (specifically type II collagen) are two major load-bearing macromolecules present in articular cartilage.8,9 During hMSC chondrogenesis in vitro, different molecules (GAG, collagen type I, II, and X) appear in the ECM at different times;10,11 type I collagen appears around day 1 after induction of chondrogenesis and decreases till day 14; GAG and type II collagen appear at day 5; type X collagen appears at day 7; all three of them can be detected through day 14.
Amino acids, the building blocks for proteins, are critical for cartilage ECM synthesis. Following chondrogenic induction in vitro, there is very little DNA synthesis as cell proliferation is curtailed during differentiation.12,13 De novo synthesis of ECM proteins requires the uptake of amino acids, especially essential amino acids. Despite their importance, to our knowledge, no previous studies investigated amino acid uptake during hMSCs chondrogenesis. 14
In this study, we investigated the amino acid uptake/secretion during chondrogenesis using an hMSCs-based aggregate culture system. Serum-free chondrogenic medium with a defined chemical formulation was used.11,15 This presents an ideal opportunity to investigate ECM synthesis using amino acids analysis of culture medium over time. Our results show that essential amino acid uptake increased during hMSCs chondrogenesis and essential amino acid uptake rates were independent of initial glucose levels. However, amino acid uptake during in vitro chondrogenesis was insufficient to produce a tissue with an ECM content similar to that of human neonatal cartilage or adult cartilage. Furthermore, this deficiency was likely related to the downregulation of some key amino acid transporters in the cells. Such deficiency could be improved by increasing the amino acid availability in the chondrogenic medium using a higher medium-change frequency of 1 day−1. The DNA-normalized GAG and hydroxyproline (HYP) content of chondrogenic aggregates correlated with cumulative uptake of leucine, valine, and tryptophan regardless of initial glucose levels and medium-change frequency. This finding can help to develop noninvasive assessment methods for hMSCs chondrogenesis in vitro and to design better culture conditions to improve end-tissue quality.
Materials and Methods
Materials
Cell culture medium (Dulbecco’s modified Eagle’s medium [DMEM]) with 4.5 g/L (DMEM-high glucose), 1.0 g/L (DMEM-low glucose), and 0 g/L (DMEM-no glucose) glucose concentrations, trypsin, L-glutamine, antibiotic/antimycotic solution (105 U/mL penicillin G sodium, 10 mg/mL streptomycin sulfate, and 25 μg/mL amphotericin B in 0.85% saline), nonessential amino acids, dexamethasone, sodium pyruvate, phosphate-buffered saline (PBS), and nuclease-free water were purchased from Invitrogen (Carlsbad, CA). Fetal bovine serum (FBS, Life Technologies, Carlsbad, CA) was lot selected (Lot# 1805387). 16 Transforming growth factor-β1 (TGF-β1) and human fibroblast growth factor-2 (FGF-2) were obtained from PeproTech (Rocky Hill, NJ, USA). Insulin-transferrin-selenium (ITS)+Premix was a product of Becton Dickinson (Franklin Lakes, NJ, USA). Ethylenediaminetetraacetic acid (EDTA), hydrochloric acid (HCl), sodium hydroxide (NaOH), sodium phosphate, sodium chloride (NaCl), disodium phosphate (Na2HPO4), sodium acetate, isopropanol, bovine serum (BS), 16% formaldehyde, acetonitrile (LC/MS grade), methanol (LC/MS grade), water (LC/MS grade), clear 96 well plates, and Amicon® Ultra-0.5 mL centrifugal filters (Ultracel®-3K) were obtained from Fisher Scientific (Pittsburgh, PA). Ascorbate-2-phosphate was purchased from Wako (Richmond, VA). Safranin-O, HYP, papain, cysteine, 4-(dimethylamino) benzaldehyde, perchloric acid 70% reagent grade, hydrogen peroxide (H2O2), sulfuric acid (H2SO4), calf thymus DNA standard, cetylpyrinidium chloride (CPC), copper (II) sulfate pentahydrate (CuSO4), and Hoechst 33258 were obtained from Sigma-Aldrich (St. Louis, MO). Chondroitin sulfate C (CS-C, from shark cartilage) was obtained from Seikagaku America (East Falmouth, MA). A Contour Next USB Blood Glucose Monitoring System and glucose test strips were acquired from Bayer AG (Leverkusen, Germany). Nitrocellulose membrane and dot-blot apparatus were bought from Bio-Rad (Hercules, CA). Ninety-six well plates with UV transparent flat bottoms and black wells (for DNA assay) were purchased from Corning (Kennebunk, ME). Hemacytometer was obtained from Hausser Scientific (Horsham, PA). Ninety-six well polypropylene plates with conical bottoms were purchased from Evergreen Scientific (Los Angeles, CA). A spectrophotometer was obtained from Molecular Devices (Sunnyvale, CA). Amino acid standard mixture was purchased from Sigma. Chromatography vials were obtained from Agilent Technologies (Santa Clara, CA).
Cell culture
Bone marrow was procured from the Hematopoietic Biorepository and Cellular Therapy Core of the Case Comprehensive Cancer Center. It was obtained from donors after informed consent was obtained, and according to an institutional review board-approved protocol. HMSCs were isolated from the marrow using previously published methods.15,17,18 For the proliferation phase after primary culture, the cells were grown with an initial density of 15 × 105 cells per T150 flask in a complete medium composed of DMEM-LG with 10% FBS and 10 ng/mL FGF-2. All incubations were done at 37°C, 95% air, and 5% CO2 with saturating humidity. Medium was changed two times a week. After a week, the cells were 80–90% confluent.
Aggregate culture and chondrogenic induction
We used Passage 2 cells. The above-mentioned hMSCs from T-150 flasks were detached and made into aggregates as described before with modifications.10,11,15,19,20 The detachment was done using 0.05% trypsin EDTA which was then neutralized with BS. This trypsin/BS solution was removed after centrifuging the cells for 5 min at 500 g. This was replaced with a complete medium for cell counting with a hemacytometer. Chondrogenic differentiation medium was prepared with glucose concentrations of 1, 2, 3, or 4.5 g/L by mixing DMEM-HG (high glucose) and DMEM-NG (no glucose) in proper proportion. Before splitting, the mixture was supplemented with 1% ITS+Premix, 146 μM A2P, antibiotic/antimycotic, nonessential amino acids, 10−7 M dexamethasone,
Native cartilage tissue
Samples of neonatal femoral condyle articular cartilage were carefully dissected from both knees of a deidentified 1-month-old cadaveric specimen procured from consented guardians of the human tissue donors (AlloSource, Centennial, CO). Small pieces of articular cartilage (∼1 mm3, n = 4) were cultured over 4 days in chondrogeneic differentiation medium, which was changed daily. Medium samples at the end of day 4 were collected for amino acid analysis (see below).
Sample harvest and processing
Aggregates grown under each glucose condition were harvested on day 7, day 14, and day 21. Out of these, four aggregates were used for quantifying DNA, GAG, and HYP content, and two aggregates were used for histology and immunohistochemistry. The aggregates harvested for DNA, GAG, and HYP content were washed with PBS and frozen at −80°C until analysis.
Histology
Qualitative measurement of GAG/proteoglycan content and distribution was done by fixing aggregates in 4% formaldehyde, paraffin-embedded, sectioned, and then stained with Safranin-O. Images of samples were taken using a Leica camera with a 10× Leica fluorescence microscope (Leica Microsystems GmbH, Wetzlar, Germany). A mosaic of multiple images was compiled for aggregates that were too large.
GAG and DNA assay
Previously published methods15,18,21,22 were followed to determine GAG and DNA contents of the samples quantitatively. For GAG analysis, Safranin-O reagent was combined with the digests of each tissue sample. A vacuum was applied to the apparatus and precipitates were collected on a nitrocellulose membrane. Individual dots were cut out from the dot-blot apparatus, and cetylpyridinium chloride was used to elute the dye. Absorbance of the eluted dye at a wavelength of 536 nm was analyzed. A standard curve was generated from known concentrations of purified chondroitin sulfate. For DNA quantitation, papain buffer was used for digestion and combined with Hoechst 33258 for fluorescent measurement of each sample. Excitation wavelength and emission wavelengths were 340 nm and 465 nm, respectively. Known concentrations of calf thymus DNA were used to generate standard curves.
Hydroxyproline assay
HYP content was determined following a previously published method.23–25 During GAG/DNA assay, samples were separated after papain digestion step for HYP analysis. First, the samples were hydrolyzed using 6N HCl at 110°C overnight. The HCl was evaporated by heating these overnight at 60°C, and the dried samples were redissolved in water. Aliquots of 20 μL of these were then transferred into a 96-well nontissue culture plate with UV transparent flat bottom in quadruplicate to minimize errors. Then, 0.15M CuSO4 and 2.5N NaOH were added to each well of sample and incubated in an oven at ∼50°C for 5 min. Then, 20 μL of 6% H2O2 was added to each of the sample wells before incubating the plate for another 10 min at ∼50°C. After this, 80 μL of 3N H2SO4 and 40 μL of 10% p-dimethyl-amino-benzaldehyde were added to each sample before a final incubation period of 16 min at ∼70°C. Between all these incubation periods, the samples were allowed to cool down to room temperature. The same procedure was done for standards of HYP between 0 and 500 μg/mL, simultaneously. The absorbance was read at a wavelength of 505 nm as soon as these cycles of incubation-cooling were completed.
LC/MS analysis
Media processing
Conditioned media collected every day were thawed out at room temperature for 1 h and vortexed well before adding 100–300 μL Milli Q water for dilution. Diluted media were vortexed and transferred to Amicon® Ultra-0.5 mL centrifugal filters (Ultracel®-3KDa), then centrifuged at 11,700 g, 4°C for 1.5 h to remove large molecules. Filtered media were transferred to Agilent vials for LC/MS (Liquid Chromatography/Mass Spectrometry) analysis.
Analysis
Samples were subjected to analysis on Agilent 6460 Triple Quadrupole LC/MS (Agilent Technologies, CA). Agilent® prescribed settings26,27 were utilized to arrive at instrument operating parameters. In total, 1 μL of each sample and amino acids mixture standards were injected into a 10 cm long, 2.1 mm internal diameter, 2.7 μm pore size Agilent InfinityLab Poroshell 120 HILIC-Z column (Agilent Technologies, CA) for amino acids separation at a constant flow rate of 0.5 mL/min over 16 min using a multisegment linear gradient of mobile phase A (20 mM ammonium formate in water at pH = 3) and B (20 mM aqueous ammonium formate at pH = 3 in 9:1 acetonitrile/water) as follows: 0–11.5 min, 0–30% A and 100–70% B; 11.5–12 min, 30–0% A and 70–100% B; 12–16 min, 100% B. Each sample was analyzed in quadruplicates. Mass spectrometer was set as multiple reaction monitoring (MRM) scan type using an Agilent Jet Stream (AJS) source with the following conditions: gas temperature 330°C; gas flow 13.0 L/min; nebulizer 35 psi; sheath gas temperature 380°C; sheath gas flow 12 L/min; capillary voltage 1,500 V; nozzle voltage 0 V. Mass spectrometer parameters such as precursor ion, product ion, collision energy, and fragmentor were set according to Agilent application notes (shown in Supplementary Table S1).26,27
LC/MS data analysis
The acquired raw files were analyzed using Agilent MassHunter Workstation Software (Agilent Technologies, CA). The pressure profiles were extracted and chromatograms were checked to ensure no significant pressure and retention time shift. Then specific retention time for individual amino acids were obtained and spectra were checked to distinguish amino acids that had the same paired of precursor and product ions, such as leucine and isoleucine, as well as glutamine and lysine. The quantitative analysis method was set using information including retention time, paired precursor, product ions, and standard concentrations. After the method application, calibration curves were plotted using standards, and the amino acid concentrations in the samples were determined. Uptake rates per day were calculated from the amino acid concentrations and were normalized to the amino acid concentrations of the chondrogenic induction medium (Supplementary Table S2).
Statistical analysis
Statistical analysis was performed using the Origin 2018 software package from Origin Lab (Northampton, MA), Minitab (State College, PA), and Microsoft Office Excel (Microsoft, WA). Student’s t-test was used for pair-wise comparisons. Tukey’s test was employed for multiple comparisons. Analysis of variance (ANOVA) was performed to determine the significance for time-dependent data. Pearson’s correlation analysis was carried out where necessary. Data were represented as mean ± standard deviation (SD). Differences were considered significant when p value < 0.05.
Results
LC/MS analysis of amino acids
Figure 1 shows a typical LC/MS chromatogram of a culture medium sample. There is a clear separation of isomers (leucine and isoleucine) in the chromatographic column enabling identification and quantitation of these isomers. All amino acids presented clear, sharp peaks that were later quantified using standards. Each sample run took about 15 min.

Standard chromatogram of defined tissue culture medium by LC/MS.
Dynamics of amino acid uptake
Figure 2 shows uptake rates normalized to DNA (10–15 moles/s/μg) of selected amino acids from aggregates cultured in chondrogenic media with different initial glucose levels (1, 2, 3, 4.5 g/L) at day 2, day 8, day 14, and day 21 after initiation of chondrogenesis, respectively. Although we analyzed over 20 amino acids, only amino acids with uptake percentage over 10% are chosen to be reported. During the culture of these aggregates, the culture medium was changed once every two days (0.5 day−1), which is typical. 15 Uptake rate of isoleucine, leucine, valine, tryptophan, glutamine, cystine, and serine all increased during hMSCs chondrogenesis (Fig. 2A–F and I) for all initial glucose levels. Of these seven amino acids, uptake rates of glutamine, cystine, and serine were high from day 2 onwards whereas the other four had minimal uptake on day 2. Initial glucose levels had an impact on the uptake/secretion rates of some amino acids (isoleucine, leucine, valine, proline, serine, and alanine) with higher glucose levels (2–4.5 g/L) leading to higher uptake/secretion rates. Glutamine had the highest uptake rate of about 310 fmole/s/μg on day 2 which increased greater than 3-folds to about 960 fmole/s/μg on Day 21 for all glucose levels. Serine uptake increased from about 130 fmole/s/μg on Day 2 to about 280 fmole/s/μg for glucoses levels 2–4.5 g/L and to about 140 fmole/s/μg for glucose level 1 g/L on day 21. Isoleucine, leucine, valine, and cystine uptake rates also increased during chondrogenesis. Except for glycine, the uptake/secretion rates of all amino acids by the hMSC aggregates were lower than that of neonatal cartilage tissue. The results also show that some amino acids, proline, glycine, asparagine, alanine, and glutamic acid, were secreted by hMSCs during chondrogenesis; the levels of these amino acids in culture medium increased (Fig. 2G, H, J–L). It is interesting to note that the secretion rates of most of these amino acids increased with time after chondrogenic induction. Their secretion rates increased for higher initial glucose levels: 2–4.5 g/L during chondrogenesis whereas for 1 g/L initial glucose level, the secretion rates remained mostly the same. Alanine had the highest secretion rate, which was at about 190 fmole/s/μg on day 2 and increased to about 350 fmole/s/μg by day 21 for glucose levels 2–4.5 g/L. DNA content of aggregates cultured at different initial glucose concentration harvested at different time points was not significantly different (Supplementary Fig. S1).

DNA normalized uptake/secretion rate of aggregates cultured in chondrogenic media at 0.5 day−1 medium change frequency with different initial glucose levels (1 g/L [blue circle], 2 g/L [red square], 3 g/L [green triangle], 4.5 g/L [inverted purple triangle]) at different time points: day 2, day 8, day 14, and day 21. The DNA-normalized uptake/secretion rate (dashed orange line) of human neonatal cartilage (NC) tissue pieces cultured in chondrogenic induction medium is shown as comparison. Error bars represent mean ± standard deviation (SD). Number of aggregates was three and number of samples was four per aggregate for a total of 12 samples per condition.
To determine whether uptake of amino acids was limited by their initial levels in the culture medium, the results are shown as daily percent uptake rate of several amino acids (Fig. 3). The percentage uptake represents the deviation of initial medium levels of the specific amino acids over one day. Three amino acids (glutamine, serine, and cystine) had uptake rates that could lead to limitations of these in the culture medium for typical culture conditions with medium-change frequency of 0.5 day−1. Glutamine uptake rate significantly increased from about 20% per day (day 2) to as high as 75% per day (day 21). Serine uptake increased from about 20% (day 2) to 60% per day (day 21). Cystine uptake increased from about 10% (day 2) to about 40% (day 21) per day. Isoleucine, leucine, and valine uptake rate increased more modestly during chondrogenesis in 21-day culture scheme. Secretion rates of proline, glycine, asparagine, alanine, and glutamic acid increased from approximately 200, 0, 50 on day 2 to 500, 150, 100% per day on day 21 for higher initial glucose levels (2–4.5 g/L) during chondrogenesis (Fig. 3G, H, J–L). Amino acids (methionine, threonine, lysine, tyrosine, and phenylalanine) had less than 10% uptake rate over the entire culture period for all initial glucose levels (data not shown).

Daily percentage uptake of several amino acids from aggregates cultured in chondrogenic media at 0.5 day−1 medium change frequency with different initial glucose levels (1 g/L [blue circle], 2 g/L [red square], 3 g/L [green triangle], 4.5 g/L [inverted purple triangle]) at different time points: day 2, day 8, day 14, and day 21. Error bars represent mean ± standard deviation (SD). Number of aggregates was three and number of samples was four per aggregate for a total of 12 samples per condition.
Effect of initial glucose levels on amino acid uptake/secretion
Changing initial glucose levels affected the day 21 amino acid uptake/secretion rates (Fig. 4). Increasing initial glucose levels from 1 g/L to 4.5 g/L increased the day 21 uptake rate of glutamine (from 45% to 70%, Fig. 4E), serine (20%–60%, Fig. 4I), cystine (20–40%, Fig. 4F), isoleucine (10–20%, Fig. 4A), leucine (5–12%, Fig. 4B), valine (5–13%, Fig. 4C), and tryptophan (Fig. 4D). Increasing initial glucose levels from 1 g/L to 4.5 g/L decreased the secretion ration of asparagine from about 30% to 18% per day (Fig. 4J) and increased the secretion rates of alanine (200–500%, Fig. 4K), glutamic acid (75–150%, Fig. 4L), proline (40–100%, Fig. 4G), and glycine (20–35%, Fig. 4H).

Percentage uptake of several amino acids from aggregates cultured in chondrogenic media at 0.5 day−1 medium change frequency with different initial glucose levels (1 g/L [blue], 2 g/L [red], 3 g/L [green], 4.5 g/L [purple]) at day 21. Data were analyzed using Turkey’s test. *p < 0.05; **p < 0.01; ***p < 0.001. Number of aggregates was three and number of samples was four per aggregate for a total of 12 samples per condition.
Effect of availability on amino acid uptake/secretion
To assess whether amino acid uptake/secretion is affected by amino acid availability, aggregate culture experiments were carried out where the frequency of medium change was increased from once every two days (0.5 day−1) to once every day (1 day−1). Increased availability of amino acids increased the % uptake rate of leucine, valine, tryptophan, glutamine, and cystine on day 2 and day 7 (Supplementary Fig. S2 and S3) for all initial glucose conditions. Increased availability of amino acids led to decrease in the % uptake rate of serine on day 2 and isoleucine on day 2 and day 7. This trend reversed on day 14 (Fig. 5) with increase in uptake rate of isoleucine and no effect for serine. Increased availability of amino acids decreased the secretion rate of proline and alanine on day 2 for all initial glucose conditions tested (Supplementary Fig. S2). On day 14, uptake rates of all essential amino acids increased with increased availability along with some conditionally essential amino acids (glutamine and cystine) for all initial glucose conditions (Fig. 5). On day 21, the effect of increased availability of amino acids was minimal, even if statistically significant, on the uptake rates of most amino acids (Fig. 6).
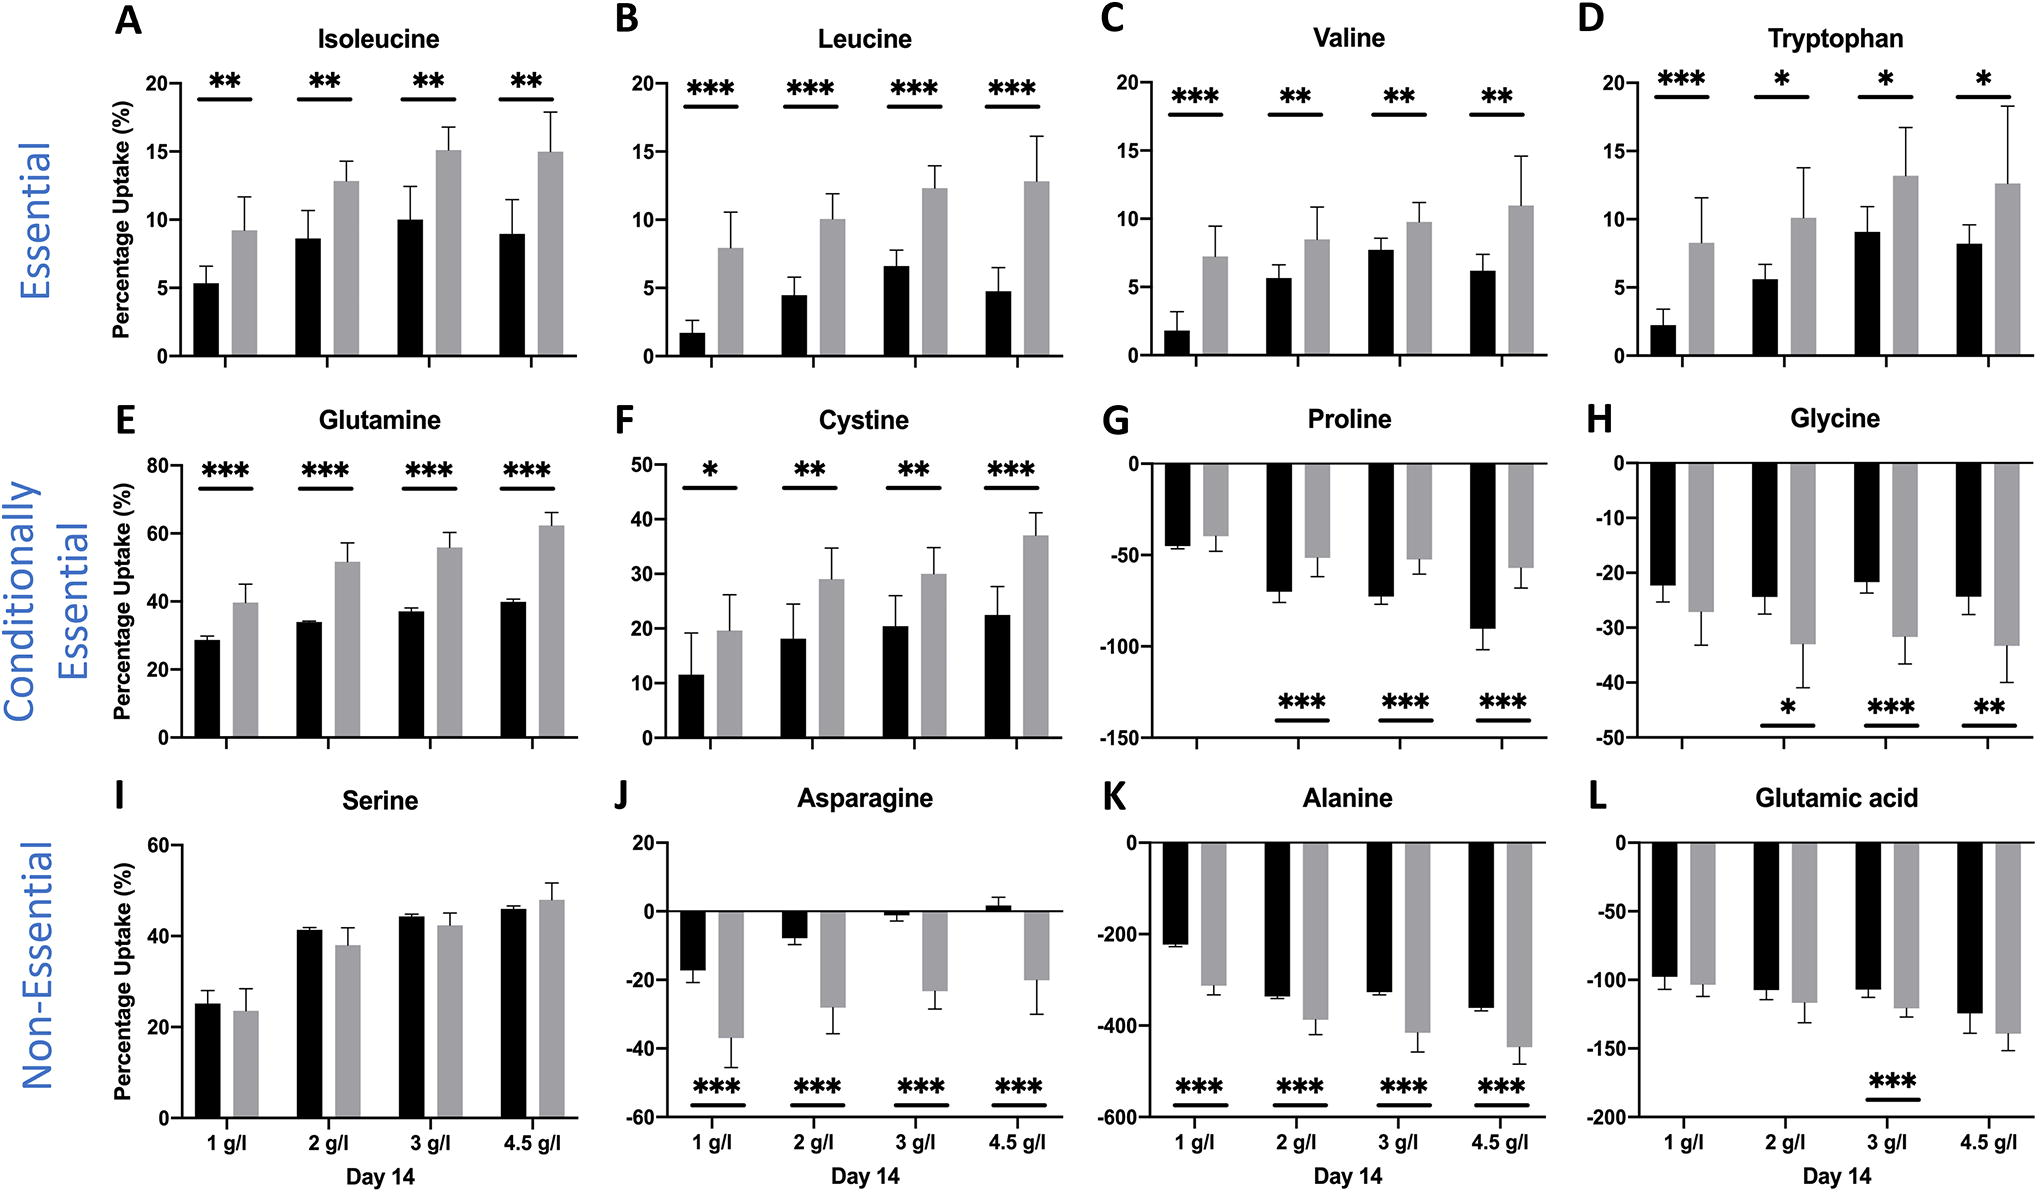
Percentage uptake of several essential, conditionally essential, and nonessential amino acids for all initial glucose conditions on day 14 of culture at medium-change frequency of 0.5 day−1 (black) and 1 day−1 (gray). Data were analyzed by the Student’s t-test. *p < 0.05; **p < 0.01; ***p < 0.001. Number of aggregates was three and number of samples was four per aggregate for a total of 12 samples per condition.
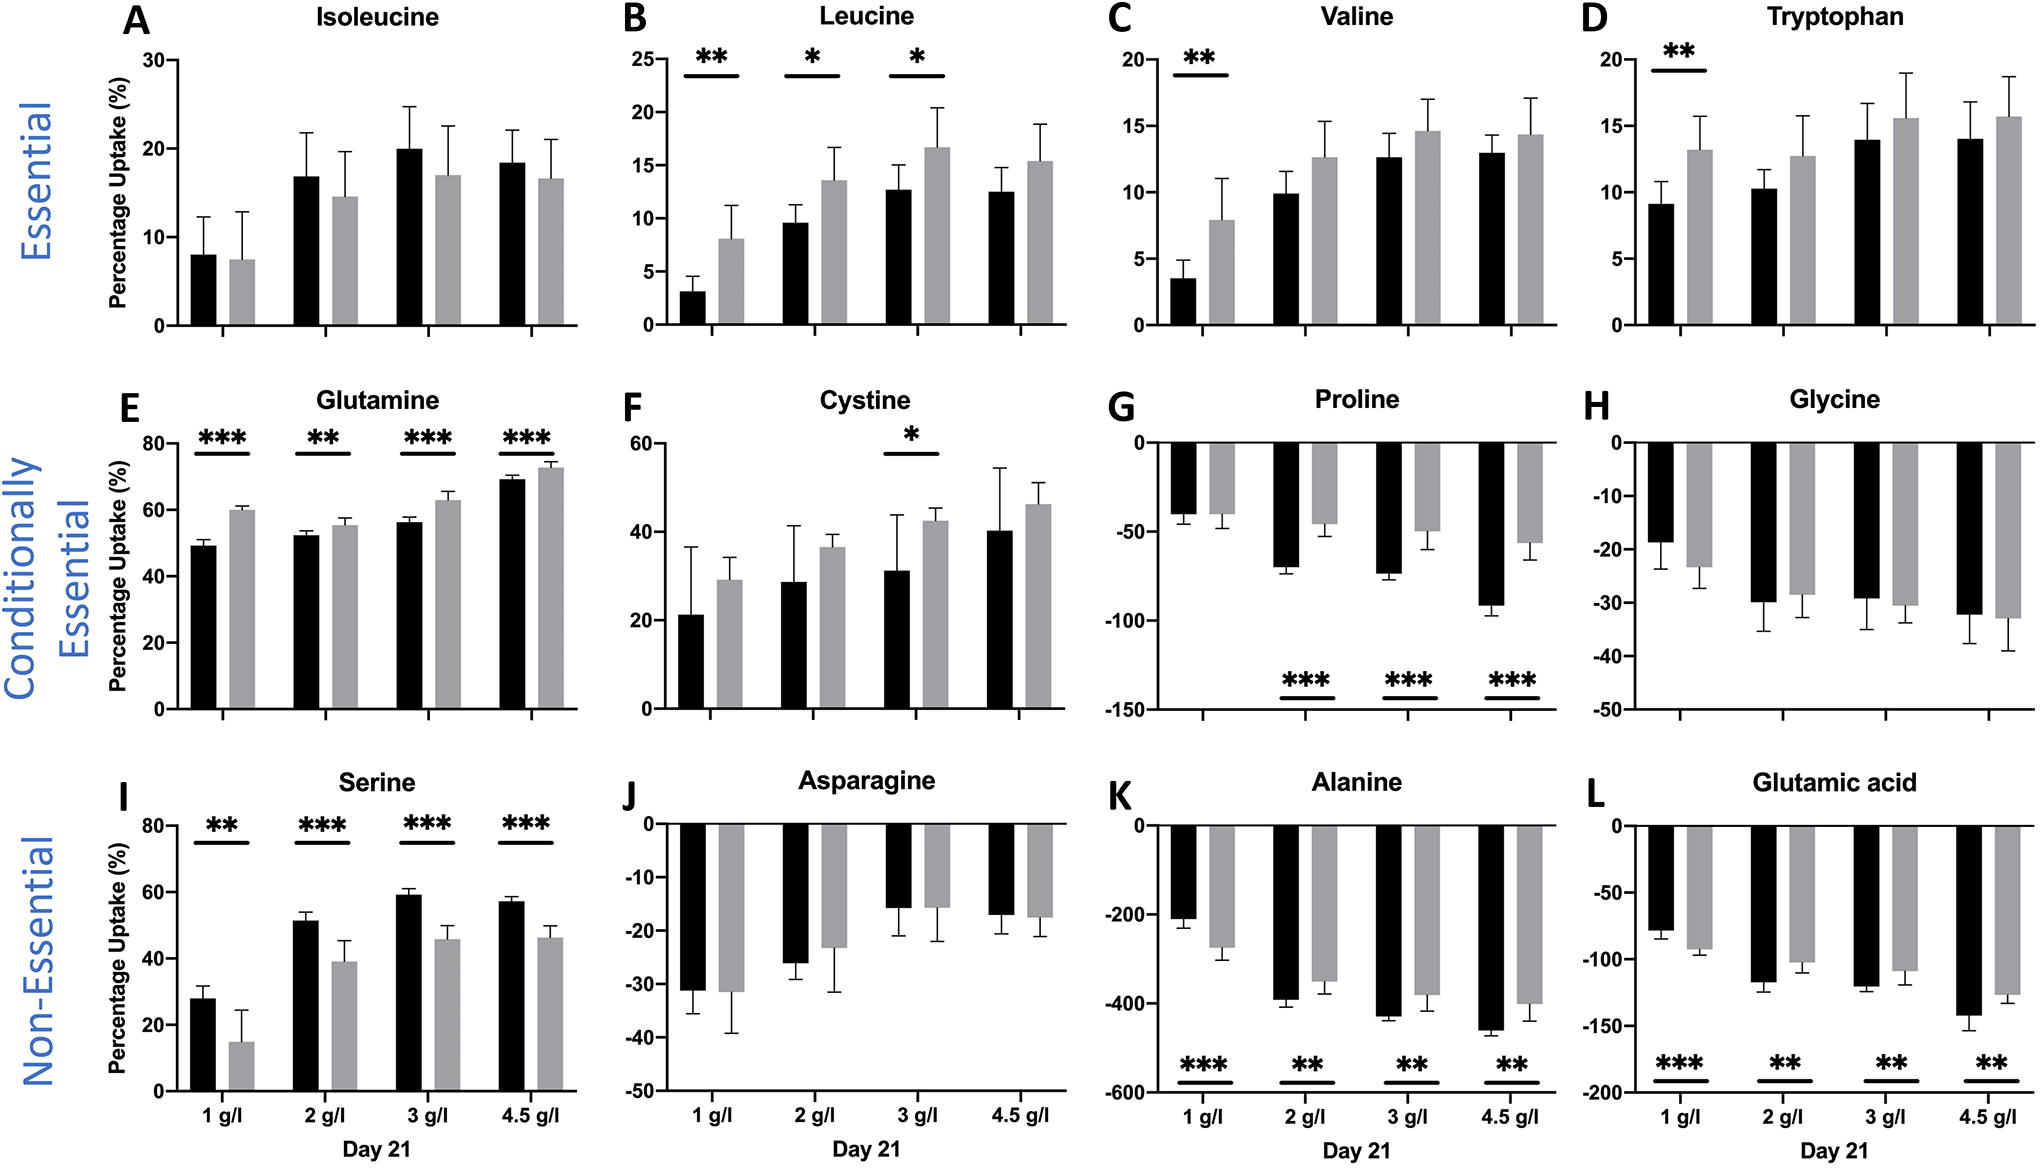
Percentage uptake of several essential, conditionally essential, and nonessential amino acids for all initial glucose conditions on day 21 of culture at medium-change frequency of 0.5 day−1 (black) and 1 day−1 (gray). Data were analyzed by the Student’s t-test. *p < 0.05; **p < 0.01; ***p < 0.001. Number of aggregates was three and number of samples was four per aggregate for a total of 12 samples per condition.
Minimal amino acid uptake requirements
Figure 7 shows deficiencies in essential amino acid uptake during hMSCs chondrogenesis based on the difference between the cumulative uptake of amino acid over 21-day culture period and the minimal uptake requirements to synthesize type II collagen amount that is equivalent to human neonatal and adult articular cartilage tissues.8,28 The pie chart shows the amino acid constituents of human type II collagen. The table shows the percentage of deficiencies in essential amino acids for both amino acid availability culture conditions (0.5 and 1 day−1) tested with positive values indicating deficiency and negative values indicating surplus. The results show that in comparison with neonatal articular cartilage (AC) type II collagen minimal amino acid requirements, uptakes of all amino acids except isoleucine were such that they were significantly deficient under normal amino acid availability (0.5 day−1) culture conditions. When the amino acid availability was increased by replenishing the culture medium once a day (1 day−1), the deficiencies decreased for all except isoleucine for which it increased. Both valine and histidine switched from deficiency to surplus. Surprisingly, isoleucine became more deficient when the amino acid availability was increased. When comparisons were made to adult AC, larger deficiencies were noted but similar trends were observed. However, none of the amino acid uptake led to a surplus when comparisons were made to adult AC.
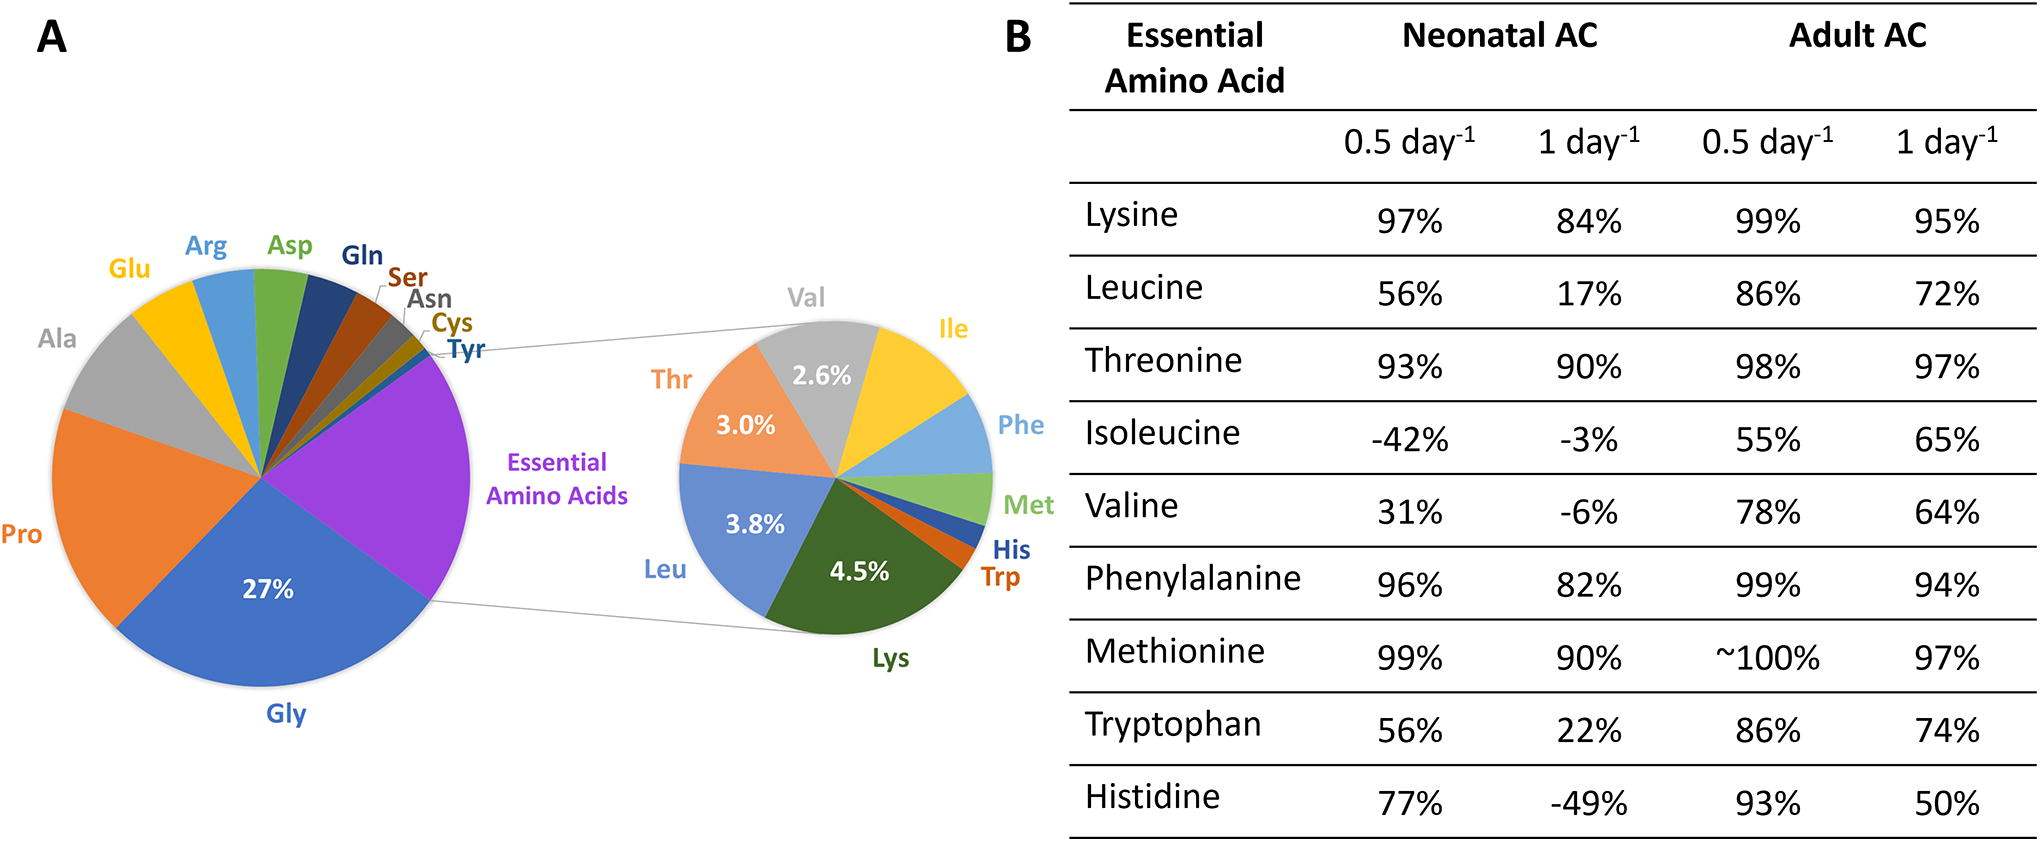
Amino acid uptake to monitor biochemical content
Correlating amino acid uptake with day 21 biochemical content of tissue showed that the cumulative uptake of essential and branched-chain amino acids, leucine and valine, correlated with GAG and HYP content in aggregates on day 21 (Fig. 8) regardless of initial glucose levels and amino acid availability. The correlation to HYP was slightly better (Pearson’s r values are 0.904 for leucine and 0.918 for valine) than the correlation to GAG (Pearson’s r values are 0.882 for leucine and 0.876 for valine). GAG and HYP content of aggregates on day 21 also correlated well with the cumulative uptake of tryptophan and lysine (Supplementary Figs. S4 and S5).

Regardless of initial glucose levels and amino acid availability (0.5 day−1 and 1 day−1 medium change frequencies), the cumulative uptake rate of
Discussion
The purpose of this study was to investigate amino acid uptake during hMSCs chondrogenesis, and whether amino acids can be markers to monitor the ECM molecules’ synthesis during hMSCs chondrogenesis. We varied initial glucose levels and increased the availability of amino acids by increasing medium change frequency from a typical 0.5 day−1 to 1 day−1. Our results show that uptake rates of all essential amino acids increased during hMSCs chondrogenesis along with that of some conditionally essential amino acids and one nonessential amino acid (serine). Increasing glucose levels from 1 to 4.5 g/L increased all essential amino acid uptake rates on day 21. Increasing the amino acid availability increased the uptake rate of most amino acids at earlier culture times; however, toward day 21, the difference in uptake rates became much smaller. Furthermore, our results show that we can use specific amino acids to monitor tissue biochemical quality (e.g., GAG and HYP content).
While promising as a therapeutic method to repair/regenerate cartilage defects, hMSC chondrogenesis still falls short in end tissue quality. The resulting tissue presents inferior biochemical and mechanical properties compared with native articular cartilage. 29 The major function of articular cartilage is to bear repetitive mechanical loadings and such mechanical properties of tissue primarily rely on the ECM that is characterized by two major load-bearing macromolecules, type II collagen, and GAG.
Amino acids and glucose are key molecules for the synthesis of type II collagen and GAG. Uptake of these molecules in cells is also dependent on their availability in the culture medium and ATP. Zhong et al. recently showed that glucose uptake during chondrogenesis is strongly a function of initial glucose levels at culture medium. 13 Furthermore, it was also shown that glucose is primarily utilized for glycolysis during chondrogenesis.
Another impact factor is the transmembrane solute carrier proteins in the cell membrane, which transport amino acids and glucose into cells. 30 Our results show that upon chondrogenic induction, uptake rates of several amino acids increased during chondrogenesis. Recent RNASeq data (Supplementary Table S3, extracted from Somoza et al. 31 ) showed that gene expression levels of several amino acid (essential and nonessential) transporters were upregulated. Increases in the uptake rates of the essential amino acids, leucine, isoleucine, and valine may be due to enhanced expression levels of LAT-1 gene (SLC7A5), which increased by about five-fold from day 0 to day 21. TGF-β is a key growth factor for chondrogenesis induction. 32 TGF-β has been shown to significantly improve uptake of certain amino acids (L-arginine, L-leucine) in different cell types.33,34 TGF-β has been shown to stimulate PI3K activity, which regulates, among other things, amino acid transport.34,35 Interestingly, TGF-β has also been shown to be an inhibitor for the uptake of cystine and glutamic acid in endothelial cells. 36 This is consistent with a published report about the upregulation of SLC7A5 by TGF-β exposure. 37
However, it was also noted that several essential amino acids’ (histidine, methionine, threonine, lysine, and phenylalanine) uptake rates were negligibly small (data not shown). Of all the essential amino acids, lysine is the dominant constituent of type II collagen molecule. A significant uptake rate was seen only around Day 21 for lysine. As a cationic amino acid, lysine is transported by CAT-3 transporter encoded by the gene SLC7A3. RNASeq data (Supplementary Table S3) showed that the gene expression levels of SLC7A3 increased only around Day 3 but decreased significantly to zero when compared with baseline (day 0) values. Interestingly, CAT-3 levels were also at zero values for human adult and neonatal cartilage tissues.
Increasing amino acid availability by doubling medium change frequency from 0.5 day−1 had positive impact on uptake rates of most amino acids but most of these effects were transient. Increasing medium change frequency increased the average concentration of amino acids in the culture medium which may lead to increased uptake by the transporter. Transient nature of this effect—by day 21, most uptake rates were similar to that of lower medium change frequency—suggests that there may be negative feedback from increased amino acid levels to transporter protein levels in the cell membrane. For aggregates cultured with higher medium-change frequency of 1 day−1, the daily percentage uptake of two conditionally essential amino acids, glutamine, and cystine increased when compared with that obtained from aggregates cultured with medium-change frequency of 0.5 day−1. In addition, aggregates cultured with medium-change frequency of 1 day−1 showed a lower secretion rate for proline, another conditionally essential amino acids, while aggregates cultured with medium-change frequency of 0.5 day−1 showed a higher secretion rate for proline. Proline, glutamine, and cystine are important constituents of type II collagen respectively; the increased uptake or decreased secretion of these can help the synthesis of type II collagen and other ECM molecules.
Glucose is the primary source for ATP production fueling both homeostasis and the differentiation process. Similar initial glucose level-dependent trends of day 21 amino acid uptake rates at different amino acid availability conditions (0.5 and 1 day−1 medium change frequencies) suggest that local glucose availability has an impact on the uptake of amino acids. Lower initial glucose levels, in general, led to lower uptake rates for all amino acids. This suggests that just by increasing glucose levels, we can improve amino acid uptake and, therefore, chondrogenesis outcomes. 13
Computing cumulative uptake of essential amino acids and comparing it to native tissue for type II collagen synthesis showed that in vitro hMSCs chondrogenesis was highly deficient in meeting even the minimal amino acid uptake requirements (Fig. 8, Supplementary Table S4). These results suggest that type II collagen and other ECM protein synthesis during chondrogenesis is significantly affected by essential amino acid uptake. There are three major factors that can affect essential amino acid uptake: the substrate level in the culture medium, energy supply (e.g., ATP levels), and transporters in cell membrane. Although improving the substrate level by increasing the medium change frequency, and increasing initial glucose levels helped improve the uptake, it still falls short of minimal requirements. Increasing the levels of amino acids transporters may be a promising way to increase essential amino acid uptake. From the RNASeq data (Supplementary Table S3), we can deduce that SLC7A2 (CAT-2) and SLC7A8 (LAT2) are potential targets as their expression levels were relatively lower compared with adult and neonatal cartilage levels, and together they are responsible for the transport of cationic amino acids (lysine and histidine) and large neutral amino acids (including phenylalanine, valine, leucine, and isoleucine) transport, respectively.30,38 In addition, expression levels of ASCT1 (SLC1A4), a threonine transporter, and PHT2 (SLC15A3), a histidine transporter were significantly lower compared with native cartilage levels. These are potential targets for upregulation as well.
Cumulative uptake of leucine and valine was shown to correlate well with DNA-normalized GAG and HYP contents of the end-point aggregates regardless of initial glucose levels and medium-change frequencies. Leucine and valine are two of the four most abundant essential amino acids in type II collagen. Therefore, uptake of these molecules can be used to monitor tissue biochemical content noninvasively.
In summary, our results show that uptake rates of essential amino acids by hMSCs increased during the course of chondrogenesis and the coupling of amino acid uptake with that of glucose suggests sufficient supply of all these nutrients is essential for improved chondrogenesis. Increasing the amino acid availability in chondrogenic medium by doubling medium-change frequency from 0.5 day−1 to 1 day−1 led to increased uptake of essential amino acids, though this improvement is still insufficient for ECM synthesis during in vitro chondrogenesis to be led to a tissue comparable with human neonatal and adult cartilage tissues. Furthermore, GAG and HYP content of aggregates linearly correlated with the cumulative uptake of specific essential amino acids (leucine, valine, and tryptophan). This can help to develop noninvasive assessment methods for hMSCs chondrogenesis in vitro and to design better chondrogenic culture conditions to improve end-tissue quality.
Footnotes
Acknowledgments
We sincerely thank the families of the tissue donors and AlloSource (Centennial, CO) for native cartilage tissue procurement. We also thank Sruthi Sivakumar for help with the amino acid analysis method development.
Authors’ Contributions
Y.Z.: Acquisition, analysis, interpretation of data, article writing, and revising draft; B.Z.: Acquisition, analysis, interpretation of data, article writing, and revising draft; R.S.: Acquisition, analysis, interpretation of data, and revising draft; #A.I.C.: Interpretation of data and revising draft; J.F.W.: Interpretation of data and revising draft; H.B.: Conception and design, analysis, interpretation of data, article writing, and revising draft.
#Dr. Caplan, a pioneer in regenerative medicine and stem cell biology, unexpectedly passed away on January 11, 2024, at the time of the submission of this article.
Disclosure Statement
No competing financial interest exists.
Funding Information
This work was funded in part by a grant from the National Institutes of Health (EB021911).

References
Supplementary Material
Please find the following supplemental material available below.
For Open Access articles published under a Creative Commons License, all supplemental material carries the same license as the article it is associated with.
For non-Open Access articles published, all supplemental material carries a non-exclusive license, and permission requests for re-use of supplemental material or any part of supplemental material shall be sent directly to the copyright owner as specified in the copyright notice associated with the article.
