




Abstract
Pancreatic ductal adenocarcinoma (PDAC) represents one of the only cancers with an increasing incidence rate and is often associated with intra- and peri-tumoral scarring, referred to as desmoplasia. This scarring is highly heterogeneous in extracellular matrix (ECM) architecture and plays complex roles in both tumor biology and clinical outcomes that are not yet fully understood. Using hematoxylin and eosin (H&E), a routine histological stain utilized in existing clinical workflows, we quantified ECM architecture in 85 patient samples to assess relationships between desmoplastic architecture and clinical outcomes such as survival time and disease recurrence. By utilizing unsupervised machine learning to summarize a latent space across 147 local (e.g., fiber length, solidity) and global (e.g., fiber branching, porosity) H&E-based features, we identified a continuum of histological architectures that were associated with differences in both survival and recurrence. Furthermore, we mapped H&E architectures to a CO-Detection by indEXing (CODEX) reference atlas, revealing localized cell- and protein-based niches associated with outcome-positive versus outcome-negative scarring in the tumor microenvironment. Overall, our study utilizes standard H&E staining to uncover clinically relevant associations between desmoplastic organization and PDAC outcomes, offering a translatable pipeline to support prognostic decision-making and a blueprint of spatial-biological factors for modeling by tissue engineering methods.
Impact Statement
Pancreatic ductal adenocarcinoma (PDAC) may become the second-leading cause of cancer mortality in the next decade and exhibits scarring with complex, yet unclear, roles in differentiating patient outcomes. We utilized hematoxylin and eosin, a standard histological stain used in clinical workflows, to quantify the extracellular matrix (ECM) architecture of PDAC-associated scarring. Unsupervised machine learning identified a continuum of histological architectures based on divergence in 147 ECM fiber features, which correlated with survival time, disease recurrence, and divergent cellular/protein niches. These findings offer a clinically accessible prognostic signature based on patient-specific histology and suggest spatial-biological targets for tumor modeling.
Introduction
Pancreatic ductal adenocarcinoma (PDAC) is estimated to become the second most common cause of cancer mortality. 1 PDAC is often associated with significant amounts of desmoplasia, that is, intra- and peritumoral scar tissue.2,3 Desmoplasia exhibits heterogeneity in both architecture and composition, and the impact of these complex desmoplastic features on patient outcomes and tumor biology remains unclear. 2 Extracellular and cellular features of the desmoplasia have thus been of significant scientific and clinical interest in the context of PDAC and other solid tumors.4–6 For example, prior literature has implicated parallel extracellular matrix (ECM) fiber alignment of desmoplasia in both prognostically positive and negative roles.7,8 Collagen quantity has similarly been ascribed to both beneficial and pathological roles in the context of tumor progression.9–12 Furthermore, qualitative evaluation of desmoplastic morphology tends to provide inconsistent prognostic information due to sampling bias, user variability, and other factors associated with subjective evaluation.2,3,13 Across prior studies, tumor desmoplasia has been largely evaluated based on isolated features of the ECM such as collagen quantity and/or qualitative evaluation of visual phenotype, neither of which fully characterizes the complexity of scar patterning in PDAC specimens.
Previously, we developed a computational pipeline that quantifies desmoplastic architecture based on 147 local (e.g., fiber length, solidity) and global (e.g., fiber branching, porosity) features present in trichrome or picrosirius red staining, which are specialized stains not commonly utilized in existing clinical workflows for PDAC.4,14 In these preliminary studies, we identified an outcome-negative histological pattern, characterized by disrupted pancreatic glands within cable-like scar fibers, that correlated with shorter durations of patient survival and disease recurrence. 4 In this study, we sought to develop a more translatable and clinically accessible pipeline to quantify desmoplastic architecture using hematoxylin and eosin (H&E), a routine and widely accepted histological stain for PDAC evaluation.13,15 As the gold standard for tumor assessment, H&E staining is performed on nearly every PDAC specimen, and feature extraction from H&E may therefore support existing clinical workflows for pathologists and other clinicians.15,16 To enable stand-alone quantification of histological patterning by H&E, we programmatically applied an H&E-based color deconvolution vector to extract eosin-associated staining of ECM fibers and then quantified an analogous set of 147 local and global fiber features to generate comprehensive architectural profiles of each image.17,18
Our overall goal for this study was to investigate the stand-alone utilization of H&E staining and its underlying histological architecture as a predictive factor for clinical outcomes in PDAC such as overall survival (OS) and disease-free survival (DFS). Following the identification of outcome-differentiating H&E architectures, we identified clinical metadata associated with these distinct histological signatures, uncovering patient- and tumor-level characteristics associated with each global architecture. Furthermore, we validated the trained H&E model by mapping de novo images to the original histological signature and independently quantifying correlations with patient outcomes. Finally, we integrated matrix architectural quantification with our previously established CO-Detection by indEXing (CODEX) reference atlas, 4 mapping divergent cell- and protein-based niches based on localized H&E architecture. Ultimately, we demonstrate that standard H&E staining can be utilized as a predictive factor for patient outcomes and identify putative scar-associated cell/protein targets within the tumor microenvironment (TME), providing a clinically accessible platform in support of prognostic decision-making and spatial-biological modeling.
Methods
Histological processing and clinical metadata
Pancreaticoduodenectomy specimens were acquired from Stanford University Hospital and University of Virginia Hospital with approval of each institution’s Institutional Review Board. All specimens represented patients with PDAC and no metastatic disease. Clinical metadata (e.g., gender, age, tumor grade) were acquired from patient charts and deidentified prior to analysis, with all data and specimens collected retrospectively from pathology archives (Supplementary Table S1). For each patient, OS was calculated as the number of days from the performance of pancreaticoduodenectomy to either expiration of the patient or database lock (for nondeceased patients). DFS was calculated as the number of days from pancreaticoduodenectomy until confirmed relapse/progression or expiration of the patient, with censoring of patients with no confirmed disease recurrence and nondeceased status at database lock. A total of 85 paraffinized PDAC specimens were divided 80:20 for training:testing at the patient level, sectioned at 8 µm, H&E stained using a commercially available kit (AbCam, cat# ab245880, Cambridge, UK), assigned randomized identifiers, and scanned as whole-slide images (WSIs) at 40x magnification using a Motic EasyScan (Motic Digital Pathology, Emeryville, CA).
Matrix architectural analysis
H&E WSIs were cropped to tumoral and stromal regions only, then programmatically tiled in magick to generate 200 × 200 µm images, producing a total sample set of 354,838 tiles (281,709 tiles for training, 73,129 tiles for testing). Histological architecture was quantified on a per-tile basis using a fiber quantification algorithm developed by our laboratory for fibrotic tissue analysis, by adapting functions from the MATLAB Image Processing Toolbox (MathWorks Inc., Natick, MA).4,14 H&E images were normalized and color deconvoluted based on red/green/blue values as established by Ruifrok et al. using a standard color vector for H&E deconvolution from ImageJ (
Mapping of architecture-associated cellular niches
CODEX, a multiplexed immunohistochemistry technique, was previously used to quantify the spatial expression of 30+ proteins, which were summarized a priori using UMAP to spatially index cell phenotypes within each histological section.4,21,22 To identify co-occurrent cellular niches with H&E architecture, 8 µm histological sections were acquired consecutively to a set of 50 CODEX sections previously phenotyped for a PDAC cell spatial atlas. 4 Following the acquisition of H&E WSIs as described above, CODEX and H&E WSIs were spatially aligned in GNU Image Manipulation Program (GNU Project, Cambridge, MA), tiled at 200 × 200 µm, and indexed at one-to-one pairing across modalities. H&E tiles were quantified by matrix architectural analysis and mapped to the original H&E reference manifold using Monocle3 and RANN as described above. 20 Paired CODEX tiles were assigned cell type compositions, protein expression values, and spatial coordinates based on the previously established reference atlas and then correlated at the tile level with spatially co-occurrent H&E pseudotime values using Pearson correlations. 4
Statistical analysis
All correlations between continuous data (e.g., pseudotime, OS) were calculated as Pearson correlations, whereas correlations with ordinal metadata (e.g., tumor grade, stage) were calculated as Spearman correlations (α = 0.05). Differences between discrete patient groups were assessed using a two-tailed, unpaired Student’s t-test (α = 0.05). Relevant p-values were adjusted for multiple hypothesis testing using the Benjamini–Hochberg procedure.
Results
Hematoxylin and eosin architecture correlates with patient outcomes
First, we investigated if the histological architecture of H&E staining was associated with differential PDAC patient outcomes. Across 281,709 H&E tiles, we identified a pseudotemporal trajectory linking images based on deviation in 147 fiber features (Fig. 1A). Qualitatively, the trajectory root (Fig. 1A, indicated with #) consisted of images with continuous pancreatic glands and highly porous, string-like desmoplasia. Progression along the trajectory was associated with irregular gland morphology and thickened desmoplastic fibers. The trajectory terminus (Fig. 1A, indicated with !) was ultimately characterized by regions with largely nonintact glands and highly aligned ECM fibers that exhibited high variability in fiber thickness, including thickened desmoplastic fibers. As a post hoc analysis, we also examined the individual matrix features associated with low versus high H&E pseudotime (Fig. 1B–1C). Low pseudotime was associated with features representing high fiber count and porosity (e.g., Euler number), as well as high fiber solidity, representing regularity of fiber boundaries within each fiber’s convex hull (Fig. 1C, left). High pseudotime, on the other hand, was correlated with histological features representing high pixel-to-pixel correlation and variability in fiber-to-fiber diameter (Fig. 1C, right), consistent with the visible swaths of desmoplasia with highly variable fiber thickness (Fig. 1A). Across 281,709 images, pseudotemporal modeling collectively identified a progression from (1) highly porous ECM architecture with numerous, thinner fibers to (2) confluent desmoplasia with both increased and more variable fiber thickness (Fig. 1B).
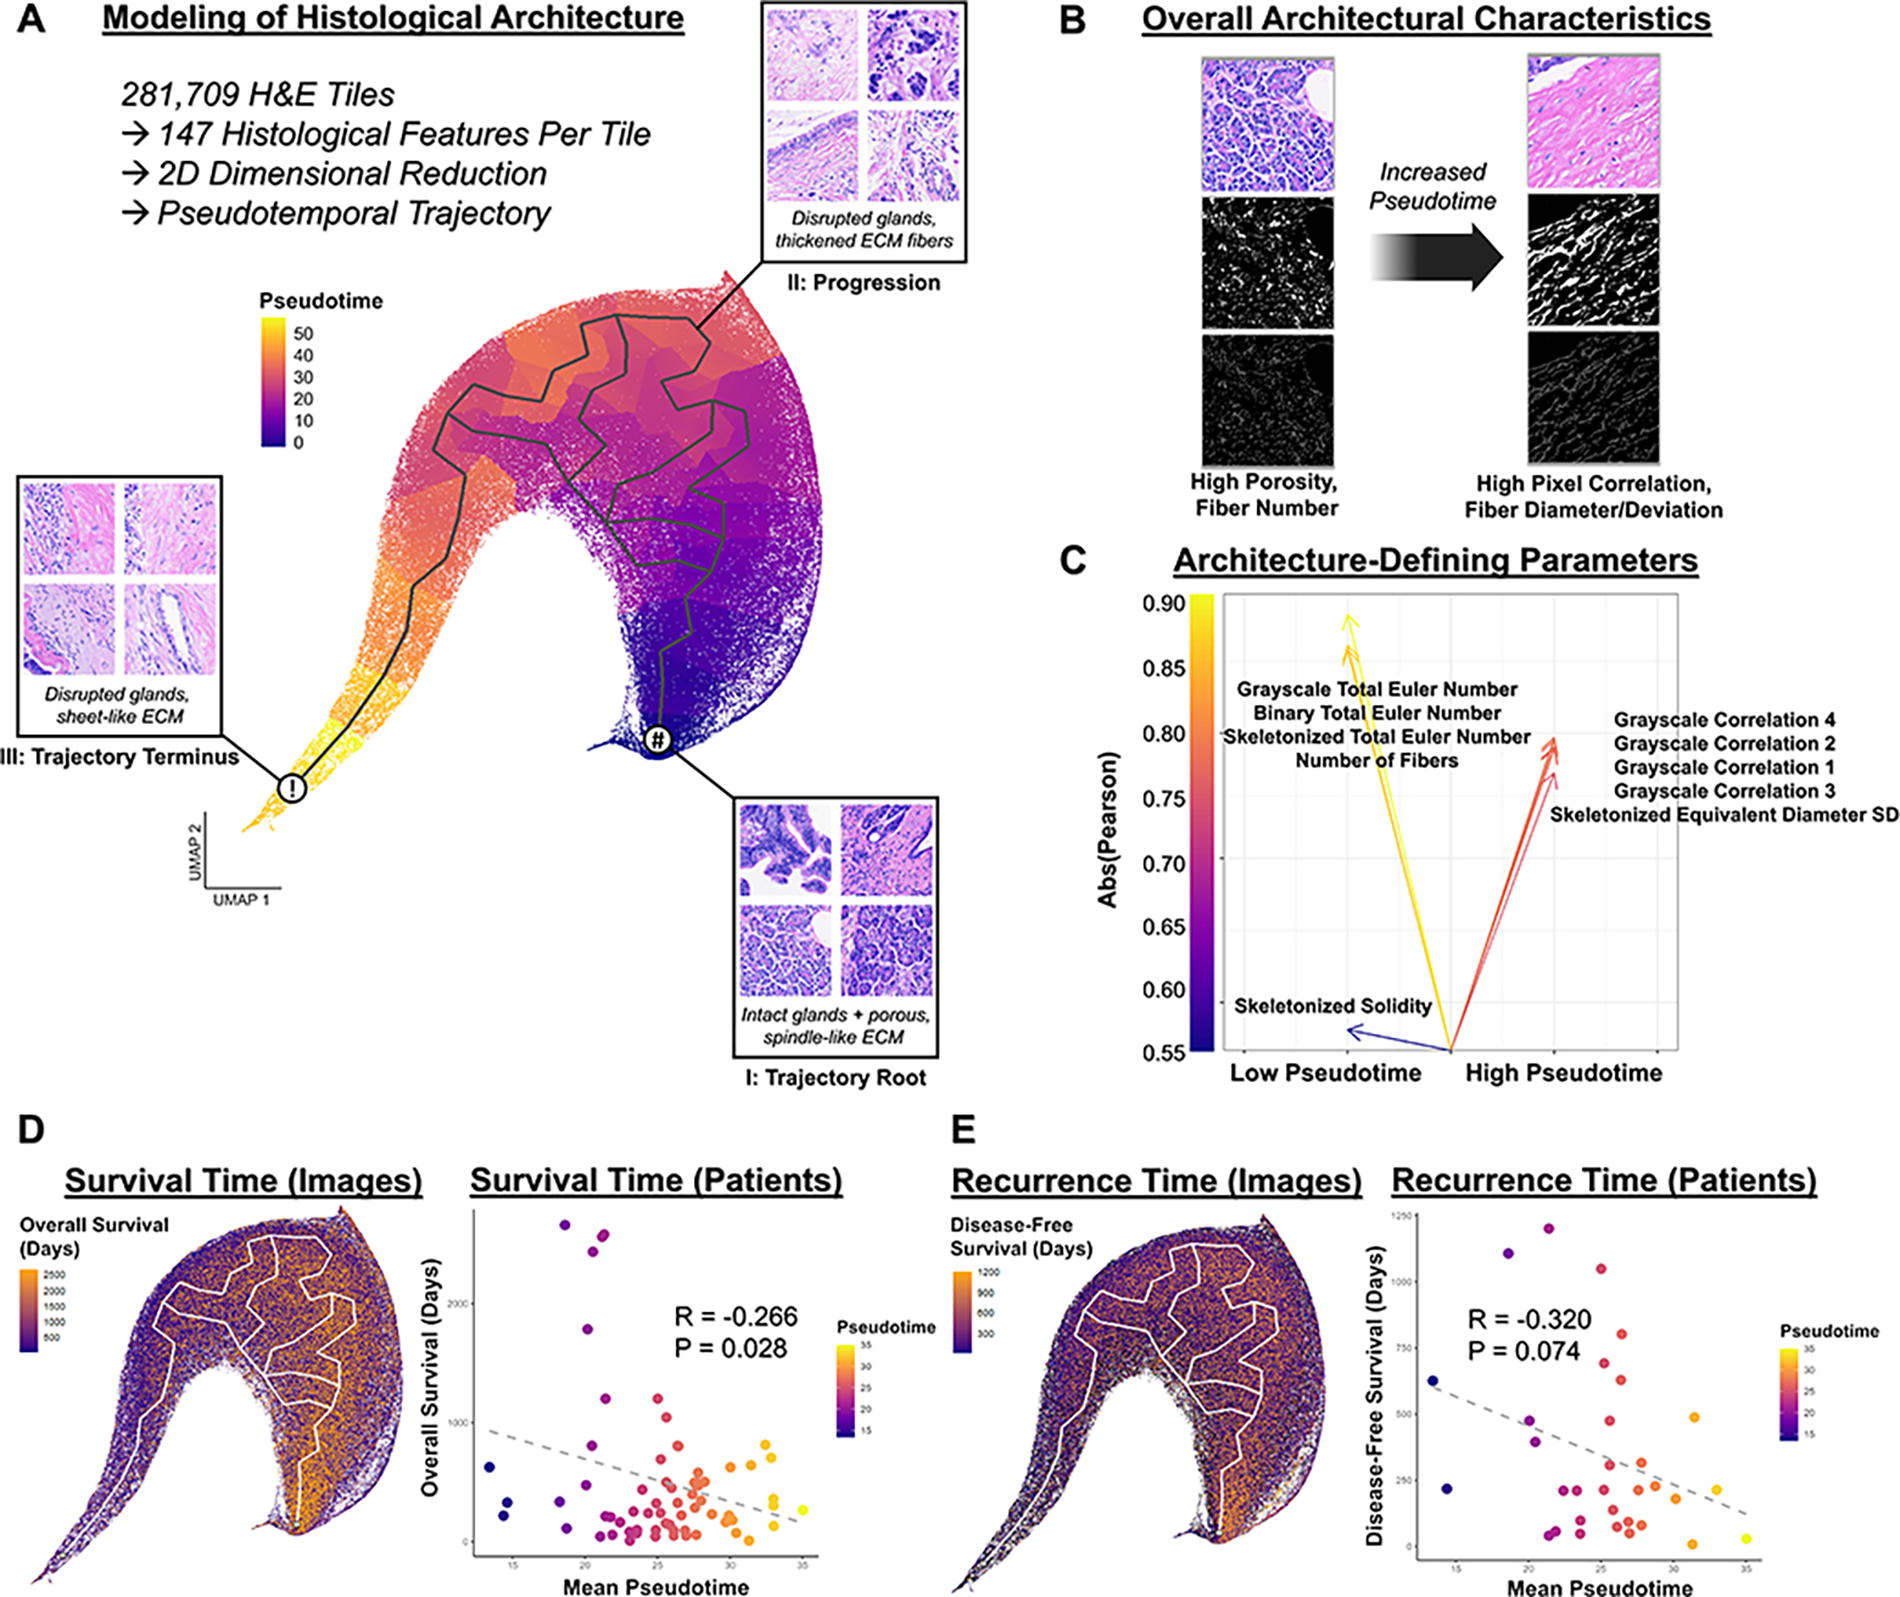
Quantification of histological architecture on hematoxylin and eosin (H&E) images and correlation with patient outcomes.
Following assignment of image-level pseudotime scores, we correlated patient-level mean pseudotime with two central outcome measures, OS and DFS, representing survival and disease recurrence, respectively (Fig. 1D–1E). We observed a statistically significant, negative correlation between patient-level pseudotime and OS (R = −0.266, p = 0.028), in which image-level OS also visually appeared to correlate with position along the trajectory (Fig. 1D). Image-level DFS also appeared to correlate with position along the pseudotime trajectory and trended toward statistical significance in negatively correlating with DFS at the patient level (R = −0.320, p = 0.074) (Fig. 1E). Furthermore, given prior evidence that neoadjuvant treatment influences the PDAC TME, we analyzed whether architecture-based clinical features were influenced by the receipt of neoadjuvant chemotherapy prior to the point of histological analysis.4,23,24 We observed highly similar correlation coefficients between pseudotime and OS for patients who did and did not receive neoadjuvant chemotherapy (R = −0.256/−0.293, p = 0.357/0.039, respectively), albeit with only the latter reaching statistical significance due to the relatively small number of patients who received neoadjuvant treatment in our dataset (Supplementary Table S1). Analogous trends were observed for correlations between pseudotime and DFS for patients who did and did not receive neoadjuvant chemotherapy (R = −0.355/−0.332, p = 0.435/0.122, respectively). Critically, the underlying histological architecture itself did not appear to significantly vary based on neoadjuvant chemotherapy status prior to sampling (p > 0.05) (Fig. 2). Overall, our findings suggest that PDAC patient outcomes, particularly survival time, are associated with H&E-based histological architecture, with aligned, confluent desmoplasia predictive of worse outcomes.

Identification of clinical features associated with differences in H&E architecture. Correlations
Outcome-negative H&E architecture is associated with greater lymph node involvement
Next, we sought to identify clinically differentiating factors associated with patients exhibiting low versus high H&E pseudotime. We integrated an array of patient metadata (e.g., age, sex, American Joint Committee on Cancer [AJCC] stage, tumor size) with the modeled pseudotime trajectory (Fig. 2). Following correlation of patient-level mean pseudotime with these metadata, we identified a singular, statistically significant correlation of N stage (extracted from AJCC staging) with increased pseudotime (R = 0.266, p = 0.030), suggesting that tumors with outcome-negative histological architecture also exhibited greater lymph node involvement as a whole (Fig. 2). Furthermore, tumor size and number of lymph nodes trended toward significance in correlating with higher patient-level pseudotime (R = 0.231/0.226, p = 0.067/0.067, respectively), suggesting a potential association of more progressed tumors with high pseudotime. All other patient-level metadata were largely noncorrelated with H&E pseudotime (Fig. 2). Collectively, these findings suggest that outcome-negative H&E architecture largely served as an independent prognostic factor in our dataset, but primarily tended to mark tumors with greater lymph node involvement.
Histological signatures correlate with survival in an independent set of images
To validate our prognostic model, we tested the maintenance of clinical correlations in an independent set of patients and their associated H&E images (73,129 tiles). Using the model transformation and nearest-neighbor pipelines in Monocle3 and RANN, respectively, we mapped a set of de novo images to the original pseudotemporal model, predicting pseudotime values in the new testing images based on feature similarity to the original set of training images (Fig. 3A). Across the distribution of testing images, we observed similar correlations between image-level position along the UMAP with both OS and DFS (Fig. 3B-3C). After summarization at the patient level, we once again observed a statistically significant correlation between high predicted values of H&E pseudotime and lower OS (R = −0.491, p = 0.045) (Fig. 3B), indicating that confluent, sheet-like desmoplasia was still predictive of worse survival in the testing dataset. DFS, however, did not reach statistical significance in correlating with patient-level pseudotime (R = −0.144, p = 0.673), for which unknown patient-level disease recurrence status likely contributed to an underpowered assessment (Fig. 3C). Overall, this validation of the histological signature suggested that H&E architecture most strongly predicted differences in survival time for de novo patients.
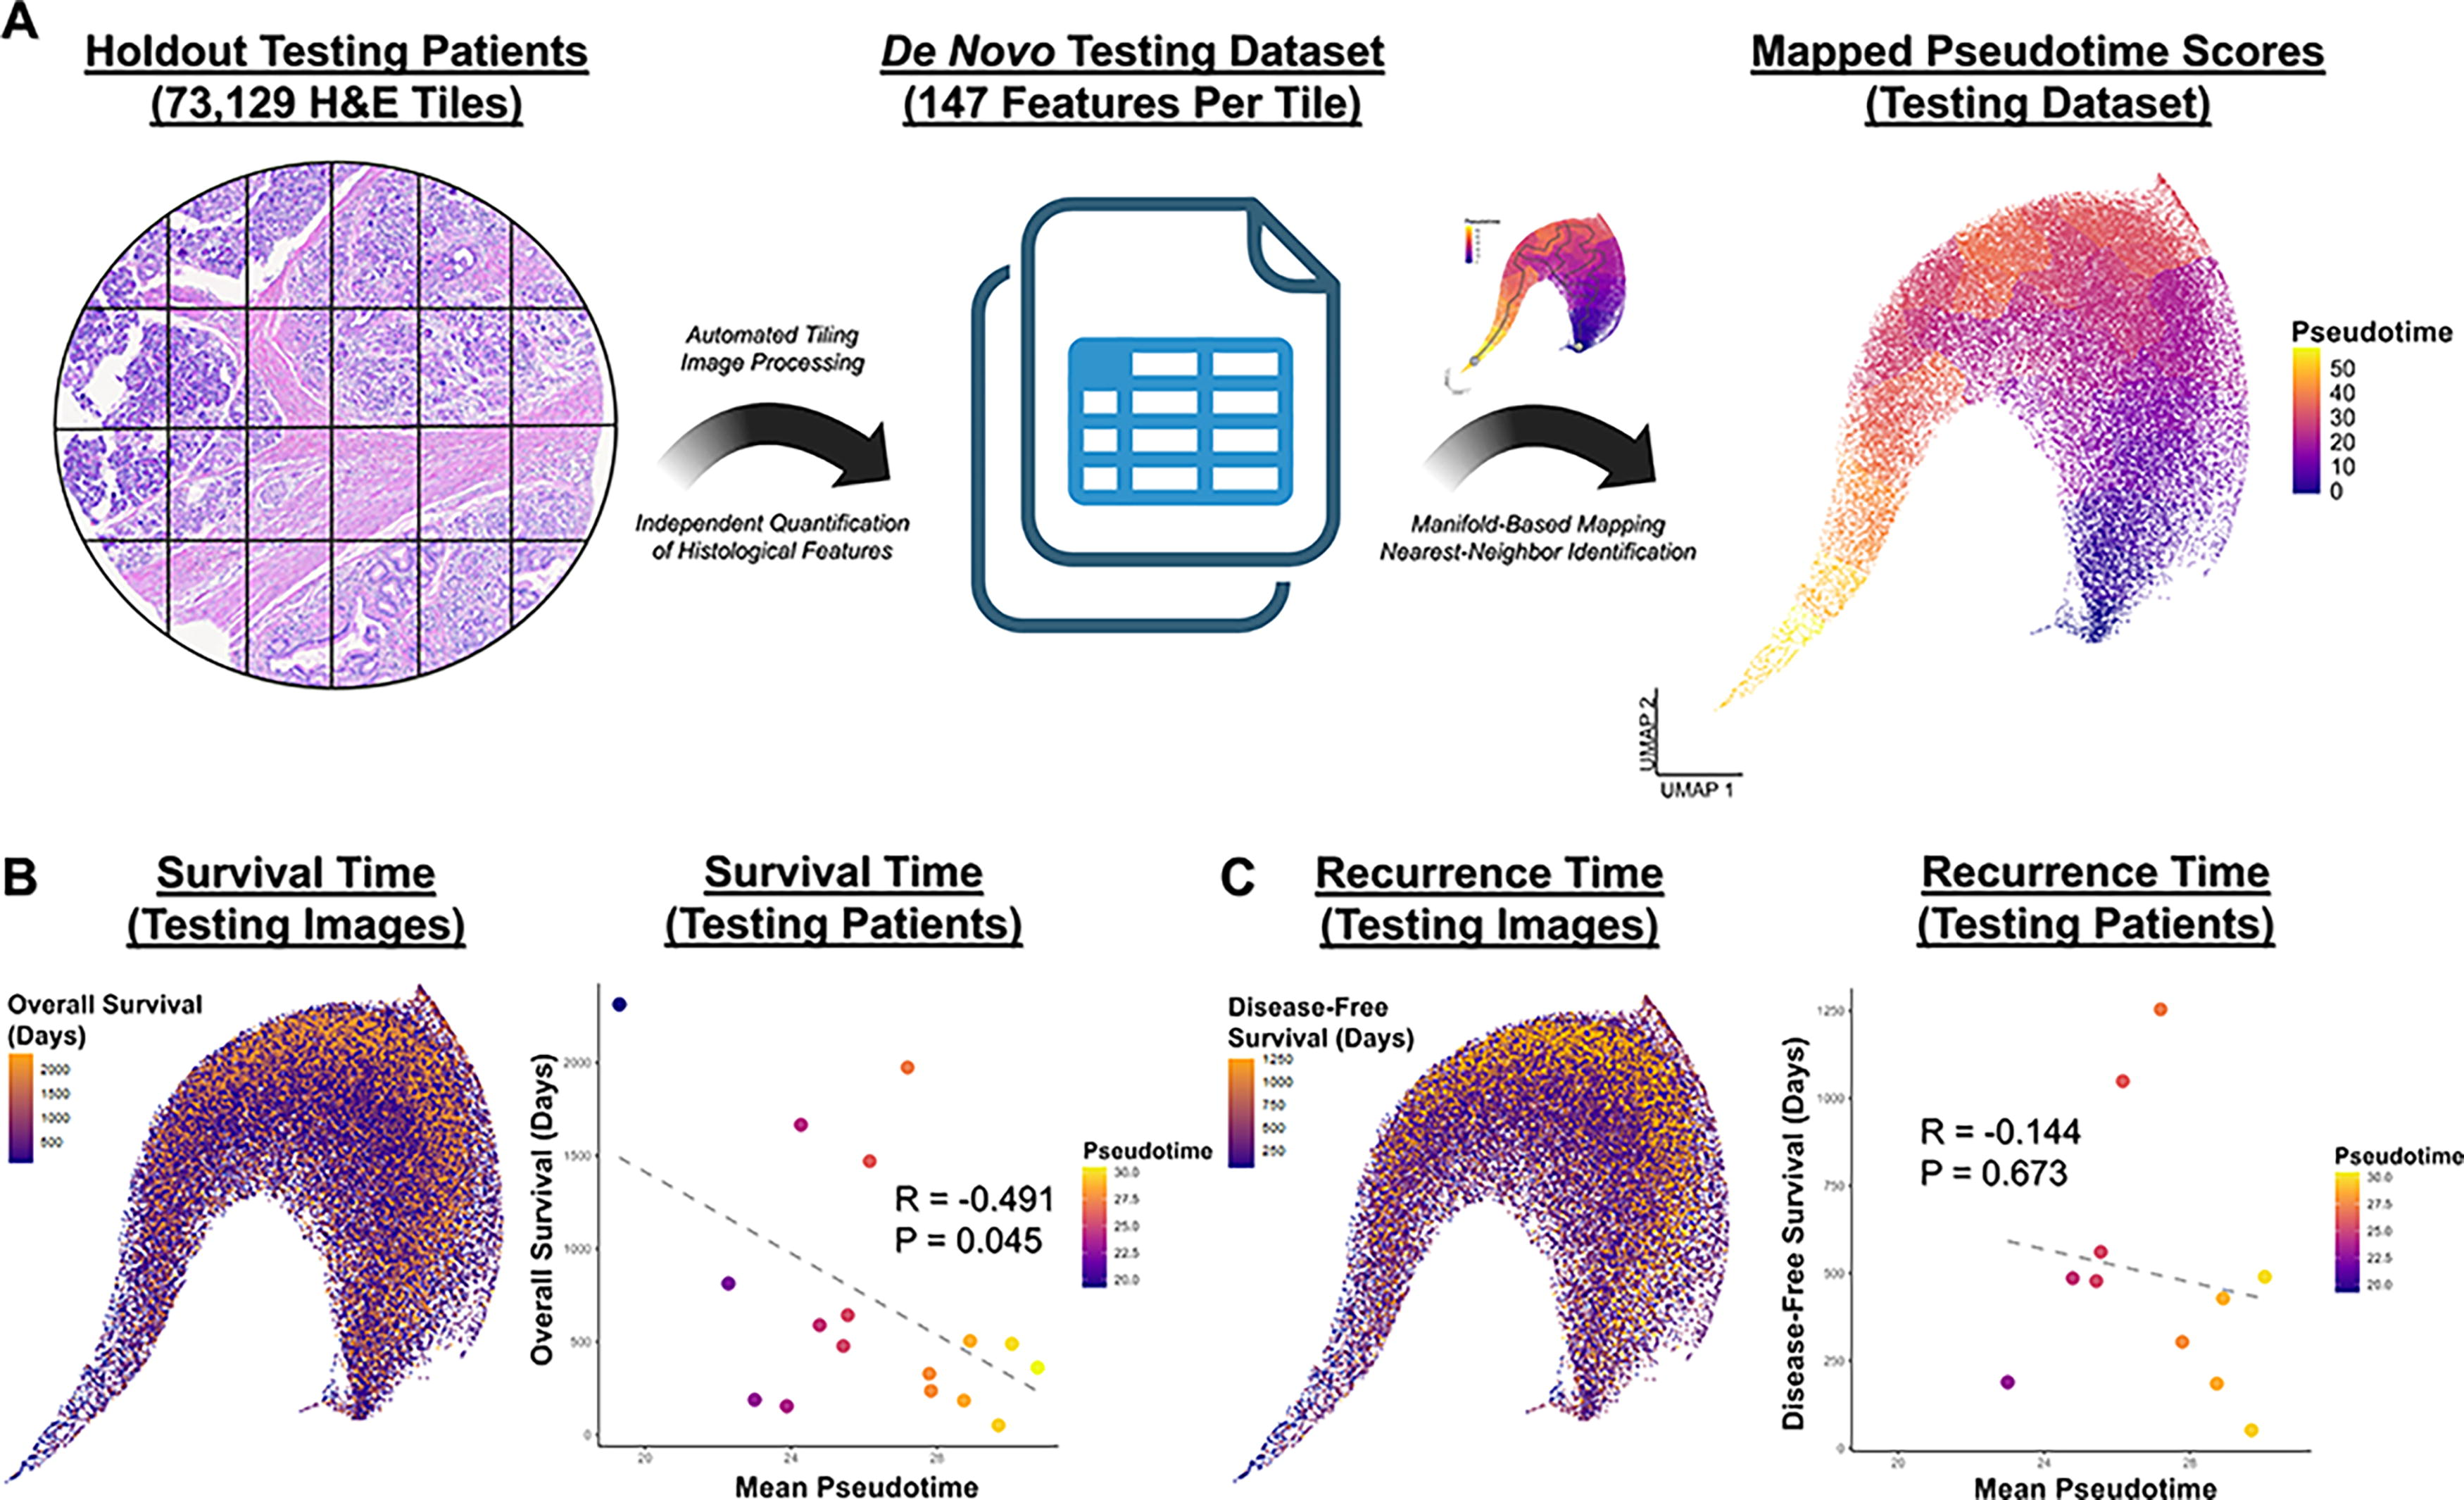
Validation of histological signature using holdout set of testing patients and their associated H&E images.
Histological architecture co-occurs with divergent cell- and protein-based niches
Following the correlation of patient-level histological signatures with clinical metrics, we sought to understand the cellular and biochemical factors associated with intratumoral variability in H&E architecture. Thus, we spatially integrated H&E and CODEX data from consecutive sections, generating co-occurrent tiles for correlation between modalities (Fig. 4A). CODEX data were generated a priori in the form of a previously established reference atlas, providing a spatially indexed profile of cell- and protein-based features within the boundaries of each tile. 4 At the cellular level, we observed that outcome-negative H&E architecture (high pseudotime) was notably associated with greater enrichment of B cells and pericytes (R = 0.150/0.145, p < 0.001/0.001, respectively), suggesting immune/inflammatory infiltration (Fig. 4A). Furthermore, outcome-negative architecture was associated with relatively greater representation of helper T cells, rather than cytotoxic T cells (Fig. 4A). Outcome-positive H&E architecture (low pseudotime), conversely, was spatially correlated with tumor cells and macrophages (R = −0.165/−0.075, p < 0.001/p = 0.021, respectively) (Fig. 4A). Collectively, H&E architecture appeared to delineate intratumoral regions with significant inflammatory cell infiltration (high pseudotime) versus more uniform tumor/stromal cellular composition (low pseudotime) (Fig. 4A-4B). Furthermore, we examined the proteins spatially enriched in regions of high versus low H&E pseudotime across the original 30-plex CODEX panel (Fig. 4C). High H&E pseudotime appeared to define regions with greater fibrotic and inflammatory protein expression (e.g., COL I, IL6, aSMA; R = 0.255/0.247/0.181, p < 0.001/0.001/0.001, respectively), whereas low H&E pseudotime was associated with regions of tumoral, hematopoietic, and stromal protein expression (e.g., E-cadherin, CD45, CD26; R = −0.148/−0.137/−0.137, p < 0.001/0.001/0.001, respectively) (Fig. 4C). Ultimately, mapping of cell- and protein-based niches to localized H&E architecture suggested that outcome-negative histology was defined by immune/inflammatory spatial-biological factors, whereas outcome-positive histology was associated with more uniform tumoral/stromal composition.
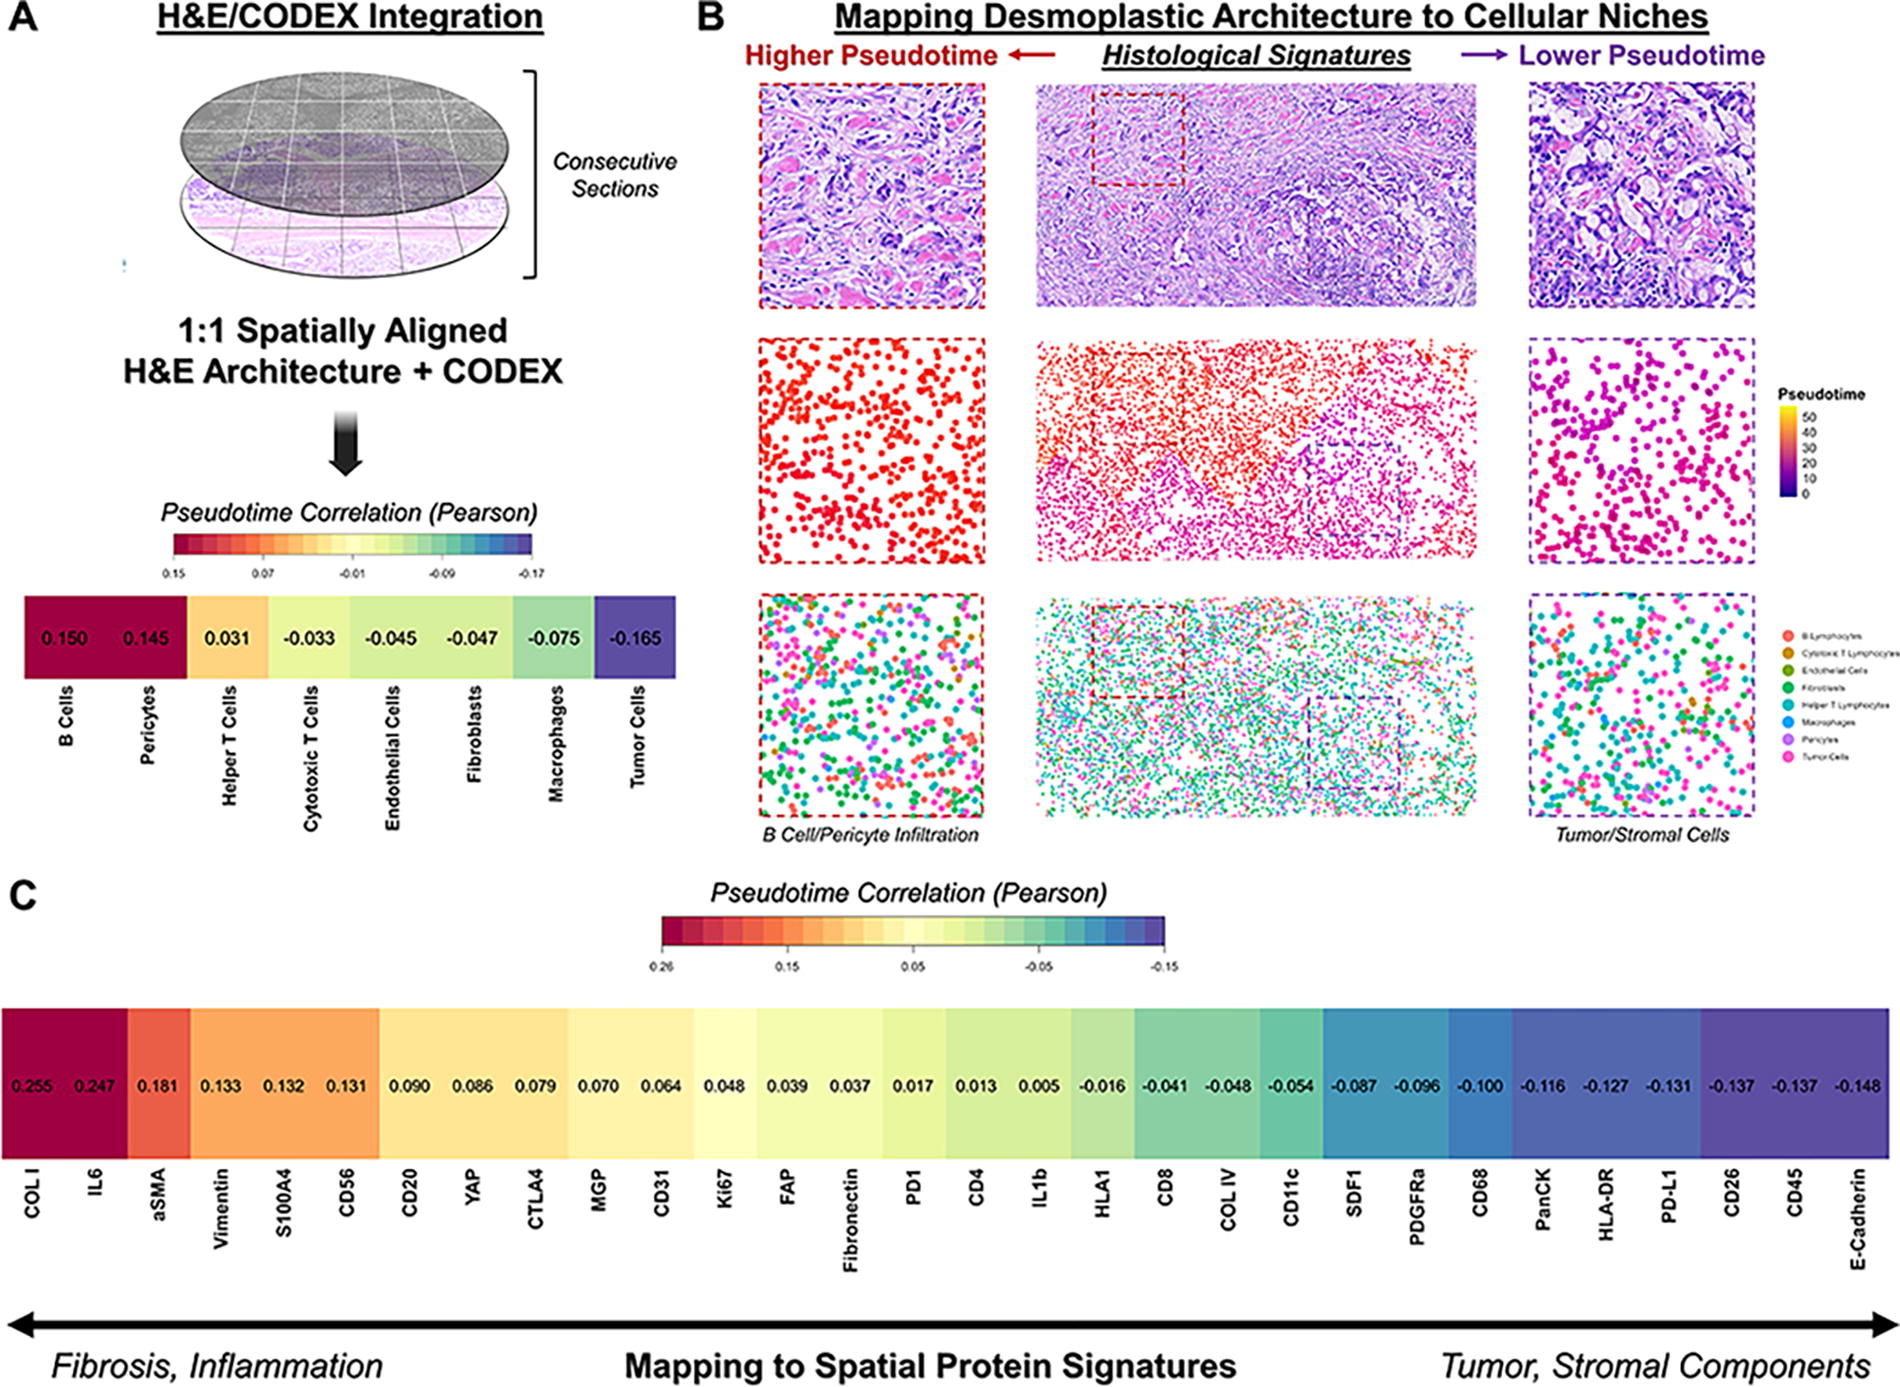
Spatial integration of H&E histological signatures with CODEX to identify architecture-associated biological niches.
Discussion
PDAC desmoplasia has been suggested to play a variety of pathological and ameliorative roles in differentiating patient outcomes and tumor progression. In prior studies, we demonstrated that ECM architecture could be quantified by isolating matrix fiber staining from specialized histological dyes such as trichrome and picrosirius red, which are not commonly utilized in standard clinical workflows for PDAC.4,14,25,26 While we previously demonstrated that matrix architecture can be combined with other clinical and TME-based variables such as treatment status and cell type composition to generate multivariate prognostic models, our goal in the present study was instead to investigate the independent clinical relevance of PDAC histological architecture. 4 In this study, we established that H&E, a routine histological stain acquired for standard pathological evaluations of PDAC, may be applied to quantify scar-associated matrix architecture and provide independent prognostic information. H&E-based fiber quantification appeared to identify an analogous set of morphological features to those identified in our prior trichrome-based analysis, characterized by a continuum from (1) continuous glands within string-like fibers to (2) interrupted pancreatic glands within confluent aligned desmoplasia. 4 These findings suggest that H&E sufficiently delineates desmoplastic features for downstream quantification and prognostication, despite the relatively greater matrix specificity of staining associated with trichrome and other specialized stains.4,26 Furthermore, these findings support emerging computational pathology literature, which suggests that trichrome-like image features can be directly inferred or transformed from H&E imaging.16,27 In addition, while prior iterations of our matrix analysis pipeline required the manual acquisition of thousands of individual images, all tiles utilized in the present study were generated by programmatic tiling of WSIs, producing thousands of subsampled images within minutes and enabling more comprehensive sampling of each histological slide.4,14 The overall analysis pipeline can be largely automated, with the exception of essential data acquisition steps such as WSIs and cropping of WSIs to tumor and stromal regions. Ultimately, our study establishes a translatable, H&E-based matrix signature that may be utilized to identify patient-specific architecture in support of clinical prognosis.
Furthermore, we demonstrated that H&E-based image features can be used to spatially map putative cell- and protein-based niches associated with outcome-negative versus outcome-positive histological architecture. Notably, regions of outcome-negative architecture were associated with localized immune/inflammatory factors at both a cell- and protein level, which may relate to the increased global degree of lymph node involvement for patients with higher mean pseudotime. Interestingly, these factors may have the opposite prognostic value in other cancers such as melanoma, and future studies may utilize spatial transcriptomics and other high-plex phenotyping methods to resolve the granular immune processes occurring within outcome-negative matrix architecture. 28 In the present study, outcome-negative architecture appeared to coincide with localized B cell and pericyte infiltration, which may support prior studies that implicate pericytes in both malignant B cell recruitment and inflammatory cross talk with B cells.29,30 These findings also corroborate prior studies from our laboratory and others that B cell dysfunction may serve as a pathological factor in PDAC,4,31 and the enrichment of cytokines such as IL6 in high pseudotime regions further underscores this inflammatory biological niche.29,32 Interestingly, outcome-negative architecture was also associated with relatively greater enrichment of helper T cells compared with cytotoxic T cells, in accordance with prior reports of CD4+ T cell enrichment as a PDAC progression factor.4,33 Outcome-positive architecture, on the other hand, appeared to involve more uniform tumor/stromal composition. Importantly, these parameters offer a blueprint for further mechanistic modeling of clinically relevant PDAC biological factors using tissue engineering methods, including (1) recapitulation of outcome-negative desmoplastic patterning through controlled scaffold fiber architecture, (2) modulation of B lymphocyte/pericyte composition to mimic clinically divergent cellular niches, and (3) inclusion of IL6 to simulate localized inflammatory niches.
Conclusions
Overall, our findings indicate that the desmoplastic architecture of PDAC may be quantified from routinely available H&E sections and utilized to support clinical prognosis and/or map spatial-biological niches. Outcome-negative histological architecture appears to coincide with a localized inflammatory niche, including cytokines such as IL6 and the enrichment of B cells and pericytes. These spatial-biological factors may be further assessed mechanistically using tissue engineered models of PDAC.
Footnotes
Authors’ Contributions
J.L.G., S.M., D.S.F., D.J.D., J.A.N., and M.T.L.: contributed to conceptualization; J.L.G., D.M.L., S.M., and D.S.F.: performed data curation; J.L.G., D.M.L., and S.M.: conducted formal analysis; J.A.N. and M.T.L.: supervised the project; J.L.G., D.M.L., S.M., D.S.F., A.K., M.F.D., A.T.N., A.R.B., M.S.C., N.J.G, M.G., E.M., M.J., S.S.R., T.A.L., and D.J.D.: performed the investigation; J.L.G. and D.M.L.: generated visualizations; all authors contributed to manuscript writing, reviewing, and editing; S.S.R., T.A.L., D.J.D., J.A.N., and M.T.L.: provided scientific and technical resources; and J.L.G., J.A.N. and M.T.L.: contributed to funding acquisition.
Disclosure Statement
The authors declare no competing financial interests.
Funding Information
We acknowledge funding from the

References
Supplementary Material
Please find the following supplemental material available below.
For Open Access articles published under a Creative Commons License, all supplemental material carries the same license as the article it is associated with.
For non-Open Access articles published, all supplemental material carries a non-exclusive license, and permission requests for re-use of supplemental material or any part of supplemental material shall be sent directly to the copyright owner as specified in the copyright notice associated with the article.
