




Abstract
Model systems play a crucial role in biological and biomedical research, especially in the search for new treatments for challenging diseases such as glioblastoma multiforme (GBM). Organoids are 3D in vitro multicellular “middle-ground” model systems that recapitulate highly organized and heterogeneous in vivo organ-like systems, often through stem cell differentiation. Incorporating Matrigel™ or other exogenous extracellular matrices (ECMs) that do not naturally occur in the human body is common practice for organoid generation, ignoring the role of dynamic reciprocity between the cells and the ECM in tissue development. In this study, we describe a method to develop GBM organoids (GBOs) from cells without the need for exogenous ECM encapsulation and without cell culture media changes to produce stable tissue-like organoids that reach a 4 mm diameter in as little as 6 weeks. We observed a transition from homogenous cell populations to tissue-like structures when GBOs were larger than 1 mm in diameter. Transcriptomic analysis revealed that the greatest gene expression changes occurred when GBOs were 2 mm in diameter, with collagen VI as the most upregulated ECM-related gene. Quantitative and histochemical assessments further supported native ECM synthesis with significantly higher levels of glycosaminoglycans and collagen in GBOs compared with spheroids. To our knowledge, this study presents the first reproducibly large GBOs with natively produced ECMs. Organoids with natively synthesized ECMs promise to eliminate artifacts and variability from aged, homogeneic, or xenogeneic scaffolds and to provide insights for ECM-targeted drug development.
Impact Statement
Glioblastoma multiforme (GBM) is the most common and deadly brain tumor due to its complex tissue heterogeneity. Drug development for GBM is difficult because GBM models are not very translatable and are limited, leading to the need of GBM organoids (GBOs). Current GBO development is highly laborious and of questionable relevance because of the reliance on non-native, animal-derived extracellular matrix (ECM). This study describes a scalable and reproducible method of developing GBOs with natively generated ECMs. These GBOs allow for both the study of the early stages of GBM that are currently inaccessible and a quicker and more translatable tool for GBM drug screening and development.
Introduction
Glioblastoma multiforme (GBM) is the most common and deadliest type of brain tumor. It comprises 57% of gliomas in adults, leading to a poor prognosis of 12–15 months due to limited understanding of the complex etiology of GBM.1–3 GBM tumors, in theory, originate from mutated glial cells that transformed into glioblastoma stem cells (GSCs) that are resistant to treatment.4–7 GSCs differentiate and proliferate in an unregulated manner, generating a variety of tumor-supporting cells that secrete an extracellular matrix (ECM), which in turn supports tumor maturation and persistence. 8 The ECM is a complex group of biopolymers that are required to maintain GBM tumor tissue structural integrity and aids in cellular function, migration, angiogenesis, and modulates the response to external stimuli.9–12 The complex and currently unpredictable nature of GBM tumors pose challenges for researchers to effectively model and study tumorigenesis for advanced treatment. One key impediment is the scarcity of viable tumor tissues for study, especially in the early stages.
Human tissue-derived ex vivo models are the most accurate models for observing the behavior of mature tissues but are difficult to access. Excised tumors are often from later stages of the disease, impairing the ability to study the early, more treatable, stages of GBM tumorigenesis.13,14 Animal models are the next best models to humans. However, there are inherent drawbacks such as poor species-to-species translation and the laborious, time-consuming nature of animal models.5,15–17 Furthermore, there is an ever-present call to reduce, refine, and replace to minimize the use of animal models. To this end, in vitro models capable of closely mimicking in vivo tumorigenesis and pathophysiological tissues are needed. Current in vitro models include 2D monolayer cell culture and 3D cell aggregate culture. While these in vitro models have contributed to many advances in GBM treatment, they often consist of multiple cell types from varying sources. Furthermore, they often rely on synthetic or animal-derived exogenous ECM scaffolds.5,15,17,18 The current understanding of GBM tumorigenesis is not believed to start with multiple cell types nor pre-existing ECMs, thus highlighting the limitations of current models. Therefore, a surrogate tissue-based or organoid model generated solely from the cancer cells themselves is more desirable.
Organoids are 3D millimeter-scaled, multicellular, tissue-like systems that model desired tissue structures and functions in vitro. Organoids are often developed from pluripotent stem cells with guided differentiation. Similar to organs, tumors are multicellular tissues with ECM and therefore can be modeled by organoids. Lancaster et al. developed the first cerebral organoid that has inspired subsequent development of stem cell-derived GBM organoids (GBOs).19,20 These GBOs begin with 3D aggregates of GSCs that are then differentiated through directed stem cell differentiation culture media.20,21 The differentiated aggregates are then encapsulated in Matrigel™, a murine laminin-rich exogenous ECM hydrogel, and cultured in a bioreactor under constant shear stress. This process is highly laborious, time-consuming, and less biologically relevant.17,19–21 GSC-derived organoids exist through 3D bioprinting and genetic engineering, but they include coculture of nonpatient derived cells.15,22–25 Collectively, the xenogenic and heterogenic nature of these models limit their relevance and utility to model GBM.
Dynamic reciprocity in GBM refers to the bidirectional interaction between GBM cells and their surrounding microenvironment, notably how the ECM is a primary fate determinant of the tissue.26,27 Tenascin C (TNC), fibronectin, laminins, collagens, and hyaluronic acid (HA) are important ECMs during GBM development.5,11,28–31 TNC, fibronectin, and collagen are associated with angiogenesis and can be used to determine tumor malignancy and chemoresistance. 29 Dynamic reciprocity of HA, or high turnover of HA, is required for GBM malignancy. 29 Utilizing a non-natively synthesized ECM leads to structures and behaviors that do not model the disease.
Because cancer stem cells, also sometimes called tumor initiating cells, are sufficient to initiate the disease, we hypothesized that they are sufficient to generate disease-relevant organoids. As such, we have previously developed methods utilizing only GSCs to self-induce differentiation into organoids without the need for exogenous ECM scaffolds. 32 In these bioreactor-cultured GBOs, we observed heterogeneity of cells akin to intratumoral heterogeneity observed in GBM patient tissues. However, whether these GBOs adequately model tumor microenvironments (TMEs) via the synthesis of native ECMs remains to be demonstrated. Herein, we seek to develop and characterize GBOs’ endogenous ECMs via transcriptomic, biochemical, histological, ultrastructural, and biomechanical analyses to better model GBM and to study the role of GBM TME in disease development.
Methods
Cell culture
The human patient-derived xenograft (PDX) cell line JX6 was kindly provided by Dr. Yancey Gillespie (The University of Alabama at Birmingham). JX6 is a classical subtype of GBM with amplified variant III mutation (exons 2–7 deleted) of epidermal groth factor receptor (EGFR), cyclin-dependent kinase inhibitor 2A (CDKN2A) homozygous deletion, and unmethylated O6-methylguanine-DNA methyltransferase (MGMT) promoter. U251 is a human glioblastoma astrocytoma cell line that was purchased from American Type Culture Collection (ATCC). Both cells were cultured in neural stem cell expansion medium (NBE) composed of Neurobasal™-A medium (10888022, Gibco™) supplemented with 0.5X GlutaMax™ (35050061, Gibco™), 1X B-27™ Supplement minus vitamin A (12587010, Gibco™), 1X penicillin-streptomycin (30-002-CI, Corning®), 2.5 μg/mL amphotericin B (30-003-CF, Corning®), 20 ng/mL recombinant human epidermal growth factor (100-26, Irvine Scientific), 20 ng/mL recombinant human fibroblast growth factor-basic 154/FGF-2 (100-146, Irvine Scientific), and 8 μg/mL heparin (AK3004-1000, Akron).33,34 Cells were expanded in standard tissue culture polystyrene flasks at a seeding density of 105 live cells/mL and incubated at 37°C with 5% CO2 cell culture conditions. Cells were fed as needed, every 2–3 days, until ready for passage. JX6 cells were dissociated with 1 mL of Accutase® (A6964, Sigma-Aldrich) for 3–5 min at room temperature. U251 cells were dissociated with 1 mL of trypsin-ethylenediaminetetraacetic acid (EDTA) (0.25%), phenol red (25200072, Gibco™) at 37°C for 3–5 min.
GBOs
We slightly modified our previously published GBO protocol by introducing a spheroid preformation step. 32 The GBM tumor cells individually, either JX6 or U251, were expanded and seeded into a cell-repellent surface U-bottom shaped 96-well plate (U96) (650979, Greiner) at a seeding density of 104 live cells/100 μL media/well in the same NBE and culture conditions described in the cell culture methods. This initial seeding into a U96 was necessary to induce spheroid formation until the spheroids reached a critical threshold size (CTS) of 400–600 μm. After the GSC spheroids reached the CTS, they were transferred into a 100 mL dimpled bioreactor with an internal impeller (CL2-1450-100, Chemglass) at a sublethal shear stress of 0.5 Pa (120 rpm) induced by a magnetic stir plate (CLS-4100-A6, Chemglass) in the same NBE and cell culture conditions. No other cell culture media or ECM scaffolds were utilized throughout the entirety of GBO development. Bioreactor maintenance and image analysis were performed as described in Supplementary Data.
Transcriptomics via RNA sequencing
JX6 spheroids and GBOs were flash frozen without dissociation before RNA extraction. RNA was extracted according to the manufacturer’s protocol for tissue samples (GeneJet RNA Purification Kit, K0731) and sequenced in Illumina NovaSeq 6000 for 25 M paired reads at HudsonAlpha’s Discovery Life Sciences. FASTQ and BAM files were generated along with gene and transcript count analyses. A counts matrix was generated in-house in R (v4.3) to perform differential gene expression analyses using the DESeq2 R Package (v1.42.0) following the standard workflow as previously published.35,36 Principal component analysis (PCA) was performed after performing variance stabilizing transformation on the DESeq data and visualized using ggplot2 R Package (v3.4.4). Volcano plots were performed and visualized using the EnhancedVolcano R Package (1.20.0) with a 0.01 p-adjusted cut-off and 1.0-fold change (FC) cut-off. Heatmaps were generated using the ComplexHeatmap R Package (v2.18.0) filtering genes with p-adjusted < 0.05, base mean >100, and | log2FC | > 1.5 to return top 11 differential genes with respect to size. Gene ontology analyses were performed using the clusterProfiler R Package (v3.18) as previously published.37,38
Scanning electron microscopy
GBO samples were fixed in 4% paraformaldehyde in 1X phosphate buffered saline (PBS) at 4°C overnight, followed by glutaraldehyde and osmium tetroxide treatments. Stepwise dehydration with ethanol was performed, ending with samples suspended inside a microporous specimen capsule (70187-20, Electron Microscopy Sciences) soaked in a dish with 100% ethanol. Critical point drying was performed (DCP-1, Denton) utilizing CO2 as the transitional fluid. Scanning electron microscopy (SEM) sample stubs were coated with conductive carbon adhesive tape (77817-12, Electron Microscopy Sciences), and samples were sputter-coated with 10–20 nm gold before imaging on an Apreo FE SEM (Thermo Scientific) at 5.0 kV and 6.3 pA using the Everhart-Thornley detector in secondary electron mode.
ECM quantification
Spheroids and GBOs were flash frozen and stored in −80°C until ready for ECM quantification. Total collagen was quantified utilizing a hydroxyproline-based Sensitive Tissue Collagen Assay (QZBTISCOL 1, QuickZyme). Elastin was quantified utilizing 5,10,15,20-tetraphenyl-21H,23H-porphine tetrasulfonate-based Fastin™ Elastin Assay (F2000, Biocolor). Sulfated glycosaminoglycans (sGAGs) were quantified utilizing a dimethylmethylene blue-based Blyscan™ Glycosaminoglycan Assay (B1000, Biocolor). All assays were performed according to the manufacturer protocol recommended for tissue samples.
Compressive modulus testing
Compressive modulus of spheroids and GBOs were measured while submerged in untreated neurobasal media at 37°C with a MicroTester G2 (CellScale). Appropriate beam sizes were chosen with respect to the stiffness of the samples and measured at 57 mm. The samples were pipetted into the media bath and allowed to adjust for 5 min before starting each cycle, totaling to 3 cycles. Compression was limited to 20% of the initial size to avoid permanent deformation with a strain rate of 5 µm/s.
Histological stains
All histological stains were performed on 5-μm-thick, paraffin-embedded samples prepared as described in Supplementary Data. Collagen was stained using a picrosirius red stain assay (24901-250, Polysciences) without nuclear staining according to the manufacturer protocol. Elastin was stained using Verhoff’s Van Geison staining (26374-Series, Electron Microscopy Science) as previously published. 39 Alcian blue 8GX (J6012214, Thermo Scientific) in 3% acetic acid, pH 2.5, was used to stain HA and GAGs as previously published. 40 All histological slides were cleared in xylene and mounted with CytoSeal™ 60 mounting medium (18007, Electron Microscopy Sciences) and a coverslip.
Fluorescent staining
Sections were either paraffin-embedded or frozen as described in Supplementary Data. Whole-mounted spheroids were stained in mini centrifuge tubes, pipetted onto a cavity slide (BI0086B, Eisco™) with a cut 100 μL pipette tip, then mounted with ProLong™ Diamond Antifade Mountant (P36965, Invitrogen™) with a 12 mm circular coverslip (89015-725, VWR). Primary antibody and secondary staining were performed according to Table 1. Cell nuclear staining was performed with Hoechst 33342 (H1399, Invitrogen™). Fluorescent confocal imaging was performed using Nikon C2 Laser Scanning Microscope.
Primary Antibody (1° AB) and Secondary (2° AB) Staining Chart
Rb: rabbit.
Gt: goat.
Rt: rat.
Ms: mouse.
Statistical analysis
Data visualization and statistical analyses were performed in GraphPad Prism (v9.0). Twenty or greater samples were imaged and analyzed with no statistical outliers determined. RNA sequencing (RNA-seq) data were analyzed using various DESeq2-related packages in R as described in the RNA-seq section. ECM quantification data were also visualized and statistically analyzed in GraphPad Prism using one-way ANOVA with a Tukey–Kramer honestly significant difference (HSD) post hoc test. There were n = 3 biological replicates and n = 3 technical replicates for ECM quantification. All error bars represent the standard error about the mean.
Results
Preformation of spheroids was necessary to produce large GBOs under constant shear
We previously demonstrated the successful biomanufacturing of GBOs from single cells using sublethal shear rates. 32 The study elucidated that spatially organized transdifferentiation occurred in the transition from spheroids into organoids. However, there was a limit to the size of GBOs that could be biomanufactured. Here, GBM spheroids were cultured in static conditions until they reached a CTS of 400–600 µm prior to their inoculation into bioreactors (Fig. 1A). This spheroid preformation allowed a successful biomanufacturing of GBOs with diameters of ≥4 mm in 47–60 days (Fig. 1B–D). U251 reached a diameter of ≥4 mm faster than JX6 but at the detriment of its reproducibility, measured by the variance of size and circularity (Fig. 1C–D). The results reflect GBO growth measured primarily by their size (i.e., diameter), as the total number of GBOs did not change over the culture period (i.e., no fusion of preformed spheroids).

Glioblastoma organoid (GBO) production.
Transcriptomic analysis suggested ECM formation was dependent on GBO size
The transcriptome of the JX6 source cells, spheroids at CTS, and GBOs with 1–4 mm diameters were compared via RNA-seq (Fig. 2 and Supplementary Fig. S1). PCA demonstrated three distinct clusters (Fig. 2A): source cells and spheroids, 1 mm GBOs, and all other GBOs that were ≥ 2 mm. These findings suggest that there were few changes between the monoculture and the spheroids, whereas the greatest developmental changes in the GBOs occurred between the 1 mm and 2 mm diameter size range. These changes appear to reach a homeostasis after 2 mm.
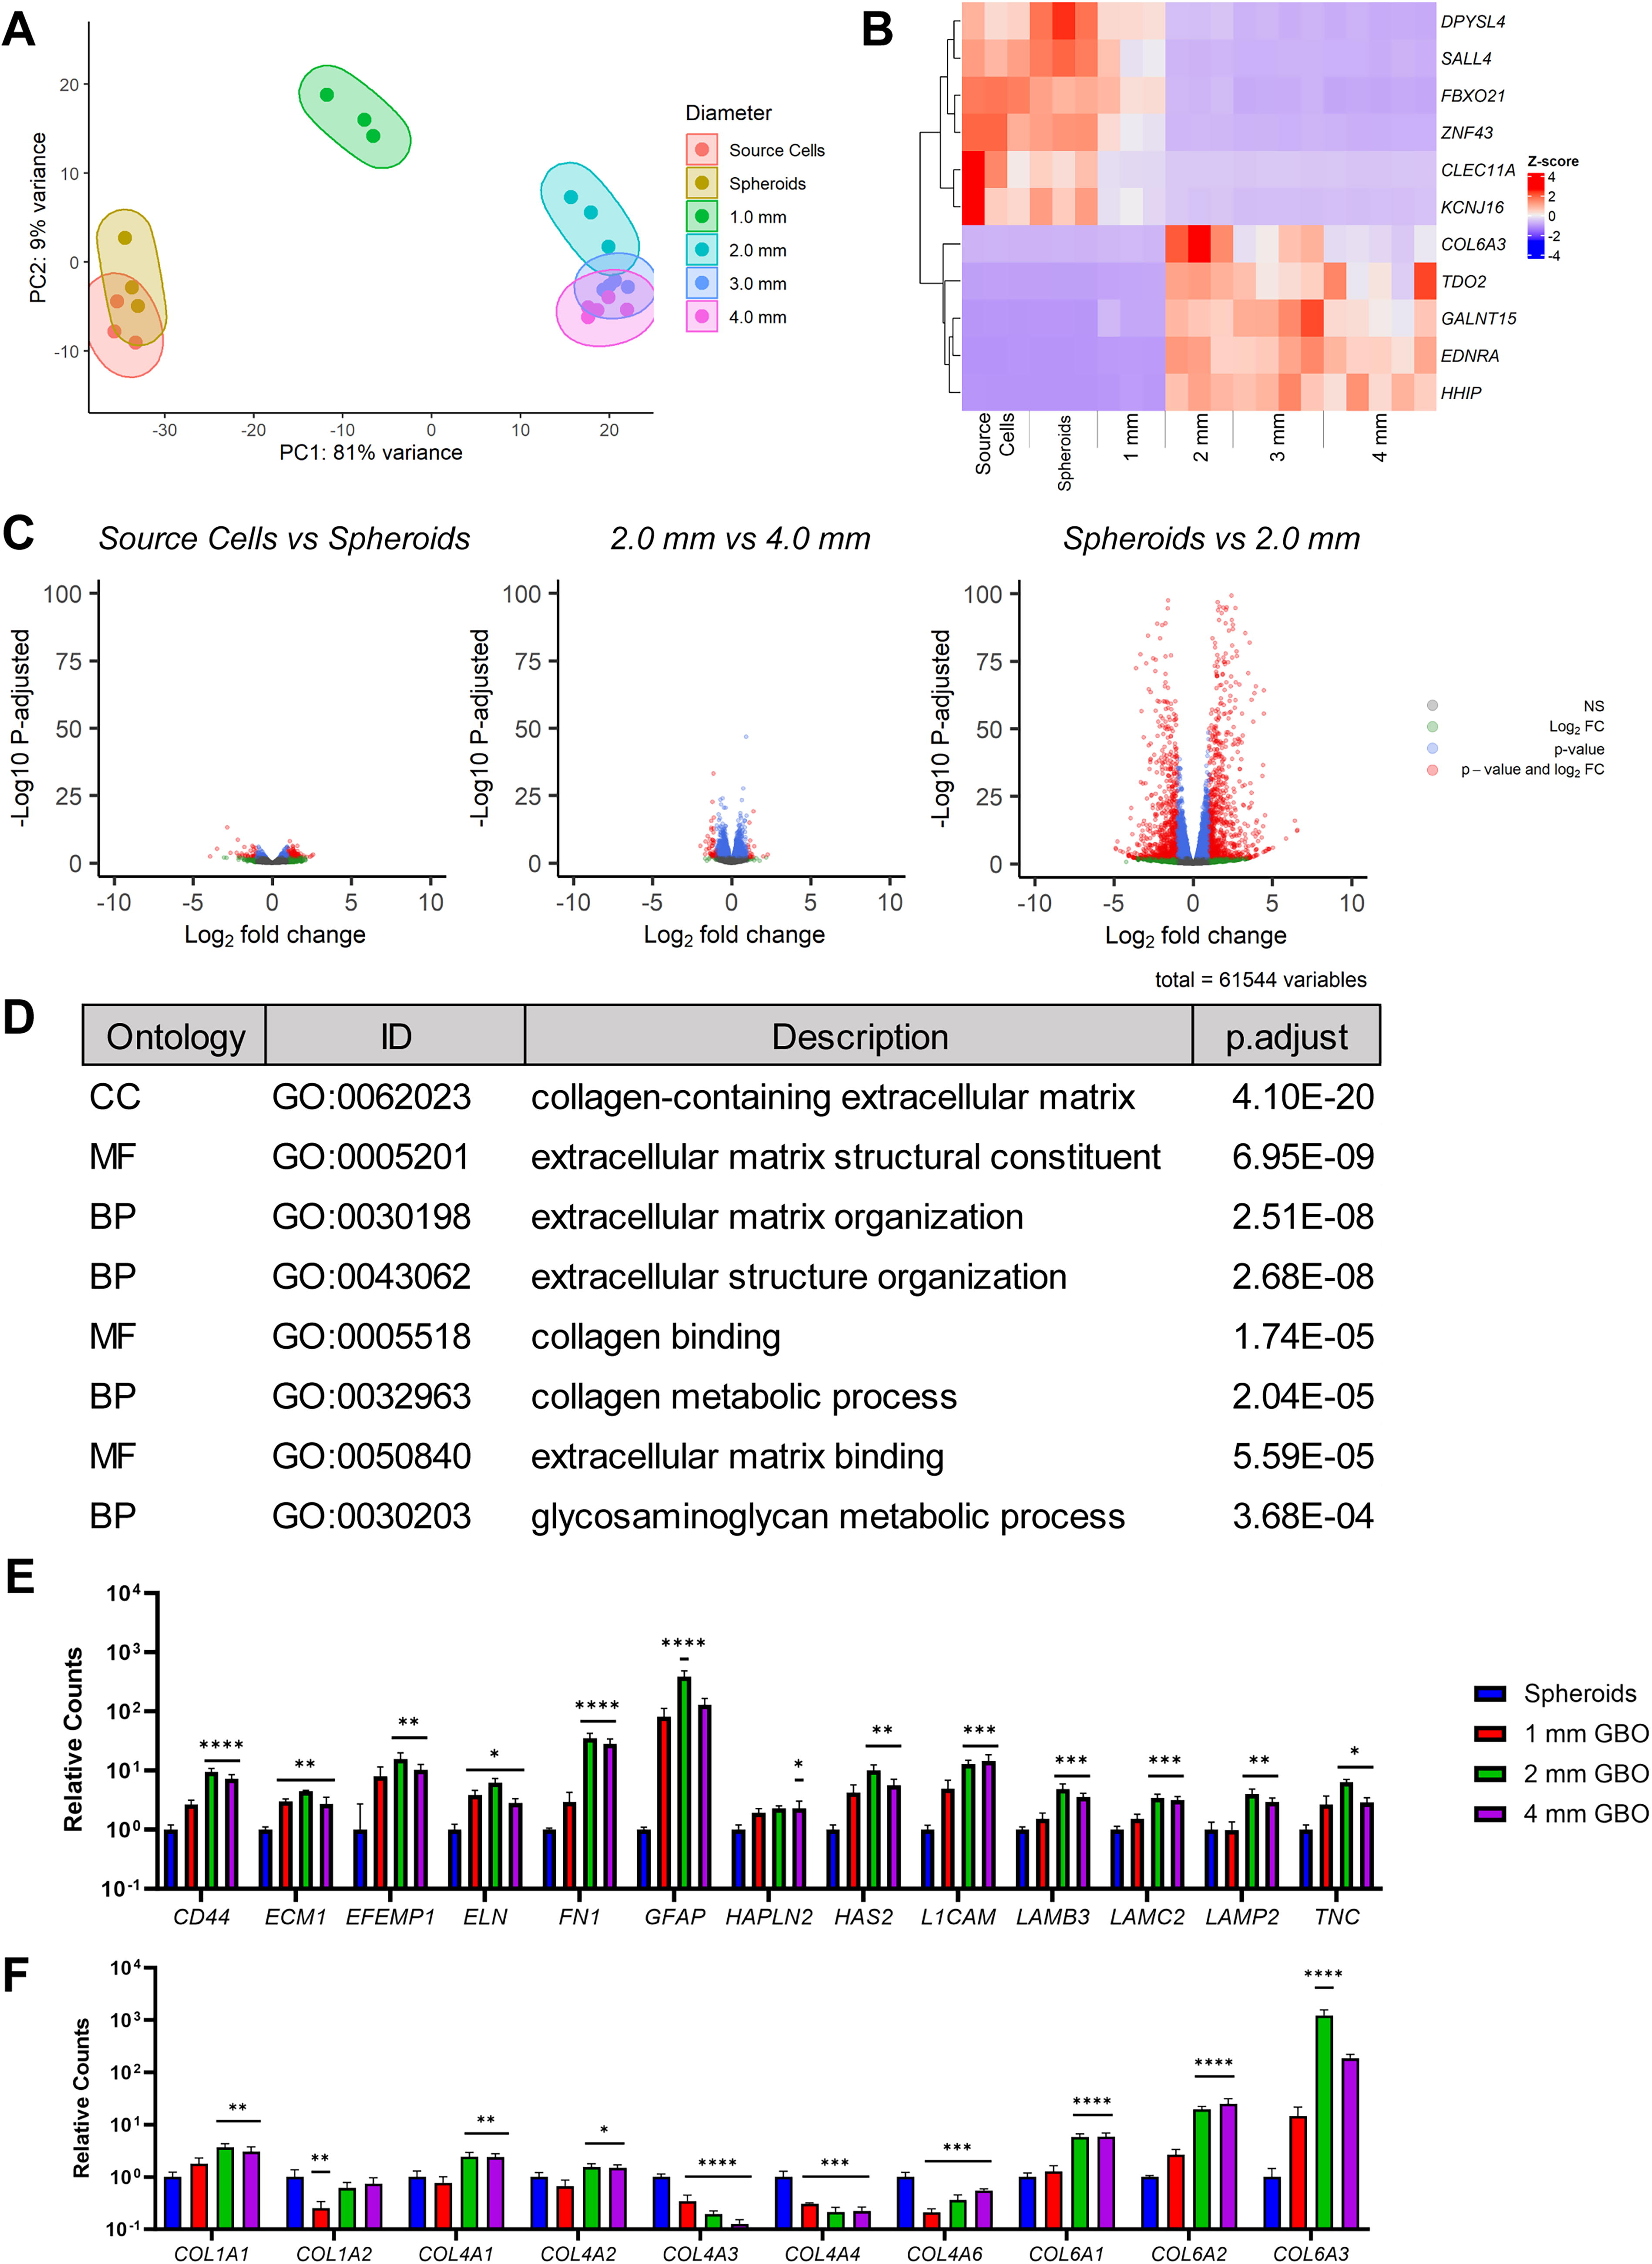
Transcriptomics of GBOs.
The top 11 differentially expressed genes were identified using a stringent criterion (p-adjusted <0.05, base mean >100, | log2FC | > 1.5) (Fig. 2B). In the top left quadrant, control samples exhibited the upregulation of neurogenesis genes (DPYSL4 and SALL4), genes that were expressed in hematopoietic progenitor cells (FBXO21 and CLEC11A), and genes involved in cell and gene regulation and development (CLEC11A and KCNJ16). Conversely, the bottom right quadrant revealed varying expression levels of ECM-related COL6A3 in 2–4 mm GBOs, along with an upregulation of an antitumor immune response suppression gene (TDO2) and genes associated with tissue/organ development, function, and communication (GALNT15, EDNRA, and HHIP). Notably, the 2 mm GBOs displayed the most pronounced upregulation in the ECM-related gene COL6A3. The results from Figure 2A-C further suggest that a transition occurred between 1 and 2 mm GBOs from single-cell molecular signatures to tissue-like signatures. The 1 mm GBO transcriptome displayed a transitional state with both a single cell-like to tissue-like gene expression. In summary, the monocultures, spheroids, and 1 mm GBO samples had an upregulation of genes toward neurogenesis, whereas the GBOs with ≥2 mm diameters had an upregulation in genes related to new tissue generation or tumorigenesis.
As such, the 2 mm milestone became the focus of our subsequent enriched gene ontology (EGO) analysis. The top eight differentially expressed EGOs related to ECM in biological processes (BP), cellular components (CC), and molecular functions (MF) were determined (Fig. 2D). Comparing relative gene counts with respect to spheroids, ECM genes of interest (i.e., elastin-, fibronectin-, laminin-, TNC-, and HA-related genes) showed consistent upregulation when GBOs were 2 mm, but varying regulation at 1 mm or 4 mm diameters (Fig. 2E). Interestingly, collagen-related genes showed varying regulation with significant upregulation in GBOs >1 mm for COL6A1-3 (Fig. 2F).
Global protein expression in GBOs generally followed transcript expression patterns
Collagen, elastin, and sGAGs are all ECM components commonly found in the brain. Each of these were quantified at CTS spheroids, 2 mm, and 4 mm GBOs relative to initial wet mass (Fig. 3A). The relative quantities of total collagen and sGAGs closely reflected those of the transcriptomics patterns in Figure 2D–F. Elastin was the exception, having nearly double the detected quantity of its hydrolyzed form (i.e., α-elastin) in spheroids than in 2 mm and 4 mm GBOs.
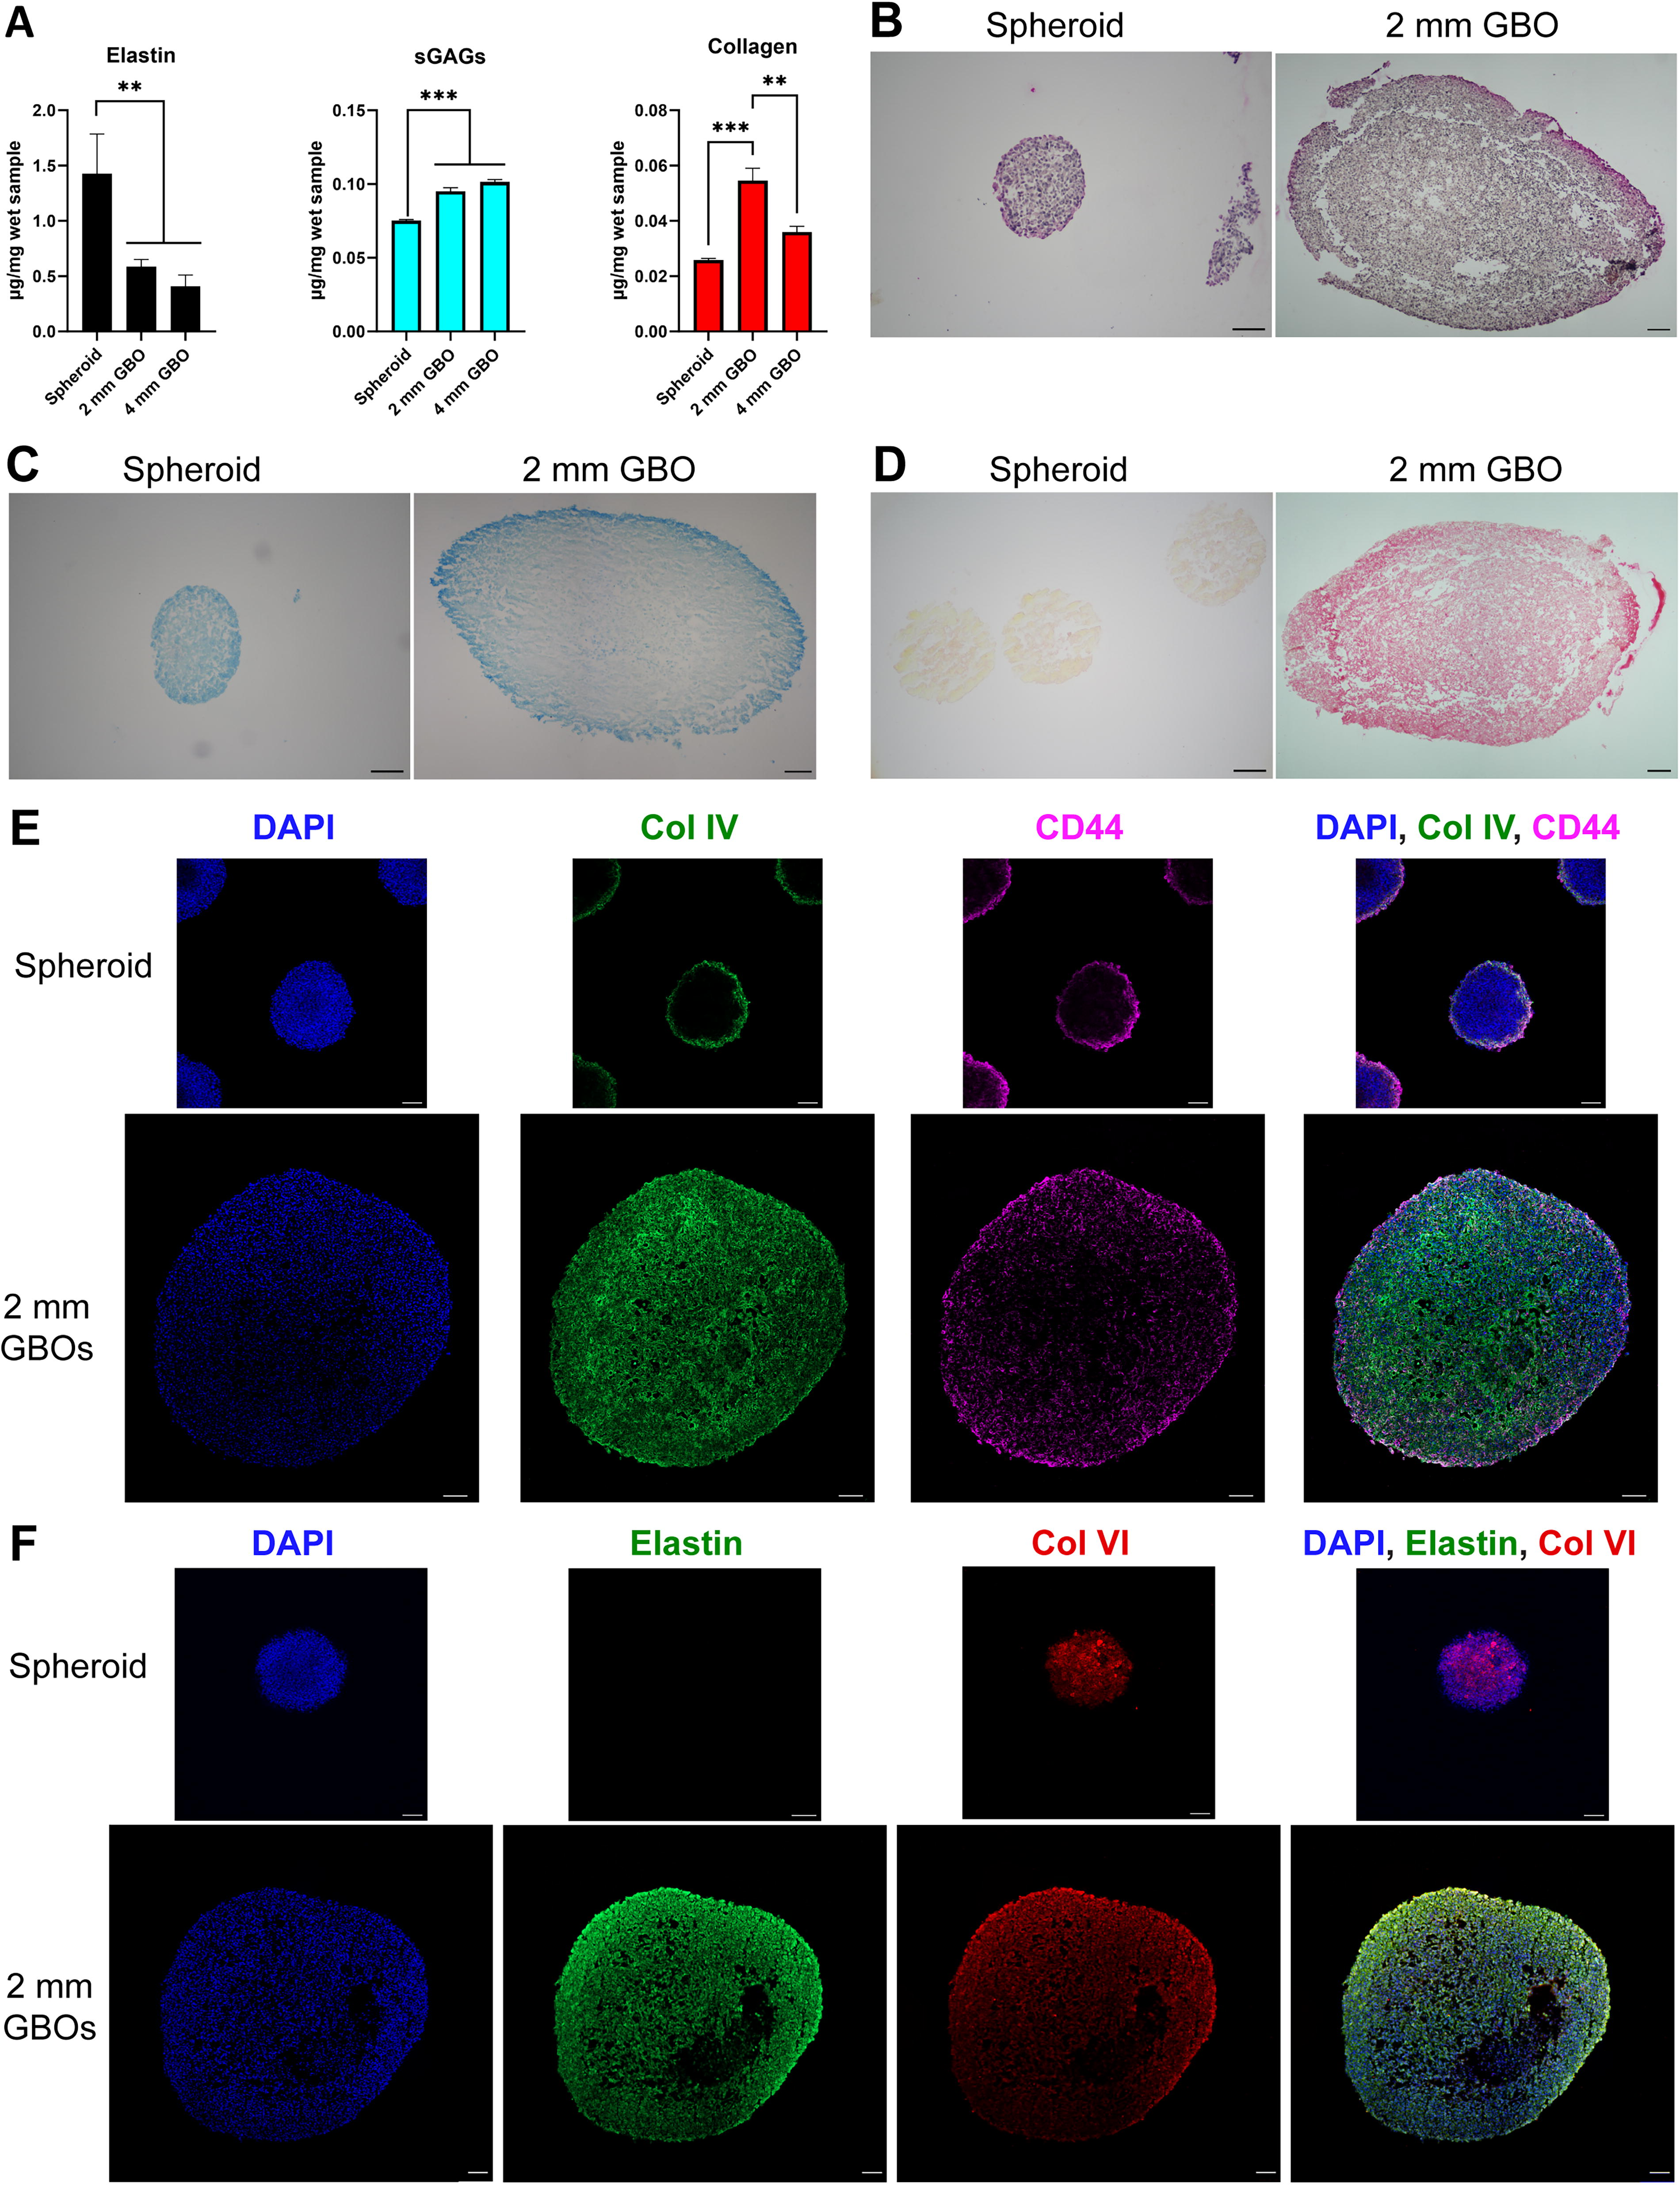
Quantification and visualization of GBO extracellular matrix.
In histological and immunohistochemical (IHC) stains, spatial localization of sGAGs and collagen IV were observed, but not for elastin and collagen VI (Fig. 3B–F). Histological stain of elastin showed global expression in both spheroids and GBOs (Fig. 3B), which was corroborated with IHC stains, although GBOs displayed higher immunoreactivity to the full-length elastin antibody than the spheroids (Fig. 3F). sGAGs were concentrated to the periphery of both the spheroids and GBOs in histological stain (Fig. 3C). This was also corroborated with CD44 IHC staining as a surrogate measure of sGAG localization (Fig. 3E), as CD44 is one of the main receptors for HA, the most abundant sGAG in the brain. Histological stain also indicated an increased expression of total collagen in GBOs versus spheroids (Fig. 3D). Interestingly, IHC stain showed that collagen IV was localized to the periphery of the spheroids but was globally expressed in GBOs, whereas collagen VI exhibited global expression in both spheroids and GBOs (Fig. 3E–F).
GBO stiffness was similar to those of diffuse low-grade gliomas
The Young’s modulus, or stiffness, of gliomas was reported to have a broad range from 50 Pa to 1.4 × 10⁴ Pa, depending on their aggresiveness. 41 Of these, low-grade gliomas (LGGs) are softer with 50–1.4 × 10³ Pa stiffness. The spheroids and GBOs produced here appear to reflect the stiffness of LGGs (Fig. 4). Because spheroids appear to be more densely packed with cells and had some ECM secretion, one can expect spheroids to be the stiffest. However, 2 mm GBOs were significantly stiffer than the spheroids (Fig. 4A). The representative stress–strain curves displayed hysteresis shift for all samples, where spheroids appeared to reproducibly recover to its initial shape the most between cycles, suggesting that it was the most elastic (Fig. 4B–D).

Compressive modulus of GBOs.
Spheroids and GBOs have significantly different noncellular microstructures
SEM characterization revealed round, cell-like structures on the outer surfaces of the spheroids, becoming less pronounced as they became GBOs, suggesting either tighter cell-to-cell interactions or a nascent ECM (Fig. 5). Individual cells were identified by their size (10–20 μm diameter; indicated by green arrows in Fig. 5A–B. Interestingly, the inside of sliced 2 mm GBOs contained a loosely packed region near the core (Fig. 5C). A distinct ring-region around the center of the GBO was observed where individual cell identification was hindered. Thus, outer and inner noncellular microstructures exhibited spatial heterogeneity with morphological changes in spheroids versus GBOs.

Microstructure analysis of GBOs via scanning electron microscopy. The outer surface microstructures of
Discussion
In this study, we sought to generate GBOs with their own ECMs, solely from CSCs, to study the global changing landscape of the GBM TME during its development. It is widely understood that ECM is secreted from cells at the earliest stage of human and tumor development, and tumor cells likely secrete more ECM than healthy cells.9–11,28,30,42,43 However, it is widely assumed that organoids require exogenous ECM for cells to develop organized structures. The popularly used exogenous ECMs, such as Matrigel™ or gelatin methacrylate, do not accurately reflect what is observed in human GBM or brains.20,21,24,44,45 Moreover, the use of exogenous ECM limits our understanding of the natural secretion and organization of ECM in early-stage tumor development. Thus, we have generated GBOs from single cells without the addition exogenous ECM to allow the formation of its own native matrix components.
Previously, we discovered that GBOs derived from single cells inoculated in a bioreactor successfully modeled the transdifferentiation and spatial heterogeneity of cells, but the resulting organoids were too small to model the heterogeneity of ECM. 32 This previous work elucidated hypoxia likely drove GSC differentiation when the spheroid diameters were larger than 400 µm. Thus, we introduced a spheroid preformation step prior to bioreactor inoculation to allow the growth of sizable organoids that exhibit ECM heterogeneity. Here, we illustrated that exogenous ECM encapsulation was not necessary to generate GBOs ≥ 4 mm diameter (Fig. 1B–D). While U251 reached a diameter ≥ 4 mm faster (4–5 weeks) than JX6 (6–7 weeks), it did so at the cost of reproducibility of size and circularity (Fig. 1C–D); hence, we focused on characterizing PDX-derived JX6 GBOs in subsequent analyses. The GBOs highlighted here are of potentially significant importance as they are within the undetectable size limits of clinical magnetic resonance imaging (MRI) spatial resolution and can provide valuable insights on GBM tumor formation in the early, undetectable, stages.46,47
Although we were able to produce GBOs ≥ 4 mm, our analyses suggest that GBOs already started displaying tissue-like features at 1–2 mm in size. Tissues are defined as an accumulation of varying cell types and ECM with similar structures to perform functions. Thus, bulk RNA-seq analysis on JX6 GBOs was used to study the overall gene expression trends of ECM as the GBO developed from a homogenous cell population to a more advanced tumor tissue with heterogenous cell population. The results indicated that GBOs underwent developmental changes concurrent with the change in size, with the greatest developmental changes in the GBOs occurring when they were between 1 mm and 2 mm in diameter. Notably, EGO analyses highlighted over 275 genes related to ECM that were significantly upregulated when comparing spheroids with 2 mm GBOs (Fig. 2D–F). ECMs of interest (i.e., elastin, fibronectin, laminin, and HA) showed a general trend of increased expression when GBOs reached 2 mm. HA is the most abundant ECM in the human brain and it aids in cellular migration and invasion; higher expression of HA is found around the edges of tumors where cells are actively migrating and infiltrating surrounding brain tissue.6,42,48 The increased secretion of HA leads to a poor prognosis for GBM patients as a consequence. 48 Visualization of GAGs via alcian blue (Fig. 3C) showed darker stains toward the edges. Utilizing CD44 as a surrogate, HA was found to be localized around the edges of the GBOs where the infiltrating rim would presumably be (Fig. 3E). Our results correlate with reported GBM tissue stains where HA is most expressed around the perimeter of both GBOs and spheroids. 48
Clinical RNA-seq analyses found patients with a high ECM signature at recurrence had a lower survival rate, but these studies only tracked collagen type I genes (COL1A1 and COL1A2). 49 Of the ECM genes we identified in this study, 22 collagen genes were identified (Fig. 2F, Supplementary Fig. S2). We highlighted the expression patterns of collagen type I, the most abundant collagen subtype throughout the human body, type IV, the most abundant collagen subtype in the human brain, and type VI, the most differentially expressed gene in our JX6 GBOs. 50 While collagen types I and IV showed varying trends, type VI showed the most significant upregulation, specifically at ≥ 2 mm (Fig. 2F). Previous studies primarily focused on collagen IV in the brain, likely because it is the main component of many basement membranes that specifically support vascular structures. 51 Based on the transcriptomic data, we expected to visualize some vasculature in relation to collagen IV expression within the JX6 GBOs. While the GBOs showed differences in spatial expression compared with spheroids, the global expression in GBOs suggest that collagen IV may not be the ECM of choice to visualize early development of vasculature. Collagen VI has only recently been recognized to play a role in brain development with emerging evidence for it as a hallmark of aggressiveness in GBM tumors as it is most highly expressed in compact, higher density regions.49,50 The expression of collagen VI changed from being located near the center of the spheroids to being more globally expressed throughout the GBOs. Interestingly, it also had higher expression toward the periphery of the GBOs, where the cells are more compact and presumably where the more aggressive, infiltrating cells would be located. Furthermore, collagen VI was reported to be highly expressed near compacted mesenchymal cell types, as opposed to collagen IV that was highly expressed around differentiated mesenchymal cells turned endothelial cells.50–52 Analysis of transdifferentiation into mesenchymal and endothelial cells in relation to collagens type IV and VI is not within the scope of this work, but it should be considered in future studies of these GBOs. Moreover, future studies on GBM ECM and GBO development should consider the role of collagen VI and HA, especially in relation to GBM invasiveness.
Spheroids had a stiffness of approximately 300 Pa while 2 mm GBOs had a stiffness of approximately 600 Pa, which are both comparable with the reported stiffness of diffuse LGG (Fig. 4). 41 The combined results from RNA-seq (Fig. 2), ECM quantification (Fig. 3A), histology (Fig. 3B–D), and IHC stains (Fig. 3E–F) suggest that the overall increased expression of insoluble full length elastin, total collagen (especially type VI), and sGAGs (most likely HA) all contributed to this stiffening in the GBOs. Interestingly, collagen VI is known to stabilize cell membranes, 53 which could have also contributed to the overall increased stiffness. However, the stiffening of GBOs also appears to be counteracted by the presence of the necrotic core-like feature in the center of the organoids (Fig. 5). These results further highlight the recapitulation of pathophysiological features found in GBM tissues in these GBOs and provide insights into how ECM might contribute to the observed tissue stiffening in tumors.
Conclusions
In summary, GBOs were grown solely from cancer cells to understand global trends of ECM expression during GBM development. We found that GBOs developed into a more advanced tumor-like model with respect to size and stiffness. They showed a significant upregulation of ECM signatures, starting at a diameter of 2 mm, and recapitulated the pathophysiological features of GBM. The development of tumor cell-derived matrices is a key theoretical milestone in the development of tumors. Later stage tumors secrete signals to solicit supporting structures, such as vasculature, from the otherwise healthy tissues. In our results, collagen VI surprisingly emerged as a key ECM for GBM development and could serve as a target for future targeted therapy. Currently our GBOs do not model the full developmental span of GBM, especially the later stages. However, the clinical data are sparse for the early stages when individual cancer cells establish a micro-organ with its own brain-relevant ECM. Conceptually, our results align with the expected initial phase in GBM development at sizes that are not detectable by current MRI, and this further highlights the significance of the organoid model developed herein.
Footnotes
Acknowledgments
The authors thank Dr. Yancey Gillespie (University of Alabama at Birmingham) for providing the JX6 PDX GBM cell line and Dr. Kim Lackey (The University of Alabama) for assistance with the confocal microscopy. RNA-seq data were generated at Discovery Life Sciences (HudsonAlpha, Huntsville, Alabama), and the SEM images were acquired at the Core Analytical Facility (Alabama Materials Institute, The University of Alabama). S.D.G.
Authors’ Contributions
Conceptualization: A.D.A., D.J.G., and Y.K. Formal analysis: A.D.A., D.J.G., M.L.B., T.N.S., I.M.C., and Y.K. Funding acquisition: Y.K. Investigation: A.D.A., M.L.B., T.N.S., and I.M.C. Methodology: A.D.A., M.L.B., T.N.S., I.M.C., and Y.K. Project administration: A.D.A., D.J.G., and Y.K. Resources: Y.K. Software: A.D.A. Supervision: A.D.A., D.J.G., and Y.K. Validation: A.D.A., D.J.G., and Y.K. Visualization: A.D.A., M.L.B., T.N.S., I.M.C., and Y.K. Writing—original draft: A.D.A., D.J.G., M.L.B., T.N.S., I.M.C., and Y.K. Writing—review and editing: A.D.A., D.J.G., and Y.K.
Data Availability Statement
The data supporting the findings of this study are available from the corresponding author (Y.K.) on request.
Disclosure Statement
The authors declare no conflict of interest.
Funding Information
This work was supported by the National Science Foundation (CBET/EBMS #2000053 to Y.K.). A.D.A. was supported by the U.S. Department of Education as a GAANN Fellow (P200A210069; PI: Y.K.). Any opinions, findings, and conclusions or recommendations expressed in this material are those of the authors and do not necessarily reflect the views of the National Science Foundation or the Department of Education.
