




Abstract
Large-scale and cost-effective cell expansion processes are a prerequisite for the clinical and commercial translation of cell-based therapies. A large variety of cell expansion processes are described in literature, utilizing different cell types, culture vessels, and medium formulations. Consequently there are no straightforward means for the comparison or benchmarking of these processes in terms of efficiency, scale, or costs. The purpose of this study was to systematically review the available mesenchymal stromal cell (MSC) expansion literature and develop an interactive visualization tool for comparing the expansion processes. By using this computational tool, process data could be concentrated, standardized, and analyzed to facilitate a more general understanding of the parameters that define a cell culture process, and in the future allow rational selection or design of these bioprocesses. Additionally, a set of bioprocess metrics were defined that assured the comparability between different processes. Currently, the literature-based data repository holds 73 individual cell expansion processes on seven different types of human MSCs in five different types of culture vessels. The visualization tool allowed benchmarking of these processes against each other, serving as a reference point for cell expansion process efficiency.
Introduction
T
The translation of clinically promising cell therapies to commercially successful products will require the conversion from manual cell culture processes to controlled bioprocesses that are able to guarantee the production of cell-based therapies with manageable cost of goods (COGs) and robust in vivo performance.7–10 Bioreactors have been shown to provide an improved cell culture environment by controlling nutrient refreshment and waste removal rates 11 while reducing complexity involved in bioprocessing. 12 From the translational perspective, bioreactors have been employed to provide efficiency in terms of cost, yield, and scale. A growing body of literature examines the use of bioreactor systems with various designs for the expansion of human MSCs and reflects on the concerns regarding large-scale MSC production, indicated by an increasing number of recent review articles.13–15
Existing literature and regulatory perspectives
16
discuss a very broad number of parameters that all affect bioprocess variability and efficiency at the same time. Their effects should therefore be taken into account when analyzing and designing bioprocesses for the expansion of MSCs. These parameters can be classified as follows:
(i) Cell type and donor: There is a large variation of sources of adult progenitor cells, with the most common being bone marrow (BM),
17
umbilical cord (UC),
18
adipose,
19
synovium,
20
and periosteum.
21
In addition, interdonor variability within the same cell type is also a factor that will affect translation to large scale.
22
Even from the very beginning of the process, the number of MSCs obtained from a biopsy is variable. For example, 1 mL of human BM provides ∼1000 MSCs.
23
Whereas for adipose-derived MSCs for 0.5–2.0 × 10⁶ cells/g of adipose tissue, the percentages of MSCs range from 1% to 10%.
24
Again here, there is a large interdonor variability regarding cell yields from biopsies that affects translation, especially for autologous cell therapies. (ii) Type of culture vessel: Not only in the (multilayered) flask-based expansion, where the brand of culture plastic itself might already induce variability in cell yields,
25
but also the large diversity of culture systems that has been reported to support MSC expansion contributes to the variety in bioprocess efficiency and variability. For instance microcarrier-based stirred tank reactors,
26
hollow fiber,
27
wave bags,
28
and multiplate bioreactors
29
have been successfully employed to generate large-scale batches of MSCs. (iii) Raw materials and reagents: There is a broad variety of media formulations for cell expansion that differ for example in protein source or glucose concentration. Since nondefined sources of protein such as fetal bovine serum (FBS) and human platelet lysate (HPL) introduce batch-dependent process variability and present a non-negligible risk for pathogen transmission, considerable effort goes to the development of defined xeno-free medium formulations that support more efficient and less variable cell growth.30,31 For a review on serum-free media formulations see Gottipamula et al.
32
(iv) Process parameters: The operating conditions, for instance initial cell seeding density, media refreshment strategy, vessel geometry, type of impeller, mixing intensity and stress exposure, perfusion rates and dissolved oxygen tension, vary for almost every process.
33
The impact of the microenvironment in light of the large-scale MSC expansion is reviewed in Ma et al.
34
To add to this complex landscape, inconsistent metrics have been used to define bioprocess efficiency making comparison across research studies a rather challenging task. Therefore, there is need for a critical and systematic analysis of existing information to allow comparability, process benchmarking, and improved understanding of bioprocess efficiency, to ultimately allow a more rational design of these bioprocesses.
The first aim of this work was to analyze the performance of different expansion processes for MSCs. An exhaustive literature study was performed, currently resulting in a database of 73 individual cell expansion processes in five different types of culture vessels (tissue culture flasks, hollow fiber bioreactors, microcarrier-based bioreactors, multiplate bioreactor, and fixed bed bioreactors), seven different types of MSCs, and a wide range of media compositions. The scale of the processes in terms of final cell numbers ranged between 7.5 × 10⁶ and 1.1 × 10¹⁰ cells. Interactive visual process performance maps were created where the scale, expansion efficiency, cell type, culture method, load on downstream processing, medium formulation, and population doubling (PD) time could be explored. Finally, based on scale-up studies carried out in our research group, we provide a cross-system cost comparison using a specific adult progenitor cell type namely, human periosteum-derived cells (hPDCs, an MSC-like cell type that holds promise for skeletal regeneration and repair strategies) reaching yields of 3.5 × 10⁸ cells per run.
Methods
Database construction
A database of individual cell expansion processes was assembled based on a literature search for articles that have a detailed description of one or multiple cell culture processes. This database therefore not necessarily represents the current situation in industry. If multiple processes were described in one article, for example comparing different microcarrier densities or protein sources, all described processes were included. The first criterion for a process to be included was that the article described processes for human mesenchymal stem/stromal cells (MSCs), as claimed by the authors. The second criterion was that the scale-up of the process was taken into consideration during data collection, with the aim of only including fairly optimized processes. However, scale-up was not necessarily the main goal of the article. Third, precise information on critical process parameters, that is, cell type, starting cell number at seeding, culture time, final cell yield, culture surface or microcarrier concentration, medium composition, and exact type of culture vessel had to be included in the article, either in text format, table, or clear graphs. Unfortunately certain MSC expansion articles that were found failed to mention some of these critical parameters and were therefore not included.
Finally, a cell quality read-out was required, either in terms of the International Society for Cellular Therapy (ISCT) criteria or a potency assay, 35 as long as it evaluated the influence of the process on relevant quality attributes of the specific cells. Although extremely important, (parts of the) processes that described passage 0 (P0) results were excluded, as the precise number of MSCs initially present within the biopsy is unknown. Most processes were situated between passage 1 and passage 6 (on the use of passage number as a metric, see below). Additional parameters that were collected in the database for their potential effect on the therapeutic effectiveness of the cells or indirect relation to the efficiency or cost of production, but that are therefore not explicitly used further in this work, are: brand of culture vessel, specific culture surface and coating, working volumes and refreshment rates, oxygen concentrations, maintenance of cell function or potency (yes/no), and bead-to-bead transfers in microcarrier culture (yes/no).
Metrics for process comparison
To allow a fair comparison between all the different processes in different culture vessels, specific metrics were calculated from the collected data of which the authors believe that they can provide objective comparison over multiple systems and cell types. For example, passage number is still often used to define the extent of cell growth. However, in contrast to the number of PDs, this metric does not describe the proliferative precedent of the cultured cells. Similarly, in two-dimensional (2D) culture, the seeding and harvesting densities are generally stated as cells per cm2 of available culture surface. As the exact culture surface is generally less easy to quantify for different microcarrier types, this metric cannot be used for comparing all different culture vessels. One metric that was therefore used often in this work is Expansion Factor or Expansion fold (EF) as this allowed us to estimate how efficient the generation of cells during a certain process step was, irrespective of the available culture surface or the vessel volume.
As the downstream process efficiency (e.g., taking into account the amount of cells lost during harvest or volume reduction processes, before the actual count of the cell yield) is generally not separately quantified in literature, the enumerator was simplified to the reported final cell yield. Estimates for seeding efficiency are more often mentioned for microcarrier processes, but are generally not available for flask-based or hollow fiber processes. Therefore, also the seeding efficiency was not taken into account for the EF calculation in this work. If an EF was provided in the article that took seeding efficiency into account, it was recalculated to not include the cells lost at seeding, therefore resulting in a simple “cells out” over “cells in” ratio.
When using the EF metric as a measure for expansion efficiency, starting from the total initial number of cells seeded is more accurate from a process efficiency point of view compared with using the number of cells that are effectively seeded. Taking into account the exponential growth of cells, losing even small amounts during seeding quickly becomes expensive as these lost cells do not contribute to the final yield.
Reversely, to calculate the effective PDs and population doubling times (PDT), it is necessary to quantify and take into account the seeding efficiency as otherwise the apparent PDT seems longer than the effective PDT. Note that, in this study, the apparent PDT was calculated based on the initial and final cell number (as seeding efficiency and downstream process efficiency is generally not quantified in all articles) and, therefore, also includes lag phase and possible stationary phase at the end of the culture time:
The final volumetric cell density was calculated as the total number of cells harvested divided by the total medium volume (working volume) in the culture vessel. This metric was taken as a proxy for the load on downstream processes as it was considered that in relative terms larger cell numbers in smaller volumes are less cumbersome during volume reduction and possible purification steps.
For the classification in low and high supplemented protein concentrations an arbitrary cutoff point at 5% was chosen. A medium composition with more than 5% FBS or HPL was considered to be high FBS and high HPL, respectively. Medium compositions with concentrations equal or lower than 5% FBS or HPL were considered to be low FBS and low HPL, respectively.
Cost calculations
Cost calculations were based on the cell expansion processes required for large preclinical studies performed in the host laboratory (Prometheus, KUL) for the treatment of large bone defects with hPDCs. The calculated cost included labor costs for the operators at KU Leuven, disposable costs at list price, and reagent cost at list price for the expansion of 20 million hPDCs to 350 million hPDCs. Other costs such as laboratory space, depreciation costs, and utilities were not included. All processes were performed in Dulbecco's Modified Eagle Medium (DMEM) high glucose supplemented with 10% irradiated FBS. The hollow fibers of the Terumo BCT bioreactor were coated with human fibronectin, whereas no fibronectin was used in the other culture vessels.
Visualizations
The visualization tool was created with JavaScript and Google Charts and the visuals are generated automatically from the database that is hosted online. In this way the tool can be easily updated with new processes when new publications become available. The process performance maps shown in this article are static representations of the interactive visualization tool. In the online version, the viewer is able to select processes per vessel type or per cell type. The authors would like to encourage the reader to open the following link (mtm.kuleuven.be/prometheus/processmap) in their browser to experience the interactive dataset visualization.
Results and Discussion
Based on data acquired through a literature search and subsequent data extraction, 73 individual bioprocesses were included in the visualization tool (Table 1). The database included seven different MSC types (Fig. 1A), five different types of culture vessel (Fig. 1B), and many different medium compositions that are roughly categorized based on protein source in Figure 1C, but described in more detail in Table 1. Although this data is based on research articles, the distribution of cell types used is comparable to the cell types used in recent clinical trials (e.g., 62% BM MSC and 15.4% adipose-derived stem cell [ADSC] as collected in, 1 and 56% BM MSC and 12% ADSC as collected in Sharma et al. 36 ).

Overview of
MSC, mesenchymal stem/stromal cell; BM, bone marrow; ADSC, adipose-derived stem/stromal cell; hPDC, human periosteum-derived cell, UC, umbilical cord; FBS, fetal bovine serum; HPL, human platelet lysate; FGF, fibroblast growth factor; DMEM, Dulbecco's Modified Eagle Medium; EMEM, Eagle's Minimum Essential Medium; α-MEM, Eagle's Minimum Essential Medium-Alpha Modification; IMDM, Iscove's Modified Dulbecco's Medium.
Visualizing process performance
To present a complete overview of all the processes, an interactive tool was created, where process performance maps can be plotted allowing a visual analysis of MSC culture expansion across studies. The interactive version of the visualization tool can be accessed online at the following link (mtm.kuleuven.be/prometheus/processmap). For all process performance maps presented in this work, the Y-axis represents the EF for a single passage as an approximation of the expansion efficiency. The scale of each process is reflected by the X-axis that is indicating the final cell yield of the passage. Figures 2–4 provide additional information regarding cell density (cells/mL) at harvest represented by the size of the circles, while different colors are indicative of the specific MSC type.

Capture of an interactive process performance map on 73 different cell expansion processes. The y-scale indicates the expansion factor, the x-scale indicates the total cell yield, the color of the dots indicates the specific MSC type. The size of the circle indicates final cell density (cells/mL) before the cell harvest step. Color images available online at www.liebertpub.com/teb
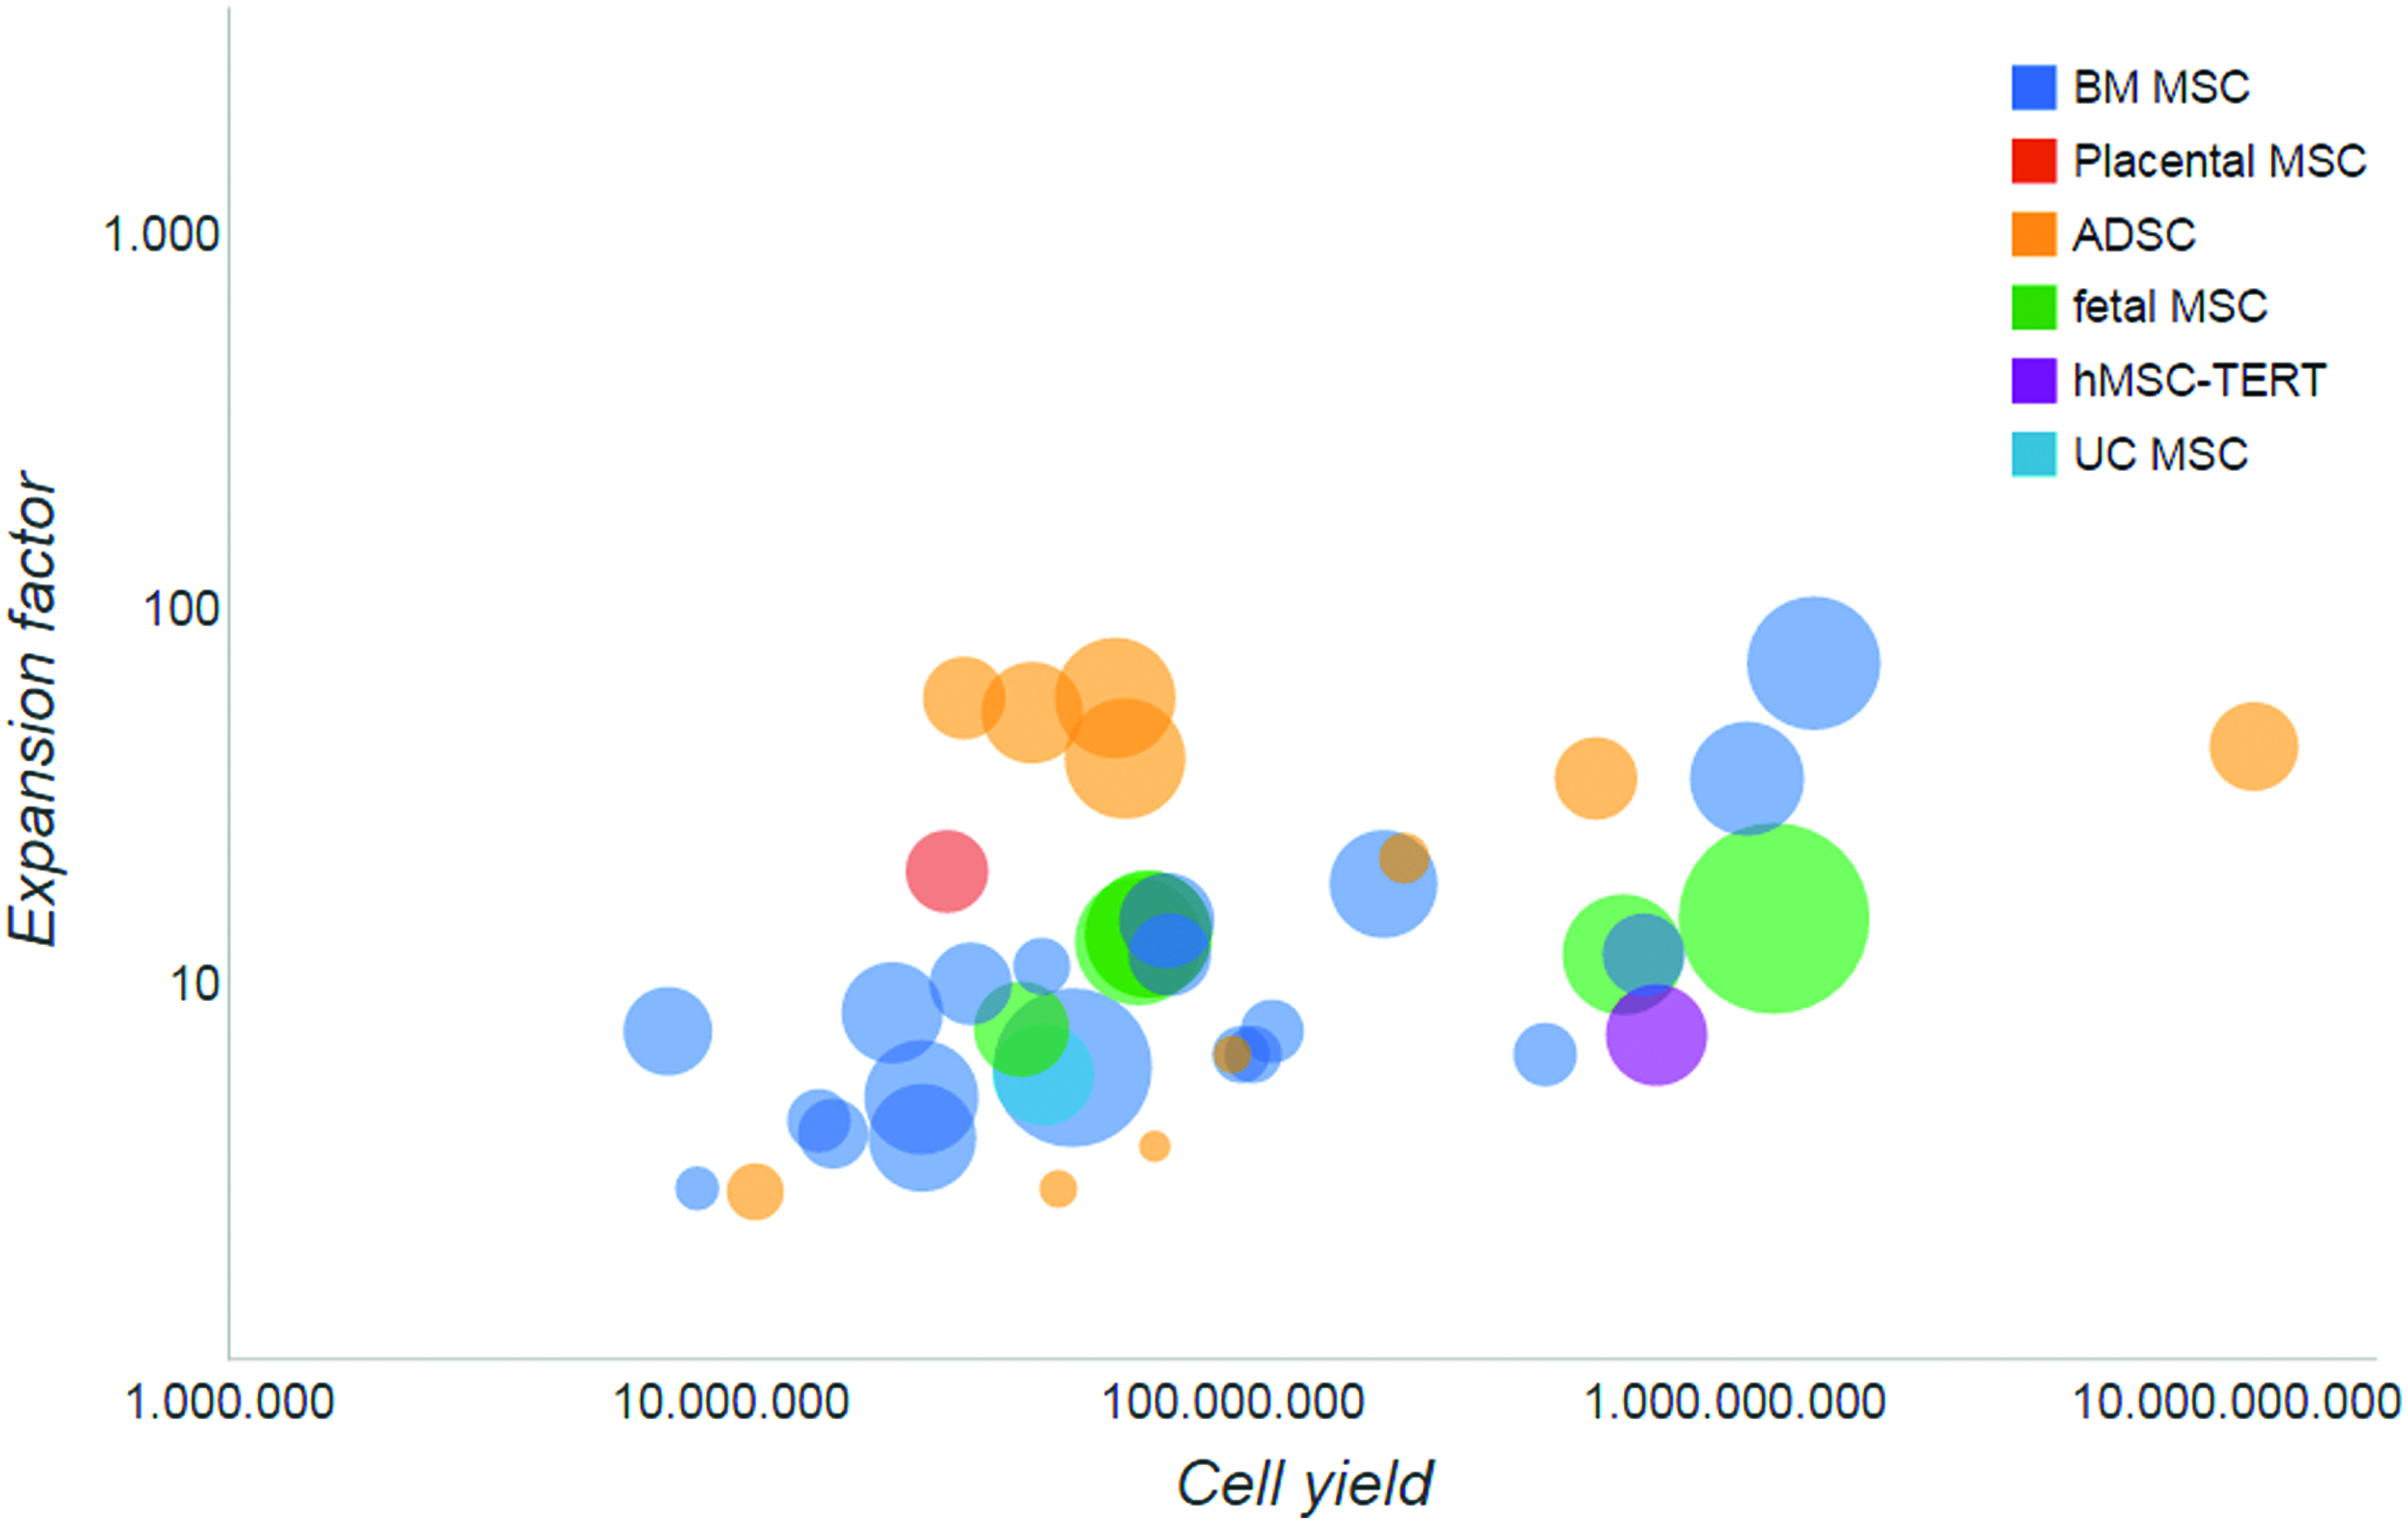
Selection of the microcarrier-based MSC expansion processes present in the database. The y-scale indicates the expansion factor, the x-scale indicates the total cell yield, the color of the dots indicates the specific MSC type. The size of the circle indicates final cell density (cells/mL) before the cell harvest step. Color images available online at www.liebertpub.com/teb
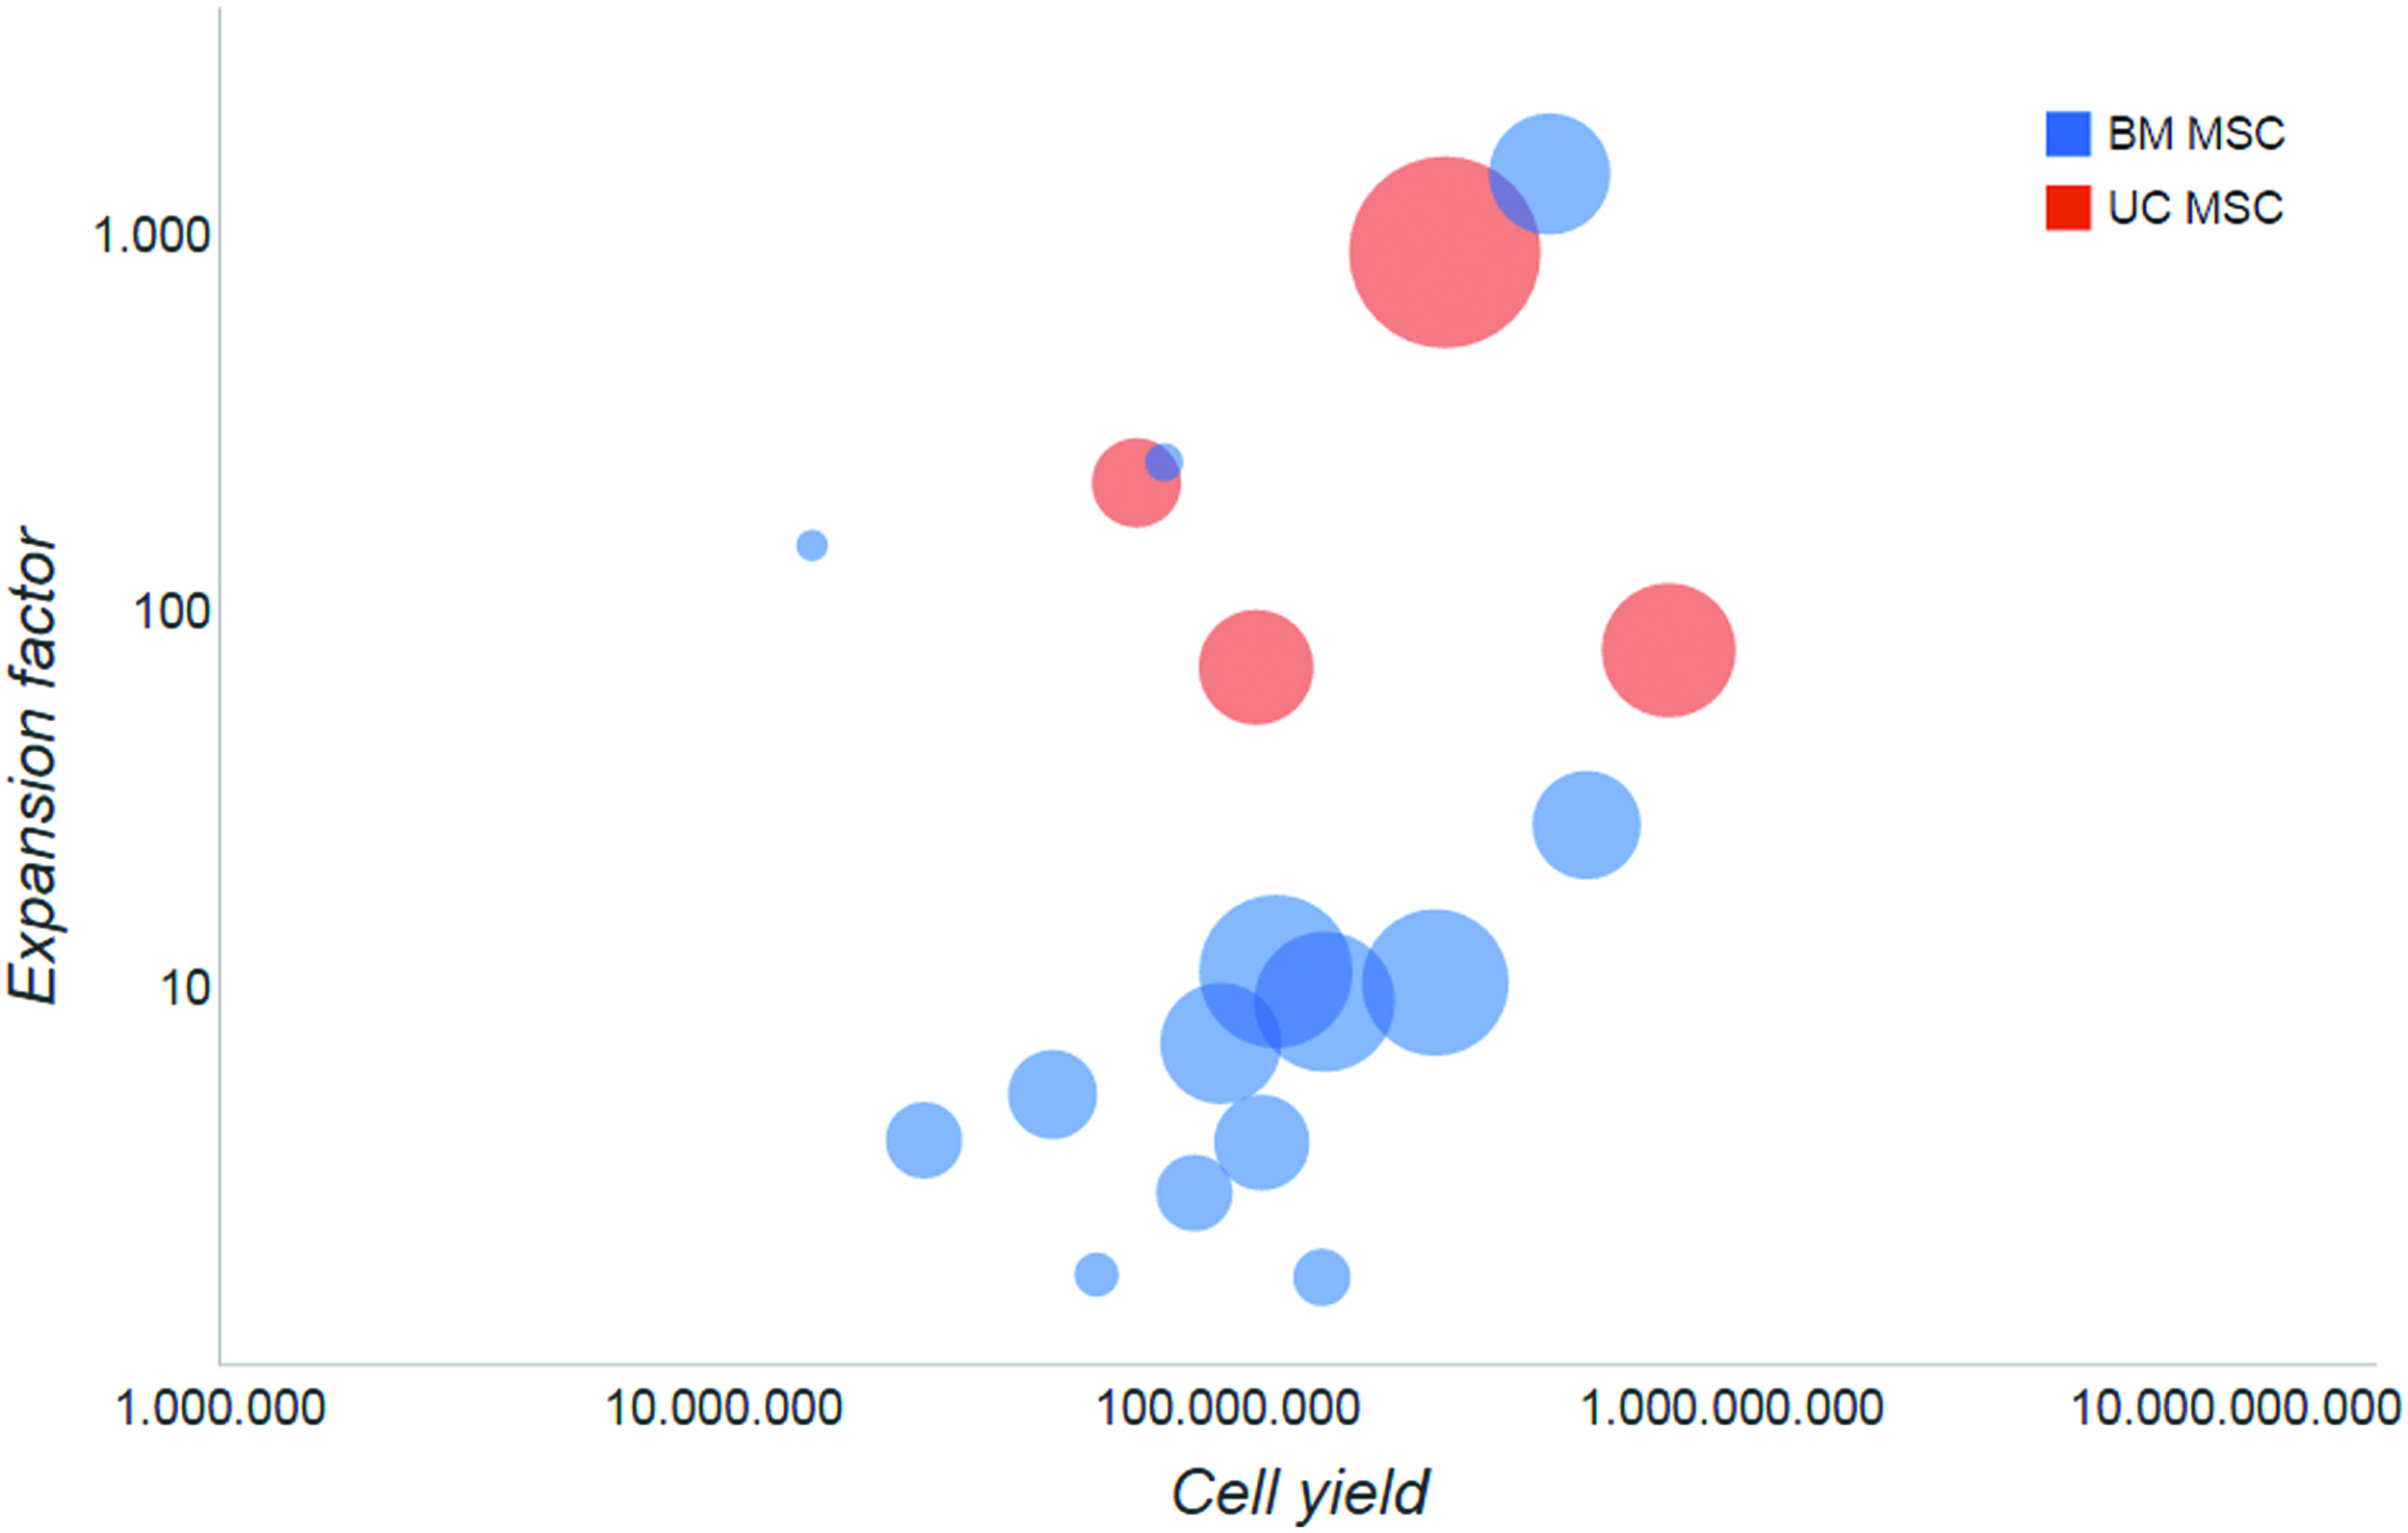
Selection of the multilayer flask-based MSC expansion processes present in the database. The y-scale indicates the expansion factor, the x-scale indicates the total cell yield, the color of the dots indicates the specific MSC type. The size of the circle indicates final cell density (cells/mL) before the cell harvest step. Color images available online at www.liebertpub.com/teb
An interesting observation is that there seems to be a barrier on the process scale around a batch size greater than 1 × 10⁹ cells that is not often exceeded in the scientific MSC expansion literature. This could indicate a technological barrier (i.e., size of bioreactor or load on downstream processes) or a current lack of market demand. For certain cell types and medium combinations, this might also imply a biological barrier as certain MSC types undergo senescence after an extensive amount of PDs. 37
With the interactive visualization tool, it is possible to categorize the process performance maps, for example based on the type of culture vessel. In the case of microcarrier-based suspension culture (Fig. 3) a linear correlation on the log–log plot (therefore, actually a y = axb correlation) between the final cell yield and the expansion efficiency can be witnessed. This is surprising considering the wide range of process parameters that could affect the EF and final yield in a microcarrier-based process, for example, the type of microcarrier, microcarrier concentrations, and energy dissipation rate. Contrary, in the case of multilayered tissue flasks, where there are much less process parameters that need to be optimized, a more scattered picture is observed in Figure 4. The multilayer flask-based processes seem to show both some of the most efficient processes as well as some of the least efficient processes for a certain scale, however, average values are close to those observed in the microcarrier case. In recent work, 38 the relative performance of MSCs from different donors was reported to be the same for cell culture flasks and during experiments with the same cells on microcarriers.
In an alternative visualization of the process performance map (Fig. 5), it was chosen to use the same axis for scale and expansion efficiency (x and y, respectively), but while the first version focuses on the technical side of the process by providing information on the type of bioreactor and load on downstream processes, in this study, it was chosen to show more the biological side of the process. Therefore, in this case, the color of the circle represents the amount and source of protein supplemented to the medium (i.e., HPL, FBS, or serum-free medium) and the size of the circle represents the apparent PD time of the cells. The interactive format allows to sort the processes per cell type. It can be seen that the size of the circles was generally larger at the bottom of the map, indicating a longer PD time and, therefore, suggesting that the lower EF of these processes could be attributed to a slower growth rate of the cells. Interestingly, both high and low protein content medium supplements were able to support very efficient cell growth. HPL-supplemented media result in relatively small circles, indicating fast PD times, and were, therefore, generally located at an average or higher EF for a certain process scale. This indicates a more efficient cell growth in HPL-supplemented medium, which is often concluded from comparative studies between FBS- and HPL-containing media. 30 Notwithstanding the clear benefits of serum-free cultures, from a process efficiency point of view, certain serum-free processes reach an average EF for a certain scale, whereas most of them currently resulted in a less efficient expansion process and, therefore, seemingly required further developments to accommodate every cell type–culture vessel combination. 39
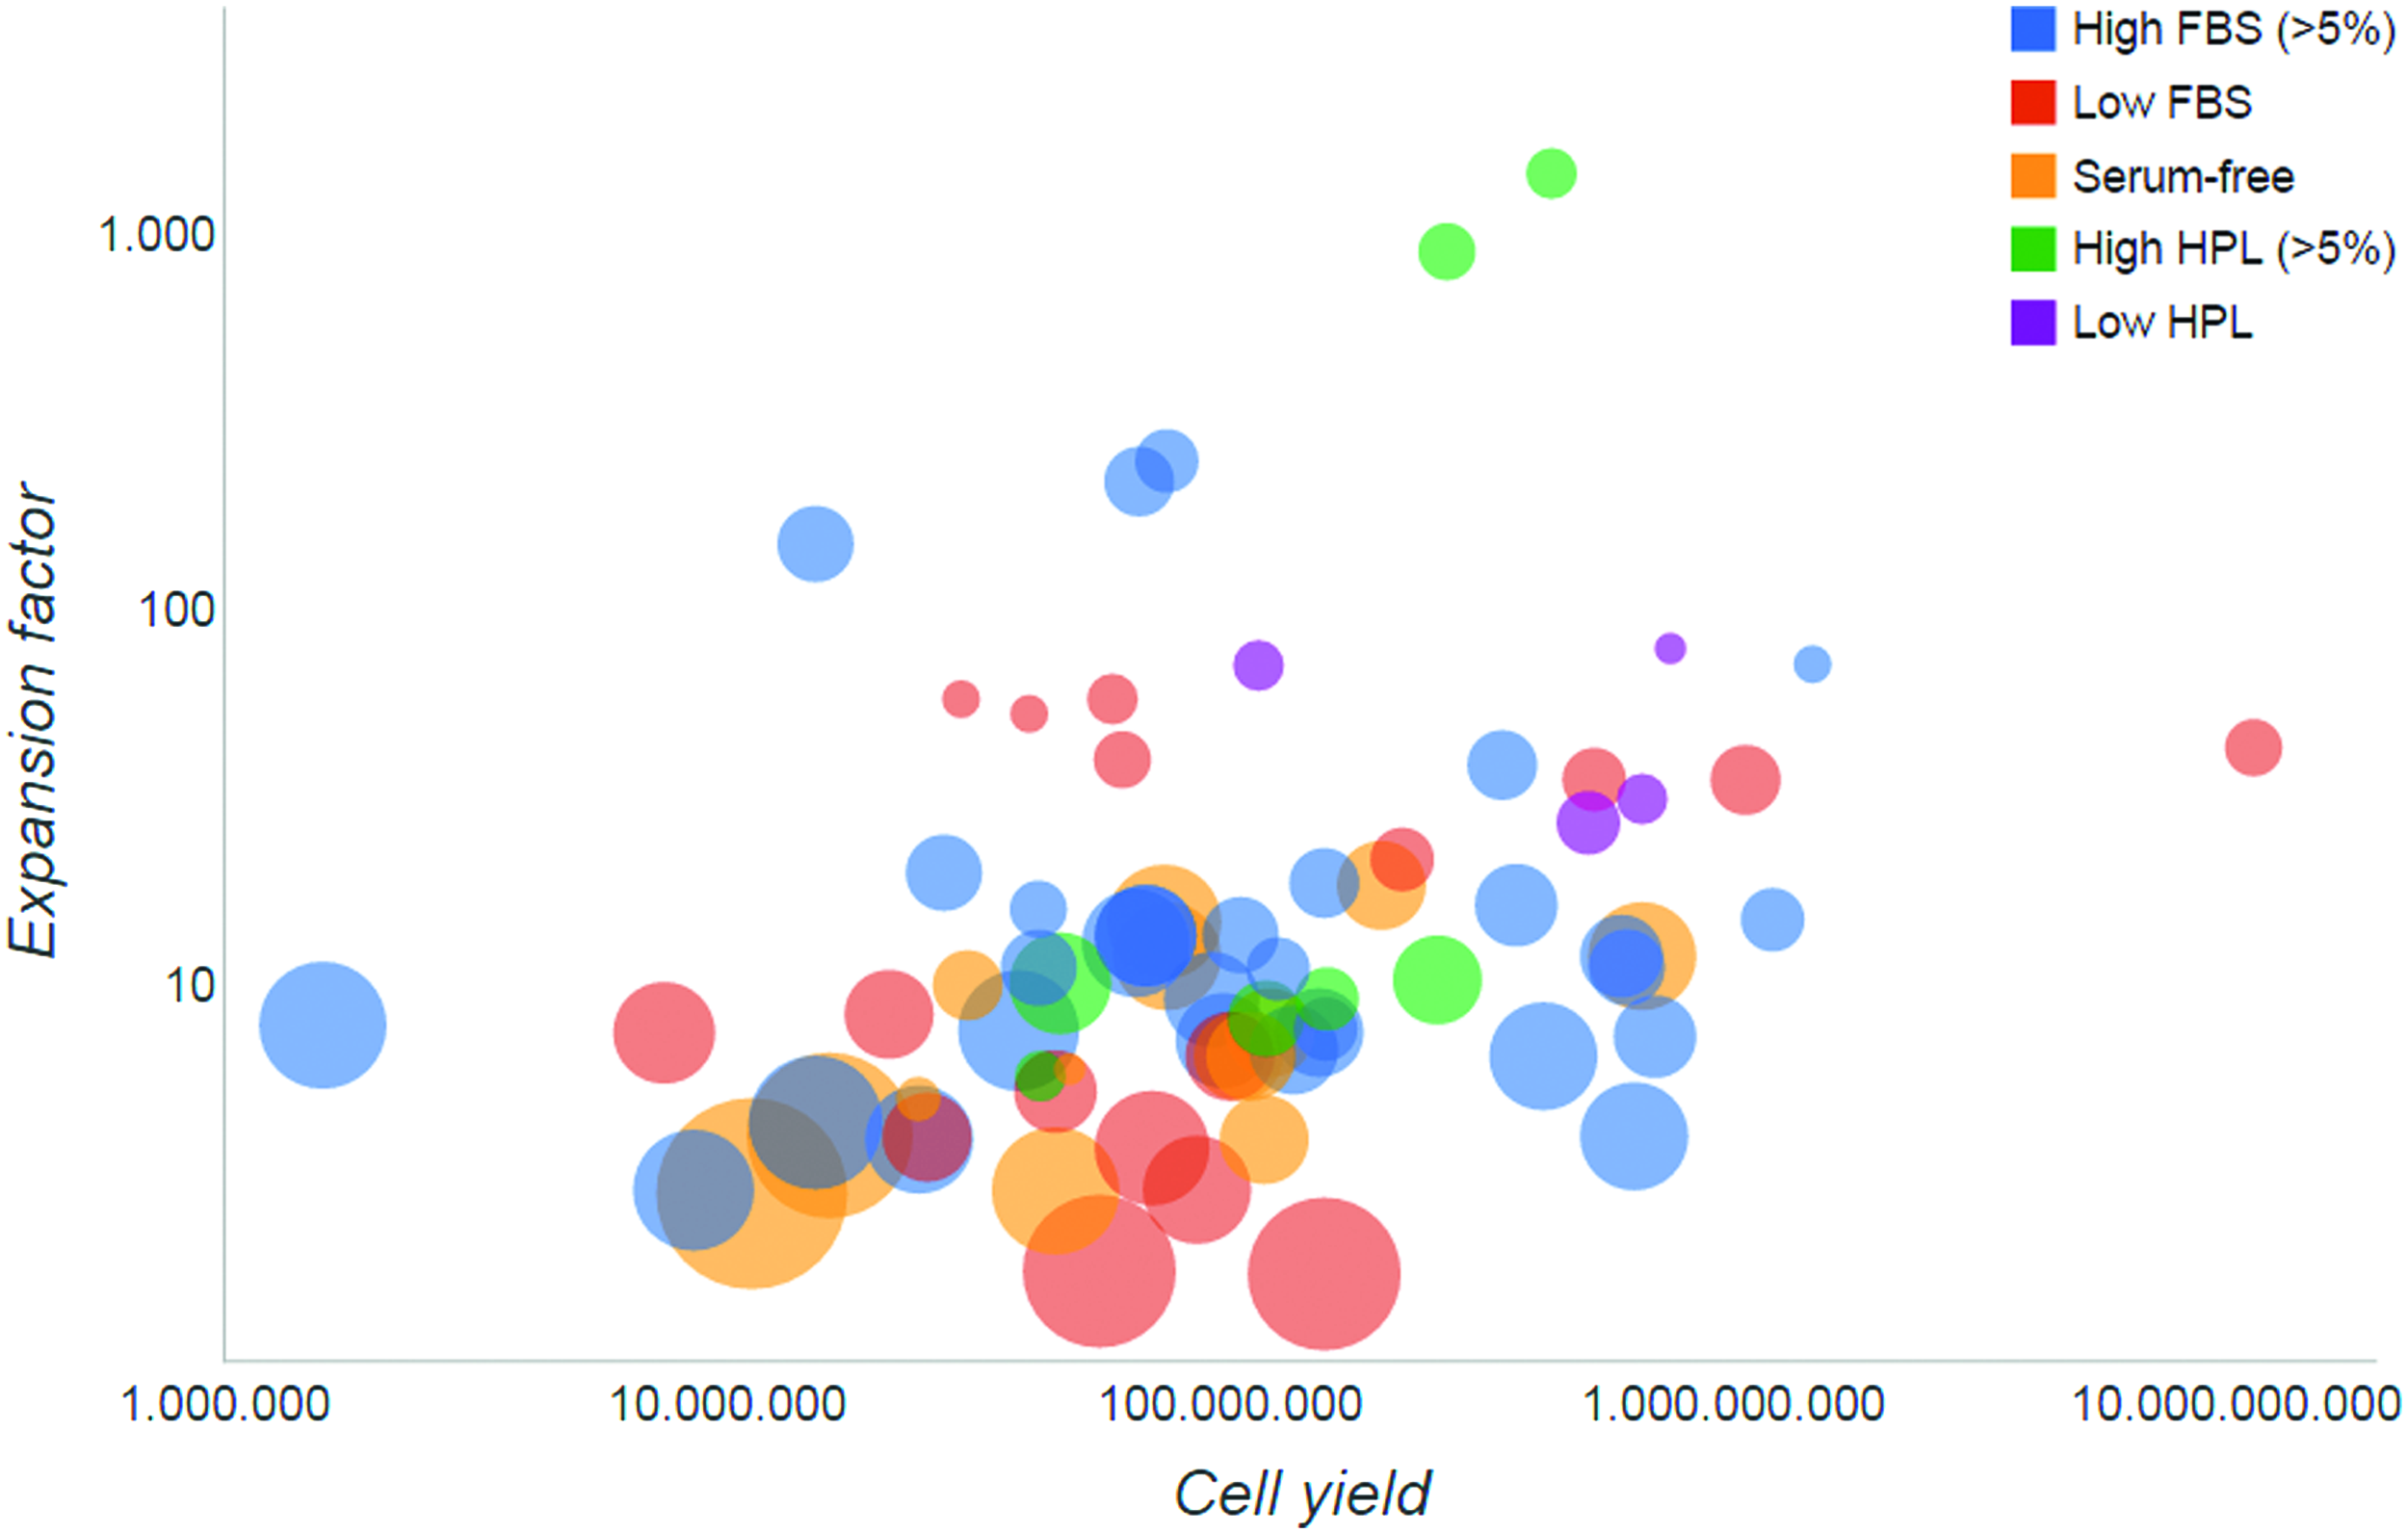
Capture of an interactive process performance map on 73 different cell expansion processes. The y-scale indicates the expansion factor, the x-scale indicates the total cell yield, the color of the dots indicates the source of protein supplements in the medium. The size of the circle indicates the population doubling time of the cells (larger bubbles indicate longer population doubling times). Color images available online at www.liebertpub.com/teb
Another interesting observation that could be made from Figures 2 and 5 together was that the five best-in-class processes that were able to show EFs above 100, all originate from the same research laboratory, where a notable lower cell seeding density was used in multilayered flasks (30–40 cells/cm2, compared with the average over the whole database of ±3900 cells/cm2) in combination with relatively high concentrations of supplemented protein (10% HPL or FBS), and this is for two different cell types (BM MSC and UC MSC). It is regularly stated in literature that lower seeding densities promote faster PDs, therefore, in turn allowing larger and more efficient EFs. 40
Considering cost-effectiveness during bioprocess design
COGs and cost breakdown structures are generally not mentioned in articles on stem cell expansion and could, therefore, not be included in the database. However, there exists a need for more cost-effective production methods that yield large numbers of high-quality cells at a commercially viable price in order for cell therapies to be affordable for healthcare systems and reimbursement. Therefore, a cost calculation from multiple standardized large-scale expansion processes as performed multiple times in the host laboratory for a forthcoming clinical trial was included to provide a COGs reference value for the different types of processes described in the database. The calculation specifically compared the expansion of 20 million hPDCs to 350 million cells in high-glucose DMEM supplemented with 10% irradiated FBS in T175 tissue culture flasks, a hollow fiber bioreactor (Terumo BCT Quantum® Cell Expansion System 41 ), a multiplate bioreactor (Pall Integrity Xpansion 29 ), and in a spinner flask with CultiSpher-S microcarriers (unpublished results). Figure 6 illustrates the total cost per million of cells cultured in these vessels for the specific preclinical expansion process in the Prometheus Lab. The reagent, disposable, and labor axis provide the cost breakdown of the total cost. The average EF axis represents the EF that was obtained per vessel for the hPDCs, and is included since this significantly influences process efficiency and cost. For the final axis, the number of built-in sensors was used as a measure for the monitoring capability of the vessel, since these features are increasing the COGs, but facilitate the clinical translation.
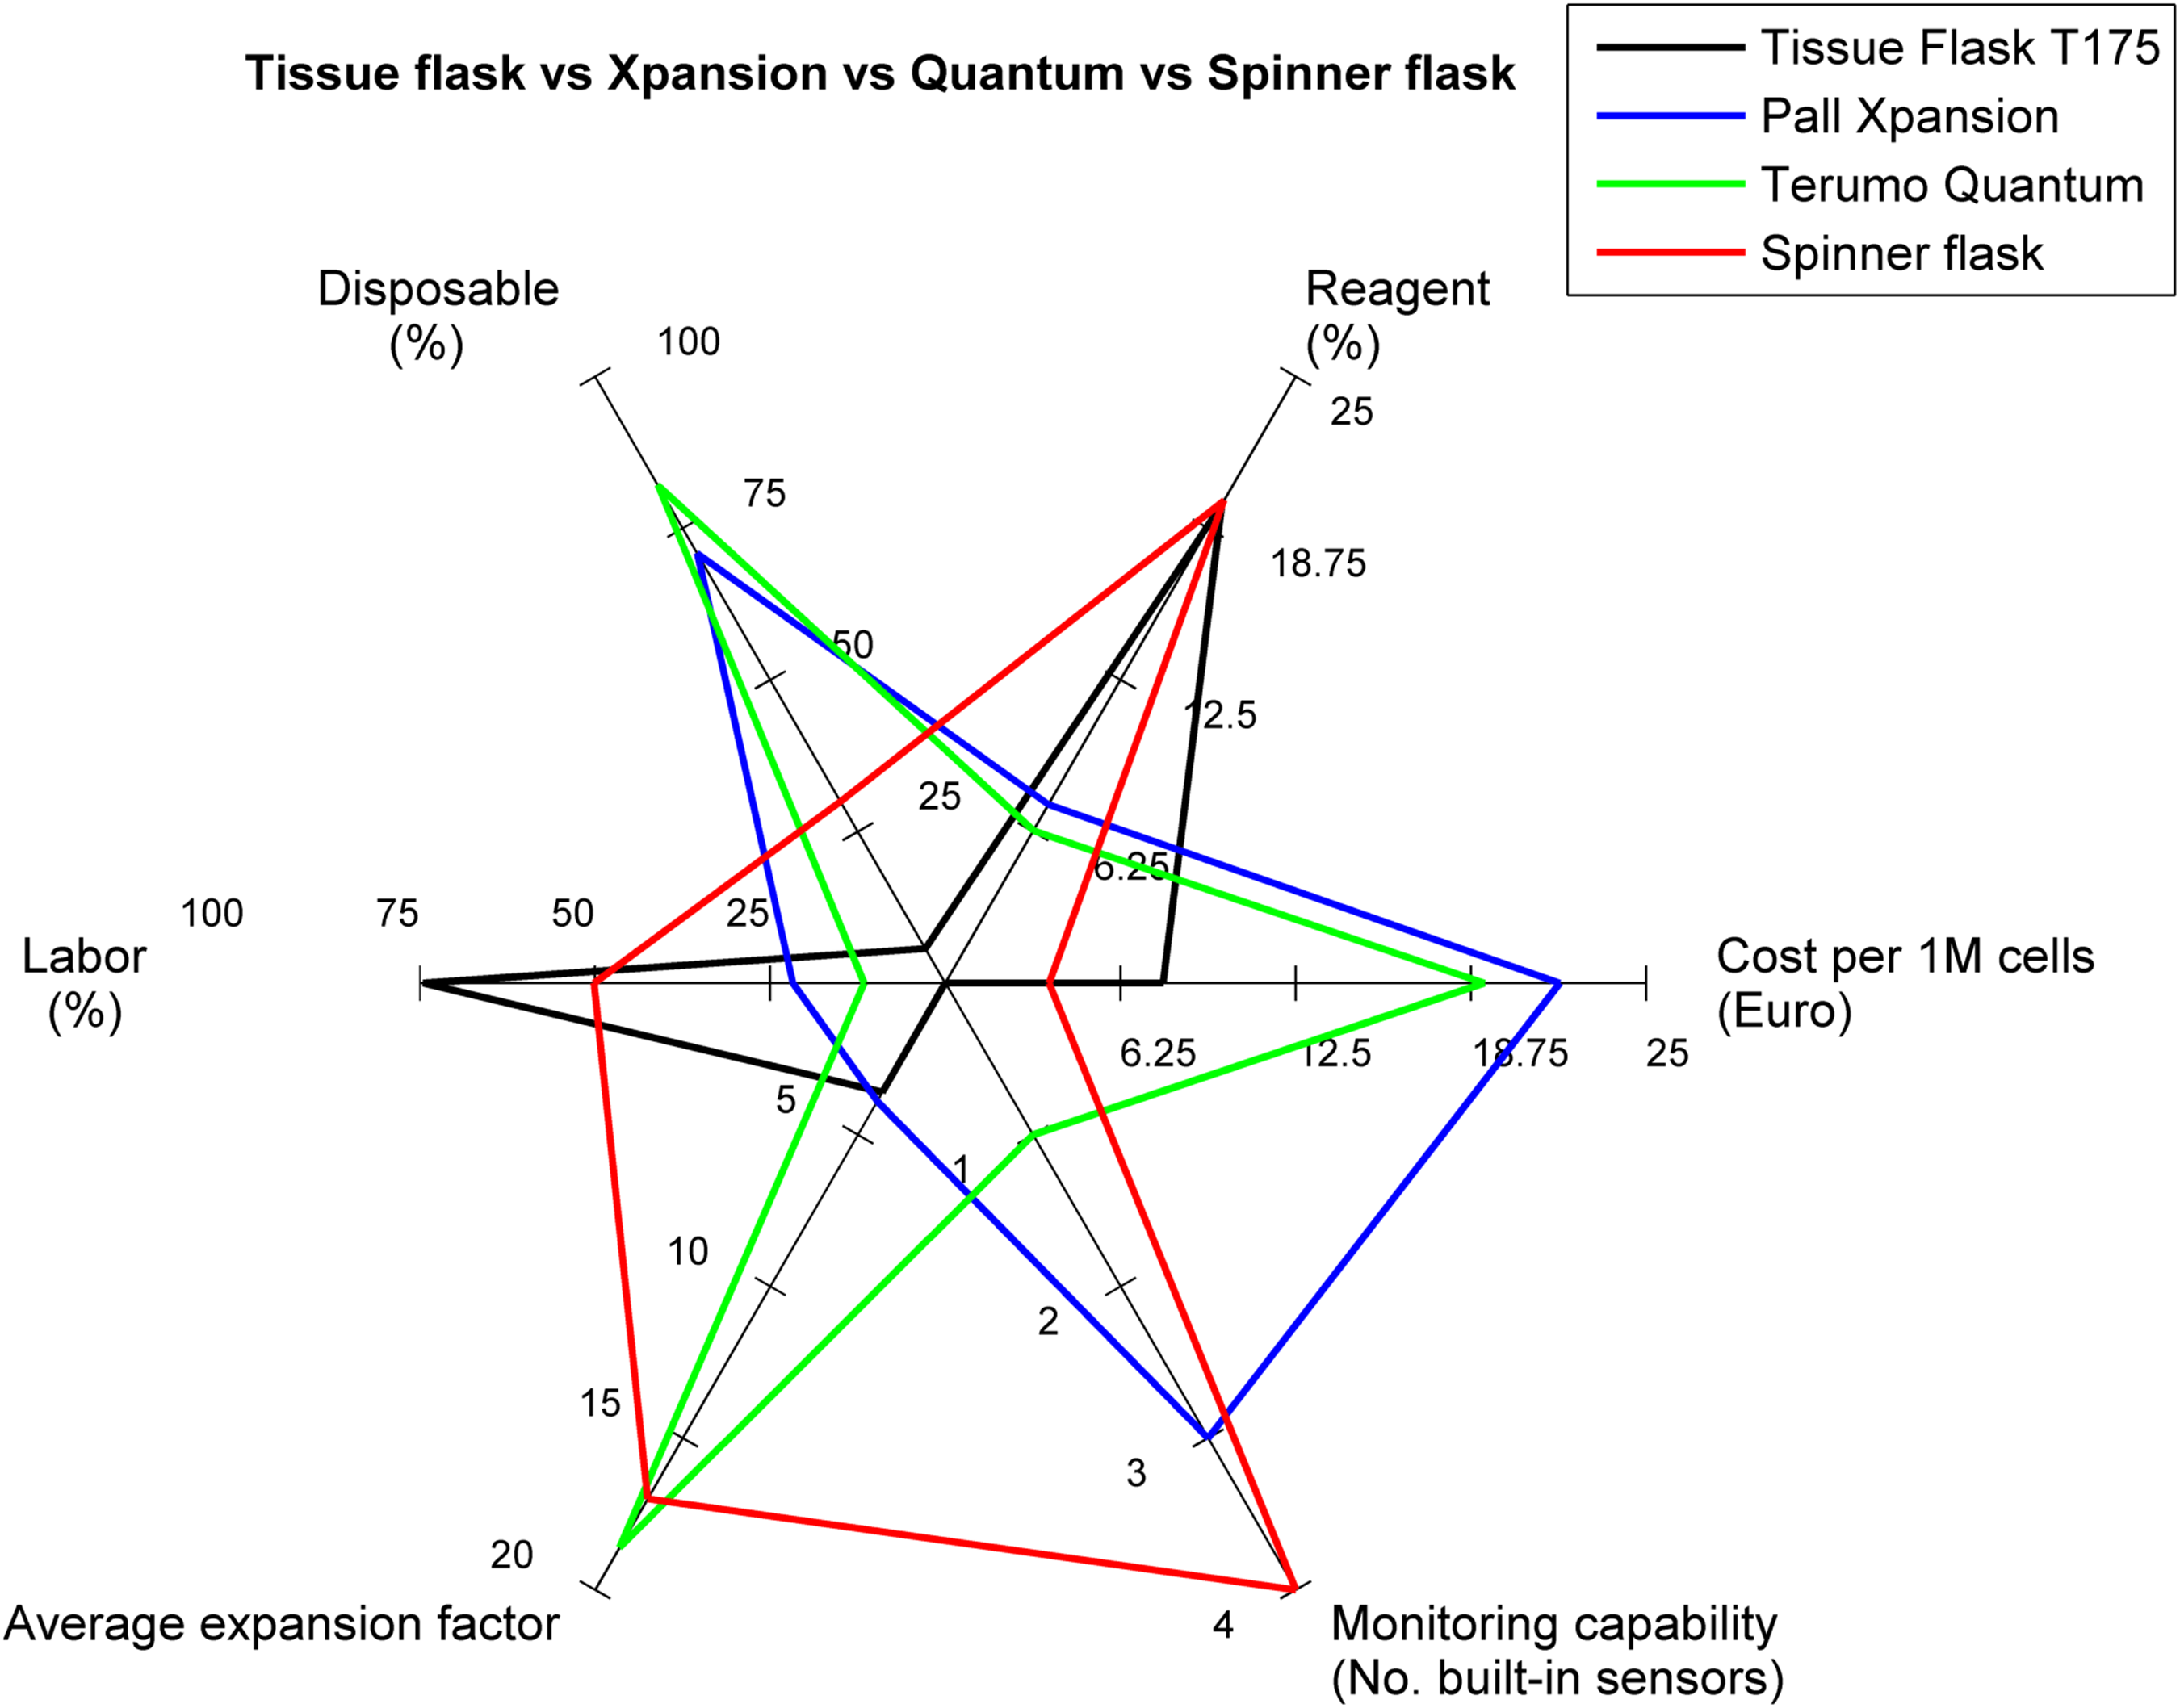
Cost breakdown structure of a standardized large-scale cell expansion process of 20 million hPDCs to 350 million cells in high-glucose Dulbecco's Modified Eagle Medium (DMEM) supplemented with 10% irradiated FBS in T175 tissue culture flasks, a hollow fiber bioreactor (Terumo BCT Quantum® Cell Expansion system 40 a multiplate bioreactor (Pall Integrity Xpansion 29 ), and in a spinner flask with CultiSpher-S microcarriers (unpublished data). Color images available online at www.liebertpub.com/teb
Since these processes were carried out by the same operators, with a common end-goal, and with the same cell type and medium formulation, the authors believe these cost calculations form a fair comparison between multiple systems regarding COGs and cost distribution specifically for the scale of operations at Prometheus KU Leuven. These estimations could represent a manufacturing scenario for early stages of an advanced therapy medicinal product (ATMP) development and potentially up to clinical trial phase I.
It should be emphasized that these data were generated in a university setting and, therefore, they could potentially differ from an industrial setting regarding labor costs as well as laboratory practice. Moreover, even though the cultured cells were expanded for preclinical trials, the process was not yet entirely compliant to current good manufacturing practices (GMP), which would lead to increased costs, mainly for the manual culture processes, once the setting is switched. Even so, it is expected that the trends between the different culture processes will remain relatively similar. It can be seen that closed-system bioreactors entail high COGs, mainly due to the current high cost of the disposables (expected to eventually drop as the market grows), whereas the labor costs are reduced due to partial automation of the process. At this scale, the tissue flask-based strategy is still competitive, while further scale-up will favor microcarrier-based production.
An ongoing discussion exists in the bioprocessing field regarding the design of the most cost-effective bioprocess strategies for autologous and allogeneic cell production on the basis of “scale-out” or “scale-up.” While scale-out is simply doing more of the same (parallelization of processes with the same dimensions), scale-up envisions a direct increase in volume or surface of the culture. In the case of an allogeneic therapy, it seems that a scale-up strategy in which a transition from 2D (flask-based) culture toward microcarrier-based stirred tanks is the most attractive option, and there are bioprocess economic models that support this strategy. 6
The economics of allogeneic expansion for pluripotent stem cells (PSCs) (induced PSCs and embryonic stem cells) have been recently modeled and described both for the upstream 42 as well as for the subsequent downstream operations. 43 However, this is not yet clearly addressed in the case of autologous large-scale expansion, where most likely a generic solution might not exist and optimal solutions might be case specific, based on inherent cell or donor properties as well as practical limitations (e.g., cells obtained from biopsies vs. cells required for therapy). 8 The use of such deterministic models for the autologous case would, therefore, be a challenging task due to the inherent donor-related variability and uncertainty involved in these processes.
Integrated bioprocess design: downstream processes
MSC expansion (the upstream process) has gained considerable attention, addressing to a certain extent the scalability and GMP considerations. However, we are still far from whole bioprocessing design. Downstream processing is only recently gaining attention as a result of the increasing volumes and batches of cells produced at the upstream stages. For example, the dynamic harvest of MSCs from microcarriers in suspension reactors was recently investigated providing scalable methodologies, 44 while in a follow up study the authors linked this process to the subsequent cryopreservation step.31,44 Dynamic harvest of single cells from fixed bed bioreactors was also recently described for the recovery of hPDCs that retained their regenerative potential in vivo 45 and the recovered viable cell fraction per step during the harvest and volume reduction process in a multiplate bioreactor was described in Lambrechts et al. 29 Downstream operations are gaining importance for stem cell bioprocessing, and initial discussion on separation techniques reviewed by Diogo et al. 46 are now translated increasingly in research results. An increasing number of bioprocesses and methods for the clarification and volume reduction of MSC suspensions using membranes and tangential47,48 or dead-end 49 filtration have been recently described. Moreover, the use of expanded bed chromatography for the washing of MSC suspension resulted in improved efficiency. 50 This shows the rapid evolution of the field in reaching a pipeline of unit operations for (autologous) MSC manufacturing, customized per application, and from patient to patient. By developing similar data-based visualization tools for downstream operations, as was done here for the upstream process, a whole bioprocess design approach could be further exploited.
Rational data-based bioprocess design
As illustrated before by the large variety in the process maps, there is growing awareness on the need for standardization given the specialized and complex components involved in cell therapy research and development. 51 The lack of standardization, or at least some degree of harmonization, hampers a swift transition from the development phase that is often based on trial and error, to the translational stage that requires robust and cost-effective processes. 52 For instance, the adoption of improved standards for stem cells entering clinic 53 was recently suggested. Regarding input cell material, recent literature has highlighted the need for standardized MSC lines as calibration tool 54 or reference material, 55 whereas a systematic data-based approach and centralized manufacturing facilities able to conduct systematic comparability studies were advocated by McKenna et al., 56 highlighting the invasiveness of the immortalization of the standardized MSC lines to the initial cell properties. Moreover, to address the complex regulatory landscape, a cell therapy regulatory toolkit (online regulatory resource) was introduced for new ATMPs entering clinical trials for the EU and United States of America. 57
It is clear that a certain degree of standardization would be helpful to move the field forward, however many cell-based therapies (in particular autologous therapies) will require personalized approaches, where flexibility is required to allow customization per patient or per therapy. Based on this work, we propose and illustrate the potential of an in-silico data-based approach, where data related to process performance and efficiency for MSC expansion could be concentrated, standardized, and analyzed based on objective quantitative criteria. This could help to obtain insights and conclusions regarding the translation of cell therapy and contribute toward efficient MSC bioprocessing and manufacturing. A similar data-based initiative was started recently by the Food and Drug Administration (FDA) to monitor manufacturing information of modified T-cells for cancer immunotherapies (CAR T) (http://raps.org/Regulatory-Focus/News/2016/03/16/24549/FDA-Proposes-New-Databases-to-Monitor-CAR-T-Cell-Safety-Across-INDs).
The ultimate aim is to rationalize MSC production, that is, standardizing wherever possible, but allowing calculated flexibility where needed. However, it speaks for itself that process efficiency should not be pursued at the cost of biological functionality of the cells, since a high expansion efficiency is not necessarily linked to therapeutic success. It would be extremely interesting to add a measure for the therapeutic potential of the cultured cells in this type of databases, however, currently there are not often objectively quantifiable biomarkers available for the in vivo potential of stromal (or stem) cells, either due to a lack of the proper sensors and assays, or due to a limited understanding of the mechanism of action. Even if, for a specific case, a potency assay is available, it is closely linked to the intended clinical application of the cells, therefore, preventing a fair comparison across multiple processes.
Future challenges
The authors will attempt to keep the current database updated when new relevant publications become available. Access to the database is available upon request for collaboration on further data analysis or the addition of new parameters. As more and more data are collected in the database, more in depth data mining techniques could allow for the extraction of data-driven strategies for bioprocess improvements. From the bioprocess design point of view, the incorporation of time-series data 58 or process parameters that quantitatively describe the dynamic culture environment 59 could provide much more insightful information on the dynamics as well as the robustness of MSC bioprocesses. For example, for stirred vessels, parameters such as energy dissipation rate, shear stress, or oxygen transfer characteristics could provide readouts for shear stress and mass transport properties. Unfortunately, there are very few studies reporting on these readouts for dynamic MSC expansion. For instance Nienow et al. 38 evaluated agitation conditions across a number of stirred reactors widely used for microcarrier-based MSC expansion. By providing this kind of information, an identification of optimal bioprocess operating conditions could be also achieved.
From the cell quality attributes point of view, although ISCT criteria provide minimum cell identification criteria, 35 processes should also be linked to potency assays of increased sensitivity and functionality that could however be application specific. For instance, the performance of expanded cells in an in vivo setting is usually omitted and only seldom linked to its bioprocess history. There is still a need for predictive potency assays that correlate with in vivo activity, to ensure product comparability during manufacturing changes. 60 For most of the studies included in this article, the link with the impact of process conditions on MSC in vivo performance has been largely ignored, and only a handful of studies evaluated this.
Conclusion
The steady increase in MSC production scales demonstrates the continuous maturation of the field. However, there are considerable challenges to be faced for the successful transition from early preclinical to late commercial stage manufacturing. A major factor contributing to this challenge is that there is no typical, one-size-fits-all manufacturing solution. Therefore, we present an interactive visualization tool that provides an integrated perspective on MSC expansion that is able to increase the understanding of scale-up and commercialization of cell production processes.
Footnotes
Acknowledgments
T.L. is supported by the KU Leuven Concerted Research Actions (GOA/13/016). M.S. is supported by a PhD grant of the Agency for Innovation by Science and Technology (IWT/111457). I.P. is funded by Fonds Wetenschappelijk Onderzoek (FWO fellowship, project No 12O7916N).
Disclosure Statement
No competing financial interests exist.