




Abstract
As research associates in clinical experiments, we have an obligation to disclose clinical methodologies and findings in full transparency in ethics. However, inadequate disclosure in results reporting clinical trials registered on ClinicalTrials.gov has been revealed, with approximately half the trial results not being reported in an applicable manner. Our recent study in clinical trials of regenerative medicine for four kinds of neurological diseases revealed that the rate of result reporting to ClinicalTrials.gov is inadequate for gene and cell therapy (CT) trials. In this path, further curiosity emerged to see what the findings would be if the analysis was conducted for trials in all disease areas, and outcomes if gene therapy (GT) and CT were distinguished in terms. In this study, the scope of analysis was further expanded to include all disease areas, and the drug classification from the AdisInsight database was used for modality classification, with biologic drug trials classified as controls, CT, ex vivo GT, and in vivo GT. To begin, among all interventional clinical trials with registration in the ClinicalTrials.gov registry and with a primary completion between 2010 and 2019, we created a total of 5539 datasets corresponding to trials classified as GT and CT, while biologics (BLG) as controls in the AdisInsight drug classification. The status of reported results of these trials was identified by surveying posting status of ClinicalTrials.gov and publication in journals (PubMed), respectively. Based on the obtained dataset, multivariate analysis was performed on the data on the reporting rate of clinical trial results, aggregated by sponsor, phase, status, and modality (CT, ex vivo GT, in vivo GT, and BLG), respectively. The result shows that CT was identified as an independent factor restraining result reporting ratio in both ClinicalTrials.gov and total disclosures, whereas ex vivo GT as boosting result reporting ratio. Since the result reporting rate of CT results was notably poor, we discussed the causes and solutions in this regard.
Impact statement
In our recent study, we brought up an inadequate disclosure in results reporting clinical trials in regenerative medicine with limited disease area. In this analysis, we performed multivariate analysis by classifying regenerative medicine into cell therapy (CT), ex vivo gene therapy (GT), and in vivo GT without any limitation for targeting disease area. To the best of our knowledge, it is first time to claim that the result reporting rates for CT trials are particularly poor. Regenerative medicine holds great promise for the future, and prompt and transparent sharing of clinical trial results are essential for its proper translation.
Introduction
Globally, cell and gene therapy (GT) technologies have achieved breakthroughs in the past decades, while conducting clinical trials in broader therapeutic areas, and have rapidly progressed toward practical applications. However, have the results of their clinical trials been reported adequately?
ClinicalTrials.gov 1 and other trial registries2,3 have established ethical and legal obligations to disclose trial protocols and outcomes promptly; therefore, the clinical research team needs to share clinical trial protocols and results with the public, with sufficient transparency. However, Anderson et al. 4 observed that reporting rates of clinical trial results were insufficient. In addition to analyses of study results reporting rates for unlimited disease areas, analyses of result reporting for limited disease areas, such as cancer 5 and urology, 6 have revealed poor study result reporting rates.
Given that analysis follows a different approach, the factors affecting the under-reporting of results included sponsors,7,8 clinical phase, 8 and recruitment status. 5 Amid the growing landscape of clinical research activities involving regenerative medicine areas, such as gene therapies, to promote clinical research safely and without unnecessary duplication, the results of clinical trials must be shared with experts. As part of a study aimed at the practical application of regenerative medicine, this study investigated the factors that influence the rate of reporting of clinical trial results.
Initially, we could not find such an analysis for regenerative medicine trials, so we conducted a pilot study of analyzing result reporting rates in four neurological diseases with regenerative medicine registered with ClinicalTrials.gov as our previous report. 9 In doing so, it is inappropriate to classify treatment modalities by the terms listed in the intervention column (e.g., “drug,” “biological,” “genetic”) because ClinicalTrials.gov data are not accurately categorized by treatment modality.
Therefore, in the previous study, 9 the treatment modality was manually determined from the listed drug names in the intervention column and analyzed. The total number of trials was small due to the limited therapeutic area, which allowed for the manual classification of therapeutic modalities such as gene and cell therapy (CT), small-molecule compounds, and biologics (BLG). Based on the treatment modality classification, and by setting up small-molecule compounds and BLG as study controls, a comparative analysis was performed. As a result, despite the dataset's small sample size, the reporting rate of regenerative medicine study results was found to be substantially poor. In this path, further curiosity emerged to see what the findings would be if the analysis was conducted for trials in all disease areas, and outcomes if GT and CT were distinguished in terms.
Taking advantage of the fact that the AdisInsight database (Springer Nature) categorizes drugs by therapeutic modality, such as BLG, GT, and CT, to extend the scope of analysis to all disease areas in this study, the AdisInsight database was used instead of manual classification. The data of 5539 clinical trials registered with primary completion dates between 2010 and 2019 at ClinicalTrials.gov were extracted. The clinical trial was divided into GT and CT, and the GT was further divided into in vivo and ex vivo, while BLG (i.e., other than CT and GT) were used as the study control.
In addition to the treatment modality, three factors that had been previously reported—sponsor, trial phase, and recruitment status—were also investigated. Moreover, an analysis was conducted to determine the result reporting rates among submissions to ClinicalTrials.gov or journal publications (PubMed). CT was identified as an independent suppressing factor for the rate of result reporting for ClinicalTrials.gov and total dissemination, while ex vivo GT was identified as an independent increasing factor. Based on findings, to facilitate result reporting in the field of regenerative medicine, some suggestions to improve the issue were also examined.
Methods
Design
This is a retrospective cohort study using the ClinicalTrials.gov database and is not human-subject research.
Data collection
We used AdisInsight “Drug Class Hierarchy” with treatment modalities categorized as drug classes to classify the treatment modality. The dataset of “Cell therapies trial set” as well as “Gene therapies trial set” were downloaded from the AdisInsight website using “Cell therapies” and “Gene therapies” as keywords, respectively. Since CT and GT are subjects of this analysis, as well as subject to the Biologics License Application, we used BLG trial data as a control. That is, the field of “Drug Class” was searched in the AdisInsight database using the following search terms: “Biological intercellular signaling peptides and proteins,” “Biological peptides,” “Biological proteins,” “Bacterial proteins,” “Blood proteins,” “Bone morphogenetic proteins,” “Cytokines,” “Globulins,” “Glycoproteins,” “Recombinant proteins,” “Silver proteins,” “Viral proteins” or “Blood products and substitutes.” We obtained a dataset that includes at least one of the search terms and named it the “Biologics” trial set.
We extracted all registered data that contained NCT numbers in the Trial Identifier field from each “Biologics,” “Cell therapies,” and “Gene therapies” trial set and we labeled each of them as a candidate number of drug class for each trial set.
We downloaded a dataset from the ClinicatTrials.gov website across the intervention trials in Phase I/II to Phase IV with a primary completion date from 2010 to 2019. The “Intervention” column was searched with the following keywords: “Drug:,” “Biological:,” “Genetic:,” and “Combination:,” and trials that did not correspond were excluded, and further, trials with “withdrawn” in the “status” column were excluded.
The collected dataset was designated as SearchResults 2010_2019. We selected clinical trials categorized into one of three treatment modalities by searching the NCT number field in the dataset of “SearchResults 2010_2019” with the obtained candidate number. Next, we selected duplicate trials between gene therapies and cell therapies, and thereafter designated them as ex vivo GT. We also defined the treatment modality classifications as follows: in vivo GT (excluding trials where trials were duplicating CT), CT (excluding trials where trials were duplicating GT), and BLG (excluding GT and CT).
Finally, we selected trials with “Actual Study Completion Date” as “completed” trials for this analysis.
Data of result reporting
We applied trials with “Has Results” in the “Study Results” field of the ClinicalTrials.gov registry as reported trials to ClinicalTrials.gov. We defined the publication of the research article by searching the PubMed database using the NCT number assigned to each clinical trial as an index, and articles that had published the results of the clinical trial were included in this analysis. We manually reviewed each article whether the results that correspond to at least one primary outcome measure were reported in PubMed with confirmed results, were considered “result reported.” Articles without corresponding results, with the study designs or protocols only, and withdrawn were considered no result reported. The publication date was adopted as the date published on the PubMed or the electronic publication date, if available, whichever is earlier. Articles published before the “Primary Completion Date” and secondary sources, such as reviews, were excluded.
Sponsor classification
To clarify the relationship between reporting the results and study sponsors, we classified sponsoring organizations as big pharmaceuticals, small pharmaceuticals, or academia. The top 66 companies, 10 with revenues exceeding $2 billion in the global pharmaceutical industry in 2018, were classified as “big pharma”; smaller companies in terms of revenue other than big pharma were designated as “small pharma”; and noncommercial organizations, that is, universities, hospitals, and government organizations, were designated as “academia.”
Phase classification
The higher phase was adopted as the clinical phase for analysis and Phase I/II and Phase II/III were merged into Phases II and III, respectively.
Decreasing the time course of the unreported result ratio
The decreasing curves of the unreported result ratio due to time passed from the primary completion were analyzed using Kaplan–Meier estimator analysis. We defined result reporting dates as either the dates posted as “Result First Posted” in ClinicalTrials.gov or the dates published in journals (PubMed). For total dissemination, if results were reported in ClinicalTrials.gov and PubMed, the earlier report was adopted. Furthermore, if results were not reported by the data collection date (December 1, 2021), this data collection date was used as the last update, thus counting the number of days from the “actual primary completion date.”
Software
The downloaded CSV file was subjected to data cleaning and tagging using Microsoft Excel. IBM SPSS Statistics v28 (IBM Corp., Armonk, NY) was used for statistical analysis.
Statistical analysis
IBM SPSS Statistics v.28 (IBM Corp.) was used for statistical analysis. The significance level was set as p = 0.05, unless otherwise specified. The Clopper–Pearson method was used to calculate the 95% confidence intervals (95% CIs) for the population rate. The unreported result ratios in the time course for each of the four groups (BLG, CT, ex vivo GT, and in vivo GT) were illustrated by Kaplan–Meier curves. Please be aware that Figure 4 only depicted those results reported within 5 years from the primary completion date. In addition, a log-rank test was performed to test combinations between two groups of six patterns for each of the four groups' curves followed by the Bonferroni method (using an altered significance level of 0.05/6 = 0.008333). These statistical analyses were performed across the entire period.
Experiment
Data collection
Figure 1 illustrates the Venn diagram of modality classification used in this study. And, summary of the data collection is shown in Figure 2. The dataset of SearchResults 2010_2019 was downloaded from the ClinicatTrials.gov website on December 1, 2021. The dataset consists of 52,003 trials. Moreover, on December 2, 2021, the trial module datasets were downloaded from the AdisInsight website with a given treatment modality for a drug class. Then, from the downloaded trial datasets, ClinicalTrials.gov registration numbers (NCT number starting with NCT0) were selected in the trial identifier column. Only trial numbers registered with ClinicalTrials.gov were extracted from the AdisInsight data.
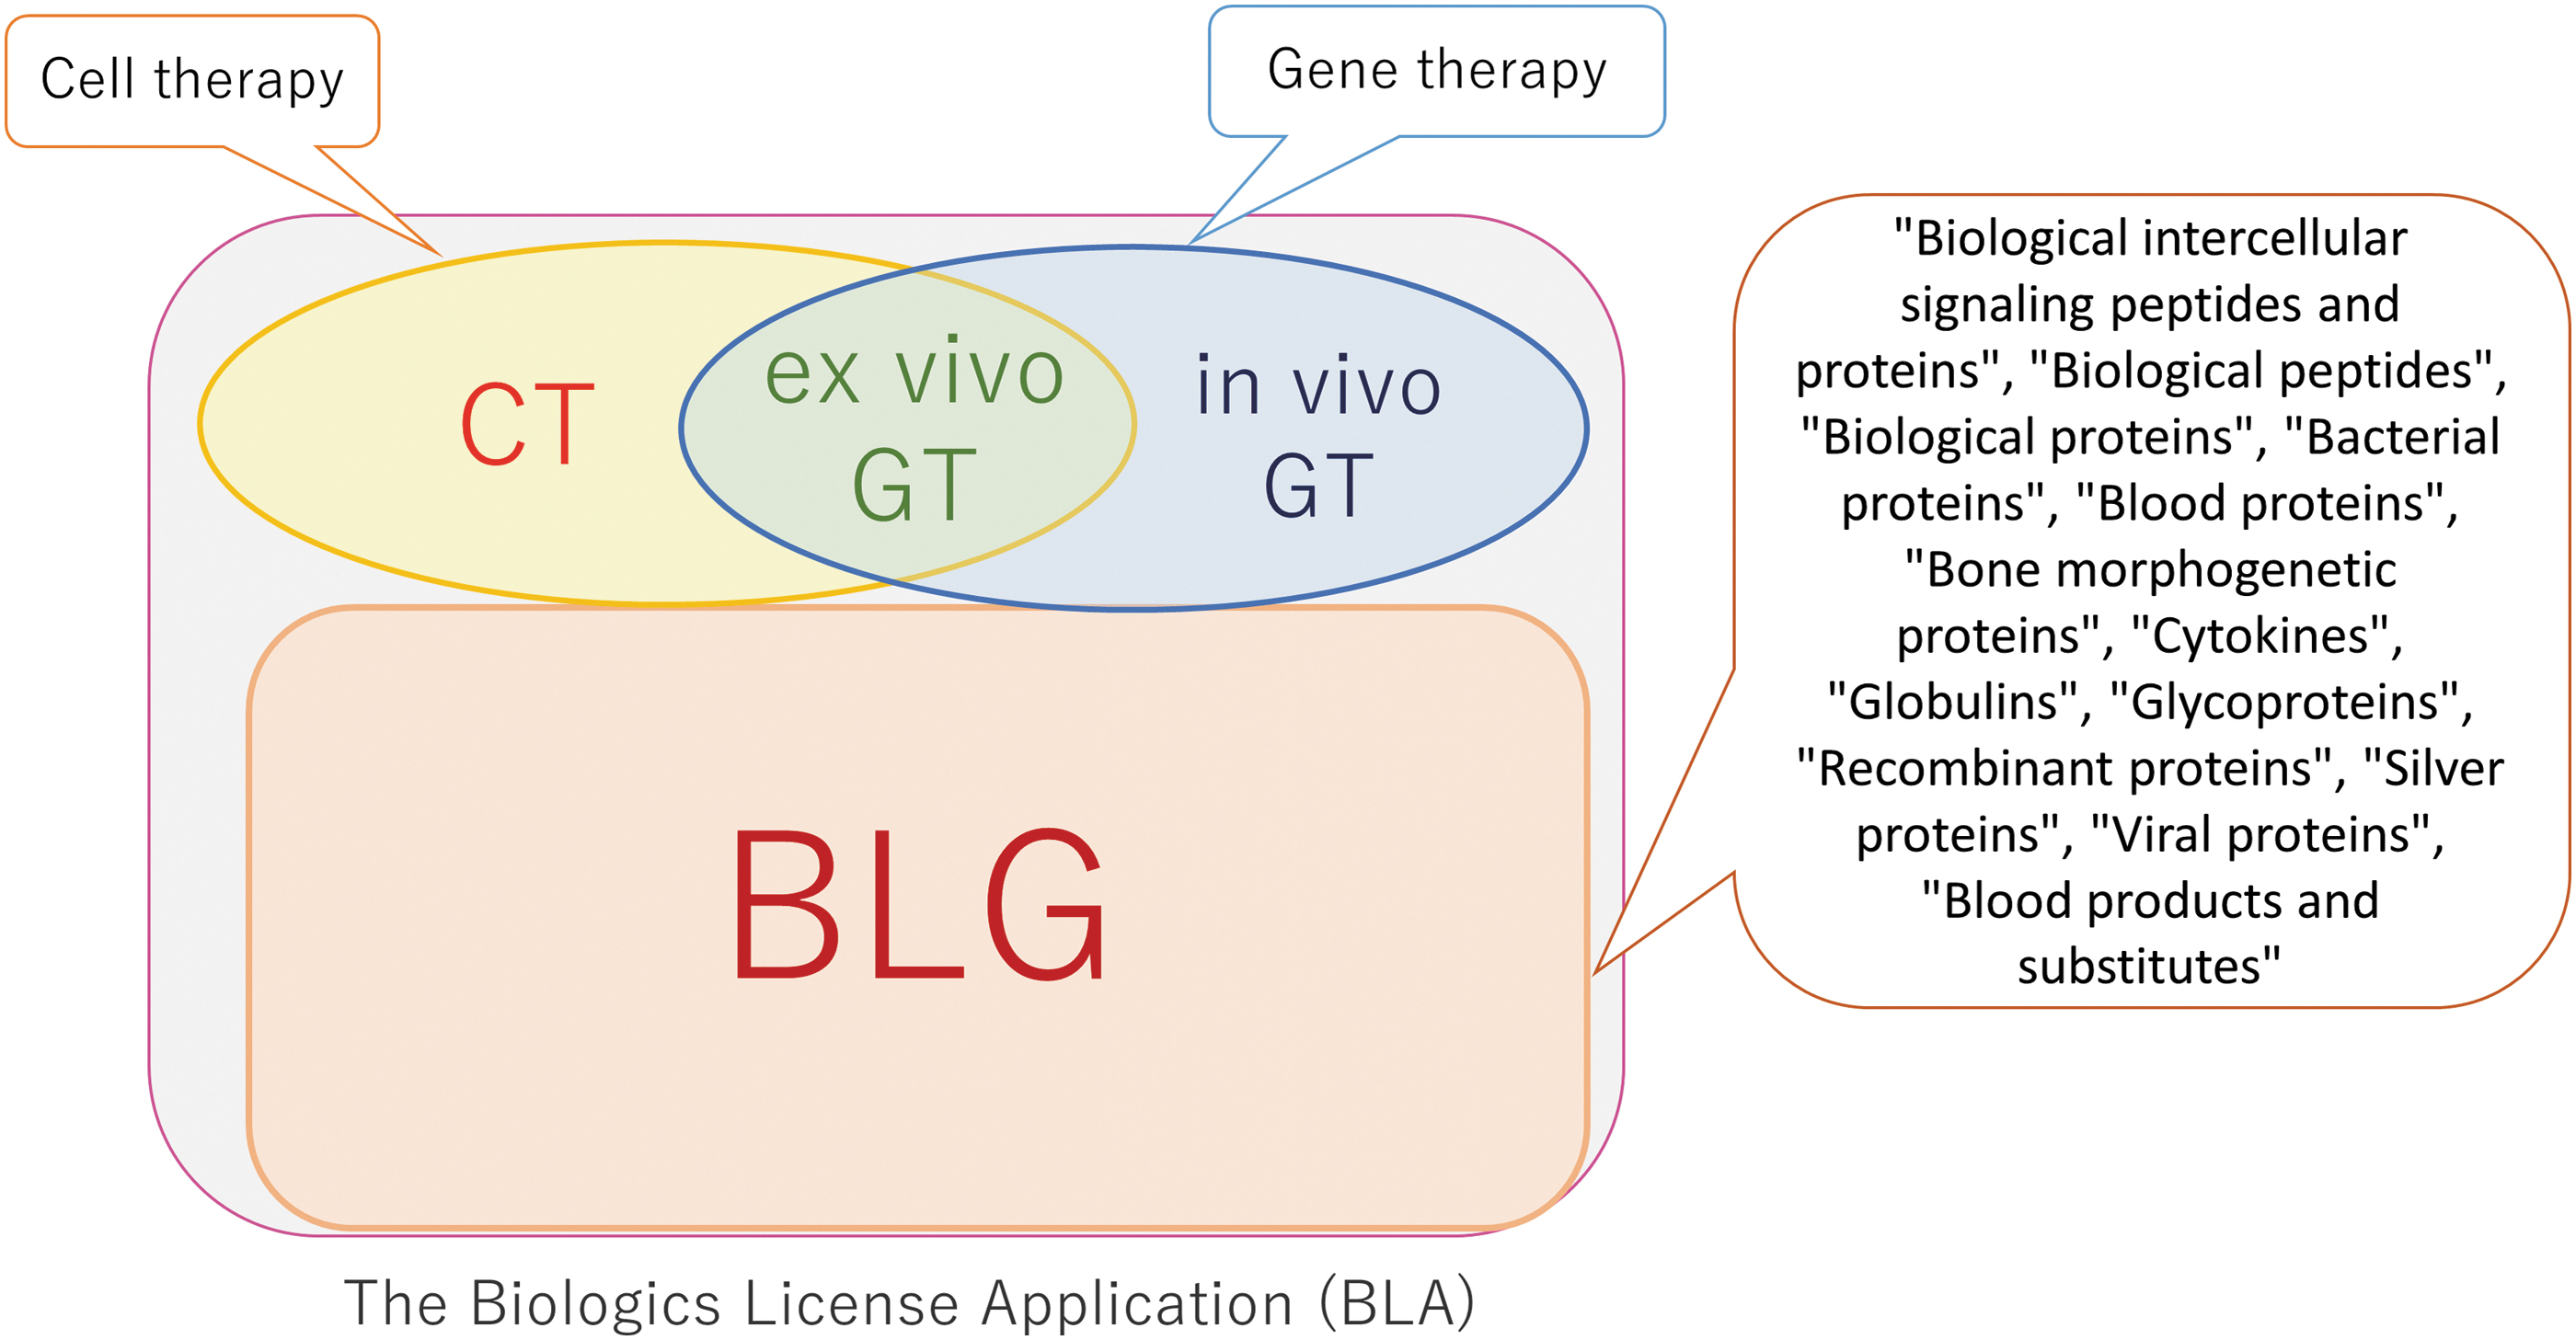
Schematic representation of abbreviations for treatment modalities. CT: clinical trials evaluating cell therapies, not including gene therapies, in vivo GT: clinical trials evaluating gene therapies, not including cell therapies, ex vivo GT: duplication of trials queried by gene therapies and cell therapies by AdisInshgiht database, BLG: clinical trials evaluating BLG, not including gene therapies and cell therapies. Using the drug class (speech balloons) in the AdisInsight database, trials that evaluated therapeutic drug candidates subject to the BLA were classified as BLG, CT, in vivo GT, and ex vivo GT and used for analysis. BLA, Biologics License Application; BLG, biologics; CT, cell therapy; GT, gene therapy.

Schematic representation of data collection and processing. n = 25,583 BLG, 1303 cell therapies, and 1771 gene therapies were obtained as NCT numbers of trials to evaluate drug candidates of each modality based on the information obtained from the Drug Class of AdisInsight. Using these as references, 52,003 SearchResults 2010_2019 trials were surveyed to select 6703 matched BLG, cell therapies, and gene therapies. Data cleaning was conducted, and trials without primary completion dates were excluded, resulting in 5101 BLG, 253 CT, 133 in vivo GT, and 52 ex vivo GT, for a total of 5539 trials. These were used for subsequent analyses.
Using these categorized NCT numbers, 6703 trials corresponding to the three treatment modalities were identified by screening the SearchResults 2010_2019 dataset. In this dataset, eight trials did not meet our criteria for BLG, extracted as errors, and 6695 trials were classified as verified. Furthermore, 1156 trials with no primary completion date were excluded, and 5539 trials with actual primary completion dates were used for the analysis. The final breakdown for BLG, CT, in vivo GT, and ex vivo GT were 5101, 253, 133, and 52, respectively.
Data analysis
In addition to treatment modality, sponsors, trial phases, and the status of recruitment, which were previously reported in other studies as affecting factors, were analyzed to compare the result reporting rates. Figure 3a shows the result reporting rate of trials classified by the sponsors. Sponsors with big pharma had a total result dissemination rate of 95.5% (95% confidence interval: 94.6%–96.4%), and the reporting rate of ClinicalTrials.gov was 92.5% (95% CI: 91.3–93.6). In contrast, for small pharma and academia, the total reporting rate was <70%, and the reporting rate to ClinicalTrials.gov was 56.6% (95% CI: 54.2–59.1) and 49.0% (95% CI: 46.8–51.3), respectively. Therefore, for the trial sponsors with big pharma, the reporting of study results is nearly complete, while for small pharma and academia, the reporting of results is still insufficient.
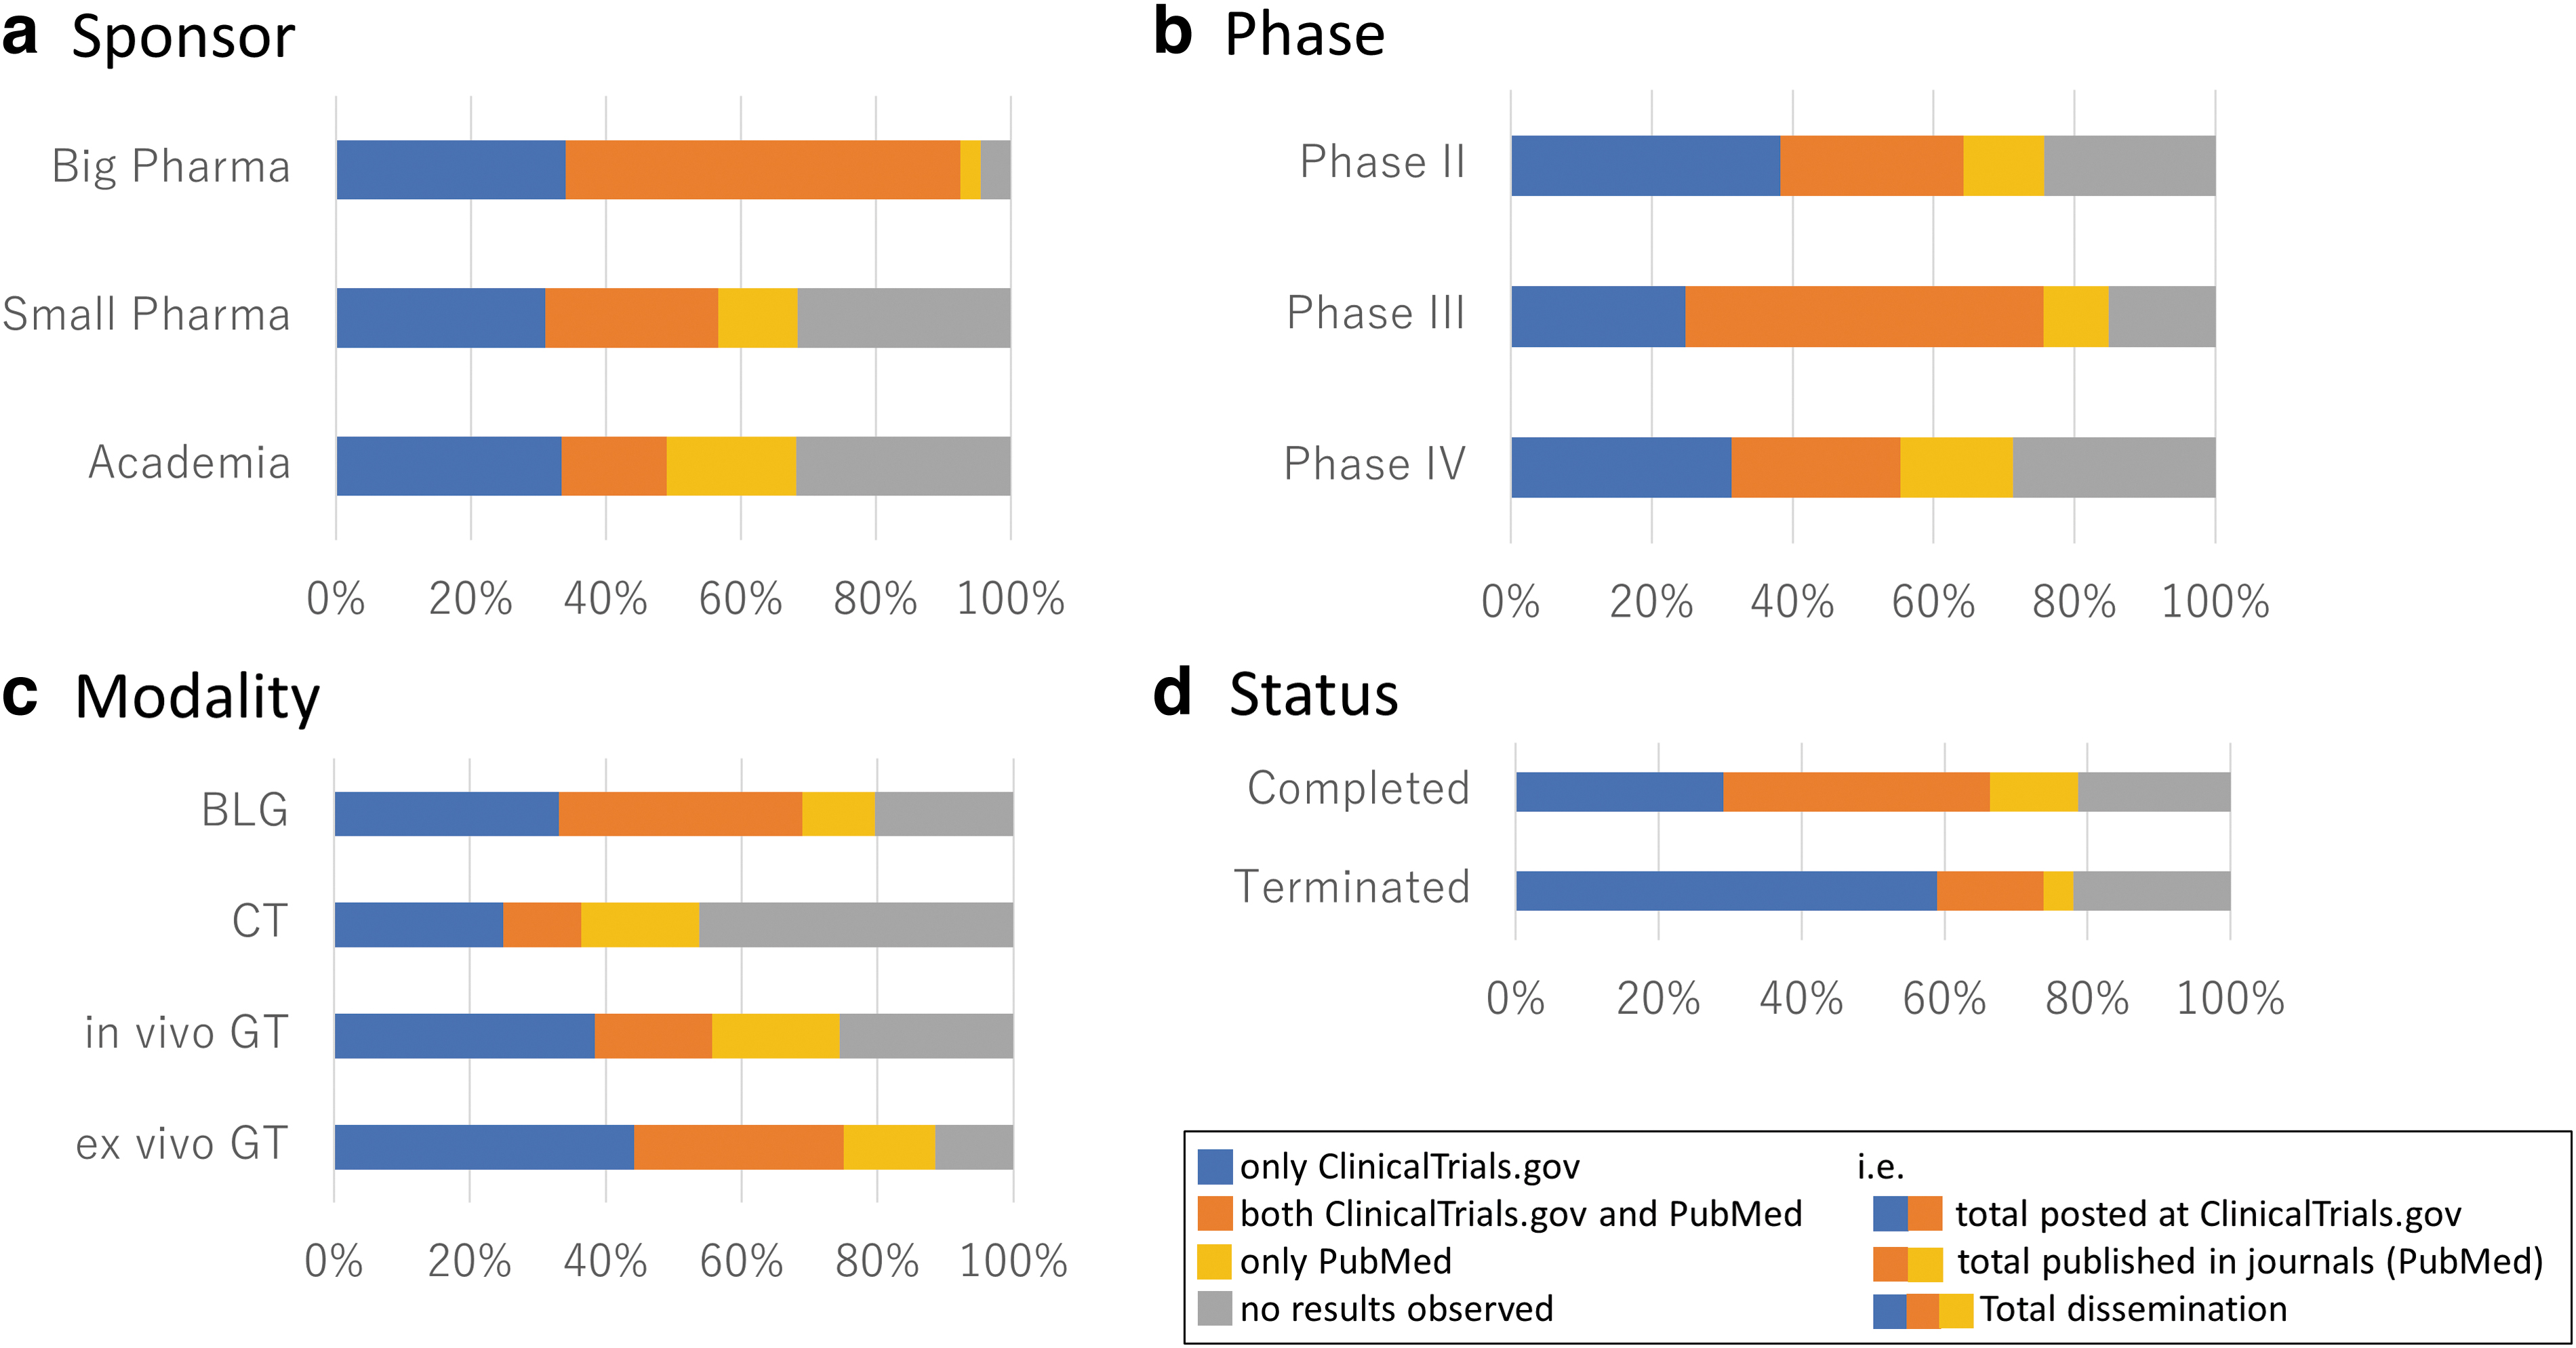
Figure 3b shows the result reporting rate classified by phases, with a total dissemination rate of 84.8% (95% CI: 83.1–86.4) for Phase III, compared to 75.7% (95% CI: 74.2–77.2) and 71.2% (95% CI: 67.2–75.0) for Phase II and Phase IV, respectively. The reporting rate to ClinicalTrials.gov was 75.6% (95% CI: 73.6–77.5) for Phase III, 64.2% (95% CI: 62.5–65.9) for Phase II, and only 55.3% (95% CI: 51.0–59.5) for Phase IV. The comparison revealed that compared to the reporting rate for Phase III, Phase II and Phase IV had a lower result reporting rate.
Figure 3c shows reporting rates by modality. The total dissemination rate by modalities was 79.6% (95% CI: 78.4–80.7) for BLG, 74.4% (95% CI: 66.2–81.6) for in vivo GT, and 88.5% (95% CI: 76.6–95.6) for ex vivo GT, while for CT, it was only 53.8% (95% CI: 47.4–60.0). The same trend of reporting rates to ClinicalTrials.gov was 68.9% (95% CI: 67.7–70.2) for BLG, 55.6% (95% CI: 46.8–64.2) for in vivo GT, and 75.0% (95% CI: 61.1–86.0) for ex vivo GT, compared to 36.4% (95% CI: 30.4–42.6) for CT. This indicated that CT, in vivo GT, and ex vivo GT did not have uniformly lower reporting rates compared to BLG, but CT had the lowest reporting rate.
Figure 3d shows the reporting rates by recruitment status. There were no major differences in patient recruitment status in terms of total dissemination rate and ClinicalTrials.gov reporting rate, but the “Terminated” trials (in which studies have stopped early and will not start again) had a significantly lower publication disclosure (PubMed) rate. Although Liu et al. 5 reported that an oncology field analysis indicated that “Terminated” trials had lower result reporting rates than “Completed” trials (in which studies have ended normally), in this study, despite the poor result reporting rate in PubMed, the total reporting rate was comparable.
Multivariate analysis was conducted across the sponsor, phase, recruitment status, and modality, highlighting the factors that affect result reporting rates (Tables 1–3). Multivariate analysis with completed trials as a reference in recruitment status identified “Terminated” as an increasing factor, affecting result reporting rate at ClinicalTrials.gov (Table 1), and conversely a decreasing factor in publication in journals (PubMed) (Table 2); however, none of the factors was found in the total dissemination (Table 3).
Multivariate Analyses on the Results Posted at ClinicalTrials.gov
Unknown* includes “Unknown status,” “Enrolling by invitation,” “Recruiting,” and “Suspended.”
ORs <1.0 with significance (p < 0.05) are highlighted in bold.
ORs >1.0 with significance (p < 0.05) are highlighted in ital.
95% CI, 95% confidence interval; BLG, biologics; CT, cell therapy; GT, gene therapy.
Multivariate Analyses on the Results Published in Journals (PubMed)
Unknown* includes “Unknown status,” “Enrolling by invitation,” “Recruiting,” and “Suspended.”
ORs <1.0 with significance (p < 0.05) are highlighted in bold.
ORs >1.0 with significance (p < 0.05) are highlighted in ital.
Multivariate Analyses on the Results Disclosed in Total Dissemination
Unknown* includes “Unknown status,” “Enrolling by invitation,” “Recruiting,” and “Suspended.”
ORs <1.0 with significance (p < 0.05) are highlighted in bold.
ORs >1.0 with significance (p < 0.05) are highlighted inital.
For sponsors, setting up small pharma as a reference, multivariate analysis was conducted and it was observed that the big pharma is an increasing factor of result reporting rate for posting at ClinicalTrials.gov, publication in a journal (PubMed), and total dissemination (Tables 1–3), while academia is a decreasing factor of result reporting rate for posting at ClinicalTrials.gov (Table 1).
In the clinical phase, Phase IV was identified as a decreasing factor for posting at ClinicalTrials.gov, publication, and total dissemination in the multivariate analysis when Phase III was set up as a reference (Tables 1–3). Phase II was identified as the decreasing factor only for publication (PubMed) (Table 2).
For treatment modalities, CT was identified as an independent factor causing a decrease in the result reporting rates for posting at ClinicalTrials.gov (Table 1) and total dissemination (Table 3) in multivariate analysis when BLG was set up as a reference. In contrast, ex vivo GT was identified as an increasing factor in the result reporting rates for posting at ClinicalTrials.gov (Table 1) and total dissemination (Table 3).
Table 4 shows the result reporting rates by cross-analysis of sponsor and modality. The number of eligible trials (and proportion) sponsored by major pharmaceutical companies in each modality was 2165 (35.6%) for BLG, compared to 8 (2.3%), 11 (6.2%), and 2 (2.1%) for CT, in vivo GT, and ex vivo GT, respectively.
Result Reporting Rate of Clinical Trials Classified by Sponsor × Modality
Cells discussed in the main text are highlighted in bold.
Despite the large gap, the reporting rates of big pharma consistently exceed those of small pharma and academia in terms of result reporting rates to ClinicalTrials.gov and total dissemination, indicating that large pharmaceutical companies are a strong factor in increasing result reporting rates. In terms of total reporting rate, in vivo GT was 51.6% (95% CI: 42.4–60.8) and 42.9% (95% CI: 36.5–49.5) in small pharma compared to CT, respectively, which is similar, whereas in terms of academia reporting rate, in vivo GT was significantly higher at 80.0% (95% CI: 65.4–90.4), which is significantly higher compared with CT at 49.1% (95% CI: 39.2–59.0).
Table 5 shows the result reporting rates by cross-analysis of phase and modality. There was no Phase IV studies in CT and ex vivo GT to meet the criteria of this analysis. CT × Phase III had the lowest total dissemination rate with 45% and the reporting rate to ClinicalTrials.gov with 25% was the lowest among the 10 cross groups.
Result Reporting Rate of Clinical Trials Classified by Phase × Modality
Cells discussed in the main text are highlighted in bold.
The number of eligible trials (and proportion) of Phase III or higher phase for each modality was 2364 (46.3%) for BLG, 31(12.3%) for CT, 23 (17.3%) for in vivo GT, and 2 (3.8%) for ex vivo GT. Based on the percentage of Phase III and Phase IV trials for each modality, it is necessary to consider that CT, in vivo GT, and ex vivo GT are more recent modalities compared to the BLG studies. In addition, the reporting rates to ClinicalTrials.gov and total dissemination of Phase II × CT were significantly lower than those of Phase II × in vivo GT and those of Phase II × ex vivo GT.
Finally, the trends in the rate of unreported results were analyzed for modality using the Kaplan–Meier estimator over the 5 years from the date of primary completion (Fig. 4). Although an analysis of the entire 2010–2019 period was conducted, Figure 4 illustrates a 5-year period from the primary completion date of each trial. In terms of result reporting within ClinicalTrials.gov, the clinical trial results must be reported within 1 year from the date of completion according to regulations. However, these results were seldom reported on time in all modalities (Fig. 4a). Therefore, an analysis was conducted at 2 years with more practicality, as described by Liu et al. 5 It revealed a decrease in the rate of unreported results in ex vivo GT at 52%, BLG at 55%, and in vivo GT at 70%. CT was the worst at 80%.
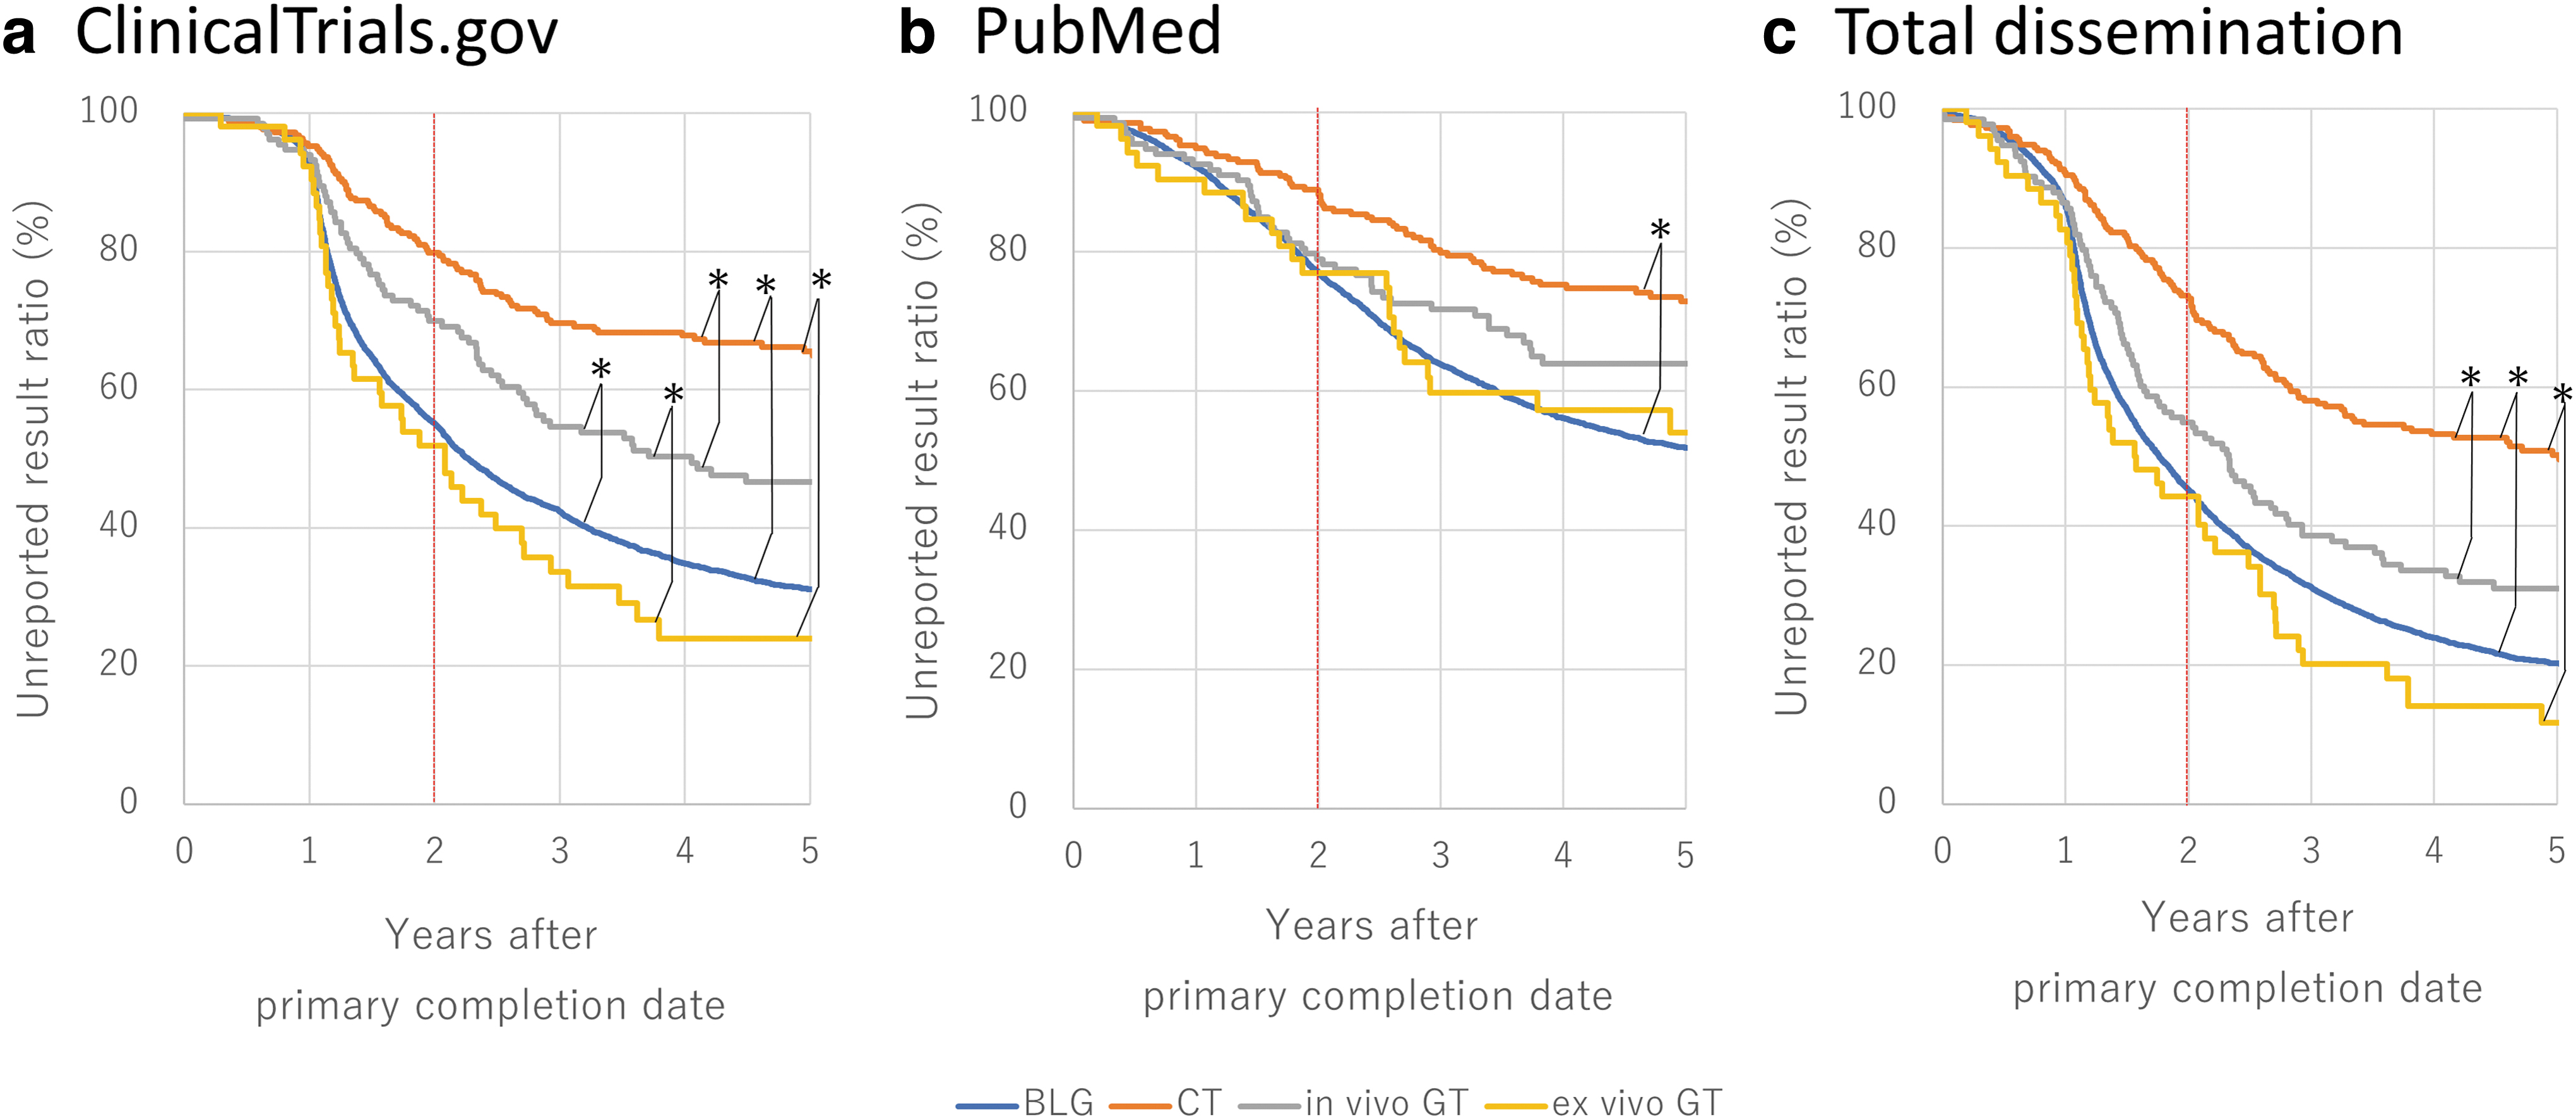
Unreported result ratio trucked by modality for 5 years from the primary completion date.
The test of significance in these modalities was performed and the significance was found in five combinations, excluding the combination of ex vivo GT and BLG. In terms of total dissemination in the rate of unreported results (Fig. 4c), a similar trend was observed with ex vivo GT at 44%, BLG at 45%, in vivo GT at 55%, and CT at 73%. This indicates that a significant difference was observed in CT compared to the other modalities. In terms of results published in journals (PubMed) (Fig. 4b), unreported results in CT were 89% and other modalities were 77%–79%, indicating that a more significant difference was observed in CT compared with BLG. Based on the Kaplan–Meier estimator analysis, the rates of result reporting in CT were lower than in others.
Discussion
To achieve practical applications in the field of regenerative medicine, the objective of this work was to determine whether the results of clinical trials are adequately reported, and if not, to determine the causes, and identify opportunities for improvement. For treatment modalities, CT was identified as an independent factor causing a decrease in the result reporting rates on ClinicalTrials.gov and total dissemination in multivariate analysis when BLG was set up as a reference, whereas ex vivo GT was identified as an increasing factor in the result reporting rates.
To our knowledge, this is the first time it has been identified. Furthermore, Kaplan–Meier analysis was used to compare treatment modalities and revealed that CT reporting rates were significantly lower on ClinicalTrials.gov, among journal publications (PubMed), and in total dissemination. In addition, they were less than half the reporting rates of BLG and ex vivo GT compared to the unreported results 2 years after the studies' primary completion dates, demonstrating that the result reporting of CT is inadequate compared with BLG and ex vivo GT.
The impact of treatment modality, as well as sponsor, was examined on the outcomes of our previous study, 9 which focused on only four different types of neurological diseases, while CT and GT trials were summed together as GCT (gene and/or CT), and it revealed that GCT had lower result reporting rates than small-molecule drugs and BLG.
A breakdown of the previous results showed that only two trials were classified as ex vivo GT, both sponsored by big pharma, but no report of their results was found. In contrast, on the other hand, the remaining trials classified as GCT were mostly CT equivalent, with 5 in vivo GT and 35 CT equivalents. The observed result differences were thought to be due to the insufficient sample size of ex vivo GT equivalents in four neurological diseases, being greatly influenced by the CT majority factor. In this work, this is thought to have been solved by and classifying CT, in vivo GT, and ex vivo GT separately and performing a complete survey.
We would now like to discuss the reasons for the low result reporting rate of CT in this study. Despite the fact that ex vivo GT had a similar small proportion of big pharma sponsors as CT, and despite the fact that ex vivo GT had a smaller proportion of higher phase clinical trials, the reporting rate of results for ex vivo GT was excellent (Table 4).
However, assuming that ex vivo GT is due to the particular success of CAR-T commercialization, we would provisionally exclude ex vivo GT and consider in vivo GT versus CT here. In vivo GT did not differ from CT in terms of the total dissemination rate among small pharma, but was significantly higher in terms of the reporting rate in academia. In other words, in vivo GT does not suppress the reporting rate even in trials conducted by academia. In contrast, CT × academia suppressed the reporting rate. This suggests that there is some difference between CT × academia and GT × academia.
On the other hand, in a cross-analysis of Phase × modality (Table 5), the reporting rates to ClinicalTrials.gov and total dissemination of Phase II × CT were significantly lower than those of Phase II × in vivo GT and those of Phase II × ex vivo GT. As noted in our previous report, 9 this is suspected to be related to the tendency of investigators to be reluctant to report “unfavorable” results, which accounts for the low reporting rate of Phase II trials. It is also interesting to note that Phase III × CT, the next step after Phase II × CT, had the lowest reporting rate to ClinicalTrials.gov. However, further discussion of this issue needs to be done separately in conjunction with an analysis of the success or failure of each trial. In any case, the results suggest that CT translations lag behind those of GT.
In general, BLG is already a mature modality,11–13 with genetically modified products having been in practical use since the 1980s, whereas GT and CT are still in the process of development. Over time, GT has been experimented for practical applications, mainly using adenoviruses and retroviruses since the 1990s,14,15 and product development mainly using AAVs as vectors has been active since the 2010s. 16 Recently, CAR-T products17–20 for ex vivo GT (classified under ex vivo GT category in this study) have become a breakthrough in the hematology/oncology field. In contrast, CT has been investigated using bone marrow cells since the 1980s,21,22 with the actual commercialization of CT products beginning in the 2000s, and products using multipotent stem cells have been commercialized since the 2010s.23–25
However, the translation of embryonic stem cells and induced pluripotent stem cells, which are attracting attention as breakthrough products, is yet in the stage of clinical evaluation.26–30 In light of the above factors and observing the trials completed between 2010 and 2019, GT may be about a decade ahead of CT or applying practical usage, which may have encouraged the participation of large companies and the implementation of higher phases, resulting in a positive impact on the reporting of trial results. In addition, an early-stage GT had experienced a serious adverse event, 31 which was thought to have fostered a culture of compliance in reporting trial results and had a positive impact.
Since the 90s, rather than developing initial drug seeds independently, big pharma bought seeds discovered by small pharma and academia as soon as their POCs (proofs of concept) were achieved, and developed them as their own products, terming them as “open innovations.”32,33 In other words, big pharma does not take on the risks of failure to achieve POCs on its own; instead, small pharma and academia are assumed to shoulder the risk.
If those POCs have essentially been already achieved, big pharma can conduct high-phase clinical trials with minimal risk, and thus face a relatively low barrier in reporting trial results. The reason why the result reporting rate of big pharma was relatively higher may be due to such a scheme, 34 and their attitude toward legal compliance contrasts with that of small pharma and academia, who take the potential risk of not achieving. This may explain the low reporting rate of Phase II × CT.
In contrast to big pharma, the result reporting rate in clinical trials conducted by small pharma and academia is lower, which may be affected by the following factors: the risk of achieving POC, inadequate reporting systems within the organization, lack of funding and human resources, and relatively insufficient investigator's knowledge about legal compliance requirements. 35 There will be a need for public support and educational efforts to improve those result reporting rates. One of those moves is reported, such as setting up a specialized unit inside the organization. 36 We proposed in our previous report 9 that the reporting of clinical trial results to registries should be given a rational rating as valuable as journal publication. This was a measure focused on improving the reporting of results, especially by small pharma and academia. It was hoped that such a proposal would increase the motivation of small pharma and academia to report results.
Since the poor result reporting of CT was revealed in this analysis, we claim that improvement focused on this issue also needs to be done. First, it is necessary to widely publicize the fact that the result reporting rate of CT is inadequate compared with BLG, ex vivo GT, and in vivo GT, and to educate the public about the improvement of CT. Discussion and cooperation with CT-related academic societies on this issue will also be necessary. Furthermore, Powell-Smith and Goldacre reported a unique monitoring system called TrialsTracker, 37 which automatically identifies the sponsors who fail to publish clinical trial results, is in operation. Similar monitoring system focused on CT sponsors may be needed. We hope this article is a first step for the improvement.
Following factors are potential limitations of this analysis: ClinicalTrials.gov was the only source database adopted for this analysis, which means we excluded trials that have not registered on ClinicalTrials.gov. The reasons why other clinical registries were not used include the following: (1) for example, the International Clinical Trials Registry Platform (ICTRP) contains clinical trials with no “Actual Primary Completion Data” causing incomplete data, (2) it was unrealistic to remove vast numbers of duplicate entities, and (3) we considered ClinicalTrials.gov a perfectly suitable database in terms of comprehensiveness because it contains the largest number of clinical trials.
For labor- and time-saving reasons, AdisInsight was used for modality classification; therefore, the accuracy of modality classification relies on the drug class classification. In addition, the AdisInsight database does not include clinical trials of drug candidates in which profit companies are not involved in either R&D or marketing. Therefore, such trials are omitted from this review. However, Adisinsight covers about 64% of clinical trials on ClinicalTrials.gov (Personal communication; [Parag Budukh], August 16, 2022). The identification of journals reporting results from trials registered at ClinicalTrials.gov relied on the presence of the NCT number in the PubMed abstract or metadata.
Footnotes
Acknowledgments
The authors express their appreciation to Ms. Katsuko Tanaka for excellent assistance in this research work.
Authors' Contributions
T.N., H.O., and A.M. conducted the study. T.N., T.A., S.H., and H.O. analyzed the data. All authors wrote the article and contributed to article editing.
Data Availability
The data that support the findings of this study are available from the corresponding author upon request.
Disclosure Statement
No competing financial interests exist.
Funding Information
This work was supported by The Japan Agency for Medical Research and Development (AMED) under Grant Number JP22bm0904001.