




Abstract
Two image-analysis approaches for pore size distribution (PSD) of porous media are proposed. The methods are based on the skeleton representation of a porous object. One approach gives the local thickness of the pore object to represent the pore size corresponding to a lower limit of PSD. The other gives the pore size taking into account the anisotropy of pore object and corresponds to an upper limit of PSD. These two approaches can be incorporated into a computer program without computationally intensive and complex mathematical operations. In this study, these two approaches are applied to a two-dimensional (2D) synthetic image and 3D natural images of tissue scaffolds with various porosities and tortuosities. The scaffolds were prepared by removing the water-soluble poly(ethylene oxide) (PEO) component of the polycaprolactone (PCL)/PEO blend, leaving a porous PCL scaffold. Extracting quantitative PSD information for materials with an interconnected porous network rather than discrete voids (such as tissue scaffolds) is inevitably subjective without a universally accepted definition of “pore size.” Therefore, the proposed lower and upper limits of PSD can come into play when considering mass transfer and scaffold surface area for cell–matrix interaction.
Introduction
Experimental methods have conventionally been used to indirectly probe the PSD of porous media, including tissue scaffolds. For example, an adsorption process (e.g., the Brunauer-Emmett-Teller technique) or a filling process (e.g., the porosimetry technique) can be used. In general, the basic concept is that these processes in a pore are viewed as molecular layering processes, and the PSD can be deduced through corresponding governing equations (mechanisms) for the response of a porous medium to the perturbation. Some of these experimental methods can be destructive. With the advances in imaging and computer technology, one can nondestructively analyze the PSD using images produced via microscopy. 15 For example, microcomputed tomography (micro CT) can provide three-dimensional (3D) images of intact porous media at high spatial resolution that are representative of the true structure of the scaffold. The focus of our study was on the image analysis technique for extracting the PSD from the image of porous object. Those who are interested in the methods (destructive or nondestructive) traditionally used to quantify the PSD in tissue engineering may refer to reference. 16
Although the evaluation of PSD of porous media has a rich history, it is a continuing source of practically challenging questions. One of the substantial reasons is that, in most materials, such as tissue engineering scaffolds, the pores have interconnected irregular shapes (rather than discrete voids), and the definition of a “pore” for such media is inevitably subjective and vague. Consequently, the PSD depends highly on the analytical techniques employed to interpret the image, and no qualitative comparisons can be made between them. Therefore, quantifying upper and lower bounds (e.g., proposed in this study) can largely eliminate variability between definitions. A significant amount of research has attempted to combine specimen image analysis with stereological theory to characterize the PSD of porous media to provide correlations with other functional parameters in an application. However, results of the image analysis often depend on stereological models (e.g., the Voronoi diagram technique 17 ). Our proposed approaches (local thickness and SCL) are based on the skeleton representation of a porous object and are model-independent direct estimations for the PSDs because no special skeletonization technique (e.g., the Voronoi diagram technique) is used before the calculations of pore size. This model-independency is due to the proposed superseding spheres process, which produces the locus of the centers of all maximal spheres inscribed in the pore object and is in line with the intrinsic definition of the skeleton. Accordingly, the calculation of local thickness becomes a natural byproduct of skeletonization of the pore space during the superseding spheres process.
In our SCL approach, instead of the local thickness, the pore size associated with a point in the skeleton of a pore space is evaluated as the average length of intercept segments that occur at the intersection of lines and the boundary of material phase. These lines emanate from the point to each direction in pore phase. This approach, adapted from the concept of star volume distribution for quantifying the anisotropy of porous media,18,19 is assumed to overcome the potential object anisotropy that might be encountered in evaluating the pore size and has not been addressed in previous studies.15,17 Although both approaches (local thickness and SCL) use the skeleton of pore size to evaluate PSD, there is no intrinsic relationship between these two definitions of pore sizes or feasible conversion scheme between them. In this study, our approaches are applied to a generated 2D image of a two-phase material and real 3D images of tissue scaffolds to determine PSD. These porous scaffolds were prepared so as to remove the water-soluble poly(ethylene oxide) (PEO) component of the polycaprolactone (PCL)/PEO blend and leave a porous PCL scaffolds with different porosities and tortuosities.
Methods
A 2D image of a pore space is used to illustrate conceptually how the proposed superseding approach will characterize the PSD. First, as shown in Figure 1a, every pixel in a pore space image (Ω) can be used as the origin of a circle (or a sphere in 3D) to draw a circle with the largest area (i.e., this circle must have a radius to the nearest boundary of the pore space). Then, as show in Figure 1b, if the area of a circle around a pixel (Q1) is completely included in the area of another circle around a pixel (Q2), the pixel circle of smaller area will be eliminated (i.e., no reassignment of radius for the pixel). After a few such exclusions shown in Figure 1b and c, Figure 1d indicates that a point (P) located in the pore space Ω would become the origin of a circle with the greatest diameter that cannot be superseded. Mathematically, this greatest radius, R(P), can be expressed as:
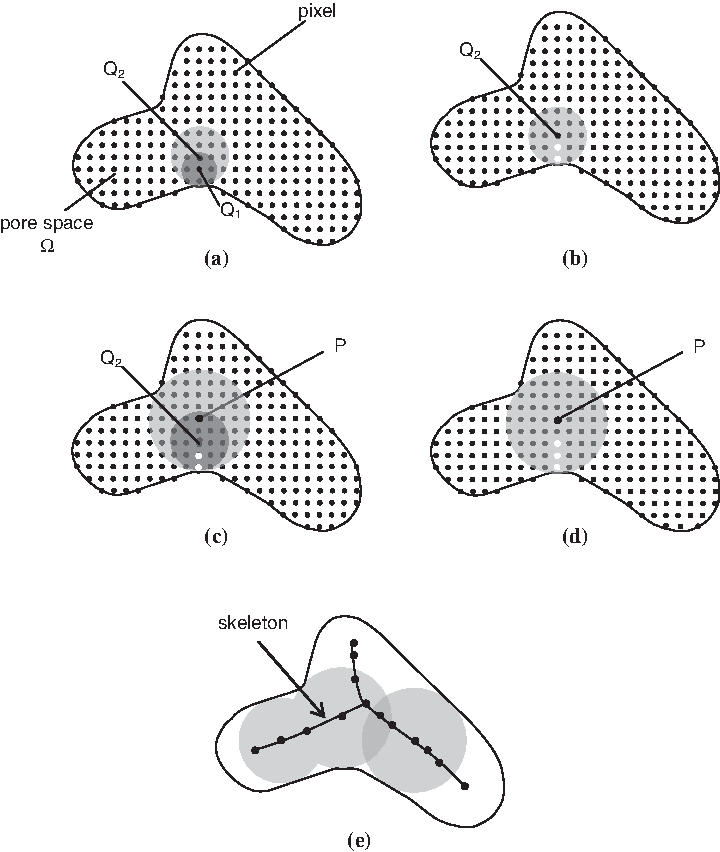
A schematic of the proposed superseding algorithm for characterizing the pore size distribution.
By repeating the aforementioned superseding procedures, what remains in the pore space image are the circles, bi-tangent to the edge of the pore space (or tri-tangent in 3D pore space), with the greatest diameters that can not exclude each other. Subsequently, only these greatest diameters in the image of the pore space will be used in the calculation of the PSD F(P), which is defined as:
By tracing the loci of the origins of the exclusive circles in the superseding spheres process, one obtains the skeleton of the pore space. Therefore, in our superseding approach, the PSD and the skeleton of the pore space are a mutual byproduct of each other. The skeletonization is a convenient tool for shape analysis to obtain a simplified representation of the shape, preserving the extent and connectivity of the original object for a large spectrum of applications. Classically, the skeleton is computed from either the Voronoi diagram technique, the distance transform technique, or the thinning technique.20,21 Although skeletons and their applications have been extensively studied for 2D images, considerably less work has been devoted to 3D images because of the complex and intensive process of fulfilling the requirements of the skeletonization. 22 However, our proposed superseding approach is different from the skeletonization algorithms mentioned in the literature,20,21 because the superseding spheres process is in line with the intrinsic definition of the skeleton—the locus of the centers of all maximal spheres inscribed in the object. 23 In other words, the skeletonization process used in the proposed superseding spheres algorithm involves rejecting superseded spheres until producing a skeletal frame, which is as thin as possible, connected, and centered. This frame does not affect the general shape of the pattern, and the original image can be reconstructed accordingly.
Figure 2 shows the SCL approach proposed in this study, where the chord length (ℓ) corresponding to a point (P) in the skeleton of a pore space is defined as the average chord length of lines emanating from P in various directions until they encounter a boundary. Therefore, the pore size at P (R(P)), is expressed as:

A 2D schematic of the star cord length (SCL) method for characterizing the pore size distribution.
Results and Discussion
The applicability of the local thickness and SCL approaches to the evaluation of PSD relies on the precision of the skeletonization obtained through the superseding technique of the pore space. A major requirement for this precision is that the skeleton be reversible to reconstruct the original shape of the object. Therefore, we use a 2D object to demonstrate the potential of the proposed superseding spheres algorithm in the skeletonization and then obtain the local thickness and chord length to estimate the PSD. Figure 3A is the 2D image of a synthetic microstructure generated from a phase-separated polymer blend. In this 2D image, one of the phases mimics pores, and the porosity is 0.5. Figure 3B gives the skeleton of the pore phase after performing the superseding spheres process. The locus of the origins of bi-tangent circles that are mutually exclusive in the pore phase outlines this skeleton. This extracted skeleton is a single distinguishable connected-component structure. By taking the pixels in the skeleton as the origins and calculating their corresponding diameters with the superseding spheres algorithm to draw circles, the pore phase of the image can be reconstructed from the union of circles (Fig. 3C). The result indicates that the reconstructed pore phase compares well with the original image, including the local details shown in Figure 3A. Also, the reconstruction preserves the porosity of the original pore phase. (The porosity of the reconstructed image is 0.49.) Figure 3D shows a histogram of the resultant PSD obtained through the local thickness and SCL approaches based on the skeleton shown in Figure 3B. It is worthwhile to note that, in tissue engineering scaffolds, cells may migrate easier through larger pores; however, the PSD of smaller pores plays an equally important role in maintaining the cells and determining the rate of scaffold degradation. The mean and median pore diameters that are often used to quantify the pore structure are reported in Table 1. As expected, the results in Figure 3D and Table 1 indicate that the SCL approach (anisotropy) gives a larger value of pore size than the superseding approach (local thickness) for the image studied.
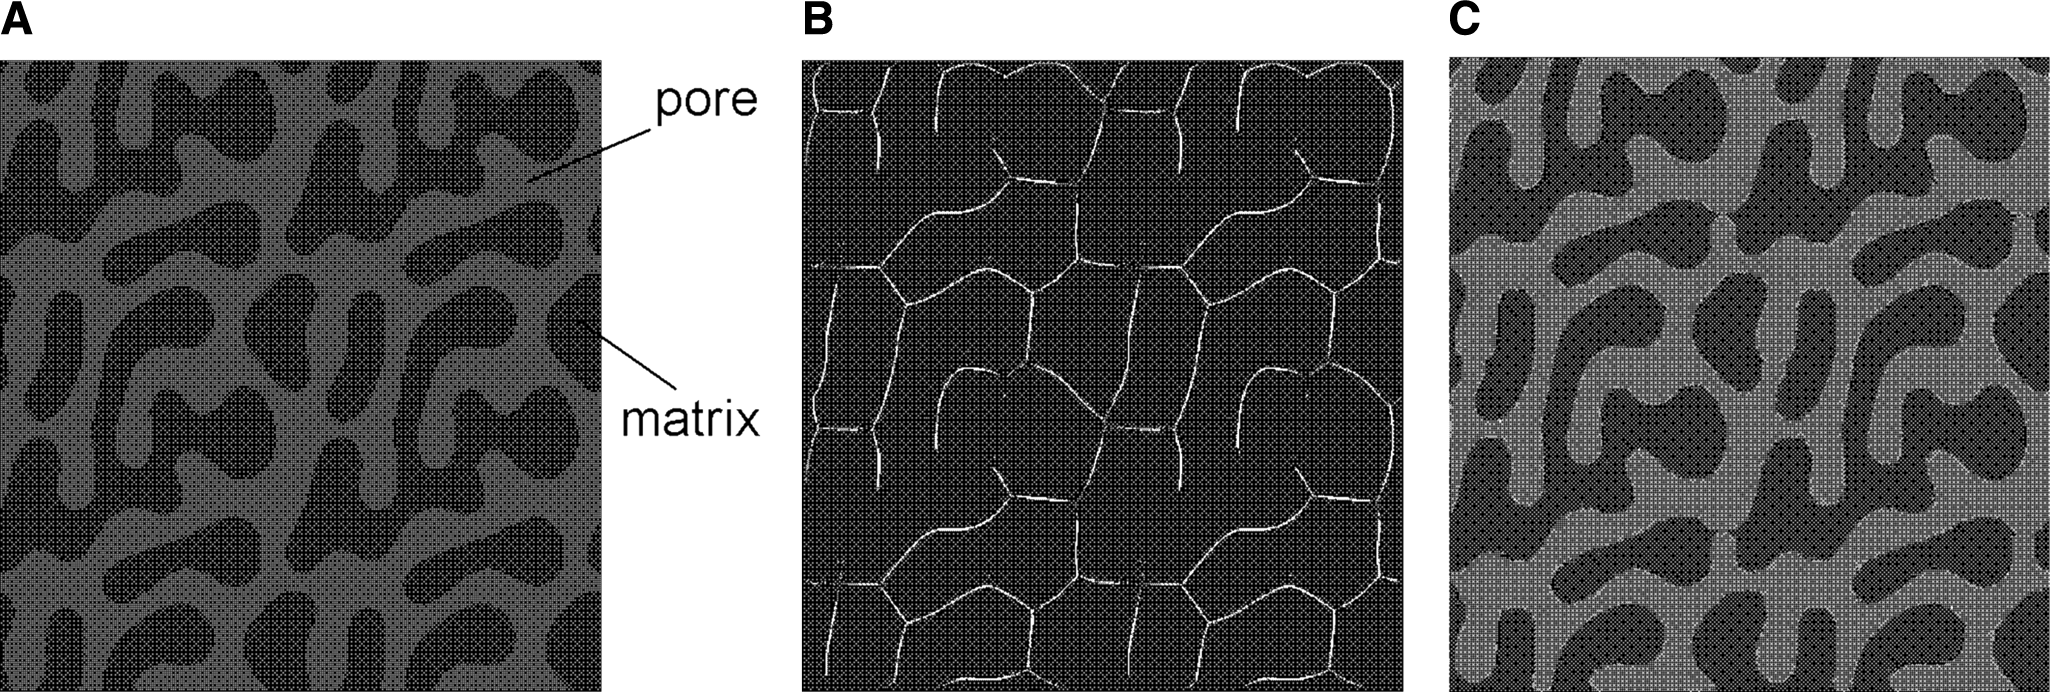
A synthetic 2D microstructure (
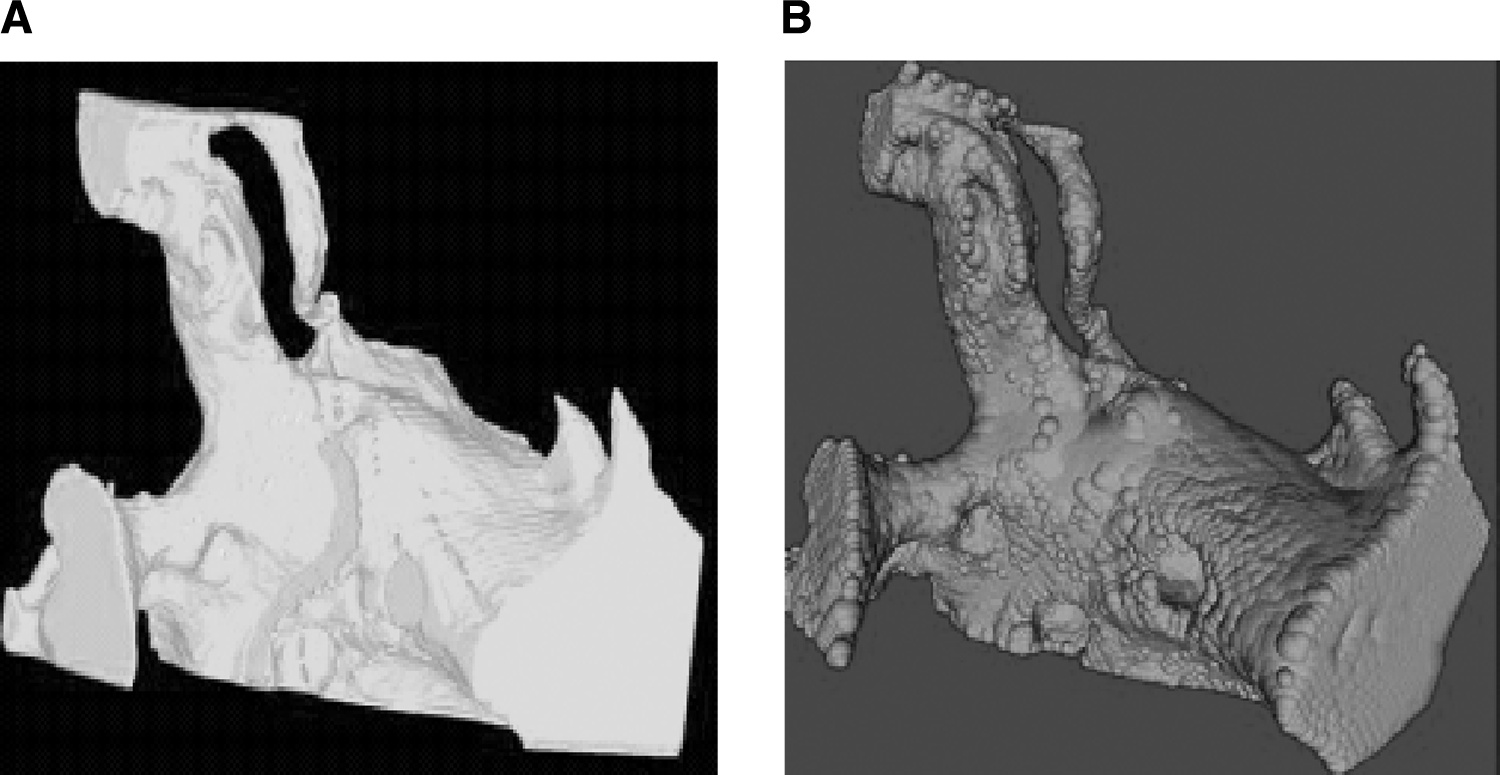
Next, we applied the same superseding spheres algorithm to a more-complicated large-scale 3D image with channel-shaped and inter-connected pore spaces (Fig. 4) to demonstrate the capability of the proposed approaches for characterizing the PSD of a 3D object. This 3D image is an assembly of sequential 2D x-ray tomography microstructures of a porous material and has a porosity of 0.46. After performing the superseding spheres process on the pore phase of the image, a 3D skeleton of the pore phase was extracted with lines and surfaces. For the purpose of visual clarity, we present only the reconstructed image based on the skeletons of a small portion of the original pore phase (Fig. 5). This partial reconstruction results from the union of spheres centered on all the pixels in the skeleton. By looking at features that represent the small portion of the original and reconstructed pore phases, one can see that the reconstructed object produced by the superseding spheres algorithm is topologically equivalent to the original one. Also, their porosities are practically identical (0.46 versus 0.44). This reversibility further demonstrates the versatility of the proposed algorithm for extracting the skeleton of images. Figure 6 gives the histograms of the PSD obtained from the proposed local thickness and SCL approaches to the 3D image in Figure 3. Table 1 gives the mean and median values of the pore diameter. Similar to the trend in the results of the 2D image, the SCL approach estimates the pore size as being more than twice that of the local thickness approach.

The image of a real 3D porous medium assembled with sequential 2D x-ray tomography microstructures.
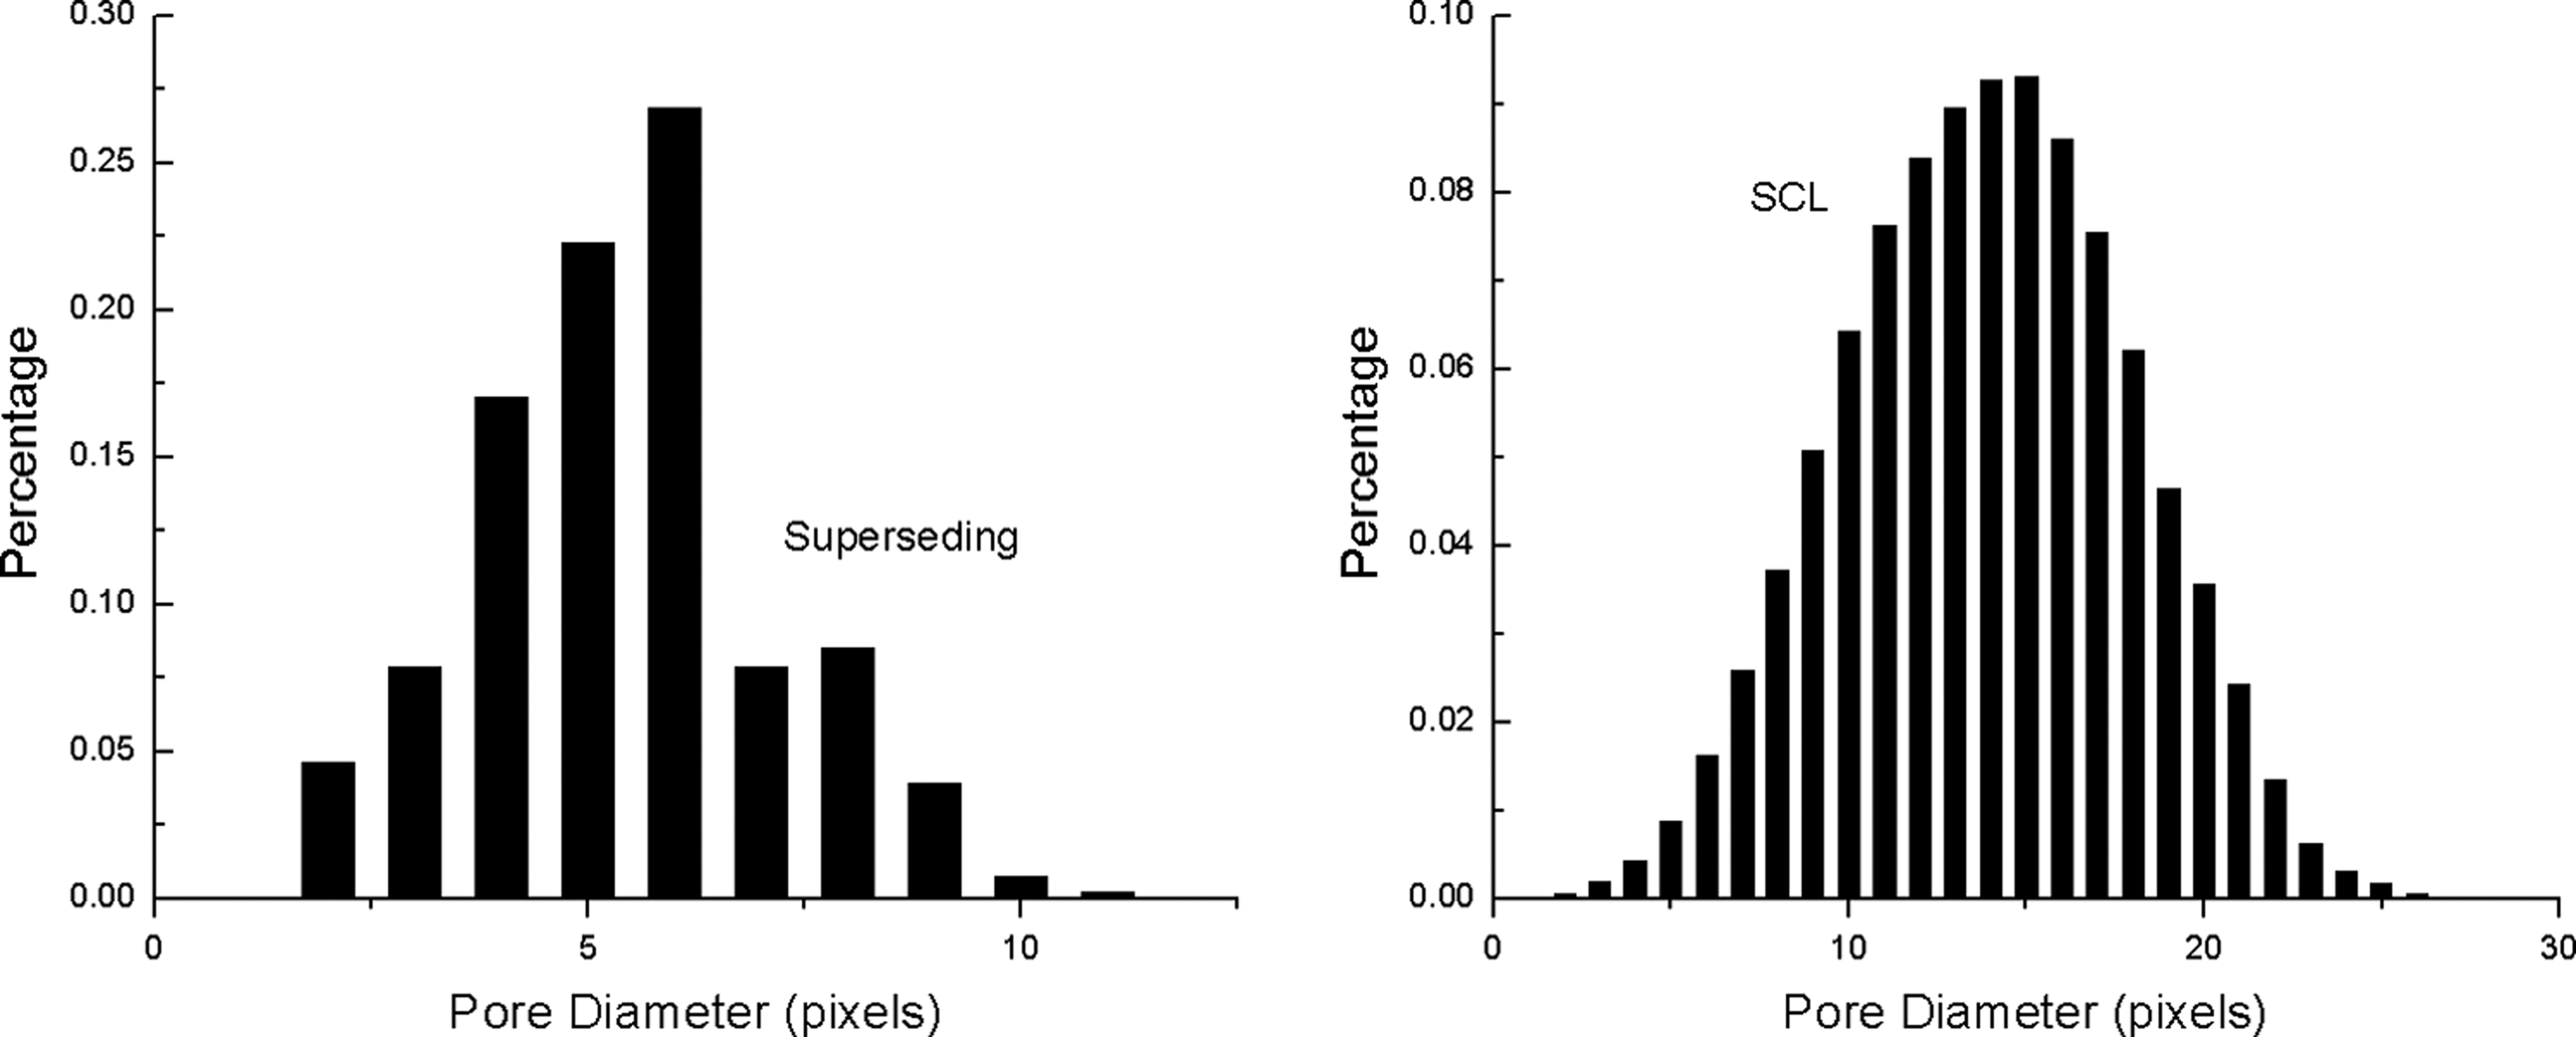
The histograms of the PSD obtained from the superseding algorithm and star cord length method for the pore phase of the 3D image shown in Figure 4.
Although we have presented the PSD from the local thickness and the SCL approaches, no qualitative comparisons can be made on their PSDs because no relationship exists between the definitions of pore size given by these two approaches. The proposed local thickness approach defines pore size as the lower limit because the pore size associated with a pixel is the shortest distance from the pixel to the boundary of pore space. However, from Equation (3), it can be seen that the SCL approach takes into account the orientation dependence of the pores, so the pore size obtained is the average value of the largest distance to the boundary—an upper limit. Also, if a medium has long, narrow, interconnected pore channels, the cord length in the long axis can skew the PSD. The PSD obtained from the SCL for the 2D image (Fig. 3D) is highly concentrated in larger pore diameters, whereas the PSD of the 3D image obtained from the SCL is as well distributed as the local thickness approach. This is attributed to the effect of 3D interconnectivity on the PSD.
We have also examined the sensitivity of the PSD results to the value of k presented in Equation (1). Figure 7 displays the variation of median pore size as a function of the k value. One can see that, when k is near unity, the median pore size reaches its maximum; the same trend is also observed for mean pore size (not shown in the figure). When k is less than unity, those pores associated with pixels along the boundary of the pore phase (with a radius of 1 pixel) cannot be eliminated during the superseding spheres process. These boundary pore–phase pixels with a radius of 1 pixel will contribute to the PSD and lower the median and mean pore size. Also, the skeleton of the pore phase will become thick (not a single component) in the pore space. When k is much greater than 1, a number of larger pores will be eliminated during the superseding spheres process. Consequently, the median and mean pore size will become lower, and the skeleton of the pore phase will become discrete. To obtain a realistic PSD and a skeleton with a single connected component in the pore space, theoretically, the k value should be equal to 1; however, we recommend that the k value chosen be equal to 1.01 because of the precision and truncation errors during computational processes.

The variations of median pore size with the k value present in eq. (1) for images shown in Figs. 2(a) and 4.
We also explored the sensitivity of the superseding spheres algorithm to pixilation and edge effects that become appreciable when image features are comparable with limitations in experimental data acquisition. Both effects are consequences of fitting maximal spheres to pore volume and are relevant to any of the widely used image analysis techniques that rely on this approach. 17
Pixelization is a problem whenever image contours are on the order of the experimental resolution. Its effect on the superseding representation of a single spherical void (40 pixels in diameter, embedded in a 100 × 100 × 100 pixel image) is shown in Figure 8. The number of superseding spheres generated by the algorithm to fill the void increases dramatically with pixelization (i.e., from 1 in the case of low pixilation (Fig. 8A) to well over 3000 in the most extreme case (Fig. 8D)). There are thousands of extra superseding spheres even in the case of minimal pixelization (Fig. 8B), and their diameters are always significantly smaller than the 5-pixel void diameter. Therefore, the distribution of superseding diameters in this case has essentially no relationship to the characteristics of the void. This shows why it is essential to carefully consider experimental image pixilation when using maximal spheres to estimate pore size. Pixelization, however, has little effect on the algorithm's ability to quantify other parameters such as pore volume.

Effect of image pixilation on superseding sphere representation of a single spherical void [(diameter = 40 pixels, location in image; (x,y,z) = (42,42,42)]. Plotted are the diameters of superseding spheres vs. their distance from the xz plane and inset are images of sphere cross-sections showing increasing pixilation from (
Image-edge effects set the lower size limit for the representative volume in the local thickness approach and arise from the restriction of superseding sphere centers to image pixels. This restriction prevents the spheres from completely filling partially imaged pores (Fig. 9) and can lead to the creation of superseding spheres at the image boundary that do not reflect the geometry of the imaged structure. If the volume of the partially imaged pores is comparable with the overall pore volume in the image, this can severely bias the PSD. We explored this using a mock image of a network of overlapping, hexagonally packed, spherical voids that were 5 pixels in diameter. The volume of the image (100 × 100 × 100 pixels) was considerably larger than the characteristic length scale of the system (i.e., the 5 pixel diameter of the voids), yet as Figure 10A shows, attempts by the algorithm to fit partially imaged pores at the image edge (the xz plane) resulted in more than 1000 anomalous superseding spheres. The PSD calculated from this representation (Fig. 10B) is clearly biased toward smaller pore size. When superseding spheres from the image edge are removed, however, the PSD is more Gaussian-like about the 5 pixel void diameter (Fig. 10C). Although eliminating all edge-superseding spheres removed the effect in this case, the only way to eliminate it with certainty is to ensure that the image volume is large enough so that the PSD does not vary if the volume is increased.
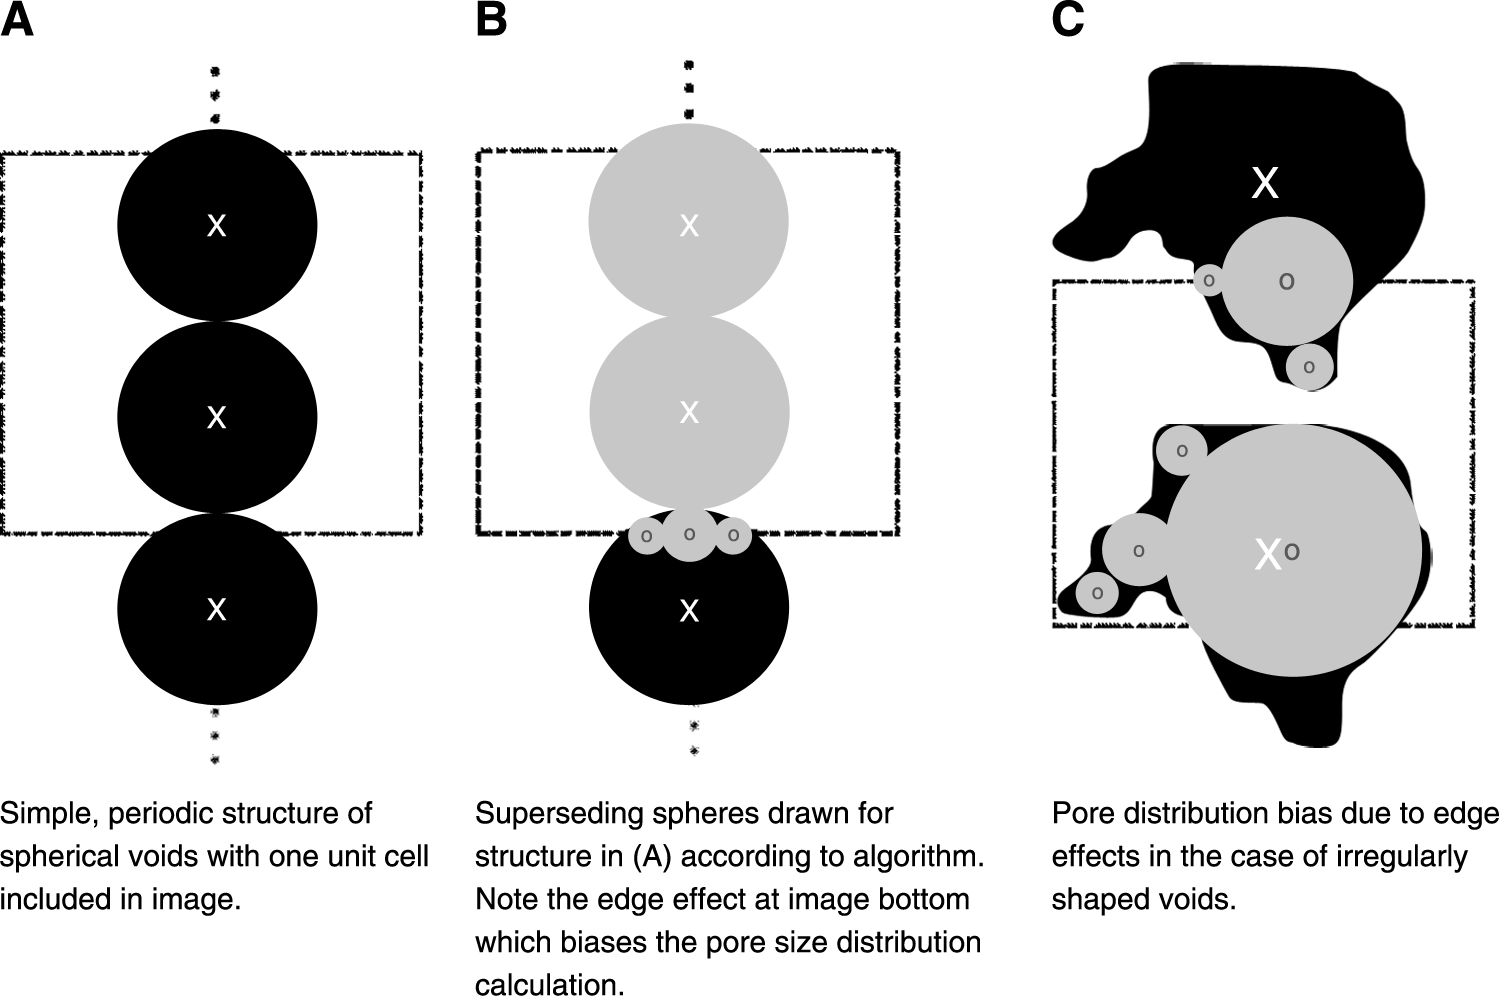
Origin of edges effects in the superseding algorithm. The edge effects arise from the restriction of the location of the center of superseding spheres to image pixels.

Edge effects in superseding representation of a hexagonally packed configuration of overlapping spherical voids (5 pixels in diameter) (
Finally, a far more rigorous test for the local thickness and the SCL approaches were carried out to evaluate a porous material with a high tortuosity and complex topology (such as tissue engineering scaffolds with many interconnected parallel pathways and junctions of multiple paths). In this case, the porous scaffold material was prepared in such a manner as to eliminate the water-soluble PEO component of the PCL/PEO blend and leave a porous PCL scaffold (Fig. 11). Using this process, five PCL scaffolds were prepared with mass ratios of PCL to PEO of 60:40, 55:45, 50:50, 45:55, and 40:60. Figure 12 compares the porosities measured according to gravimetric analysis of mass loss and analysis of the X-ray images with the theoretically expected porosity based on the initial charge and the assumption of 100% removal of the PEO fraction. It can be seen from this figure that, for PEO compositions from 45 to 65 mass%, the calculated porosities agree well with the expected porosities. However, at a porosity of 40 mass%, the calculated value was significantly lower than that expected because of the initial charge. It is likely that, when the fraction of the insoluble PCL in the blend becomes significantly greater than the fraction of the soluble PEO, the blend will cease being continuous. These isolated regions of PEO will not be removed during the soaking process and will remain in the scaffold to lower the measured porosity below the expected result. In addition, at the other end of the composition range, samples with very high loadings of PEO (>60–65%) were not characterized because of the poor mechanical integrity of the scaffolds.
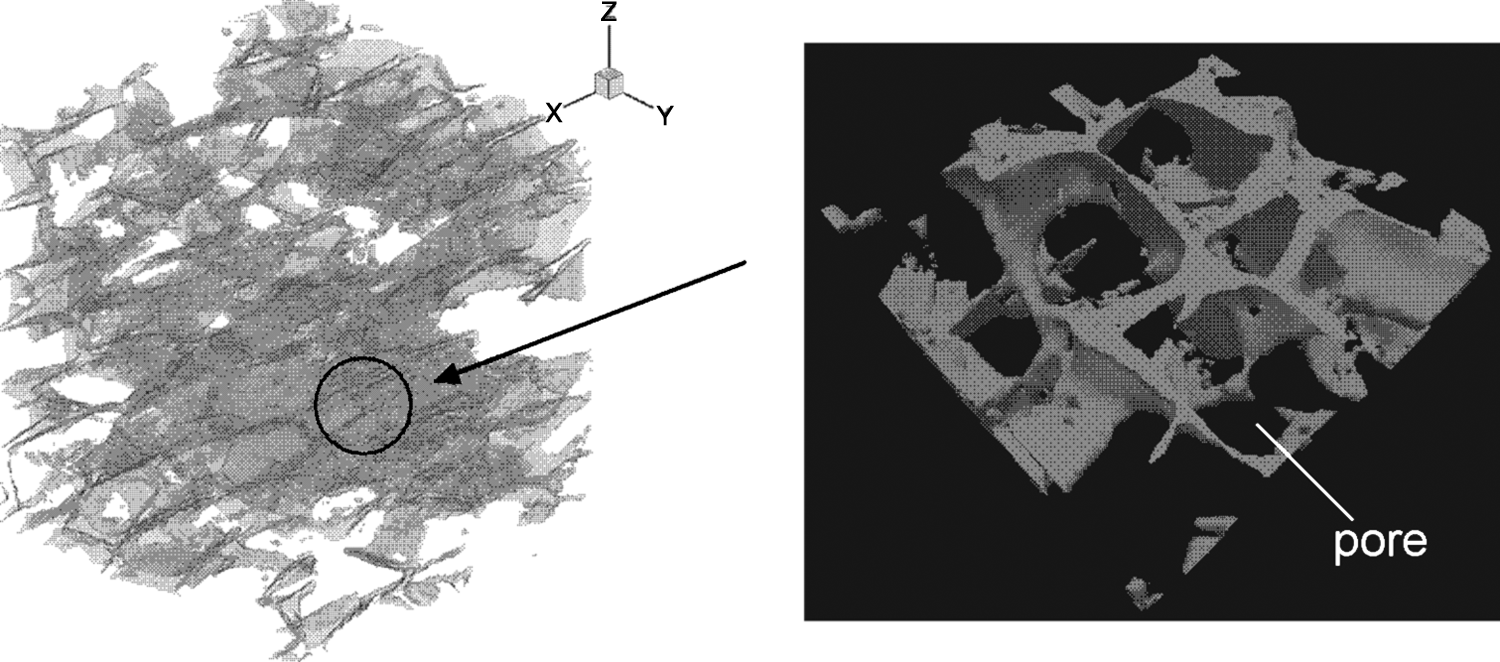
View of the porous phase of a real 3D porous medium.
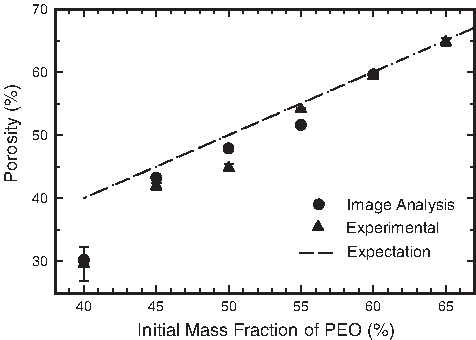
Porosity obtained from experimental measurement and image analysis as a function of initial mass fraction of the water-soluble PEO component of the PCL/PEO (polycaprolactone/poly (ethylene oxide)) blend.
Figure 13 shows that the average pore size obtained through the local thickness approach increases with increasing porosity and reaches an asymptote (based on a best curve fit) at larger porosities, whereas the pore size obtained through the SCL approach increases linearly with porosity. Also, the pore size from the SCL is much higher than that obtained from the local thickness approach except with low porosity (i.e., 28%). This trend is consistent with our findings on PSD in previous examples. When the porosity increases beyond a certain critical value, we believe that the interconnected scaffold pathways increase with increasing porosity, while the local thickness of the pathways remains a constant. However, the increase of junctions of multiple paths, which the decreasing pore tortuosity with increasing porosity can explain, dominates the chord length evaluated in the SCL approach, as shown in Figure 14. Tortuosity is defined as the ratio of effective path length to linear path length in random porous network, which will be further explained at the end of this section. For the scaffolds with porous networks with very low porosity (e.g., 28% in our study), the pore tortuosity increases, and pore size evaluated from the SCL seems very close to that from the local thickness approach. This is because, using the SCL approach, the higher tortuosity will cause chords emanating from a skeleton point in a pore to encounter a boundary rapidly and produce a shorter average chord length that is comparable with the local thickness of the pore space. The results shown in the Figures 13 and 14 suggest that increasing mean pore size causes decreasing tortuosity. A study of porous soil structure, 24 in which the PSD of the soil experimentally measured is linked to the connectivity and tortuosity of the pore network in three dimensions, also supports this argument.
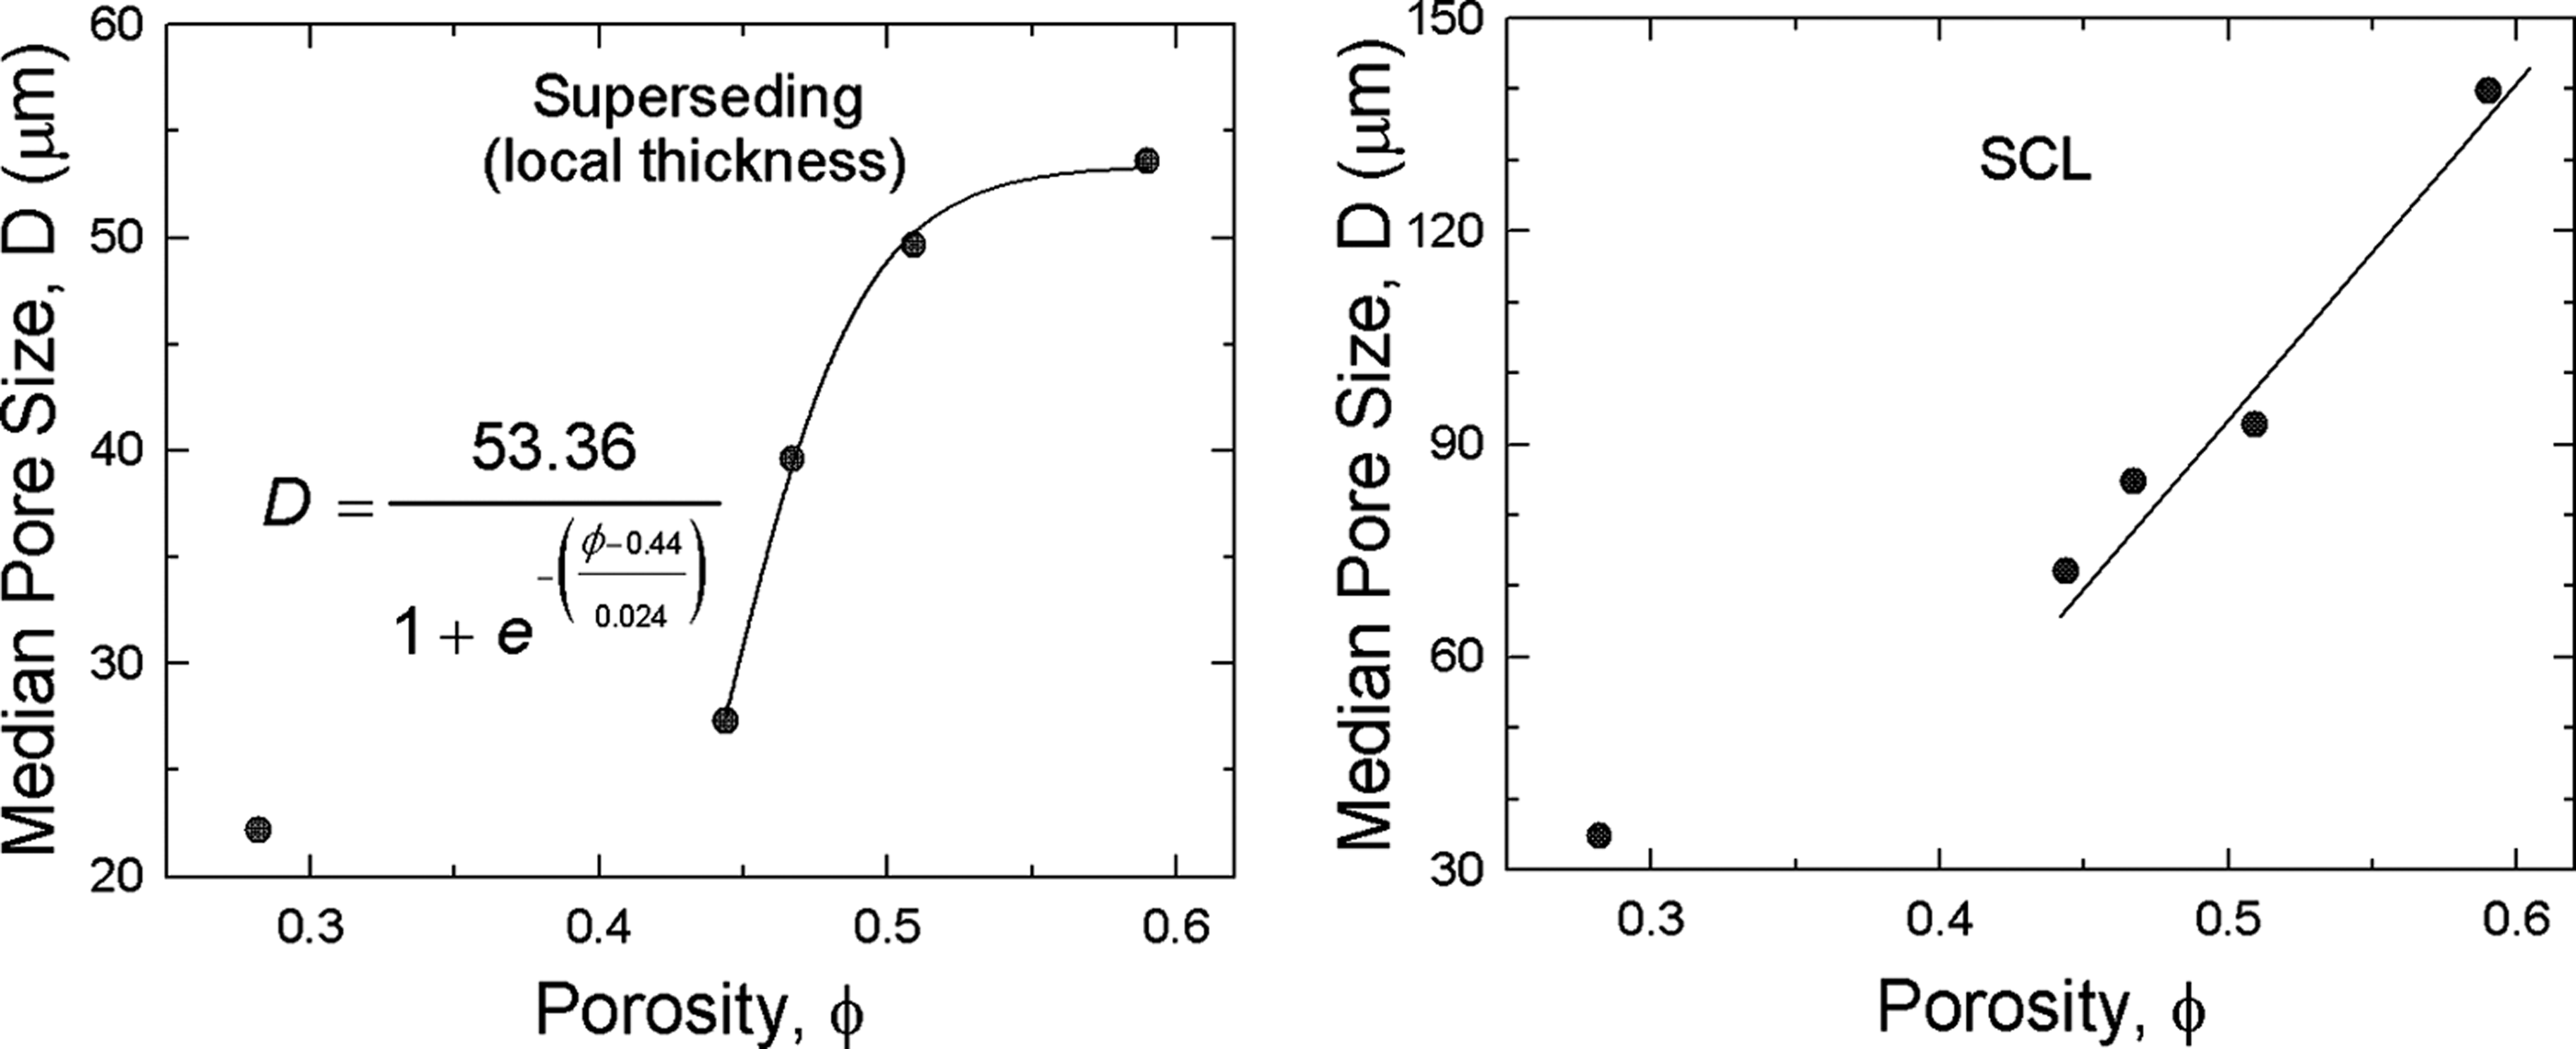
Pore size obtained using the superseding and the star chord length approaches as a function of porosity studied for PCL/PEO blend, For the superseding approach, the solid line is a best curve fit based on the inset equation, where D and ϕ are the median pore size and porosity, respectively.

Pore tortuosity of PCL scaffold against porosity. Tortuosity is calculated as the average ratio of effective porous path length to linear path length from three orthogonal directions of scaffold.
The characterization of flow of water, air, electricity, or elastic waves in porous media depends greatly on the tortuosity of pore space where the flow passes through. For example, tortuosity is an important parameter for the prediction of acoustical properties of porous sound-absorption materials. Also, tortuosity is a metric of interest for the scaffold microstructure in tissue engineering because it affects the scaffold permeability, which ultimately affects transport within the scaffold relating to oxygen and nutrient delivery, waste removal, protein transport, and cell migration. Conventionally, the definition of tortuosity is given as the ratio of the actual flow path length and the straight-line distance between inflow and outflow—a kinematical definition. We have developed a computer method for image analysis, based on a so-called burning algorithm, 25 to account for this kinematical definition and quantify the tortuosity of PCL scaffolds with different porosity shown in Figure 14 (see Appendix).
Conclusions
Extracting quantitative information of pore size from experiments or raw images is not trivial. One substantial reason for this is that, in most materials, such as tissue-engineered scaffolds, the pores have interconnected irregular shapes (rather than discrete voids), and definition of the pore for such media is inevitably subjective and vague. Consequently, the PSD depends highly on analytical techniques employed to interpret the experiment or image, and no qualitative comparisons can be made between them. As matter of fact, a decision must be made in selecting an approach to determine the PSD that can be best correlated with physical or chemical functions in their applications. In this study, based on the skeleton representation of a porous object, we have proposed two image-analysis approaches (local thickness and SCL) for PSD. The local thickness approach gives the local thickness of the pore object, which corresponds to a lower bound of PSD. The SCL approach considers the directional variation of the pore object (taking into account the anisotropy of pore object), which corresponds to an upper bound of PSD. Knowledge of the upper and lower bounds of PSD are essential because cell activity within a porous scaffold needs an optimal pore size or range.
Both approaches are geometry models and independent of analytical technique; no intermediate process for the skeletonization is needed (no mathematical morphology theory). The skeleton derived using the proposed superseding algorithm fulfils two essential requirements; it generates a medial axis and preserves the connectivity of the pore space. These two approaches can both be incorporated into a computer program without tedious and complex mathematical operations, and with the transparency of the proposed algorithms, users can obtain the lower and upper limits of PSD that are more practical and useful to the design of bioactive scaffolds. Also, through the PSD obtained from the proposed two approaches, the porous tortuosity of a medium can be inferred. In addition, through the superseding spheres process, the skeleton of the pore network can be constructed to deduce other microstructural properties that are useful in a large spectrum of applications.
Footnotes
Appendix
In principle, the burning algorithm “lights” a fire at one end of the microstructure, in the chosen phase, and lets the fire burn in that phase until there are no more pixels of that phase left unburned, at least ones that the fire can get to via nearest neighbor connections. The other side of the microstructure is then checked to see whether the fire reached there. If it did, then the chosen phase must be connected from one side to the other. If it did not, then the phase does not percolate. 21
We have used the aforementioned burning process to calculate the actual flow path, which can be illustrated using schematics shown in Figure A (appended). Figure A1 gives a two-dimensional (2D) porous object with size of 6x6 pixels, and we started by choosing the pixels in the pore space at one end of the system (inflow). Then, these pixels are burnt (in gray color, Fig. A2), and their surrounding neighbors that have the same phase are iteratively burnt (Fig. A3–A9). The burning process continues until there are no more accessible unburnt pixels.
From Figure A1, one can see that the fire reaches the opposite end of the microstructure with different burning steps for each pixel at the end. The tortuosity (τ) is defined as the ratio of effective path length to linear path length between inflow and outflow: