




Abstract
This study investigated the factors influencing the oxygen metabolism of aortic valve interstitial cells (VICs). Porcine VICs in cell suspension at different passages, and adhered to coverslips at different confluencies, as well as fresh porcine valve leaflets, were incubated in an oxygen respiration chamber at 37°C in Dulbecco's modified Eagle's medium. The consumption rates at different oxygen concentrations were evaluated based on the Michaelis-Menten equation, and the corresponding maximum consumption rate (Vmax) and the Michaelis-Menten equation constant Km were determined. In all cases, the oxygen consumption rate was relatively constant until the concentration dropped to 5% (v/v). The metabolic activity of VICs in terms of oxygen consumption was dependent upon their in vitro passage number and proliferation status. These findings will provide valuable input to the selection of VICs with respect to their age and proliferation status for tissue engineering applications, as well as important input parameters for developing computational models of oxygen transport and optimization of the bioreactor conditions for heart valve tissue engineering.
Introduction
Decellularized porcine aortic valve scaffolds are being investigated in valvular tissue engineering due to their anatomical similarity to the human equivalent. We have previously reported 3 that smooth muscle cells seeded onto decellularized leaflets attached onto and migrated into the acellular scaffold after 4 weeks in static culture. The migrating cells demonstrated a similar phenotype to the valve interstitial cells (VICs) in the natural leaflet, but the cell density was not comparable to that in the natural leaflet. This may have been attributed to the shortage of nutrient supply to the central regions of the tissue leading to low oxygen tension.
Significant effort has been invested in the investigation of the metabolic activity of different types of cells and tissues for various applications. Studies have concentrated on the oxygen consumption rate of cardiac muscle cells 2 and chondrocytes,4,5 energy utilization and supply during hypoxia for embryonic cardiac myocytes, 6 oxygen consumption and uptake of glucose in rat skin, 7 oxygen consumption characteristics of porcine hepatocytes, 8 and corneal oxygen uptake. 9 The importance of oxygen tension during the bioreactor culture of engineered cartilage constructs was demonstrated by Saini and Wick, 10 and the optimum oxygen concentration was found to be 7% by these authors. Mathematical modeling studies have also been performed to describe the strong interactions between oxygen tension and cell distribution in engineered cartilaginous tissue. 11
Computational modeling of nutrient transport and utilization can provide a relatively simple means to estimate and identify potential nutrient limitation. Such studies have been carried out on cartilage tissue,12,13 engineered heart tissue,14,15 valvular tissue, 16 and porous scaffolds for musculoskeletal tissue engineering. 17 However, the nutrient demands have been shown to vary over a large range for different cell types under different conditions. This indicates that to enable realistic and accurate predictions, the quantification of the oxygen metabolic activity for specified cell types is required.
VICs comprise the major population within the natural aortic valve leaflet and serve to maintain tissue structural integrity. The oxygen requirements of VICs, cultured under different conditions, have not been previously addressed. Previous computational modeling studies have assumed a constant oxygen consumption rate. 18 The aim of this study was to investigate the metabolism of oxygen by VICs under different culture conditions. The oxygen consumption of porcine VICs in suspension (cryopreserved and freshly isolated) and attached to coverslips at different passages, as well as the oxygen consumption of VICs in fresh leaflet tissue, was determined using a measurement system capable of detecting and recording the oxygen concentration in the culture medium.
Materials and Methods
Materials
Culture media and reagents
Porcine VICs were precultured in standard cell culture medium (Dulbecco's modified Eagle's medium [DMEM] without sodium pyruvate and phenol red from Invitrogen, Paisley, United Kingdom; 10938025) supplemented with 10% (v/v) fetal bovine serum (FBS), 100 U/mL streptomycin, 100 mg/mL penicillin, and 10 mM/L glutamine. During the experiments, transport medium (standard culture medium supplemented with 25 mM HEPES buffer solution; Invitrogen) was used to maintain the physiological conditions. Leaflet tissue was digested in standard culture medium supplemented with 1 mg/mL collagenase II (Invitrogen). Zero-oxygen solution was prepared with 4% (v/v) sodium sulfite in distilled water.
Measurement setup
The oxygen consumption measurement system included a water-jacketed chamber (RC350; Strathkelvin Instruments, Glasgow, UK) sealed by a tight-fitting, gas-tight holder into which a Clark-type electrode was inserted (Fig. 1) and a 782 oxygen meter to record the oxygen tension continuously. During measurement, the medium was stirred using a magnetic stirrer to ensure a uniform dissolved oxygen tension. The whole system was maintained at 37°C by a circulating water bath. Parafilm was used to seal the top of the holder during the measurement procedure. Before the experiments, an initial two-point calibration was performed with zero-oxygen solution (0%) and air-saturated transport medium (21%).

Schematic diagram of the oxygen measurement apparatus.
Measurement of oxygen consumption rate
Cell suspension
Cryopreserved VICs were isolated from fresh porcine aortic valve leaflets and expanded to passage 3. The cells were suspended in cryo-medium (50% (v/v) FBS (Biosera 54687), 10% (v/v) dimethyl sulfoxide (Sigma-Aldrich, Dorset, United Kingdom, D2650), and 40% (v/v) DMEM (Invitrogen 10938025)), and stored in liquid nitrogen for future use. Before experiments, the cryopreserved cells were resurrected and cultured in standard culture medium. The cryopreserved cells were fed every 2 days and subcultured at approximately 70% confluence. In this study, cells at P5 (∼50% or ∼100% confluent) and at P10 (∼50% confluent) were used. The cryopreserved cells were trypsinized, pelleted by centrifugation, resuspended in transport medium, and counted in a hemocytometer. Subsequently, 2 mL of cell suspension (∼3 × 10⁶ cells/mL) was transferred into the respiration chamber. The chamber was then sealed, and the oxygen tension in the chamber was continuously recorded until it dropped approximately to zero. At the cell densities used, the oxygen tension dropped to zero within ∼1.5 h. At the end of the experiment, the cell suspension was removed from the chamber, the pH was measured to ensure that it remained at about 7.4, and cell viability was evaluated by Trypan blue dye exclusion.
Fresh-VICs were isolated from fresh porcine valve leaflets, and directly expanded to passage 5 at a confluence level of 50% without cryopreservation. The oxygen consumption measurement followed exactly the same procedure as described above for cryopreserved cells.
Fresh tissue
Sample preparation: Freshly harvested porcine aortic valve leaflets were dissected within 3–4 h of slaughter. Both surfaces of the leaflets were gently scraped with a sterile scalpel blade to remove the endothelial cell lining. In addition, the basal area of the leaflets was removed to exclude the endothelial cells of any vasculature present in the region. 19 Subsequently, the leaflets were rinsed in sterile Hanks balanced salts solution (HBSS, Ca2+/Mg2+, Sigma-Aldrich), and three 5-mm-diameter tissue discs were dissected from each leaflet using a biopsy punch. The whole procedure was carried out aseptically.
Oxygen uptake rate measurement: Nine leaflet tissue discs, dissected from the same aortic valve, were transferred into the respiration chamber, 2 mL of transport medium was added, and the chamber was sealed. The oxygen tension in the chamber was continuously recorded until it dropped to zero.
VICs isolation and cell counting: After the oxygen consumption measurement in the respiration chamber, the samples were removed and finely chopped into small pieces (∼1 mm2) under a minimal volume of culture medium. The chopped tissue was transferred into a sterile universal and incubated in 8 mL sterile collagenase II solution (1 mg/mL [w/v] collagenase in DMEM) at 37°C with gentle agitation. After 3–4 h, all tissue pieces were digested. The contents of the universal were pipetted up and down for 1–2 min, and centrifuged twice at 200 g for 10 min to pellet the cells. The cell pellet was resuspended in 1 mL culture medium, and the cell number and viability were determined after Trypan blue staining.
Cells attached to coverslips
Cell seeding on coverslips: Fourteen coverslips with 1 cm diameter were pretreated with FBS at 2–8°C for 24 h. 20 The pretreated coverslips were washed with culture medium and transferred into a nontreated Petri dish. The coverslips were seeded with 10 mL of VICs suspension (the VICs were freshly isolated cells [passage 4] suspended at 2 × 10⁵ cells/mL in standard culture medium) per Petri dish and incubated in 5% (v/v) CO2 in air at 37°C. The medium was renewed at 24 h. The cells on the coverslips reached confluence after ∼48 h.
Oxygen uptake rate measurement: After 48-h incubation, 10 out of the 14 cell-seeded coverslips were carefully transferred into a bespoke holder (Fig. 2). The holder with the coverslips was inserted into the respiration chamber that was filled with 2.5 mL of transport medium. The chamber was then sealed, and recording commenced. After 10 min the recording was stopped and the pH of the culture medium was measured to ensure that it was within the physiological range (7.2–7.4). The recording time of 10 min was short to minimize cell disturbance from the shear stress caused by the stirred medium.
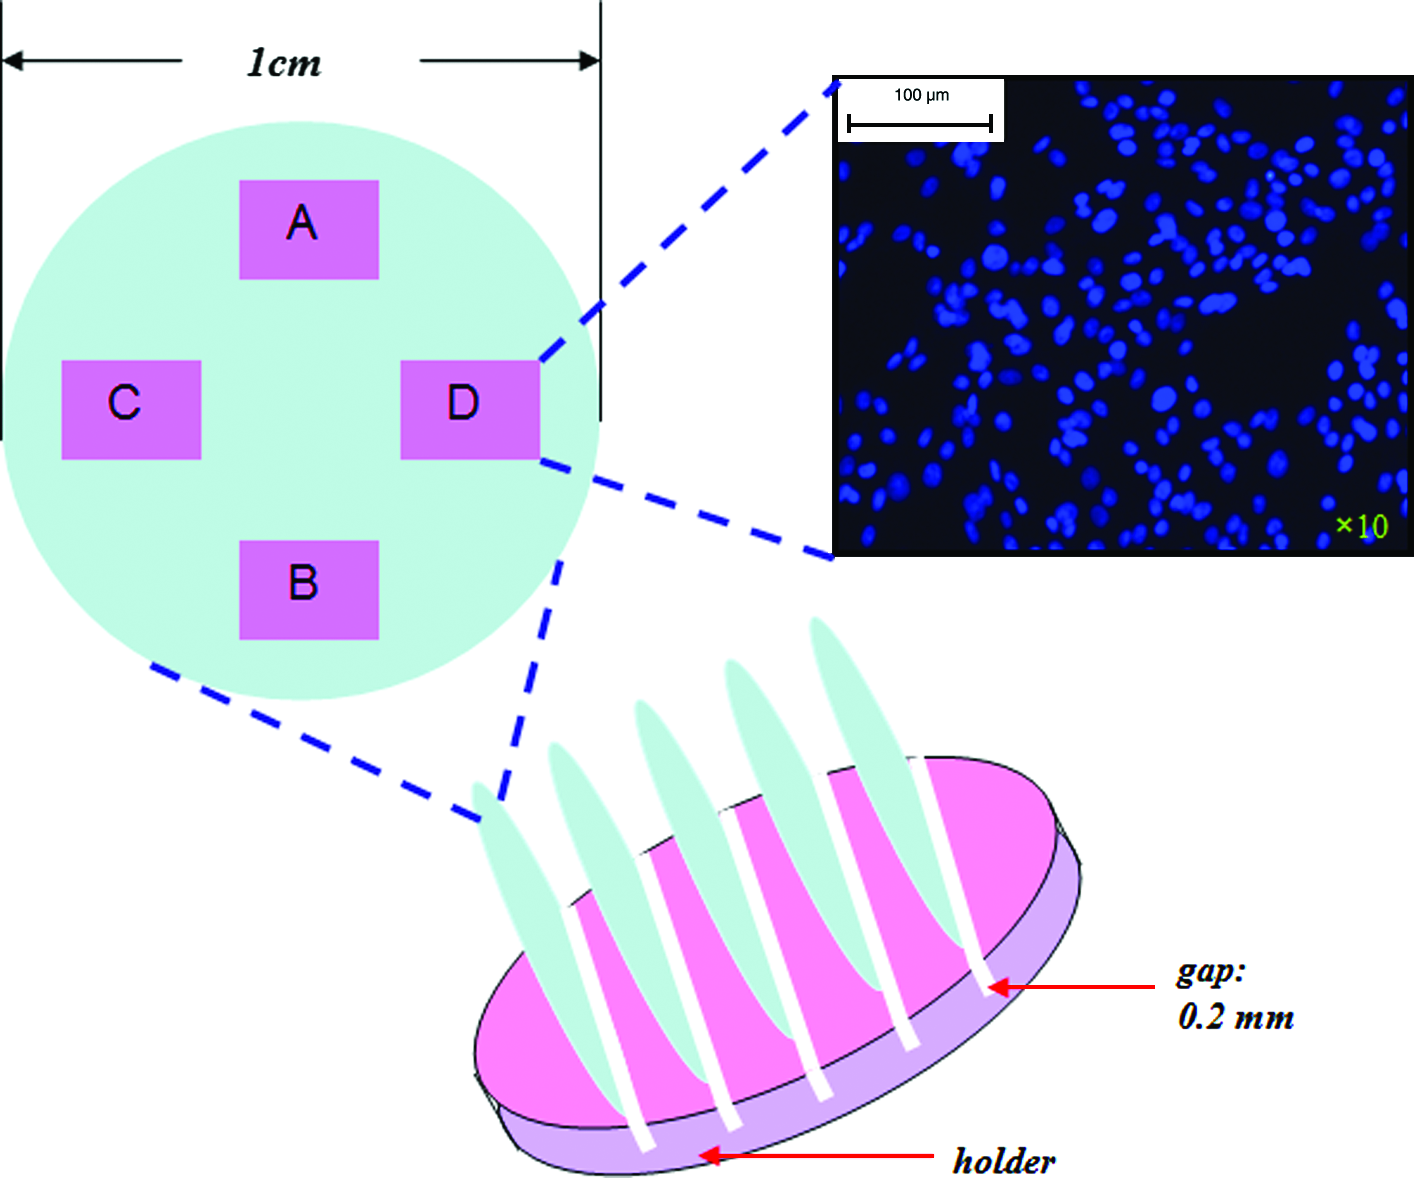
Schematic diagram showing the coverslips mounted onto the bespoke holder and the four regions on the coverslips used to count the cells after Hoechst staining. Four areas were counted for each of the four coverslips. Color images available online at
Cell counting: The four remaining cell-seeded coverslips were used to determine the cell density on the coverslips. Each of the four coverslips was transferred into a well of a six-well plate and incubated with Hoechst stain (Hoechst 33258 dye buffer at 1 μL/mL (v/v); Invitrogen) for 1 h. After staining, each section was mounted with a glass cover slip using DABCO:glycerol (Sigma-Aldrich) and viewed under a DAPI filter using an ultraviolet microscope (Olympus, Essex, United Kingdom, optical BX51). Micrographs from four regions of each coverslip were selected to determine the cell density (Fig. 2). The Hoechst stain provided a reliable method of estimating the number of cells because these could be counted in situ and there were difficulties in handling the coverslips without causing the detachment of a proportion of the cells.
Calculation of oxygen consumption rate based on oxygen concentration profiles
The oxygen consumption rate of VICs was assumed to follow the Michaelis-Menten (M-M) equation:
Eqn. 2 indicates that 1/v was linearly proportional to 1/C. Therefore, linear regression could be used to estimate Km and Vmax from 1/v against 1/C plots.
Oxygen profile prediction for one-dimensional model using the finite difference numerical method
The variable consumption rate estimated by Eqn. 1 was subsequently used to predict oxygen concentration using a computational method. In the present modeling, the experimentally obtained consumption rate for the freshly isolated cells in suspension was chosen instead of that for fresh tissue; the reason for this is explained later on in Discussion. The use of a variable consumption rate would enable a direct comparison with a previous study in which a constant consumption rate was assumed.
18
According to Fick's law, the one-dimensional oxygen diffusion is given by:
Statistical analysis
Data for the maximum oxygen consumption rate of different VICs (n = 4) were compared by one-way ANOVA. Individual differences between group means were subsequently determined using the t-method to determine the minimum significant difference (p < 0.05).
Results
Oxygen consumption rate in cell suspension
The measured oxygen consumption rates for cryopreserved and freshly isolated VICs at different passages and confluency are shown in Fig. 3. The experimental data were fitted with the M-M equation to determine Vmax and Km. For the cryopreserved VICs at P5 and 50% confluence (C-5/50) Vmax was calculated to be 99.75 nmol/106 cells/h and the Km was 0.35%. For all cases considered, the oxygen consumption rate was relatively constant and independent of oxygen concentration until it dropped below ∼5%. pH value of the culture medium was measured to be within the physiological range with no detrimental effect on cell viability.

Four examples of oxygen consumption rate as a function of oxygen concentration. The plots correspond to the experimental measurements recorded during testing of VICs derived from four porcine aortic valves, at different passages and confluence levels. The M-M equation was fitted to the experimental results (solid line). Vmax and Km were determined for each individual experiment. C-5/50, cryo-preserved VICs at passage 5 and 50% confluence; C-5/100, cryo-preserved VICs at passage 5 and 100% confluence; C-10/50, cryo-preserved VICs at passage 10 and 50% confluence; F-5/50, fresh VICs at passage 5 and 50% confluence. Color images available online at
Factors affecting oxygen consumption rate
The Vmax values for VICs tested are presented in Fig. 4. Although a decreasing trend was observed for the Vmax of cryopreserved cells with increasing passage number and increasing level of confluency, the differences were not significant (p > 0.05). Similarly, the Vmax of freshly isolated VICs showed a trend toward a higher Vmax compared to the cryopreserved cells; however, no statistical significance was observed (p > 0.05). In addition, the Vmax obtained for the fresh tissue was also higher than that of the freshly isolated cells in suspension. However, the difference was also not significant (p > 0.05). The Vmax of VICs seeded on coverslips was found to be the highest compared to all other cases. The Vmax of cells seeded on coverslips was determined at different levels of confluency, and it was evident that the Vmax of coverslip-cultured cells was highly dependent upon cell density. Cell density on the coverslips was therefore expressed as a percentage of confluent cell density (100%; 2.28 [ ± 0.2] × 103 cells/mm2 [n = 7]), and the relationship between the normalized cell density and oxygen consumption rate is demonstrated in Fig. 5.
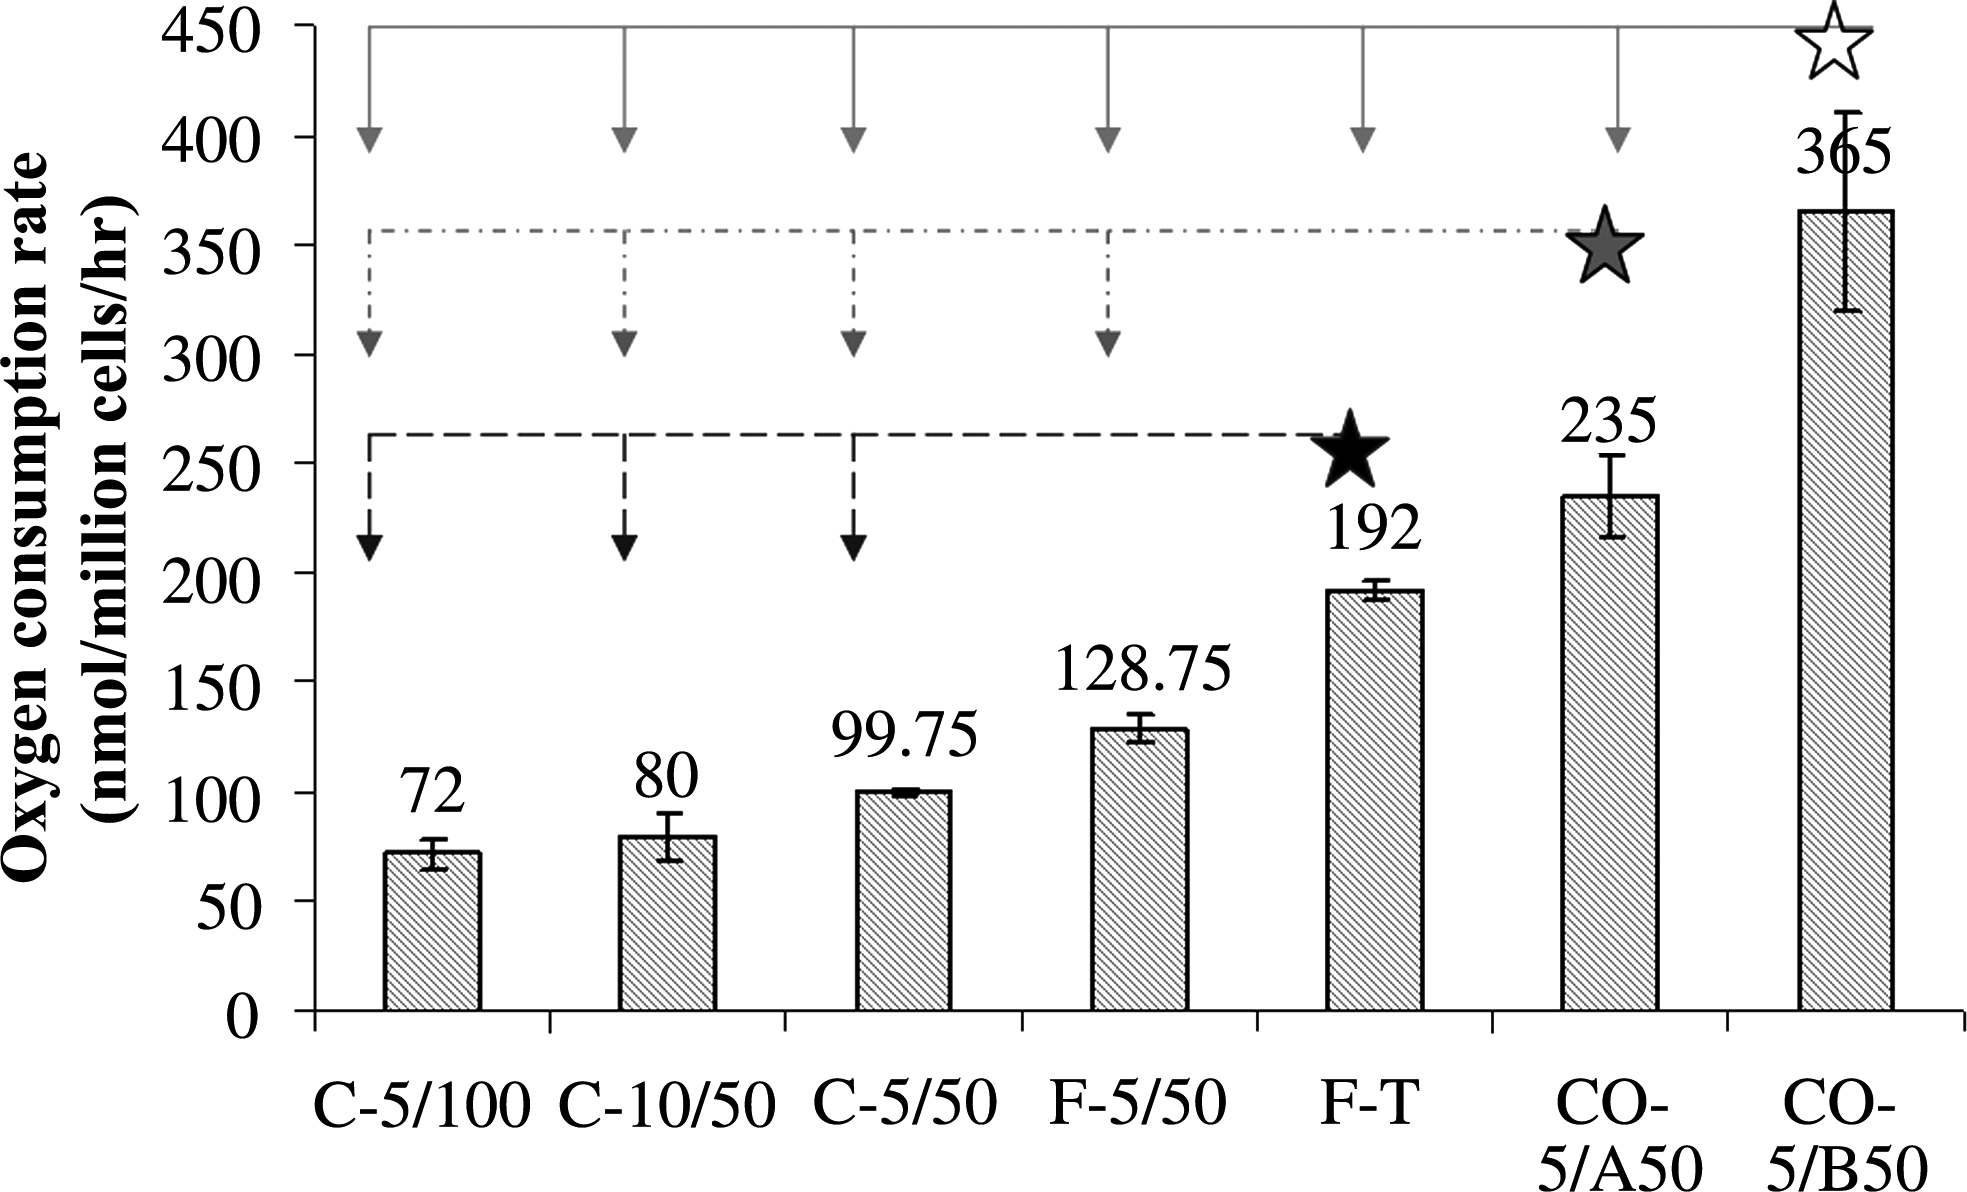
Comparisons of measured maximum oxygen consumption rate of porcine VICs under different culture conditions, results are mean ± standard error of four independent determinations (minimum significant difference (MSD) = 89.3 for α = 0.5 from one-way ANOVA analysis). C-5/100, cryo-preserved VICs at passage 5 and 100% confluence; C-10/50, cryo-preserved VICs at passage 10 and 50% confluence; C-5/50, cryo-preserved VICs at passage 5 and 50% confluence; F-5/50, fresh VICs at passage 5 and 50% confluence; F-T, fresh valve tissue; CO-5/A50, VICs on coverslips at passage 5 and above 50% of normalized cell density; CO-5/B50, VICs on coverslips at passage 5 and below 50% of normalized cell density.

Dependence of measured oxygen consumption rate on the normalized cell density (n = 7), example pictures of cells on coverslip at a density of 43% and 93%. Color images available online at
Effect of tissue thickness, cell density, and oxygen consumption rate on the one-dimensional oxygen diffusion model
The normal porcine aortic valve leaflet has a thickness in the range of 0.4–1.4 mm for the same cusp according to our previous study, 18 which gives the oxygen diffusion distance in the range of 0.2–0.7 mm. For a thickness of 0.7 mm, the predicted minimum oxygen tension was found to be close to zero, 18 and therefore the thickness for the computational model was chosen between 0.4 and 0.7 mm with diffusion distance in range of 0.2–0.35 mm in this study. The measured oxygen consumption rate as a function of oxygen concentration was used to investigate the effect of leaflet thickness on the oxygen transport, and the effect of variable consumption rate versus constant consumption rate used in previous studies. 18 The predicted oxygen concentration (%) along the direction of the leaflet thickness was calculated using the oxygen consumption rate (Vo2 in Eqn. 4) (Fig. 6). For comparison, the oxygen profile along the leaflet thickness was also calculated using a constant oxygen consumption rate (V in Eqn. 3). The effect of different thickness was also investigated for both cases.

Comparison of predicted oxygen concentration for M-M fitted consumption rate with constant consumption rate for the same thickness and the effect of M-M fitted consumption rate with the changing of thickness.
As indicated in Fig. 5, the oxygen demand per cell decreased with the increasing cell density. However, the oxygen metabolism of individual cells may not fully represent the global oxygen demand of the tissue. To investigate the effect of cell density on the total oxygen consumption rate of a given volume of tissue, four points (specified in Table 1) with an increasing trend of cell density from the fitted curve of Fig. 5 were taken into consideration at different cell densities, and the corresponding oxygen consumption rates were calculated (Table 1). It should be noted that the consumption rates of the cells on the coverslips (Fig. 5) were employed in the modeling to simulate the different proliferation rates experienced by the cells during the seeding and subsequent colonization of 3D scaffolds in a tissue engineering application.
It was possible to investigate the effect of cell density on the predicted minimum oxygen concentration in the center of the tissue. A unit of tissue was chosen with a thickness of 0.7 mm based on our previous measurement. 18 The total oxygen demand of this tissue was calculated with respect to varied cell density and the corresponding oxygen consumption rate, followed by prediction of the minimum oxygen concentration of the tissue for each cell density (Table 1). It was clearly demonstrated that although cellular oxygen utilization decreased with increased total cell density for a given volume of tissue, the overall oxygen consumption for the tissue increased.
Discussion
This is the first study, to the knowledge of the authors, that has measured the oxygen consumption rates of VICs in suspension at different passage numbers and confluence levels, and attached to coverslips. Warnock et al. 25 considered the porcine aortic valve together with the aortic root and sinus region, and measured the oxygen consumption rate as 1.03 × 10⁻⁴ mg O2/g tissue/s. It is interesting to compare this value with 0.32 × 10⁻⁴ mg O2/g tissue/s obtained from the present study for VICs within three-dimensional tissue. The M-M equation was used to characterize the oxygen consumption rate as a function of oxygen concentration, and by means of Vmax and Km. Above results provided a fundamental understanding of the important interplay between the factors that influenced the oxygen uptake rate of VICs. Moreover, the oxygen consumption rate determined in the present study is essential for computational modeling to predict realistic oxygen distributions within the valve leaflet. 18
Similar to other cell types, such as chondrocytes in articular cartilage, 4 the M-M equation was able to adequately describe the measured oxygen consumption rate of VICs. The results from the present study indicated that the oxygen consumption rate was fairly constant and independent of oxygen tension until the concentration dropped below 5%. This finding was consistent with the behavior of articular cartilage chondrocytes reported by Zhou et al. 4 Although the differences between cells at various passage numbers and confluence levels were not statistically significant, there was a trend of a decrease in the consumption rate for cells at higher passage numbers, greater confluency, and prolonged in vitro culture periods. This has important implications for tissue engineering, because such reduced oxygen requirements during the later stages of tissue-engineered construct development, when the cells have been established in the extracellular matrix (ECM), would affect the global oxygen demand.
The oxygen consumption rate reflects the metabolic activity of cells. The present study demonstrated that the oxygen consumption rate for VICs was largely dependent on the interaction between the cells and the surrounding physical environment. VICs cultured to confluency consumed less oxygen than the VICs harvested before reaching confluence. In addition, cells at a higher passage number consumed less oxygen compared to those at a lower passage number. Further, freshly isolated cells consumed significantly more oxygen than cryopreserved cells. Cells attached to coverslips consumed significantly more oxygen than cells within the three-dimensional tissue. This might be explained by the relative inactivity of cells within a tissue compared to cells on coverslips that would need to take up more oxygen to sustain their proliferating phenotype. The significant difference between the oxygen consumption rate of subconfluent and confluent cells on coverslips indicated that contact inhibition affected oxygen metabolism in monolayer cultures. The typical oxygen consumption rate reported by Weind et al. 22 for VICs was 3.05 × 10⁻⁵ mL O2/mL tissue/s or 130 nmol/106 cells/h, and this was in close agreement with the corresponding values obtained for fresh valve tissue in the present study (∼200 nmol/106 cells/h) and even closer to that for fresh isolated cells in suspension (∼128 nmol/106 cells/h). Therefore, the oxygen consumption rate of the freshly isolated cells in suspension rather than the consumption rate of fresh tissue was used in the present computational model. This decision was influenced by the short time period of 10 min for the experimental measurement of the fresh tissue to ensure that the oxygen concentration within the chamber did not fall below 10%, and it was not possible to determine the M-M constant Km. The dependence of the consumption rate on oxygen concentration for VICs was also consistent with that of chondrocytes reported by Zhou et al. 4 However, the consumption rate for chondrocytes was much lower, because these cells tend to consume less oxygen and can still function well under hypoxic conditions.
Constant oxygen consumption rates have been used in previous computational studies of oxygen diffusion in aortic valve leaflets. 18 The variable oxygen consumption rate for the VICs as a function of oxygen tension measured in the present study was used to validate the assumption of a constant consumption rate. The minimum oxygen tension was predicted to occur in the center of the tissue thickness as expected. Moreover, the thinner the tissue was, the higher the predicted minimum oxygen tension became. The oxygen consumption of the cells became oxygen tension dependent when the tension dropped below 5% (Fig. 3). When such a variable consumption rate was prescribed, the difference of the predicted PO2 was negligible for a total leaflet thickness of both 0.4 and 0.5 mm, because the predicted minimum PO2 was above 5% for both cases. When the leaflet thickness was increased to 0.7 mm, the predicted minimum PO2 became 1.79% and 0.53% for the variable and constant consumption rates, respectively, although the overall agreement of the predicted oxygen tension was still reasonable. The predicted oxygen tension was underestimated for the assumption of a constant consumption rate, particularly at the minimum value and for thicker leaflets. Further, in a previous study, 18 the consumption rate was assumed to be zero once the predicted oxygen tension dropped below 1%, and therefore the difference between the two assumptions would be reduced even further. Hence, in oxygen transport modeling involving oxygen consumption rate, the two choices of consumption rate need to be made carefully to balance the accuracy and the simplicity.
The cell density affected the oxygen consumption rate of cells cultured in a monolayer (Fig. 5). Compared with cells at 93% of the normalized density, cells at 43% were more active and required more oxygen for proliferation. It was shown that the cellular oxygen consumption rate decreased with increasing cell density. However, the overall oxygen demand followed the same trend with the total cell number for a fixed volume of tissue. A key challenge in tissue engineering is the inhomogeneous spatial distribution of cells and/or ECM, which can restrict the transport of nutrients or removal of waste products.26,27 During the initial stage of the culture of a tissue-engineered construct, nutrients will be available to cells in the peripheral region of the scaffold, and cells will proliferate and migrate into the scaffold. As the ECM is laid down, the developing tissue at the periphery will consume most of the diffusible nutrients. This would consequently reduce the transport diffusivity and permeability, subsequently leading to a lower ECM content with insufficient nutrient supply in the central area.
Indeed, the proliferation state of the cells affects their oxygen consumption, whereas higher proliferation rates impose higher energy demand to the cells. Moreover, the majority of cells in native, steady-state 3D tissues do not proliferate. However, in cell-seeded 3D scaffolds the cells are not at their normal, nonproliferating state. In fact, during cell colonization of a 3D scaffold, the cells experience a series of different proliferation states from when they are first seeded onto the scaffold until they have fully colonized the scaffold, reaching the nature proliferation state of cells in the native mature tissue. By measuring the oxygen consumption of cells at different levels of confluency on the coverslips, corresponding to different proliferation states, the intention was to simulate the different proliferation rates experienced by the cells during the seeding and subsequent colonization of 3D tissue engineering scaffolds.
There are a number of limitations in the present study that need to be addressed both experimentally and computationally. With regard to the experimental methodology, gas exchange between the outside and inside of the chamber could contribute to the underestimation of the oxygen consumption. Although cell viability was determined to be above 95% after each experiment, the cell number determined for the tissue may have been underestimated. The percentage of dead cells was determined by Trypan blue at the end of the experiment; however, some cells may have died during the measurement and some during the tissue digestion. The number of viable cells was therefore employed when calculating the oxygen consumption rate of the tissue. Moreover, for the fresh tissue, only the oxygen concentration in the medium surrounding the tissue was measured, rather than inside it. The corresponding oxygen consumption was calculated based on the total number of cells estimated within the tissue. Such an approach may have underestimated the maximum oxygen consumption rate. On the other hand, the cells on the boundary of the punched tissues may have been activated, resulting in increased oxygen uptake, which would contribute to the overestimation. The amount of shear stress produced upon stirring of the medium was not calculated because this was a comparative study. As such, all three experiments were carried out under the same conditions. Low-level stirring was deemed necessary to achieve effective mixing of the culture medium, without producing any visible vortices in the medium that would cause significant disturbance to the cells. However, shear stress may have had an effect on the metabolic activity of the cells and may have caused some deviation of the absolute oxygen consumption rates, but this would have been consistent throughout the experiments. In addition, as indicated by Hoechst staining after the oxygen consumption experiments, less than 5% of the cells were found to be detached from the coverslips, indicating a minimal effect of shear stress on cell detachment. With regard to the modeling, one of the essential diffusion parameters—diffusivity of oxygen inside the valve tissue—was adopted from the literature, and the variation of this parameter among different species with individual cell density was neglected. Hence, the investigation of cell density–dependent oxygen diffusivity would be more appropriate for the prediction of oxygen distribution in valve leaflet model.
The results of this study should be treated with caution, particularly when applied to tissue engineering. In general, the changes in oxygen consumption rate depend largely on the energy required for cells, and the oxygen requirements will be different at different stages of cell growth, proliferation, assimilation, and maintenance. Attempts were made to focus on the VICs during the quiescent phase of the cell cycle (i.e., confluent cells and in fresh tissues). It would be interesting to determine the minimum oxygen concentration at which maximum growth rate can be maintained. Such a consideration will be important for the optimization of a tissue engineering bioreactor in which cell proliferation is important for scaffold population.
Despite these limitations, a general methodology has been developed to successfully quantify the oxygen uptake rate for cells and tissue. Such a methodology would be expected to be applicable to any other cell types or tissues. This will also allow further investigation of other nutrient requirements for tissue-engineered constructs. Moreover, further application of the quantification of the oxygen metabolism to cell-seeded tissue-engineered valves would provide an important insight into the biological status (active/inactive) of the cells seeded into the scaffold. It would also allow the optimization of oxygen supply in bioreactor design and operation.
In conclusion, the oxygen consumption rate for the VICs was found to be constant when the oxygen tension was above 5%, followed by a sharp drop for lower tensions. The maximum oxygen consumption rates were found to be highly dependent on the model system (cell suspension, coverslip, or tissue pieces). The maximum oxygen consumption was found to be 365 ± 45 (nmol/106 cells/h) for cells attached to coverslips and was reduced to 72 ± 7 (nmol/106 cells/h) for cells in suspension. The employment of the constant consumption rate led to a general underestimate of the oxygen concentration in the computational modeling, particularly for thicker leaflet models. Based on the sensitivity analysis in the present study, it was shown that a constant consumption rate could be used in the computational modeling of oxygen distribution in three-dimensional natural or engineered valve leaflets.
Footnotes
Acknowledgments
The authors would like to acknowledge Dr. Zhou Shengda (Oxford University), Dr. Helen Berry (Tissue Regenix), and Dr. Thomas Stapleton for their kind and endless support with the experimental study, as well as Mr. Phillip Wood for technical assistance. This work was supported by the Overseas Research Students Awards Scheme and the Engineering and Physical Sciences Research Council.
Disclosure Statement
No competing financial interests exist.