
Abstract
Distinguishing between implanted and host-derived cells, as well as cells of different phenotypes, is important in determining mechanisms of cell-based repair of cartilage. The objectives of this study were to assess the utility of carboxyfluorescein diacetate, succinimidyl ester (“CFDA, SE” or CFSE) for tracking chondrocytes from superficial (S) and middle (M) zones and their proliferation, and to determine the effects of CFSE on the chondrocyte functions, proliferation, and synthesis of proteoglycan 4 (PRG4) and glycosaminoglycan (GAG). CFSE-labeled and unlabeled S and M zone chondrocytes were plated in either low- or high-density (10,000 or 200,000 cells/cm2) monolayer, incubated, and analyzed on days 1 and 7. Cell suspensions were analyzed for retention of CFSE by flow cytometry and fluorescence microscopy and for cell proliferation by assay for DNA and GAG. Cultures were also analyzed for newly synthesized PRG4. Deconvolution of flow cytometric histograms was done to determine the number of cells in each doubling generation. Most chondrocytes were labeled consistently and intensely labeled with CFSE through 10 cycles of division. At day 7 of culture, approximately 95% of S and M zone cells seeded at high density could be distinguished as fluorescent. Chondrocyte proliferation and synthesis of PRG4 were unaffected by cell labeling, while GAG synthesis was slightly diminished. CFSE may be useful in determining the fate and function of implanted chondrocytes in vivo.
Introduction
Tracking methods using fluorescent dyes have been implemented to localize and determine retention implanted cells. Most fluorescent cytoplasmic dyes [(CellTracker™, Invitrogen/Molecular Probes, Carlsbad, CA) Green CMFDA (5-chloromethylfluorescein diacetate), CellTracker Orange CMTMR (5-(and-6)-(((4-chloromethyl)benzoyl)amino)tetramethylrhodamine), and BCECF-AM (2′, 7′-bis-(2-carboxyethyl)-5-(and-6)-carboxyfluorescein, acetoxymethyl ester)] for tracking cells and determining cellular organization are limited to short-term studies lasting only a few days 11 due to dye dilution with cellular division. In contrast, PKH dyes (discovered by Paul K. Horan 12 ) are lipophilic dyes stably incorporated into the cell membrane, allowing for proliferation assessment,13–17 and appear to be nontoxic.13,16,18,19 PKH26 has previously been applied to track generations of chondrocytes in vitro 16 and also chondrocytes implanted in vivo either by autologous chondrocyte transplantation 20 or implant of stratified cartilaginous tissues containing PKH26-labeled subpopulations. Another comparable long-lasting cytoplasmic dye is carboxyfluorescein diacetate, succinimidyl ester (“CFDA, SE”), 22 which passively diffuses into cells and is highly fluorescent and well-retained once its acetate groups are cleaved by intracellular esterases (termed “CFSE” after cleavage, and referred to as such throughout the rest of this study).22,23 CFSE has been used to track various cell types in vitro and in vivo24–26 and, similar to lipophilic dyes, can be applied to track generations of cells since the associated fluorescence signal decreases by half with each cell division cycle. CFSE does not appear to have adverse effects on cell function and cell viability, 27 indicating that it could be useful for tracking chondrocytes in cell-laden tissues implanted in vivo and could be applied in conjunction with other labeling probes, such as PKH26, to track more than one type of cell population in parallel.
Before application of CFSE to chondrocytes for cartilage repair analyses in vivo, the effects of CFSE on the function of chondrocytes from superficial (S) and middle (M) zones of cartilage need to be assessed. S and M chondrocytes are known to exhibit various cell functions, specific to their cell phenotype. In particular, in repair and in homeostasis, some important cell functions, which differ according to cell phenotype, are proliferation, secretion of the functional marker molecule proteoglycan 4 (PRG4) 28 that is characteristic of S zone chondrocytes, and secretion of sulfated glycosaminoglycans (GAG) of the extracellular matrix. Cartilaginous constructs can be fabricated from S and M zone chondrocytes in a stratified form so that PRG4 secretion is localized at the tissue surface. 28 Thus, the objectives of this study were to establish a cell tracking and generation analysis method using CFSE for labeling subpopulations of chondrocytes and to determine the effects of CFSE on cell proliferation, and secretion of GAG and PRG4.
Materials and Methods
Materials
Materials for cartilage explant, chondrocyte isolation, monolayer culture, and biochemical procedures were obtained exactly as described previously. 16 In addition, CFSE labeling kits were from Invitrogen/Molecular Probes (Carlsbad, CA).
Cartilage harvest, chondrocyte isolation, and primary preculture
Chondrocytes from the S (<0.2 mm) and M (0.4–1.0 mm) layers of immature bovine cartilage were enzymatically isolated (1–3-week-old calf knee joints, n = 6). 16 Chondrocytes from each animal were plated and expanded in low-density (10,000 cells/cm2) monolayer culture in medium (Dulbecco's modified Eagle's medium, 10 mM HEPES, 0.1 mM nonessential amino acids, 0.4 mM L-proline, 2 mM L-glutamine, 100 U/mL penicillin, 100 μg/mL streptomycin, and 0.25 μg/mL amphotericin B) with 10% fetal bovine serum and 25 μg/mL ascorbic acid at 37°C in an atmosphere of 5% CO2/95% air. Cells were serum-starved for 1 day to synchronize cultures before release with 0.25% trypsin–1 mM ethylenediaminetetraacetic acid (EDTA). Cells were harvested with 0.25% trypsin–1 mM EDTA in Hanks' balanced salt solution, and then pelleted, counted, and resuspended in complete medium at about 1 million cells/mL.
Experimental design
To determine the extent of CFSE retention and the effects of CFSE labeling on S and M chondrocytes, cells were either labeled with CFSE (and subsequently designated as S^ or M^) or left unlabeled, and analyzed as described below (Fig. 1).
Schematic of methods used to evaluate carboxyfluorescein diacetate succinimidyl ester (CFSE) retention by chondrocytes and effects of CFSE on cell growth, glycosaminoglycan (GAG) content, and proteoglycan 4 (PRG4) secretion. Cells were isolated separately from superficial (S) and middle (M) zones of articular cartilage and allowed to expand in low-density monolayer culture. After release, some cells were labeled with CFSE (indicated by ^). Cells were either analyzed immediately or replated in monolayer at low (10,000 cells/cm2) and high (200,000 cells/cm2) densities for an additional 7 days and then released. S (gray) and M (white) zone chondrocytes are shaded differently to emphasize their location in culture.
Cell labeling with CFSE
Some of the harvested chondrocytes (about 10 million S or M cells) were washed once in Hanks' balanced salt solution and then resuspended in 5 mL of prewarmed labeling solution containing CFSE (final concentration 20 μM in phosphate-buffered saline 23 ). Chondrocytes in suspension were incubated in the labeling solution for 15 min at 37°C, pelleted by centrifugation, and resuspended in medium containing 10% fetal bovine serum and washed once with complete medium.
The effects of cell division were examined by plating cells at different seeding densities. Cells were analyzed immediately or replated in 6-, 12-, or 24-well dishes at densities of 10,000 or 200,000 cells/cm2 and cultured in monolayer for an additional 1 or 7 days with 2 mL complete medium per million cells that was changed every 2 days. Cultured cells were then released with trypsin-EDTA (Fig. 1).
Fluorescence microscopy
Qualitative assessments of cellular retention and effects of the CFSE tag were made by fluorescence microscopy (Nikon Eclipse TE 300; AG Heinze, Irvine, CA) with SPOT RT digital imaging (Diagnostic Instruments, Burlingame, CA). Phase and fluorescent images were taken of the same field of view of labeled cells, and phase images were taken of untagged cells. Fluorescent optical gain and exposure settings were kept constant among all groups and time points.
Flow cytometry and generation analysis
Separate samples of suspended cells (about 200,000–800,000 cells/mL) were analyzed by flow cytometry as previously described. 16 Successive generations of proliferating cells were tracked with flow cytometric analysis given a halving of cellular fluorescence intensity with each division. A FACScan flow cytometer with argon ion excitation at 488 nm (Becton-Dickinson, Franklin Lakes, NJ; voltage to the fluorescence detector = 395 V) was used to analyze samples. For each detected object, forward scatter (size), side scatter (granularity), and fluorescence parameters representing CFSE (peak excitation at 492 nm and peak emission at 517 nm) were collected through a 530/30 nm filter. For each sample, data representing 10,000 objects were collected as a list-mode file using CellQuest™ software (Becton-Dickinson). Data were imported into FlowJo™ software (version 6.4.1; Tree Star, Ashland, OR) for analysis. First, objects that were cell fragments or nonviable cells were gated out based on low forward scatter and high side scatter (as confirmed by propidium iodide staining, data not shown). 16 The remaining objects (>99% of the 10,000) were then classified as labeled or unlabeled based on having a fluorescence greater than that of background signal, determined as the level greater than that emitted by 95% of the cells in unlabeled samples.
A proliferation index (PI) was calculated based on areas of each model-generated distribution contributing to the sample histogram16,17 accounting for the fluorescence decay of CFSE, assumed to obey first-order exponential kinetics.
29
The decay was subtracted from fluorescence associated with cells in generation 1. Each subsequent generation thereafter was assigned half the fluorescence of the previous generation, equivalent to a loss of 19.18 channels per generation. PI was calculated as the ratio of the total number of cells (summation of the Gaussian areas in each generation, Ak, up to k = 10 generations) to the calculated number of cells initially residing in the parent generation (cells seeded at day 0):
An index of net fluorescence, taking into account proliferation, was calculated as the product of the PI and the mean fluorescence of the sample. Numbers of cells per generation (cycle of cell division) were determined by fitting day 1 and day 7 histograms with a Gaussian model of fluorescence distribution, based on day 0 data.16,17 A custom program (Microsoft Excel 2002, Bellevue, WA) was used to decompose sample histograms into a sum of distributions representing successive generations by nonlinear least squares fitting. 16 Thus, assuming that fluorescence halved with each cell division cycle, the number of cells in each doubling generation that contributed to the final cell population was determined.
Analysis of DNA content and synthesis of GAG and PRG4 secretion
Cells cultured in monolayer at low and high densities, with and without CFSE, were solubilized with proteinase-K. 30 Portions of the digest were analyzed for DNA using Hoechst 33258, 31 with calf thymus DNA as the standard. Hoechst 33258 was used for DNA assay rather than PicoGreen, which is also commonly used for chondrocyte DNA analysis, 32 because the excitation spectrum of the former (peak excitation at 365 nm and peak emission at 460 nm) is more distinct from that of CFSE (peak excitation at 492 nm and peak emission at 517 nm). Control experiments (data not shown) confirmed that under the conditions of the study, the Hoechst 33258 assay for DNA was not affected by the CFSE associated with the cell cultures. For some samples, other portions were also analyzed for GAG by using dimethyl methylene blue (DMMB) 33 with chondroitin sulfate standards.
Spent medium was analyzed for PRG4 secretion by indirect ELISA using monoclonal antibody 3A4 (courtesy B. Caterson, Wales, United Kingdom). 30 PRG4 levels were calculated from a standard curve generated from samples containing known amounts of PRG4 based on protein content. 34 Amounts of PRG4 secreted were expressed as pg/(cell · day). For some samples, spent medium was analyzed for GAG accumulation by DMMB assay. Control experiments (data not shown) confirmed that under the conditions of the study, negligible interactions occurred between DMMB dye or 2,2'-azino-bis-[3-ethylbenzthiazoline-6-sulfonic acid] (ABTS) substrate with CFSE associated with the cell cultures.
Statistical analysis
The effects of tagging, seeding density, cell type, day, and interactions were assessed by analysis of variance and post-hoc Tukey tests, α = 0.05 (Systat Software 10.2, Richmond, CA). Cells from different animals (n = 6) were maintained separately so that the four to six samples per result and assay represent the mean of and variability between animals. Data were expressed as mean ± standard error of mean.
Results
Retention of CFSE in cultured chondrocytes by fluorescence microscopy
Phase and fluorescence images of unlabeled superficial and middle and CFSE-labeled (S^, M^) chondrocytes indicated that CFSE labeled essentially all cells and that the initial plating density affected the fluorescence intensity present after 7 days of culture. Unlabeled cells plated at low and high densities did not exhibit any fluorescence, indicative of CFSE labeling, as expected (Fig. 2A, D, G, J, M, P, S, V). On day 1, CFSE-labeled cells at low and high density were labeled brightly (Fig. 2C, I, O, U). By day 7, many of the CFSE-labeled cells that were seeded at low density (Fig. 2F, R) appeared dimmer than cells initially seeded at high density (Fig. 2L, X) but were still visible. Comparison of phase (Fig. 2B, D, H, J, N, P, T, V) and fluorescence (Fig. 2C, F, I, L, O, R, U, X) microgaphs of CFSE-labeled cells indicated cells retained the dye effectively.

Effects of cell growth and seeding density on CFSE retention by CFSE-labeled S^ and M^ chondrocytes. Phase (
Flow cytometric analysis of CFSE in cultured chondrocytes
A high proportion of labeled cells retained CFSE-associated fluorescence after 7 days of culture, as analyzed by flow cytometry. Both S and M zone cells (p = 0.6) were labeled brightly and with similar high efficiency at day 1 at both densities (Fig. 3A, B; S: 96.4 ± 2.2% and M: 97.8 ± 0.7%). By day 7, the percentage of detectable labeled cells tended to diminish (p = 0.07) but slightly (90.9 ± 3.3%), particularly for cells seeded at low density (p < 0.05, 84.9 ± 5.7%) compared to high density (p < 0.05, 97.6 ± 0.6%).
Effects of seeding density and time in monolayer culture on CFSE retention by (
According to generation analysis, cell proliferation occurred during culture (p < 0.001) with an effect of seeding density (p < 0.05) but was unaffected by chondrocyte origin (p = 0.7) (Fig. 4). There was a significant interaction between time in culture, day, and cell density (p < 0.05). In particular, at day 7, the median generation for low-density M^ chondrocytes was significantly higher (5.7-fold) than at day 1 (p < 0.001), as were M^ cells at high density (3.2-fold, p < 0.05). The median generation for S^ cells at low density was significantly higher (3.0-fold) at day 7 than at day 1 (p < 0.05, Fig. 4D), whereas the median generation of S^ cells at low density and high density was similar (p = 0.9, Fig. 4F). At day 1, most of the cells in each population were calculated to be in generation 1 (Fig. 4A–D). At day 7, more than half of the cells seeded at low density resided in generation 4 or higher, compared to cells seeded at high density, which had a high percentage of cells still in lower generations (Fig. 4E–H).
Effects of chondrocyte origin and seeding density on proliferation. Chondrocytes were isolated from the S and M layers of articular cartilage, plated at low or high cell densities, cultured for 7 days, and analyzed for the percentage of cells in different generations. Percentages of S (
The PI calculated from the generation model for S^ and M^ chondrocytes after 7 days of culture increased significantly with time in culture (p < 0.001) and showed a trend toward an effect of density (p = 0.07) but was unaffected by cell type (p = 0.9) and interactions of the aforementioned factors (p > 0.05) (Fig. 5A). There was a tendency toward an interactive effect of density and time in culture, but the effect was not statistically significant (p = 0.1). The PI was 6.7-fold greater for cells at day 7 compared to cells at day 1 (p < 0.001). The PI for cells at low density was 2.3-fold greater than cells at high density (p = 0.07). The PIs of S and M cells were similar (p = 0.9).
Effects of chondrocyte origin and seeding density on retention of CFSE in vitro. (
The mean fluorescence intensity of CFSE-labeled cells after 7 days was significantly lower at the day 7 time point (p < 0.001) and for cells initially seeded at low density (p < 0.001), with a significant interaction between the two factors (p < 0.05), but was unaffected by cell type (p = 0.5) (Fig. 5B). While the fluorescence intensities of cells seeded at low density and high density on day 1 were similar (p = 0.8), by day 7, the intensity of labeled cells had decreased. In particular, intensity of high-density cells at day 1 was 10.6-fold higher than that of high-density cells at day 7 (p < 0.001). The fluorescence intensity of low-density cells at day 1 was 27-fold higher than low-density cells at day 7 (p < 0.001). At day 7, the mean fluorescence intensity of cells seeded at high density was significantly higher (1.3-fold) than that of cells seeded at low density (p < 0.001).
The index of net fluorescence was significantly affected by time in culture (p < 0.001) and density (p < 0.05). The fluorescence index was not significantly affected by cell type (p = 0.2) or interactions of the factors (p = 0.1–0.9) (Fig. 5C). Thus, when proliferation was considered, the net fluorescence (associated with the entire population of cells in a given culture condition) was diminished 3.5-fold, on average, during 7 days of in vitro culture. The index of net fluorescence was 1.3-fold higher for cells at high density compared to low density (p < 0.05).
Effects of CFSE on DNA content and synthesis of GAG and PRG4
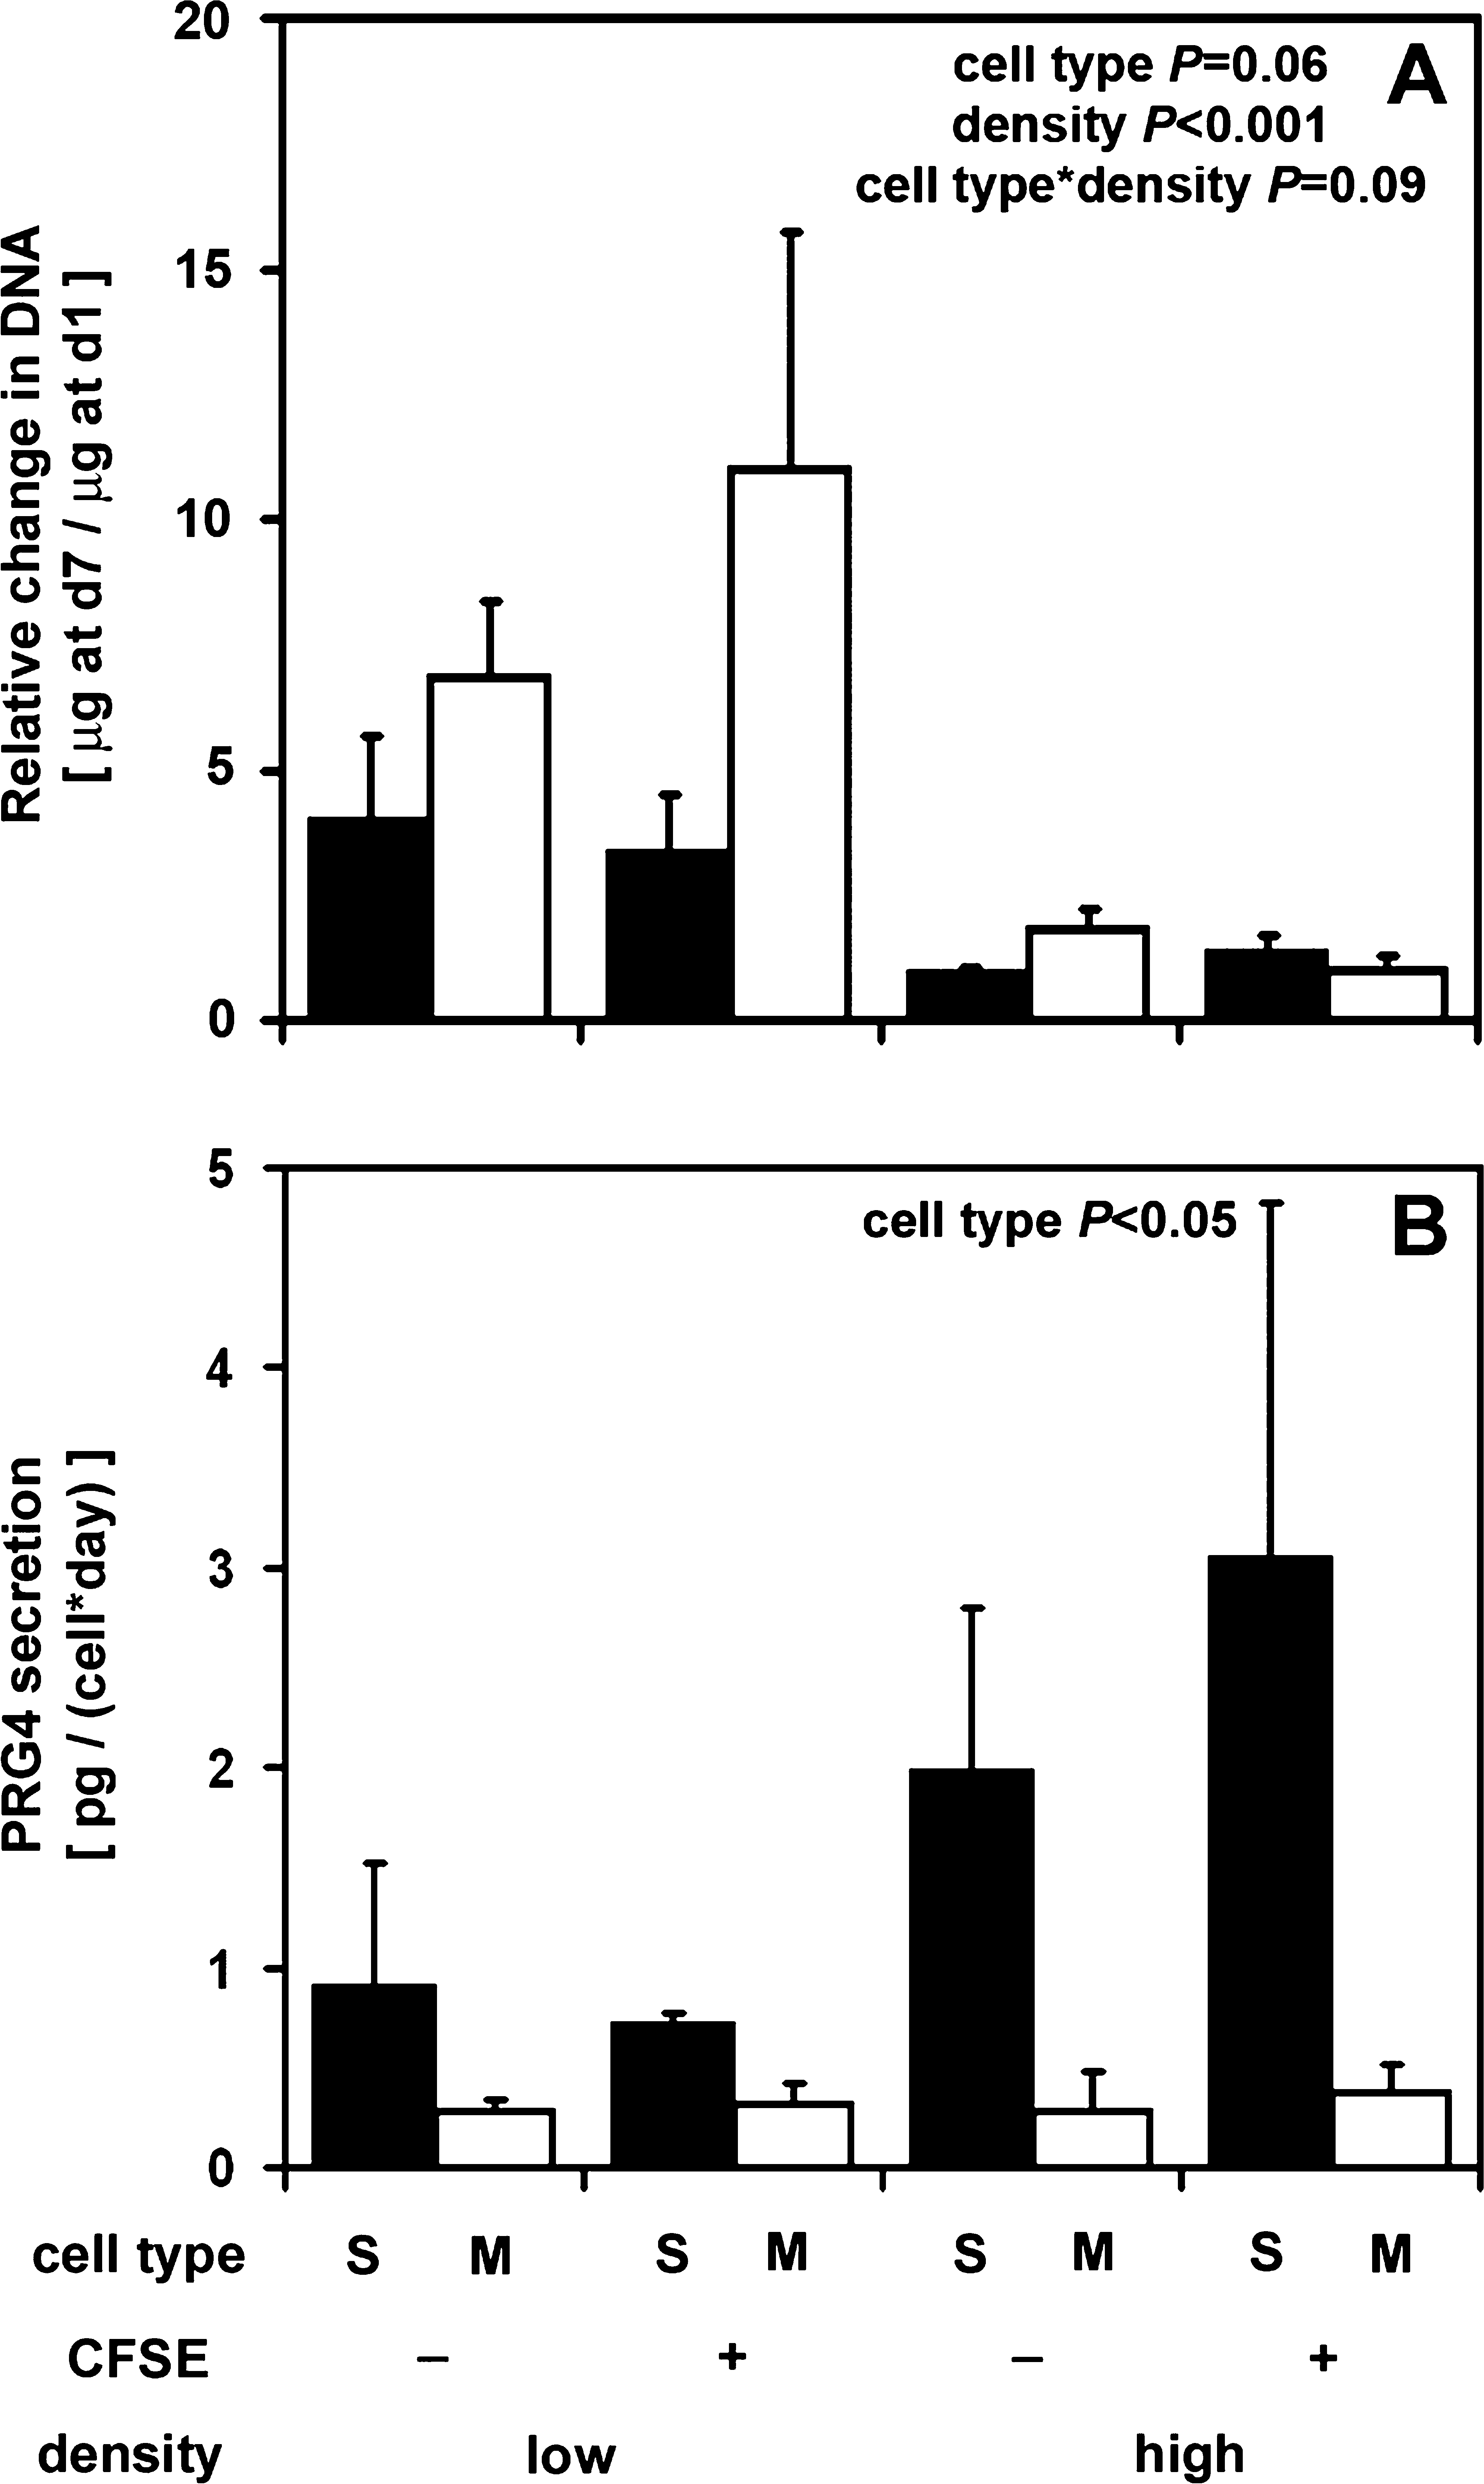
Cell proliferation over the 7 days remained unaffected by CFSE labeling (p = 0.3), but was increased for cells seeded at low density (p < 0.001), with a tendency particular to M cells (p = 0.06) with a trend of significant interaction between the two factors (p = 0.09) (Fig. 6A). Other interactions were not statistically significant (p = 0.3–0.9). During the 7 days, proliferation by cells at low density was 4.8-fold higher than those at high density (p < 0.001). Proliferation by M cells at low density was 2.6-fold more than S cells (p = 0.1) and 8.2-fold greater when seeded at low density than when seeded at high density (p < 0.001). In comparison, S cells proliferated similarly after plating at low and high densities (p = 0.6). When both cells were seeded at low density, M zone cells also proliferated more (2.1-fold) than S zone cells (p = 0.06), independent of CFSE labeling. S and M zone cells seeded at high were similar in terms of cell proliferation (p = 0.9).
Effects of cell type, tagging, and cell seeding density on (
PRG4 secretion by S cells was higher than that by M zone cells (p < 0.05) without a statistically significant effect of density (p = 0.2) and CFSE tagging (p = 0.7) (Fig. 6B). No significant interactions were found (p = 0.2–0.8). S chondrocytes secreted 1.8 ± 0.6 pg/(cell · day) by day 7 in culture, 5.6-fold higher than that secreted by M zone cells 0.3 ±0.1 pg/(cell · day) (p < 0.05).
By day 7 in culture, GAG content of cell layers (normalized to average DNA amount present on days 1 and 7) was significantly higher (19-fold, p < 0.001) than that accumulated in conditioned media (Fig. 7). GAG/DNA in the cell digests and conditioned media were not affected by cell type (p = 0.5). Effects of cell density (p = 0.1) and CFSE labeling (p = 0.1) on GAG content of cell layers appeared to exist but were not statistically significant. In addition, interactions among the aforementioned factors were not statistically significant (p = 0.2–0.6).
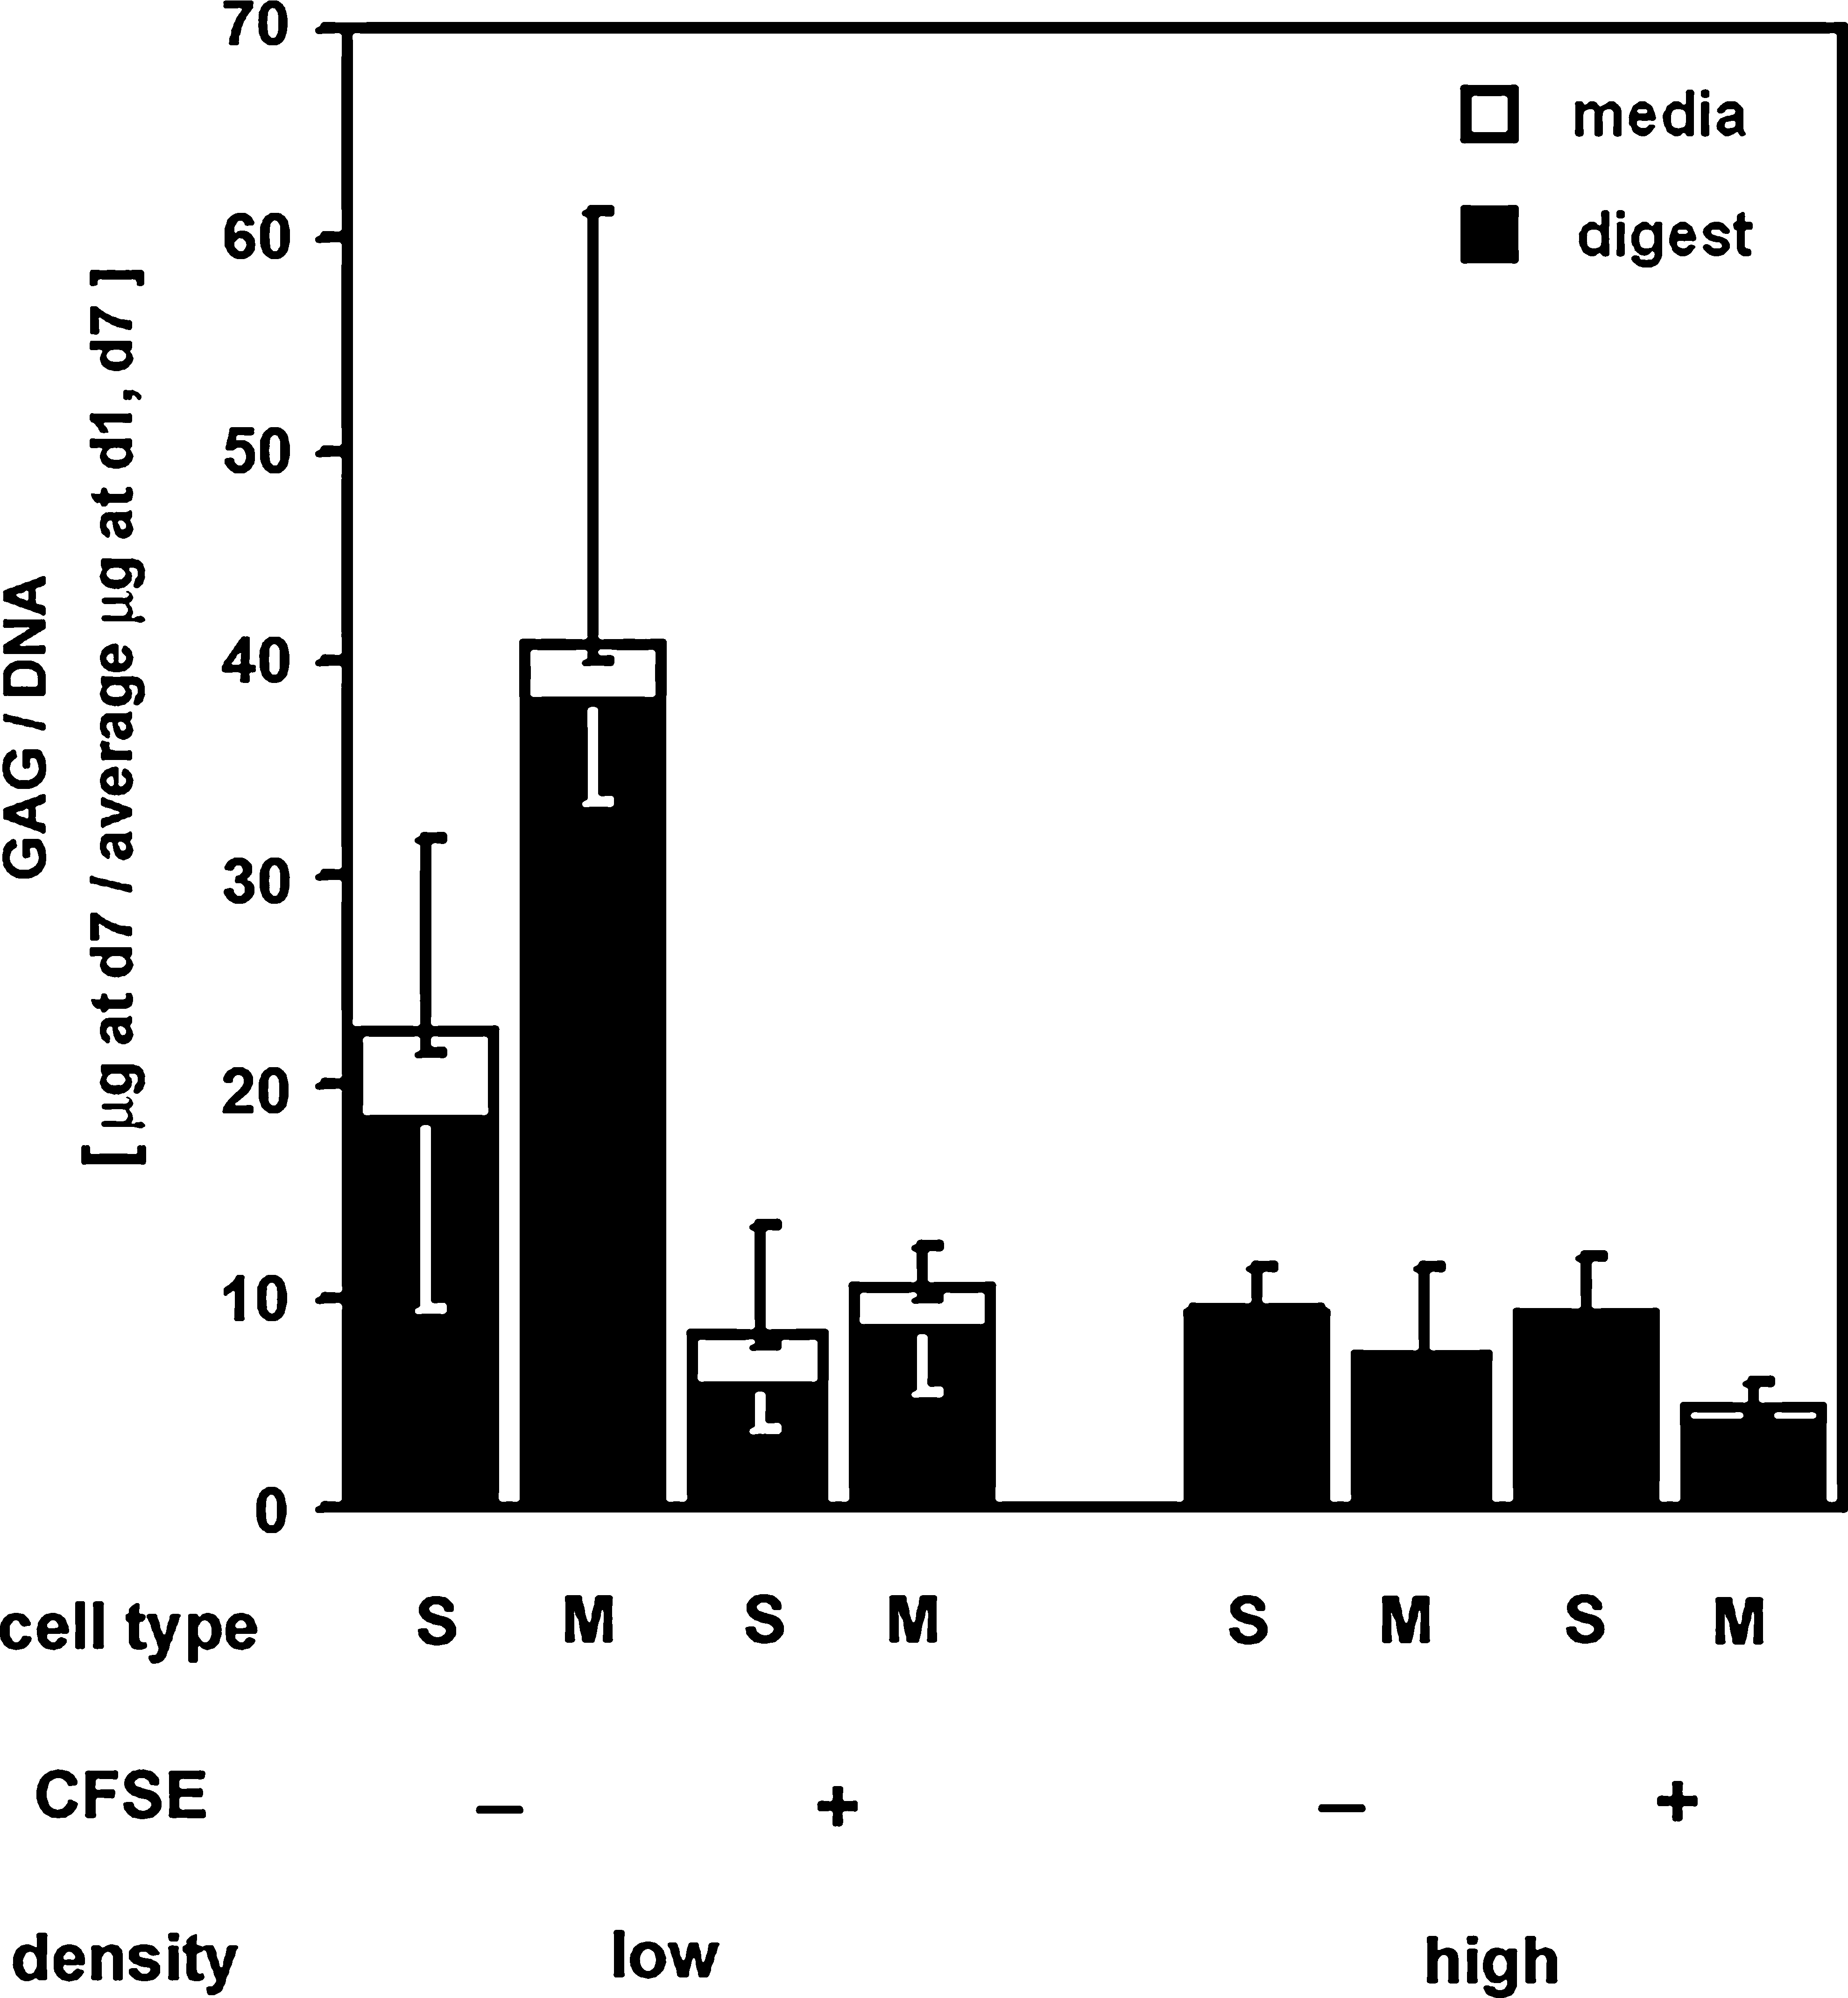
Effects of cell type, tagging, and cell density on GAG secretion. GAG content in cell digest (▪) or conditioned media (□) was assessed on day 7 by dimethyl methylene blue assay. Data are expressed as mean ± SEM (n = 5).
Discussion
These results establish methods for using CFSE in studies of chondrocyte growth without adverse effects on chondrocyte function—specifically, cellular proliferation and secretion of PRG4. Fluorescence microscopy (Fig. 2) and analysis of cell suspensions by flow cytometry (Fig. 3) both indicated strong retention of CFSE by S and M zone chondrocytes after 7 days in monolayer culture, whether cells were induced to proliferate at a moderate rate (seeding at high density, 200,000 cells/cm2) or at a high rate (seeding at a low density, 10,000 cells/cm2). By day 7, fluorescence in 92% of these cells was still detectable by flow cytometry, while the net fluorescence was somewhat decreased for both cell types and seeding densities (Fig. 3). Cells were seeded at low density to induce greater extents of proliferation, compared to those seeded at high density, where loss of fluorescence not due to proliferation was determined. The possibility of tracking CFSE-labeled cells through several generations was established from flow cytometric data (Figs. 4 and 5). CFSE labeling did not affect proliferation rate (Fig. 6A) or secretion of PRG4 (Fig. 6B). Slightly adverse effects of cell labeling on GAG accumulation was noted (Fig. 7).
In this study, effects of CFSE labeling on chondrocyte function and proliferation were examined over 1 week. One limitation of this study is the use of cells expanded in monolayer, compared to primary cells, which more closely reflect the in vivo phenotype of chondrocytes. In the future, longer culture durations and other cell sources may be analyzed, since such cell cultures may exhibit different responses. In addition, the effects of CFSE on a variety of cell functions may be analyzed. While proliferation and production of matrix (for M cells) and PRG4, a marker of zonal phenotype (for S cells), were measured in this study and are important features of chondrocytes for tissue engineering, other indices of important cell functions such as cartilage oligomeric matrix protein and type II collagen, as well as cell fate processes such as (re)differentiation, should be explored in the future.
The culture-dependent fluorescence characteristics of CFSE are consistent with studies on other cell sources. Previous studies developed flow cytometric methods for assessing proliferation with CFSE in cells from sources other than those that are skeletally differentiated; the reduction of fluorescence intensity with chondrocyte division (Fig. 3) generally agrees with such studies.23,35 The diminution of fluorescence is consistent with dilution during proliferation since CFSE-associated fluorescence does not decrease significantly in nondividing cells. Identification of CFSE-associated fluorescence by flow cytometry provides a method for quantitatively determining the extent of positive fluorescent staining of cells. Fluorescence and phase images were also obtained to qualitatively assess the extent of fluorescence staining and retention.
CFSE has effectively labeled several cell types in tracking studies. These include analysis of neural crest migration, 35 separation of myogenic and fibroblastic cells, 36 homing of hematopoietic stem cells, 37 proliferation of airway smooth muscle cells, 38 and mesenchymal stem cells. 26 CFSE was also used to track the fate of human intervertebral disc cells in vitro. 23 Localization of CFSE-labeled cells is useful since the dye does not passively transfer to unlabeled cells 39 and has been shown to not transfer between labeled and unlabeled cells in coculture experiments in vitro. 36 CFSE labeling may be applicable in cartilage repair studies in vivo since S and M zone chondrocytes isolated from cartilage of 4–6-month-old Yucatan mini-pigs have also been effectively labeled, 21 and could be used in conjunction with PKH26, another fluorescent dye previously described for tissue engineering applications.16,21 The extent to which CFSE signal intensity is diminished in vivo would depend on the extent of cell proliferation, as indicated from the results of the present study, as well as the extent of cell loss and chemical reactions affecting CFSE or photobleaching.
CFSE labeling did not markedly impair intrinsic chondrocyte functions, including proliferation (Fig. 6A), consistent with other studies,25,40 and were similar, whether determined with CFSE (by generation analysis) or by Hoechst assay (for DNA content). Differences in the extent of proliferation, for example, with M zone chondrocytes seeded at high density having a higher PI by generation analysis flow cytometry than by DNA assay, may be due to a number of factors. Only viable cells were considered during the flow cytometry analysis, whereas both viable and nonviable cells were quantified by DNA content analysis. In addition, even at high seeding densities (>200,000 cells/cm2), proliferation in this culture system and others is significant. 41 During cell culture, dead cells may be removed during medium changes so that assessment of DNA by Hoechst assay will be an indication of net proliferation (i.e., proliferation balanced by cell loss). In contrast, assessment by CFSE provides a PI. Also, photobleaching, expected with light exposure of cultures during medium changes, would lead to overestimation of proliferation by generation analysis. Similar differences were noted in determining the extent of proliferation with PKH26 dye. 16
Effects of supravital dyes, such as CFSE, would ideally be inert with respect to other cellular functions, such as secretion of PRG4 and matrix accumulation. The inertness of CFSE labeling on PRG4 secretion by superficial chondrocytes is consistent with its lack of adverse effects on cell viability25,27 and growth. 38 In the present study, PRG4 secretion levels were generally comparable to those found previously for S and M zone chondrocytes in monolayer culture,16,42 with S cells secreting significantly more PRG4 than M cells. GAG synthesis of chondrocytes plated in monolayer was slightly affected by CFSE labeling under standard monolayer conditions. Whether CFSE would still have an effect when stimulated by other growth factors in vitro, or affected by those in vivo, could be explored. If needed, in future longer-term in vitro studies, lower concentrations of CFSE dye could be used and/or applied in conjunction with growth factor stimulation, such as bone morphogenetic protein-7 or osteogenic protein-1, which has been shown to increased matrix deposition in cartilaginous tissues generated in vitro.43,44
Tracking chondrocytes labeled with CFSE could have widespread applications for evaluating implanted cells in articular cartilage repair in vivo, especially in biopsies or terminal analyses in animal models. Tracking culture-expanded chondrocytes could help determine cell retention at the repair site and redifferentiation. Ideally, cells for implantation would be labeled as close as possible to the implantation time to minimize the fluorescence decrease due to division before implantation. Before applying CFSE labeling to track chondrocytes quantitatively, the number of cell divisions that CFSE-labeled chondrocytes could undergo and still be detected had to be determined. The present results suggest that for constructs implanted in vivo with CFSE-labeled cells, recovered cells that are CFSE positive would have undergone less than 10 cycles of cell division. Conversely, those that are CFSE negative would either be from the host or be implanted cells that have proliferated extensively. The finding that CFSE labeling did not adversely affect chondrocyte proliferation and PRG4 secretion is significant for future in vivo cell tracking studies aimed at gaining insight into mechanisms underlying articular cartilage repair.
Footnotes
Acknowledgments
This work was supported by grants from NIH and NSF, a predoctoral fellowship from the Whitaker Foundation (K.C.), and a Howard Hughes Medical Institute Professor's Award to University of California-San Diego (R.L.S.).
Disclosure Statement
No competing financial interests exist.