
Abstract
CD133+ cells are hemangioblasts that have capacity to generate into both hematopoietic and endothelial cells (ECs). Hypoxia/normoxia has shown to be the regulator of the balance between stemness and differentiation. In this study we performed Agilent's whole human genome oligo microarray analysis and examined the differentiation potential of the bone-marrow-derived CD133+ cells after hypoxic/normoxic preconditioning of CD133+ cells. Results showed that there was no significant increase in erythroid colony forming unit (CFU-E) and CFU-granulocyte, erythrocyte, monocyte, and megakaryocyte formation with cells treated under hypoxia/normoxia. However, a significant increment of EC forming unit at 24 h (143.2 ± 8.0%) compared to 0 h (100 ±11.4%) was observed in CFU-EC analysis. Reverse transcription–polymerase chain reaction and immunostaining analysis showed that the differentiated cells diminished hematopoietic stem cell surface markers and acquired the gene markers and functional phenotype of ECs. The transcriptome profile revealed a cluster of 232 downregulated and 498 upregulated genes in cells treated for 24 h under hypoxia. The upregulated genes include angiogenic genes, angiogenic growth factor genes, angiogenic cytokine and chemokine genes, as well as angiogenic-positive regulatory genes, including FGFBP1, PDGFB, CCL15, CXCL12, CXCL6, IL-6, PTN, EREG, ERBB2, EDG5, FGF3, FHF2, GDF15, JUN, L1CAM, NRG1, NGFR, and PDGFB. On the other hand, angiogenesis inhibitors and related genes, including IL12A, MLLT7, STAB1, and TIMP2, are downregulated. Taken together, hypoxic/normoxic preconditioning may lead to the differentiation of CD133+ cells toward endothelial lineage, which may improve the current clinical trial studies.
Introduction
However, there are concerns with the use of crude cell preparation, which may introduce nonessential cells into organs and give rise to unwanted inflammatory response at the site of the graft. 11 Therefore, current studies are progressively moving toward the use of single cell type. Since the introduction of direct intramyocardial injection of CD133+ cells into patients undergoing coronary artery bypass graft showed functional and local perfusion improvement, 12 other similar studies with CD133+ cells also yield promising results.13–16
CD133 (or Prominin 1) is a five transmembrane glycoprotein with a molecular weight of 120 kDa. 17 CD133 surface antigen is not only expressed on progenitor cells from peripheral blood and cord blood, 17 epithelial cells,18,19 and endothelial cells (ECs), 20 but also found in embryonic stem cells 21 and BM-derived hematopoietic stem and progenitor cells.22,23
CD133+ cells are hemangioblasts that are highly noncommitted population in adult BM and endowed with hematopoietic and vasculogenic potential24,25 as well as the potential of muscle precursors, cardiomyocytes cells, and MSCs. 26 The incorporation of transplanted CD133+ cells into the neovasculature can activate signaling pathways associated with angiogenesis. 27 CD133+ cells can undergo myogenesis when exposed to Wnt-producing cells, cocultured with myogenic cells, or preconditioned with cytokines.28,29
Apart from coculturing and cytokines treatment, preconditioning also plays an important role in fetal development and cell differentiation. 30 The exposure of mesenchymal stem cells to low oxygen induces the secretion of proangiogenic cytokines. 31 It has been reported that low oxygen concentrations enhance the survival and favoring self-renewal of hematopoietic stem cells.32,33 The hypoxic preconditioning of endothelial progenitor cells before transplantation showed significant enhancement in neovascularization. 34 A recent study showed that the molecular response of umbilical cord blood CD133+ cells and BM mesenchymal cells to hypoxia is cell-type specific. 35
To expand our understanding of the underlying molecular mechanism after hypoxic/normoxic preconditioning of CD133+ cells, we performed global microarray analysis and examined the differentiation potential of the treated BM-derived CD133+ cells. We found that hypoxic/normoxic preconditioning may lead to the differentiation of CD133+ cells toward endothelial lineage that may improve the stem-cell-based transplantation in clinical trials.
Materials and Methods
Cell isolation and preconditioning
The study conforms to the declaration of Helsinki, and cell donors gave their informed written consent to use their BM for experimental purposes. Three BM samples were obtained by sternal aspiration from patients (two aged 67 years and one aged 77 years) undergoing coronary artery bypass graft surgery at Rostock University Hospital, Rostock, Germany. Mononuclear cells from all samples were isolated by density gradient centrifugation using Ficoll Paque™ PLUS (GE Healthcare, Munich, Germany). CD133+ cells were enriched by positive magnetic cell separation system (MACS; Miltenyi Biotec, Bergisch Gladbach, Germany). The cells (30,000 cells/treatment duration/donor) were resuspended in Stemspan H3000 (StemCell Technologies, Vancouver, Canada) supplemented with 2 ng/mL stem cell factor (PAN Biotech, Aidenbach, Germany) and 2 ng/mL Interleukin (IL)-3 (StemCell Technologies). The cells were placed in modular incubator chamber (Billups-Rotheberg, Del Mar, CA) followed by hypoxic/normoxic preconditioning with 24 h hypoxic condition containing 1.5% [vol/vol] oxygen and 5% [vol/vol] carbon dioxide and 48 h normoxic (21% oxygen) condition for a total treatment period of 72 h. 72 h normoxic treatment (0 h hypoxia) was used as the reference control.
Fluorescence activated cell sorting analysis
Positive magnetic isolation may produce a heterogenous cell population containing various subpopulations of different phenotypes; therefore, the purity of the isolated cells was verified by flow cytometry analysis. The enriched CD133+ cells were incubated with FcR Blocking Reagent and the following antibodies: anti-CD45-FITC (Clone 5B1), CD133/2-PE (Clone 293C3), and CD34-APC (Clone AC136) for 10 min at 4°C. Isotype controls were also included (Miltenyi Biotec). After incubation, the cells were washed with phosphate-buffered saline supplemented with 0.05% bovine serum albumin and 2 mM ethylenediaminetetraacetic acid and analyzed by FACS Calibur flow cytometer (Becton Dickinson, San Jose, CA). Dead cells were excluded using propidium iodide (Sigma, Munich, Germany) staining. The data analysis was performed using the BD CellQuest Pro software (Becton Dickinson).
Colony forming assay
At the end of the hypoxic/normoxic preconditioning, the cells were harvested by aspiration into Stemspan H3000 and plated in triplicates at a density of 6000 CD133+ cells per 35 mm dish in MethoCult methylcellulose-based medium (StemCell Technologies). After 16 days of incubation under fully humidified condition at 37°C, the colonies formed were scored as erythroid colony forming cells (CFU-E) and CFU-granulocyte, erythrocyte, monocyte, and megakaryocyte (GEMM) according to the standard criteria developed by StemCell Technologies (Atlas of Human Hematopoietic Colonies) and published criteria. 36 The mean and standard error of the mean of three independent experiments were calculated. Statistical analysis was carried out using Student's t-test.
Endothelial colony forming assay
The preconditioned cells were harvested and plated in triplicates at a density of 10,000 CD133+ cells per 35 mm dish in MethoCult SF supplemented with growth factors such as 50 ng/mL fibroblast growth factor, 20 ng/mL IL-3, 50 ng/mL vascular endothelial growth factor (VEGF), 100 ng/mL stem cell factor, 50 ng/mL insulin-like growth factor-1, and 50 ng/mL EGF adapted from Masuda et al. 37 After 25 days of incubation under fully humidified condition at 37°C, the colonies formed were counted under a microscope. CFU-ECs were identified according to previously published morphologic criteria.37,38 The mean and standard error of the mean of three independent experiments were calculated. Statistical analysis was carried out using Student's t-test.
Reverse transcription–polymerase chain reaction of differentiated endothelial-like cells
Total RNAs were isolated from freshly isolated CD133+ cells and the differentiated endothelial-like cells using Qiagen RNeasy Mini kit (Qiagen, Valencia, CA). cDNA was synthesized from 2 μg total RNA using 200 units of SuperScript™ III reverse transcriptase (Invitrogen, Carlsbad, CA), 250 ng of random primers, and 40 unit of recombinant RNAse inhibitor (Promega, Madison, WI). The reverse transcription was performed at 50°C for 60 min and terminated at 70°C for 15 min. The cDNAs were subjected to polymerase chain reaction (PCR) amplification with primers as described in Table 1 at annealing temperature of 56°C. The PCR products were fractionated by 1.8% agarose gel electrophoresis. Housekeeping gene GAPDH was selected as the reference control.
Immunostaining of differentiated endothelial-like cells
The differentiated endothelial-like cells were seeded on fibronectin (Sigma)-coated coverglasses and cultured in the endothelial cell growth medium (PromoCell, Heidelberg, Germany). For uptake of lipoprotein, the cells were incubated with 20 μg/mL of Alexa-488-conjugated acetylated low-density liproprotein for 4 h (Molecular Probes, Karlsruhe, Germany). At the end of incubation, the cells were fixed with 4% paraformaldehyde in phosphate-buffered saline for 10 min at 37°C. For immunolabeling of CD31, the cells were fixed and blocked with Dako Protein Block (Dako, Hamburg, Germany) for 10 min before incubation with anti-CD31 (Clone JC/70A) monoclonal antibody for overnight. The coverglasses were washed thoroughly, mounted in FluorSave™ (Calbiochem, Darmstadt, Germany), and imaged using a Leica TCS SP2 laser-scanning confocal microscope (Leica, Solms, Germany).
SuperAmplification of cDNA
The preconditioned cells were harvested in SuperAmp Lysis Buffer, and SuperAmplification was performed according to Miltenyi Biotec's undisclosed protocol. Briefly, the amplification is based on a global PCR protocol of mRNA-derived cDNA. mRNA was isolated by magnetic bead technology. Amplified cDNAs were quantified using ND-1000 spectrophotometer (NanoDrop Technologies, Schwerte, DE). The quality of the cDNA was checked by Agilent Bioanalyzer platform (Agilent Technologies, Palo Alto, CA). The results of the Bioanalyzer run were observed in a gel image and an electropherogram using the Agilent 2100 Bioanalyzer expert software.
Hybridization of agilent whole human genome oligo microarray
About 250 ng of each cDNA was used as template for Cy3 and Cy5 labeling, which was performed according to Miltenyi Biotec's protocol. Equal amounts of corresponding Cy3- and Cy5-labeled cDNAs were combined and hybridized at 65°C for 17 h to an Agilent Whole Genome Oligo Microarrays using Agilent's recommended hybridization chamber and oven. Subsequently, the microarrays were washed once with 6 × sodium chloride, sodium hydrogen phosphate, EDTA (SSPE) buffer containing 0.005% N-lauroylsarcosine for 1 min followed by a second wash with 0.06 × SSPE containing 0.005% N-lauroylsarcosine for 1 min and a final wash step with acetonitrile for 30 s. All washing steps were performed at room temperature. Fluorescence signals of the hybridized Agilent Oligo Microarrays were detected using Agilent's DNA microarray scanner (Agilent Technologies). Each sample was compared to a common reference mRNA, which was derived from the pool of all analyzed samples, on two different microarrays using a dye-swap setup to compensate for dye-specific artifacts.
Images and data analysis
Agilent Feature Extraction Software was used to read and process the microarray image files. The software determines feature intensities and ratios (including background subtraction and normalization), rejects outliners, and calculates statistical confidence (p-values). For determination of differential gene expression, Feature Extraction Software-derived output data files were further analyzed using Rosetta Resolver® gene expression data analysis system (Rosetta Biosoftware, Seattle, WA). The raw data sets derived from two corresponding dye-swap experiments were combined and observed as double-log scatter plot. The discriminatory genes analysis was performed using analysis of variance (ANOVA), which was based on F-distribution as well as permutation using the standard Bonferroni correction. Genes with weak statistical support (p > 0.001) and low fold-changes (less than ± 1.7-fold) were discarded.
Pathway analysis
For pathway analysis, two separate gene lists (one comprising upregulated and the other downregulated) were generated for 24 h treatment. The genes were classified according to Gene Ontology with roles in biological process and molecular function. The top discriminatory genes from both lists were selected based on p-values as calculated by ANOVA based on F-distribution and permutation using the standard Bonferroni correction for multiple testing. Further analysis was performed using PathwayArchitect software for searching common regulatory molecules (Stratagene, La Jolla, CA).
Real-time PCR
To confirm the differentially expressed genes identified by the microarray analysis, selected genes were analyzed in triplicates by real-time PCR using RNA obtained from four independent donor samples. Briefly, 0.5 μg of total RNA isolated from the preconditioned cells was converted to cDNA in the presence of reverse transcriptase, random primers, and RNAse inhibitor (as described above). Quantification of the relative mRNA expression was performed using Assays-on Demand™ TaqMan gene expression assays (Applied Biosystems, Foster City, CA). The reaction was performed in triplicates using 50 ng of cDNA, TaqMan Universal PCR Master Mix, No AmpErase UNG, primers, and probes. The optimized cycling condition was as follows: 50°C for 2 min, 95°C for 10 min, followed by 40 cycles of 95°C for 15 s and 60°C for 1 min. The signals were detected by ABI Prism 7700 Sequence Detection System and the cycle threshold values were calculated. The relative quantitation of gene expression in terms of fold changes was calculated using 2−ΔΔCt method. 39 All calculations were normalized using actin gene as the housekeeping reference control.
Results
Quality assessment of the isolated CD133+ cells
To ensure the validity and reproducibility of the microarray data, the purity of the isolated CD133+ cells was assessed by flow cytometry. The amount of CD133+ cells isolated from the mononuclear fraction of the BM fraction ranged from 0.1% to 3%. Of the magnetically enriched CD133+ cells from the three independent BM samples, a high percentage of cells co-express CD133 and CD34 antigen with a mean value of 92.9 ± 1.3%, whereas a smaller population of 3.5 ± 0.8% express CD133 but not CD34 (Fig. 1).
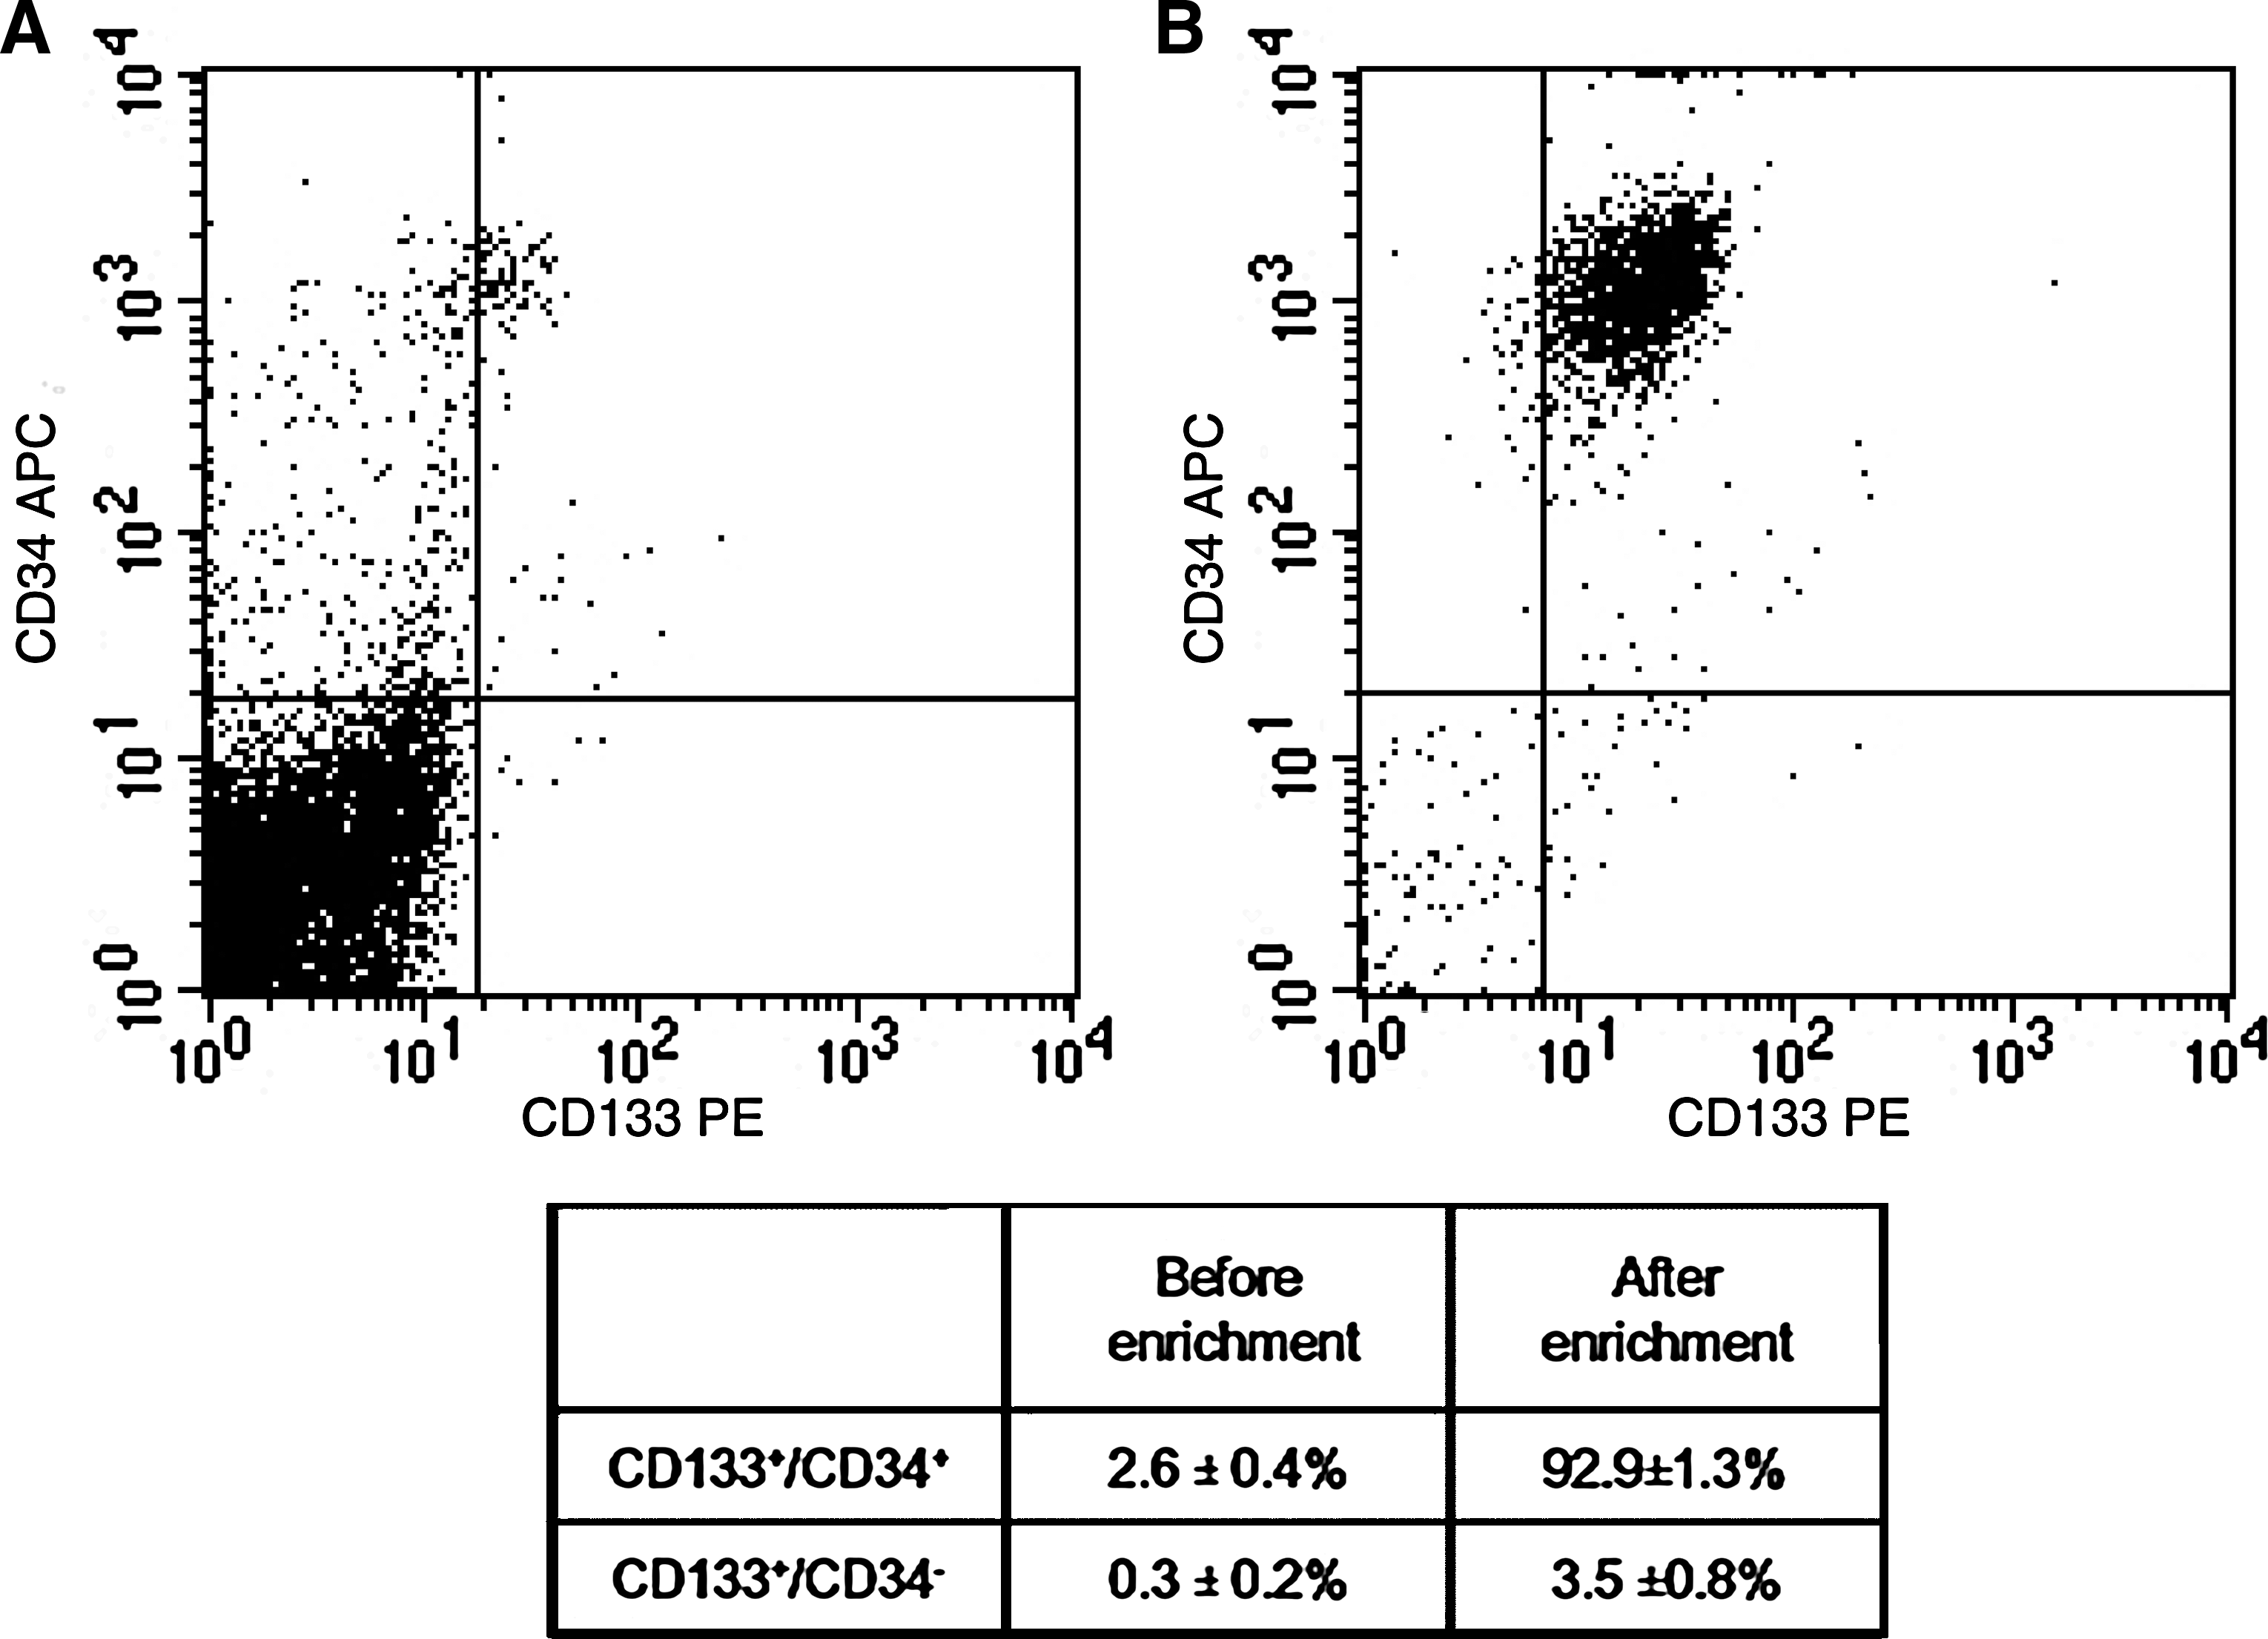
Assessment of CD133+ cell purity by flow cytometry. After positive immunomagnetic selection of CD133+ cells, cells were stained with PE-conjugated CD133 antibody and APC-conjugated CD34 antibody before flow cytometry analysis. Results from a representative experiment were shown. Dot plot of cells before (
Preconditioning did not increase the differentiation potential of CD133+ cells into hematopoietic lineages
Hypoxic preconditioning has shown to play an important role in fetal development and cell differentiation. 30 First, we assessed the hematopoietic differentiation potential of the treated CD133+ cells by CFU assay. After preconditioning, more than 95% of the CD133+ cells were viable and did not show significant differences in terms of cell morphology among the four groups (Fig. 2A).

Characterization of CD133+ cells after hypoxic treatment. (
The treated cells from three independent donors were harvested and plated at cell density of 6000 cells per dish in semisolid methylcellulose medium supplemented with growth factors. After culturing for 16 days, the colonies were evaluated based on the growth of CFU-E and CFU-GEMM, respectively. There are no significant differences in CFU-E and CFU-GEMM formation among treated and nontreated groups (p > 0.05) (Fig. 2B). The results showed that hypoxia does not increase the differentiation potential of CD133+ cells into hematopoietic lineages. After hypoxic treatment, both BM CD133+ cells and umbilical cord blood CD133+ cells 35 showed no apparent loss of viability. Hypoxic treatment can increase the myeloid clonogenic ability of umbilical cord blood CD133+ cells. 35 However, it could not increase the differentiation of potential of BM CD133+ cells into hematopoietic lineages.
Hypoxic/normoxic preconditioning enhances CD133+ cells differentiation toward endothelial lineage
We next investigated the angiogenic differentiation potential of the preconditioned CD133+ cells. The treated cells were cultured for 25 days in semisolid methylcellulose medium supplemented with fetal calf serum and a cocktail of growth factors such as VEGF, fibroblast growth factor, stem cell factor, insulin-like growth factor-1, IL-3, EGF, and heparin. The CFU-EC colonies formed typically contain spindle-shaped cells radiating from a central core containing rounded cells (Fig. 3A, panel i). After dislodging from the colony and re-plating onto fibronectin-coated plate, a monolayer of differentiated endothelial-like cells with typical cobblestone morphology was observed (Fig. 3A, panel ii).

Endothelial differentiation potential of hypoxic-treated CD133+ cells. (
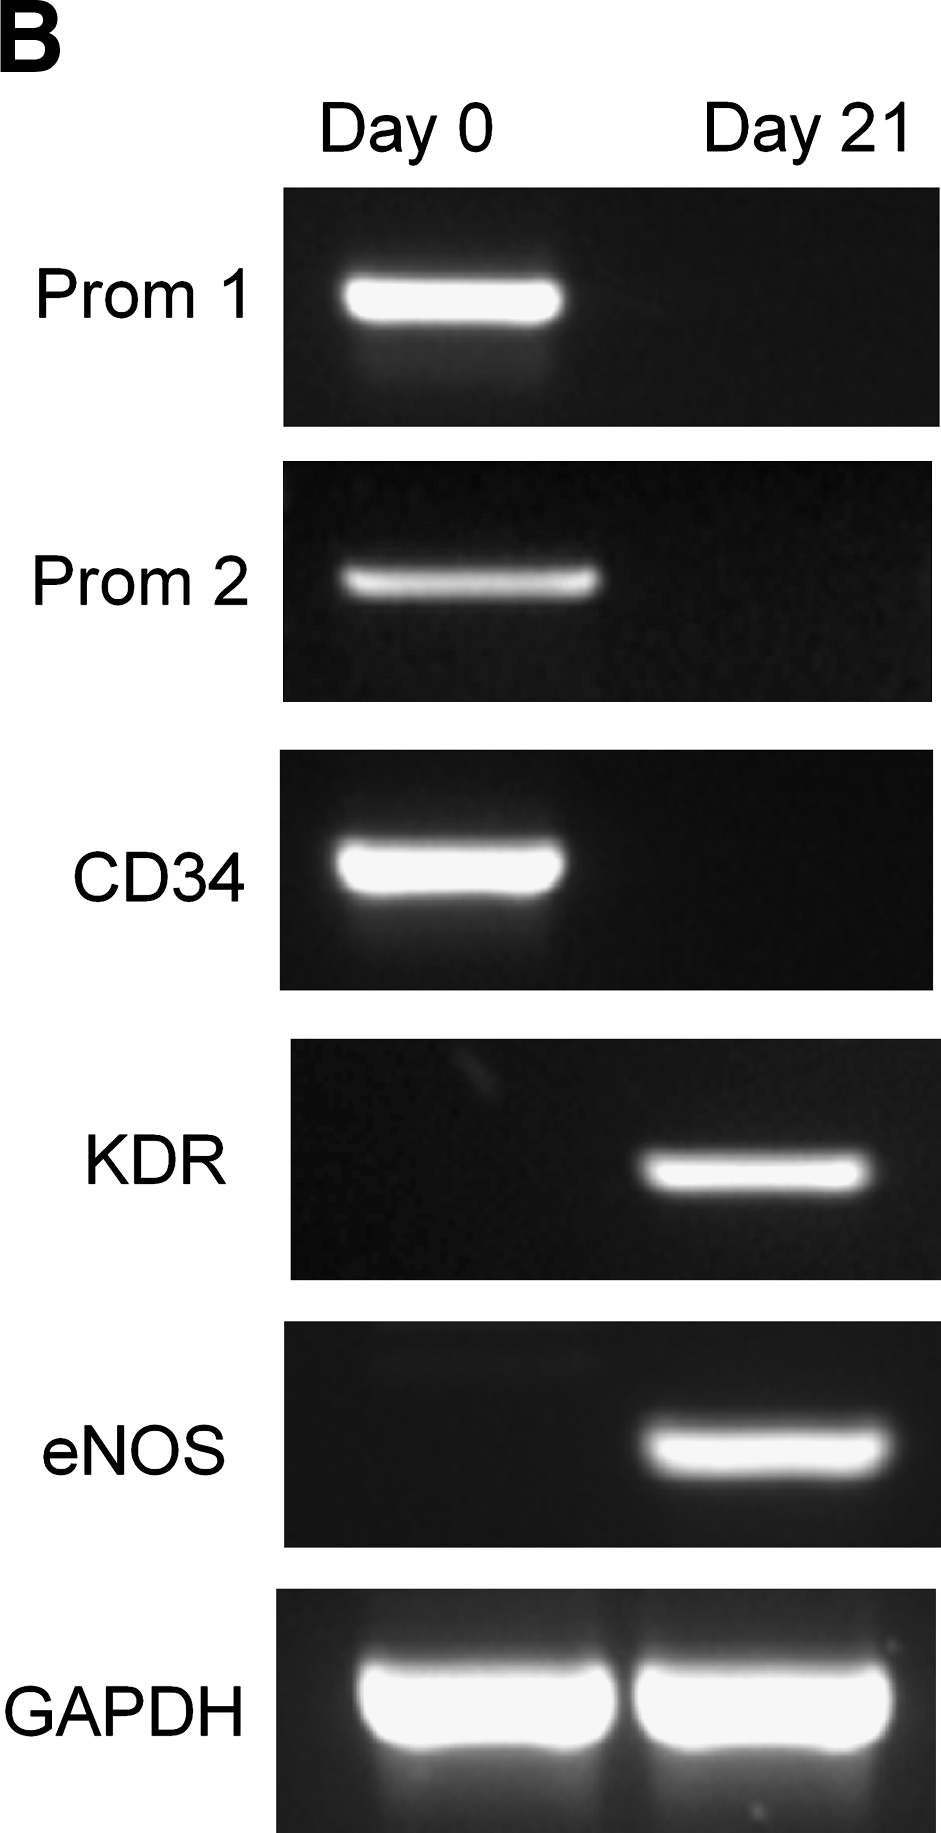

To validate the cell surface antigen expression, the mRNA expression profile of freshly isolated and differentiated CD133+ was compared. Expression of primitive hematopoietic stem cell surface markers such as Prominin-1 (also referred as CD133 gene), Prominin-2 (structurally similar to CD133), and CD34 (co-expressing antigen on CD133+ cells) mRNAs was diminished after differentiation (Fig. 3B). On the other hand, expression of specific endothelial gene markers KDR and eNOS was found after differentiation (Fig. 3B).
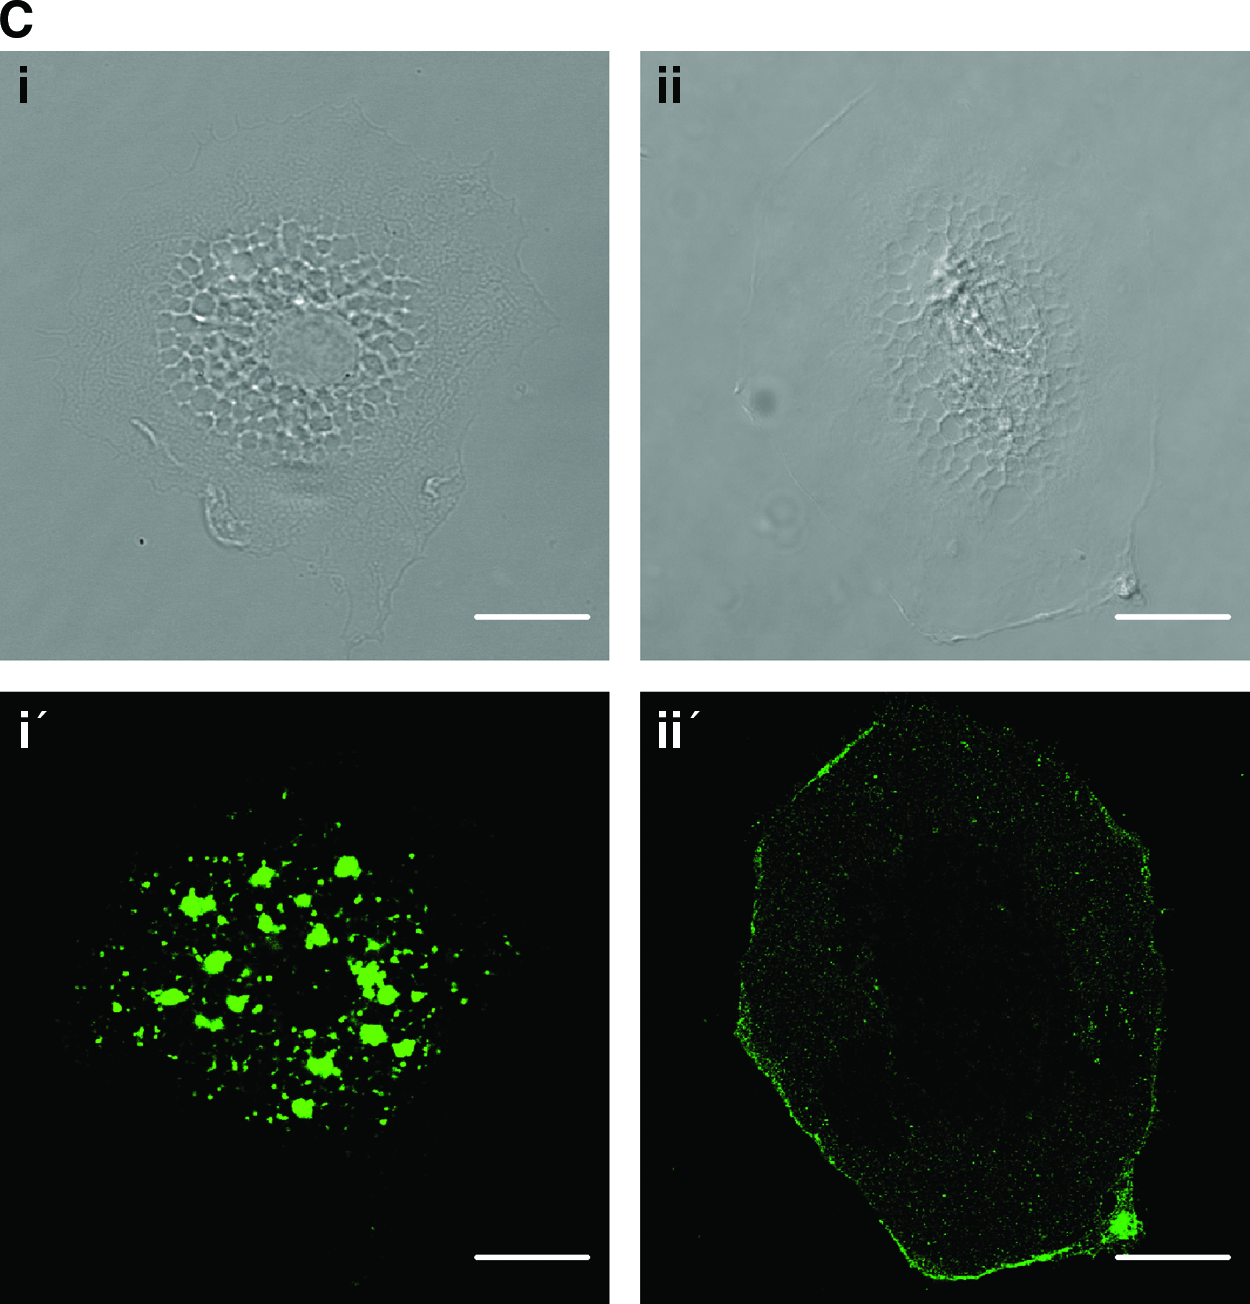
Further, the differentiated cells acquired the functional phenotype of ECs by the ability to uptake acetylated low-density lipoprotein (Fig. 3C, panels i and i′), and the differentiated cells were stained positive for CD31 (Fig. 3C, panels ii and ii′), which are endothelial-specific surface markers.
To compare quantitatively the angiogenic differentiation potential upon preconditioning, we seeded 10,000 treated cells per dish and counted the number of colonies formed after 25 days. There was a significant increase (p < 0.005) in number of CFU-EC colonies formed after 24 h (143.2 ± 8.0%) hypoxic treatment compared to normoxic treatment (normalized to 100 ± 11.4%) (Fig. 3D). The results demonstrated that hypoxic/normoxic preconditioning CD133+ cells could enhance the CFU-EC colony formation that could be explained by a paracrine regulatory mechanism.40,41
Reproducibility of microarray experiment
To identify the change in gene signature of the CD133+ cells after hypoxic/normoxic treatment, we analyzed the transcription profile of the treated cells using microarray analysis. The integrity of the total RNA was confirmed by electrophoretic separation on the Agilent Bioanalyzer platform. The labeled cDNAs were hybridized on whole human genome oligo microarray containing 41,000 unique genes and transcripts. The reproducibility of the microarray experiment was ensured with the use of RNAs prepared from three independent donors, and the possibility of dye bias limitation in dual-labeled spotted cDNA microarrays is minimized with the inclusion of dye-swap experiments.
The raw data were preprocessed by first removing genes with weak statistical support compared with the common reference control (p > 0.001) and followed genes that have low fold-changes (less than ± 1.7-fold) expressed in two or more patient samples. Despite considerable diversity in genetic background and age of three patients (two aged 67 years and one aged 77 years), gene expression among the three donors showed a high degree of similarity. The patient samples that had been treated correlate well among all three donors with a mean correlation coefficient of 0.7 ± 0.012. Further the high-level similarity of gene expression from the three patients could also be seen from relative expression of hypoxia/normoxia-regulated angiogenic-related genes as listed in Supplemental Table S1 (available online at
Genes differentially expressed after hypoxic/normoxic treatment
To investigate if the hypoxic treatments can modulate differential gene expression in CD133+ cells, we first tabulated the significant signals from each treatment samples versus the reference control in scatter plot. It suggests that the treatment led to the changes of gene expression of CD133+ cells from three different donors (Fig. 4A).

Gene expression microarray analysis of hypoxic-treated CD133+ cells. (
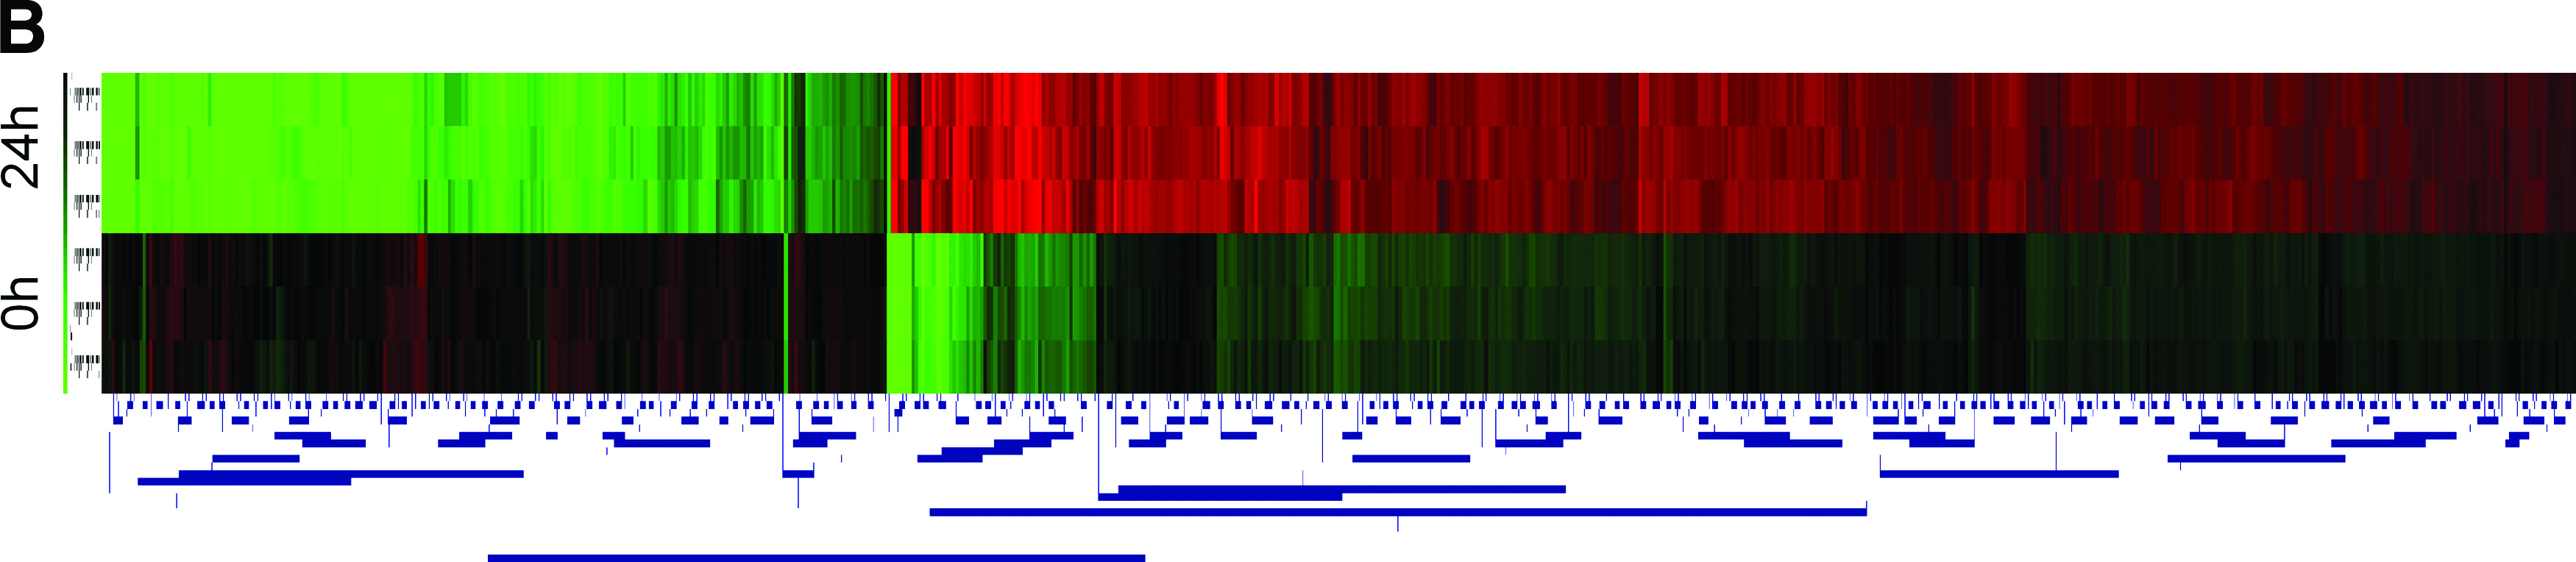


Next, the primary filtered datasets were subjected to a hierarchical clustering analysis using Euclidean distance metric and average linkage clustering. A total of 26,000 genes were obtained after elimination of genes with missing signals. This was followed by a discriminatory gene analysis using ANOVA based on F-distribution and permutation using the standard Bonferroni correction to identify genes differentially expressed. A common list of 730 genes was deduced based from both methods. As shown in Figure 4B, the heat maps suggest that the treatment of CD133+ cells for 24 h has strong effect on gene expression.
Gene ontology classification of the regulated genes
To expand our understanding of the underlying molecular mechanism after hypoxic preconditioning, we performed classification of the enriched genes based on their function using gene ontology terms. The hierarchical clustering of the 730 genes revealed a cluster of 232 downregulated (mean log2 ratio of −2.5, p < 0.005) and 498 upregulated (mean log2 ratio of 1.43, p < 0.005) genes that were analyzed separately using Gene Ontology Tree Machine (
The results demonstrated that the 232 downregulated genes were involved in biological processes such as nucleic acid metabolism (11%), physiological process (7%), transcription and translation (4.8%), signal transduction (3.5%), protein localization (3.1%), metabolism (2.6%), DNA replication (2.2%), and cell cycle (1.3%). The remaining genes are associated with cellular cytoplasmic component (6.1%) and membrane component (3.1%), and 55.3% of genes were with unknown function (Fig. 4C). In contrast, the 498 upregulated genes were mainly involved in biological processes such as signal transduction (12.4%), transcription (4.3%), metabolism (5.3%), cell differentiation (5.3%), development (3.3%), cell communication/cell–cell signaling (3.3%), cell proliferation and angiogenesis (1.8%), physiological processes (3.1%), and morphogenesis (2.2%). The remaining genes were categorized into cytoplasmic component (3.7%), membrane component (9.8%), and unknown (45.5%) categories (Fig. 4D).
Hypoxia/normoxia regulate angiogenic related genes
Our data revealed that the hypoxic treatment for 24 h upregulated expression of genes that are involved in cell differentiation. These include CCIN, CD4, FBLN1, GGNBP1, LECT1, METRNL, NEUROG1, NPM2, PLG, SPINK5, SPRR1A, SPRR2C, STMN2, and THEG. Of particular interest are the angiogenic genes like ERBB2, EDG5, FGF3, FHF2, GDF15, JUN, L1CAM, NRG1, and NGFR. Further, angiogenic growth factor genes like PGFBP1 and PDGFB, angiogenic cytokine and chemokine genes, including CCL15, CXCL12, CXCL6, IL-6, and PTN, angiogenic-positive regulatory gene such as EREG were upregulated. On the other hand, angiogenesis inhibitors and related genes, including IL12A, MLLT7, STAB1, and TIMP2, are downregulated. Taken together, the array and CFU-EC data show gene expression patterns on endothelial differentiation pathway. The details of the gene expression are listed in Supplemental Table S1.
Confirmation of gene expression by real-time PCR
To corroborate the gene expression profile from the microarray analysis, we surveyed the expression levels of selected genes by quantitative real-time PCR. As shown in Figure 5, ARID3A and MAG mRNA levels increased, whereas RTN3 and DDX10 decreased with 24 h hypoxic treatment. As listed in Supplemental Table S2 (available online at
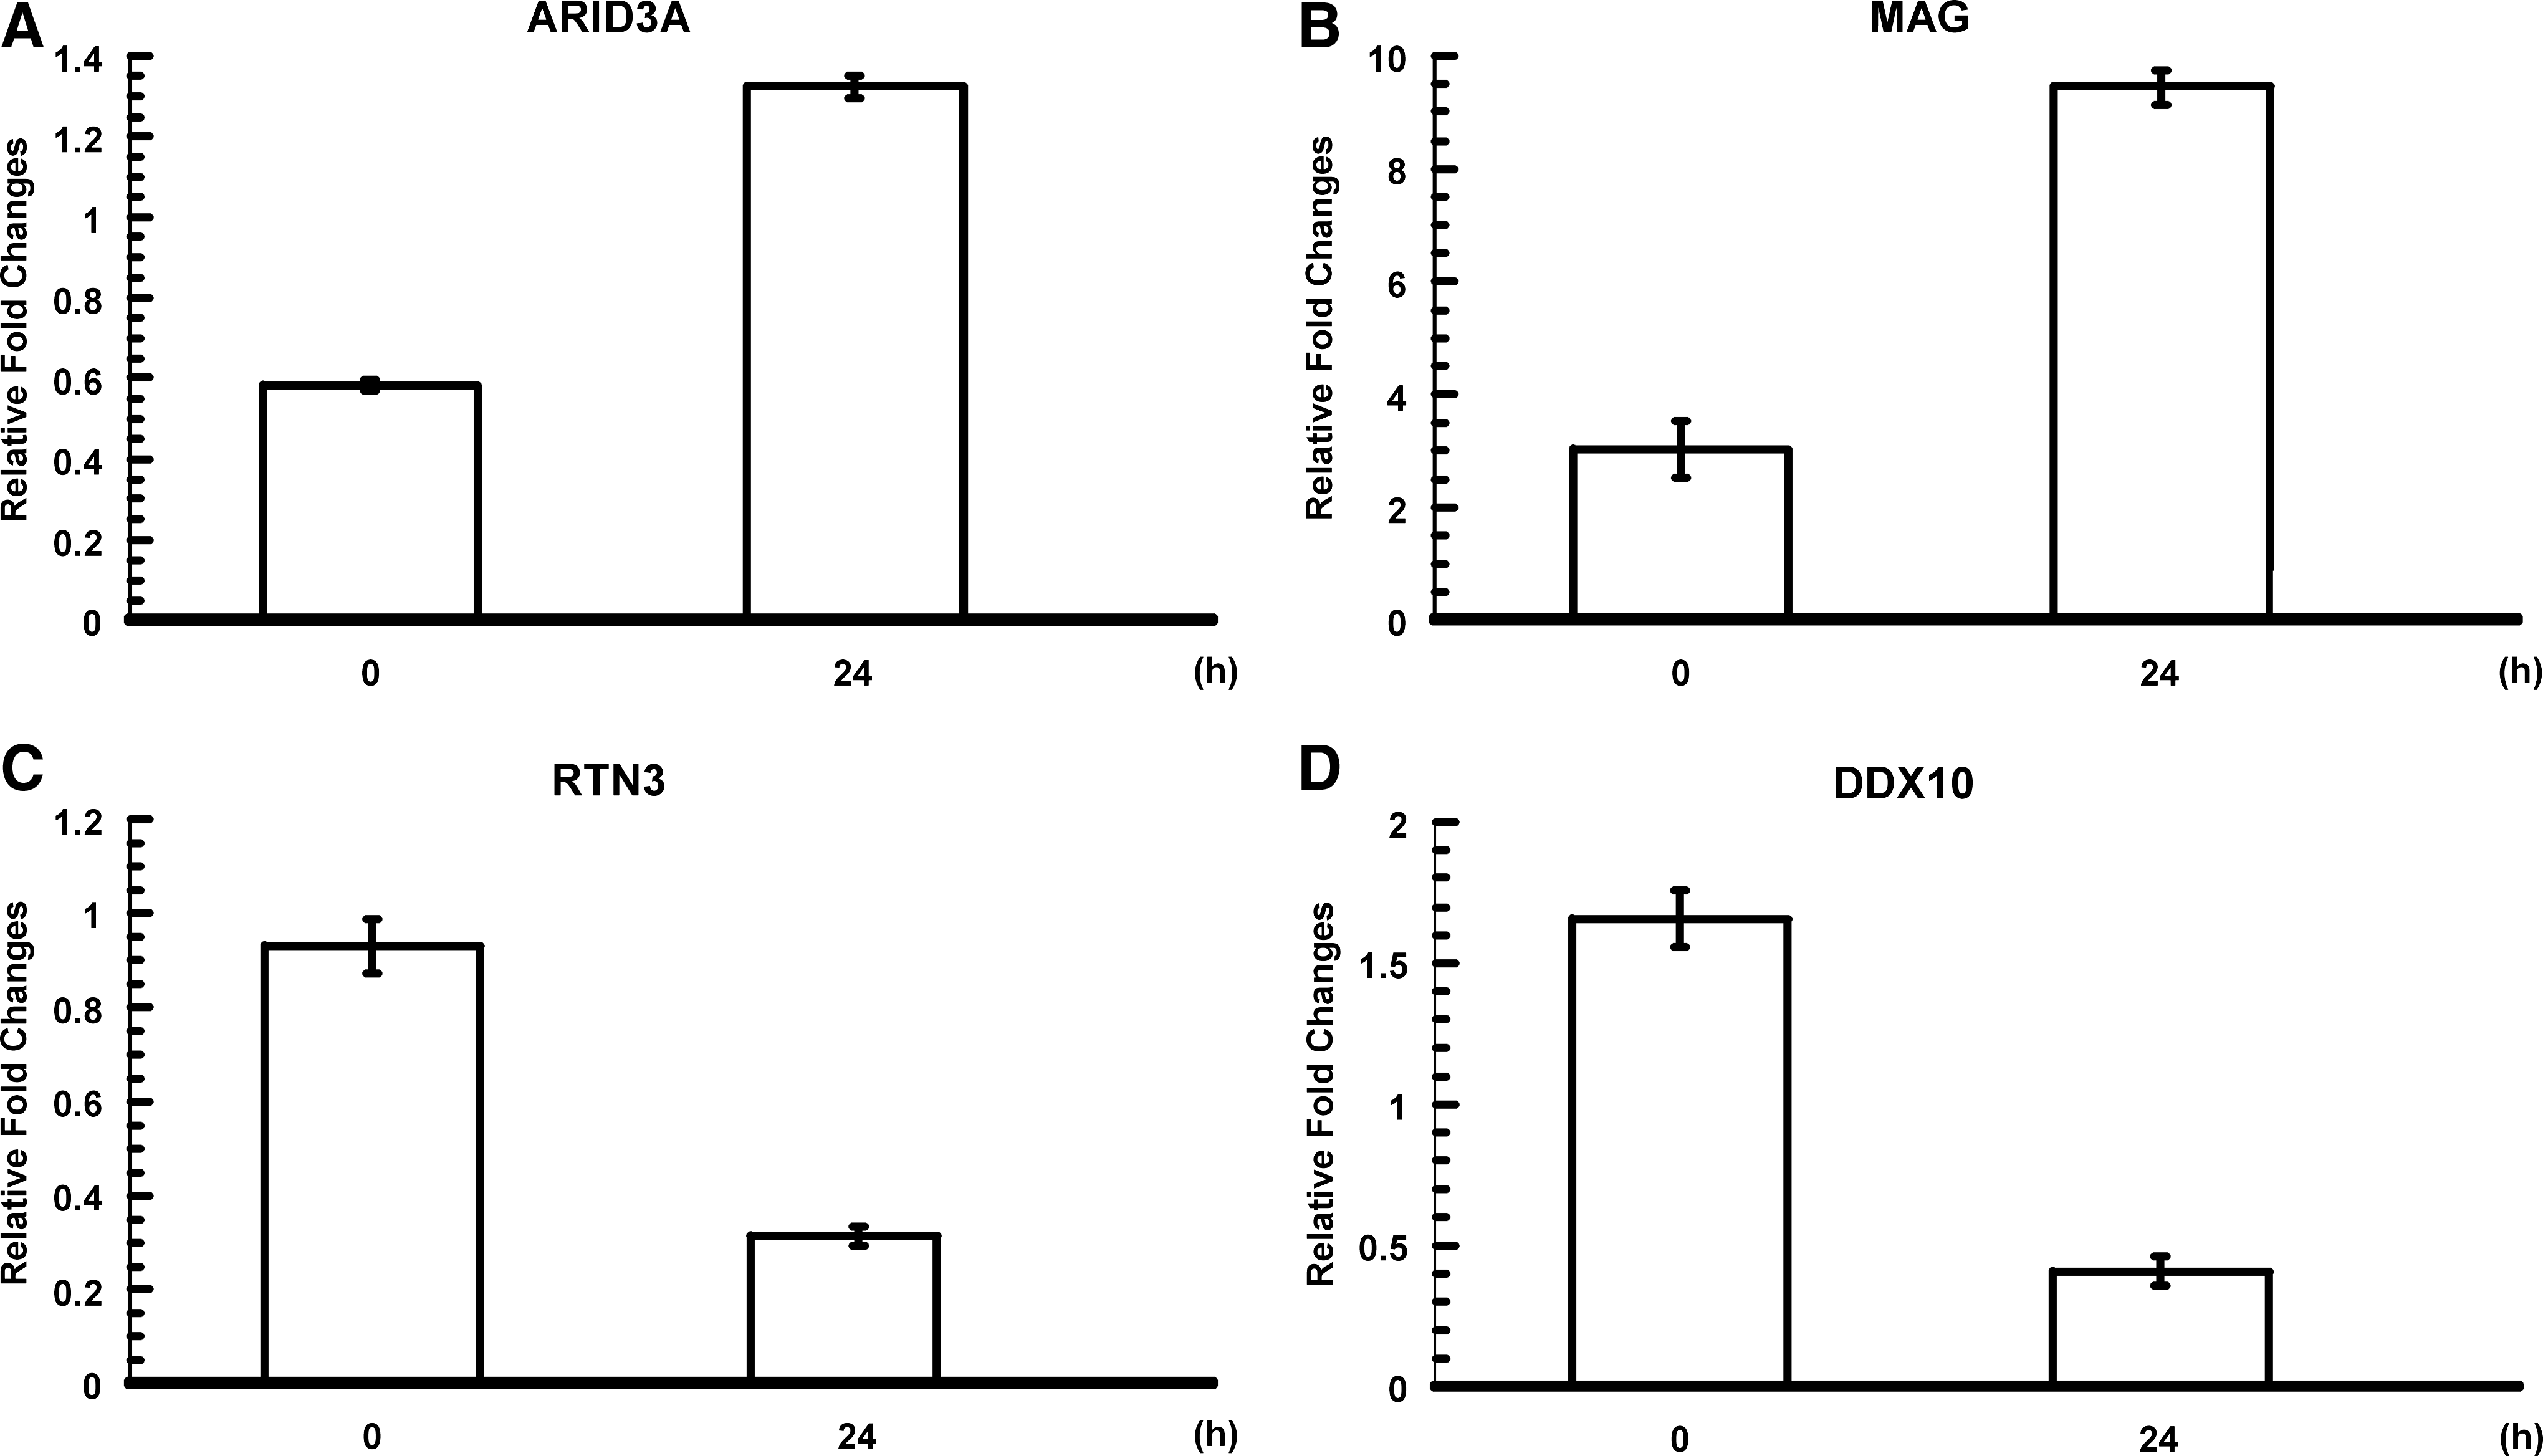
Validation using real-time reverse transcription polymerase chain reaction of selected genes. Upregulation of ARID3A (
Discussion
There is increasing evidence indicating that hypoxia may control the differentiation fate of the hemangioblast into endothelial or hematopoietic lineages. 48 In this study, we showed that hypoxic preconditioning of CD133+ cells did not increase the differentiation potential of CD133+ cells into hematopoietic lineages, but enhanced CD133+ cells differentiation toward endothelial lineage. Further, we performed a whole genome gene expression analysis of hypoxic/normoxic preconditioned human BM CD133+ cells. We showed that a large number of angiogenic genes were differentially expressed after hypoxic pretreatment. Angiogenic differentiation potential predicated from gene array analysis was further confirmed with surface marker analysis, functional phenotype analysis, and CFU-EC analysis.
To date, there are several reports on the gene profiling of CD133+ cells but is limited to CD 133+ cells from umbilical cord blood.35,49–52 Our report is the first gene profiling of BM CD133+ cells, which will be of more clinical relevance since such cell source have been used for therapeutic applications in human clinical studies.12–16 Our study showed that hypoxic treatment regulated genes related to metabolism, signal transduction, transcription, cell proliferation, and development categories. This result is consistent with a recent comparison report of gene expression profiling of human cord blood CD133+ with cultured BM mesenchymal stem cells in response to hypoxia. 35
Particularly, the treatment upregulates angiogenic genes like ERBB2, EDG5, FGF3, FHF2, GDF15, IL-6, JUN, L1CAM, NRG1, NGFR, and PDGFB. ERBB2 encodes a transmembrane glycoprotein with tyrosine kinase specific activity that was identified to be involved in angiogenesis. 53 Overexpression of ERBB2 suppresses the transcription of anti-angiogenic factors (e.g., SPARC, TIMP3, and SERPINF1) but induces expression of angiogenic factors (e.g., KLF5, TNFAIP2, and SEMA3C). The critical role of the ERBB receptor family in angiogenesis and the requirement of ERBB2 in cardiac development have been demonstrated.54,55 ERBB2 is involved in the upstream of the EGF signaling pathway in which angiogenesis can be upregulated by activation of Ras and Raf, which lead to increase in activator protein-1 (AP-1) activity. The increase in AP-1 activity results in the transcription of genes comprising of VEGF and IL-8. 56 EDG5 has shown to be an essential inducer of pathological neovascularization in mouse retina. 57 The proliferation of ECs and neovascularization was observed in athymic nude mice injected with NIH3T3 transformed with FGF3. 58 GDF15 (also known as MIC-1, PLAB, and NAG-1) is a differentiation factor in which has been identified previously as a gene induced by anoxia in a hypoxia-inducible factor (HIF)–independent manner and also found it to be regulated in a HIF-independent manner in Hep3B cells. 59 Similarly, IL-6 was induced by hypoxia in vascular cells and shown to stimulate circulating blood-derived endothelial progenitor cell angiogenesis in vitro.60,61 IL-6 is a potent pro-angiogenic cytokine influencing cell growth and differentiation. 62 Early studies have shown that IL-6 promotes matrix metalloproteinase 9 activation that can induce release of VEGF from culture endothelial and tumor cells.63,64 In addition, IL-6 could stimulate endothelial progenitor cell proliferation, migration, and enhance tube formation in Matrigel in vitro. 60 Overexpression of IL-6 enhances cell survival and growth. 65 Our biological interaction network data demonstrated that IL-6 can interact with IL-8, which is also a potent angiogenic factor. 66 IL-6 can regulate angiogenesis through mediating the JAK/STAT3 signaling pathway and binding to SHC1 and GRB2, which can regulate the EGF receptor activity and is involved in differentiation in Ras-dependent manner.67,68 Under hypoxic stress, IL-6 may regulate PTK2B, which has shown to be responsive to stress and can activate downstream kinase signaling pathway. 69 In addition, IL-6 also regulates anti-apoptotic protein such as AKT1 and BCL2, thereby increasing the survival rate of the CD133+ cells during the hypoxic condition.70–72 The DNAenzymes targeting c-JUN inhibit solid tumor growth and angiogenesis. 73 The heterophilic interaction between L1CAM and alphabeta3-integrin showed to induce HUVEC process extension in vitro and angiogenesis in vivo. 74 NRG1 signaling mediate HIF1-alpha-induced VEGF production and tumor angiogenesis. 75 Both FHF2 and PDGFB are potent angiogenic factors that can interact directly with high affinity in vitro, but angiogenesis is not observed under normal conditions. Neo-angiogenesis processes are activated only under specific stimuli such as ischemia, wound healing, and cancer growth. 76 Further, angiogenic growth factor genes, angiogenic cytokine and chemokine genes, as well as angiogenic-positive regulatory genes were also upregulated, whereas angiogenesis inhibitors and related genes were downregulated, which may also prompt the differentiation of CD133+ cells into endothelial lineage. Taken together, hypoxic/normoxic-treated CD133+ cells showed gene expression patterns toward the endothelial lineage differentiation.
Conclusion
In summary, hypoxic preconditioning enhanced CD133+ cell differentiation toward endothelial lineage. Future animal studies will be beneficial to validate the deduced molecular mechanism and contribute intriguing knowledge to the current clinical trial studies.
Footnotes
Acknowledgments
This work was supported by German Federal Ministry of Education and Research, BioChancePlus Program (0313191), Sonderforschungsbereich/Transregio 37, B5, B2, and A4, German Helmholtz Association, Mecklenburg-Vorpommern (Nachwuchsgruppe Regenerative Medizin Regulation der Stammzellmigration 0402710). The authors wish to thank Jan Schäferkordt and Corinna Scholz from Miltenyi Biotec for their assistance in gene array analysis and Ms. Margit Fritsche for her technical assistance.
Disclosure Statement
No competing financial interests exist.
References
Supplementary Material
Please find the following supplemental material available below.
For Open Access articles published under a Creative Commons License, all supplemental material carries the same license as the article it is associated with.
For non-Open Access articles published, all supplemental material carries a non-exclusive license, and permission requests for re-use of supplemental material or any part of supplemental material shall be sent directly to the copyright owner as specified in the copyright notice associated with the article.